
Abstract
Objective
We aimed to evaluate the diagnostic utility of 3.0-T magnetic resonance (MR) diffusion-weighted imaging (DWI)-derived apparent diffusion coefficient (ADC) values in conjunction with clinical indices for prostate cancer (PCa).
Methods
A retrospective analysis was conducted on the clinical data of 181 patients with suspected PCa who underwent MR DWI prior to biopsy at LuHe Hospital, Beijing, between February 2022 and July 2023. Patients were placed into Malignancy and Benign groups according to the biopsy results. Univariate and multivariate analyses were performed on the ADC values and clinical indicators, and then a combination predictive model was developed. The model’s diagnostic accuracy was assessed using receiver operating characteristic (ROC) curve and decision curves analysis (DCA), and a nomogram was constructed for the assessment of individual risk.
Results
The ADC value and the free prostate-specific antigen and total prostate-specific antigen (tPSA) levels were found to be independent predictors of PCa. tPSA showed the best diagnostic performance, with an area under the curve (AUC) of 0.914. However, the combined model had a higher diagnostic accuracy, with an AUC of 0.959.
Conclusion
The combined model has superior predictive performance to other diagnostic methods and should help with the avoidance of unnecessary prostate biopsies.
Keywords
Background
Prostate cancer (PCa) is the second most common malignant tumor in men worldwide, 1 constituting approximately 15% of all cancer diagnoses. 2 The incidence of PCa is significantly higher in European and American populations than in Asia, but a marked increase has been identified across Asia in recent years. 3 Early detection is paramount for effective treatment planning and to give an accurate prognosis for patients with PCa. Factors such as age, body mass index (BMI), prostate volume (PV), and prostate-specific antigen (PSA) levels have been identified to be significant predictors of PCa.4–7 However, a comprehensive evaluation of these risk factors is vital to improve diagnostic precision and facilitate personalized clinical management.
Diffusion-weighted imaging (DWI), a highly sensitive and specific functional magnetic resonance imaging (MRI) sequence, plays a crucial role in the diagnosis of PCa. 8 The DWI technique permits the quantitative assessment of the diffusion of water in various tissues by calculating the apparent diffusion coefficient (ADC), thereby enabling the detection of the abnormalities in cellular density that are associated with malignant tumors. 9 Although various predictive models based on clinical indices have been developed in institutions in other countries for the diagnosis of PCa, their applicability to Chinese people remains uncertain, owing to ethnicity-related differences. 10 Although the use of ADC values as radiologic biomarkers of PCa has been proposed, the integration of ADC with other clinical indices to improve diagnostic efficacy has not been explored in detail.
To address this deficiency, we aimed to explore the relationships of the ADC value and six clinical indices, including age, BMI, free prostate-specific antigen (fPSA), total prostate-specific antigen (tPSA), and PV, with PCa, with the intention of developing a predictive model that would improve the diagnosis and monitoring of PCa in Chinese people, by taking into account potential ethnic variations in disease presentation and progression. 11
Material and methods
Clinical data
We performed a retrospective study of data collected for patients suspected of having PCa between February 2022 and July 2023 at the hospital. The study is reported in compliance with the STROBE guidelines. 12 The study was performed according to the principles of the Declaration of Helsinki and was approved by the Medical Ethics Committee of Beijing Luhe Hospital, Capital Medical University (approval number: 2024-LHKY-039-01). Because it was a retrospective study, the requirement for informed consent was waived. We de-identified the data for all the patients.
Inclusion criteria
The inclusion criteria were as follows: (1) a diagnosis of prostatic disease, according to the established “Guidelines for Diagnosis and Treatment of Prostate Diseases”, and confirmation by examination during surgery or via pathologic examination of a biopsy at the hospital; (2) the performance of a high b-value DWI assessment using 3.0-T MRI equipment, with interpretation by two experienced radiologists; (3) age >18 years; (4) no history of previous prostatic surgery; (5) no history of pelvic radiotherapy or chemotherapy; (6) no prior prostatic massage therapy; and (7) availability of a complete set of relevant clinical data.
Exclusion criteria
The exclusion criteria were as follows: (1) a history of neurogenic bladder disease; (2) concurrent urinary tract infection, urethral stricture, or urinary retention; (3) the presence of urolithiasis; (4) abnormal detrusor muscle function; (5) urinary obstruction of other etiologies; (6) unsuitability for MRI examination, owing to the presence of metal dentures or stents; (7) prostate biopsy conducted within the 3-to-5 days prior to PSA testing; (8) a history of other malignant pelvic tumor; and (9) missing relevant data.
Magnetic resonance imaging
MR procedure
Examinations were performed using a 3.0-T uMR 780 MRI system (Shanghai United Imaging, Shanghai, China) using built-in coils. The patients were instructed to fast for 6 to 8 hours before the procedure. They were placed in a supine position, and the coil was centered 2 cm above the pubic symphysis. The protocol included axial T1-weighted imaging (T1WI), T2-weighted imaging (T2WI), T2WI with fat suppression (T2WI-FS), and both sagittal and coronal T2WI sequences. The parameters used were as follows. T1WI: repetition time/echo time (TR/TE) = 640 ms/11 ms, slice thickness = 4 mm, inter-slice space = 1 mm, matrix size = 320 × 224, field of view (FOV) = 28 × 28 cm, number of excitations (NEX) = 2. T2WI: TR/TE = 3600 ms/100 ms, slice thickness = 4 mm, space = 1 mm, matrix size = 320 × 224, FOV = 28 × 28 cm, NEX = 4. DWI: body coil reception TR/TE = 5000 ms/90 ms, slice thickness = 4 mm, space = 1 mm, matrix size = 96 × 128, FOV = 28 × 28 cm, NEX = 4, b-values = 50 and 1500 s/mm2. ADC maps were automatically generated, with region-of-interest (ROI) areas of 30 to 40 mm2 selected.
MR diagnostic criteria
Two experienced radiologists who were blinded to the study details independently reviewed the MR scans. Discrepancies were resolved through discussion until a consensus was achieved.
ADC measurement
ADC maps were created using Syngo in Workplace software (Siemens, Munich, Germany). Two experienced radiologists created circular ROIs at the corresponding positions of the ADC maps in cancerous regions, based on T2WI-FS and DWI images, in double-blinded fashion. The ROIs, ranging from 30 to 40 mm2 in area, excluded areas of hemorrhage, necrotic areas of lesions observed using T1WI or T2WI, vascular structures, the roots of the seminal vesicles, and areas of calcification. ADC values were measured at three consecutive levels for each lesion, three times per level, and mean values were calculated.
Pathology findings were analyzed alongside the MR features of the prostate cancer, and ADC values were obtained using a high b-value (1500 s/mm2).
Prostate volume (PV) measurement
The dimensions of the prostate were obtained using color Doppler ultrasonography, including the left–right diameter (LRD), anterior–posterior diameter (APD), and superior–inferior diameter (SID). PV was calculated using the following formula: PV = APD × LRD × SID × 0.52.
Body mass index (BMI) calculation
BMI was calculated by dividing the patient’s body mass in kilograms by the square of their height in meters (kg/m2).
Statistical analysis
Data analysis was performed using IBM SPSS version 25.0 (IBM Corp., Armonk, NY, USA). Continuous variables were tested for normal distribution using the Kolmogorov–Smirnov test. Normally distributed continuous data are expressed as mean ± standard deviation and were analyzed using the independent samples t-test. Non-normally distributed continuous data are presented as median and interquartile range and were analyzed using the Mann–Whitney U test. Categorical data are presented as frequencies or percentages and were analyzed accordingly. The diagnostic and predictive value of six clinical parameters for PCa were evaluated using receiver operating characteristic (ROC) curve analysis and univariate and multivariate logistic regression analyses. A nomogram for the prediction of the probability of developing PCa was developed using R version 4.0 (www.r-project.org). DCA curves and calibration curves were also created using R software. The significance level was set at P ≤ 0.05 for all the statistical tests.
Results
Characteristics of the patients
Because there were few missing values and this did not affect the results of the data analysis, the records collected that contained missing values were excluded, leaving 181 patients for enrollment. These patients had a mean age of 73 years (95% confidence interval (CI): 69 to 76 years). Ninety-one were identified as having benign PCa, and these patients had a mean age of 70 (67 to 74) years. The age and serum tPSA and fPSA concentrations of the Malignancy group were significantly higher than those of the Benign group (p < 0.001), whereas the ADC values were significantly lower (p < 0.001). However, there were no differences in the BMI or PV between the groups (Table 1).
Comparison of the baseline data for the groups of patients.

The datasets are summarized as median (interquartile range) and the groups were compared using the Mann–Whitney U test.
ADC, apparent diffusion coefficient; BMI, body mass index; fPSA, free prostate-specific antigen; PV, prostate volume; tPSA, total prostate-specific antigen.
Results of the logistic regression analysis
Univariate logistic regression analysis revealed significant associations of age, ADC, tPSA, and fPSA with the endpoint event (benign vs. malignant tumor) (p < 0.001). Multiple-factor logistic regression analysis demonstrated that ADC, tPSA, and fPSA were independent predictors of the endpoint (benign vs. malignant tumor) (p < 0.05). A decrease in ADC and increases in tPSA and fPSA were associated with a higher likelihood of developing malignancy (Figure 1).
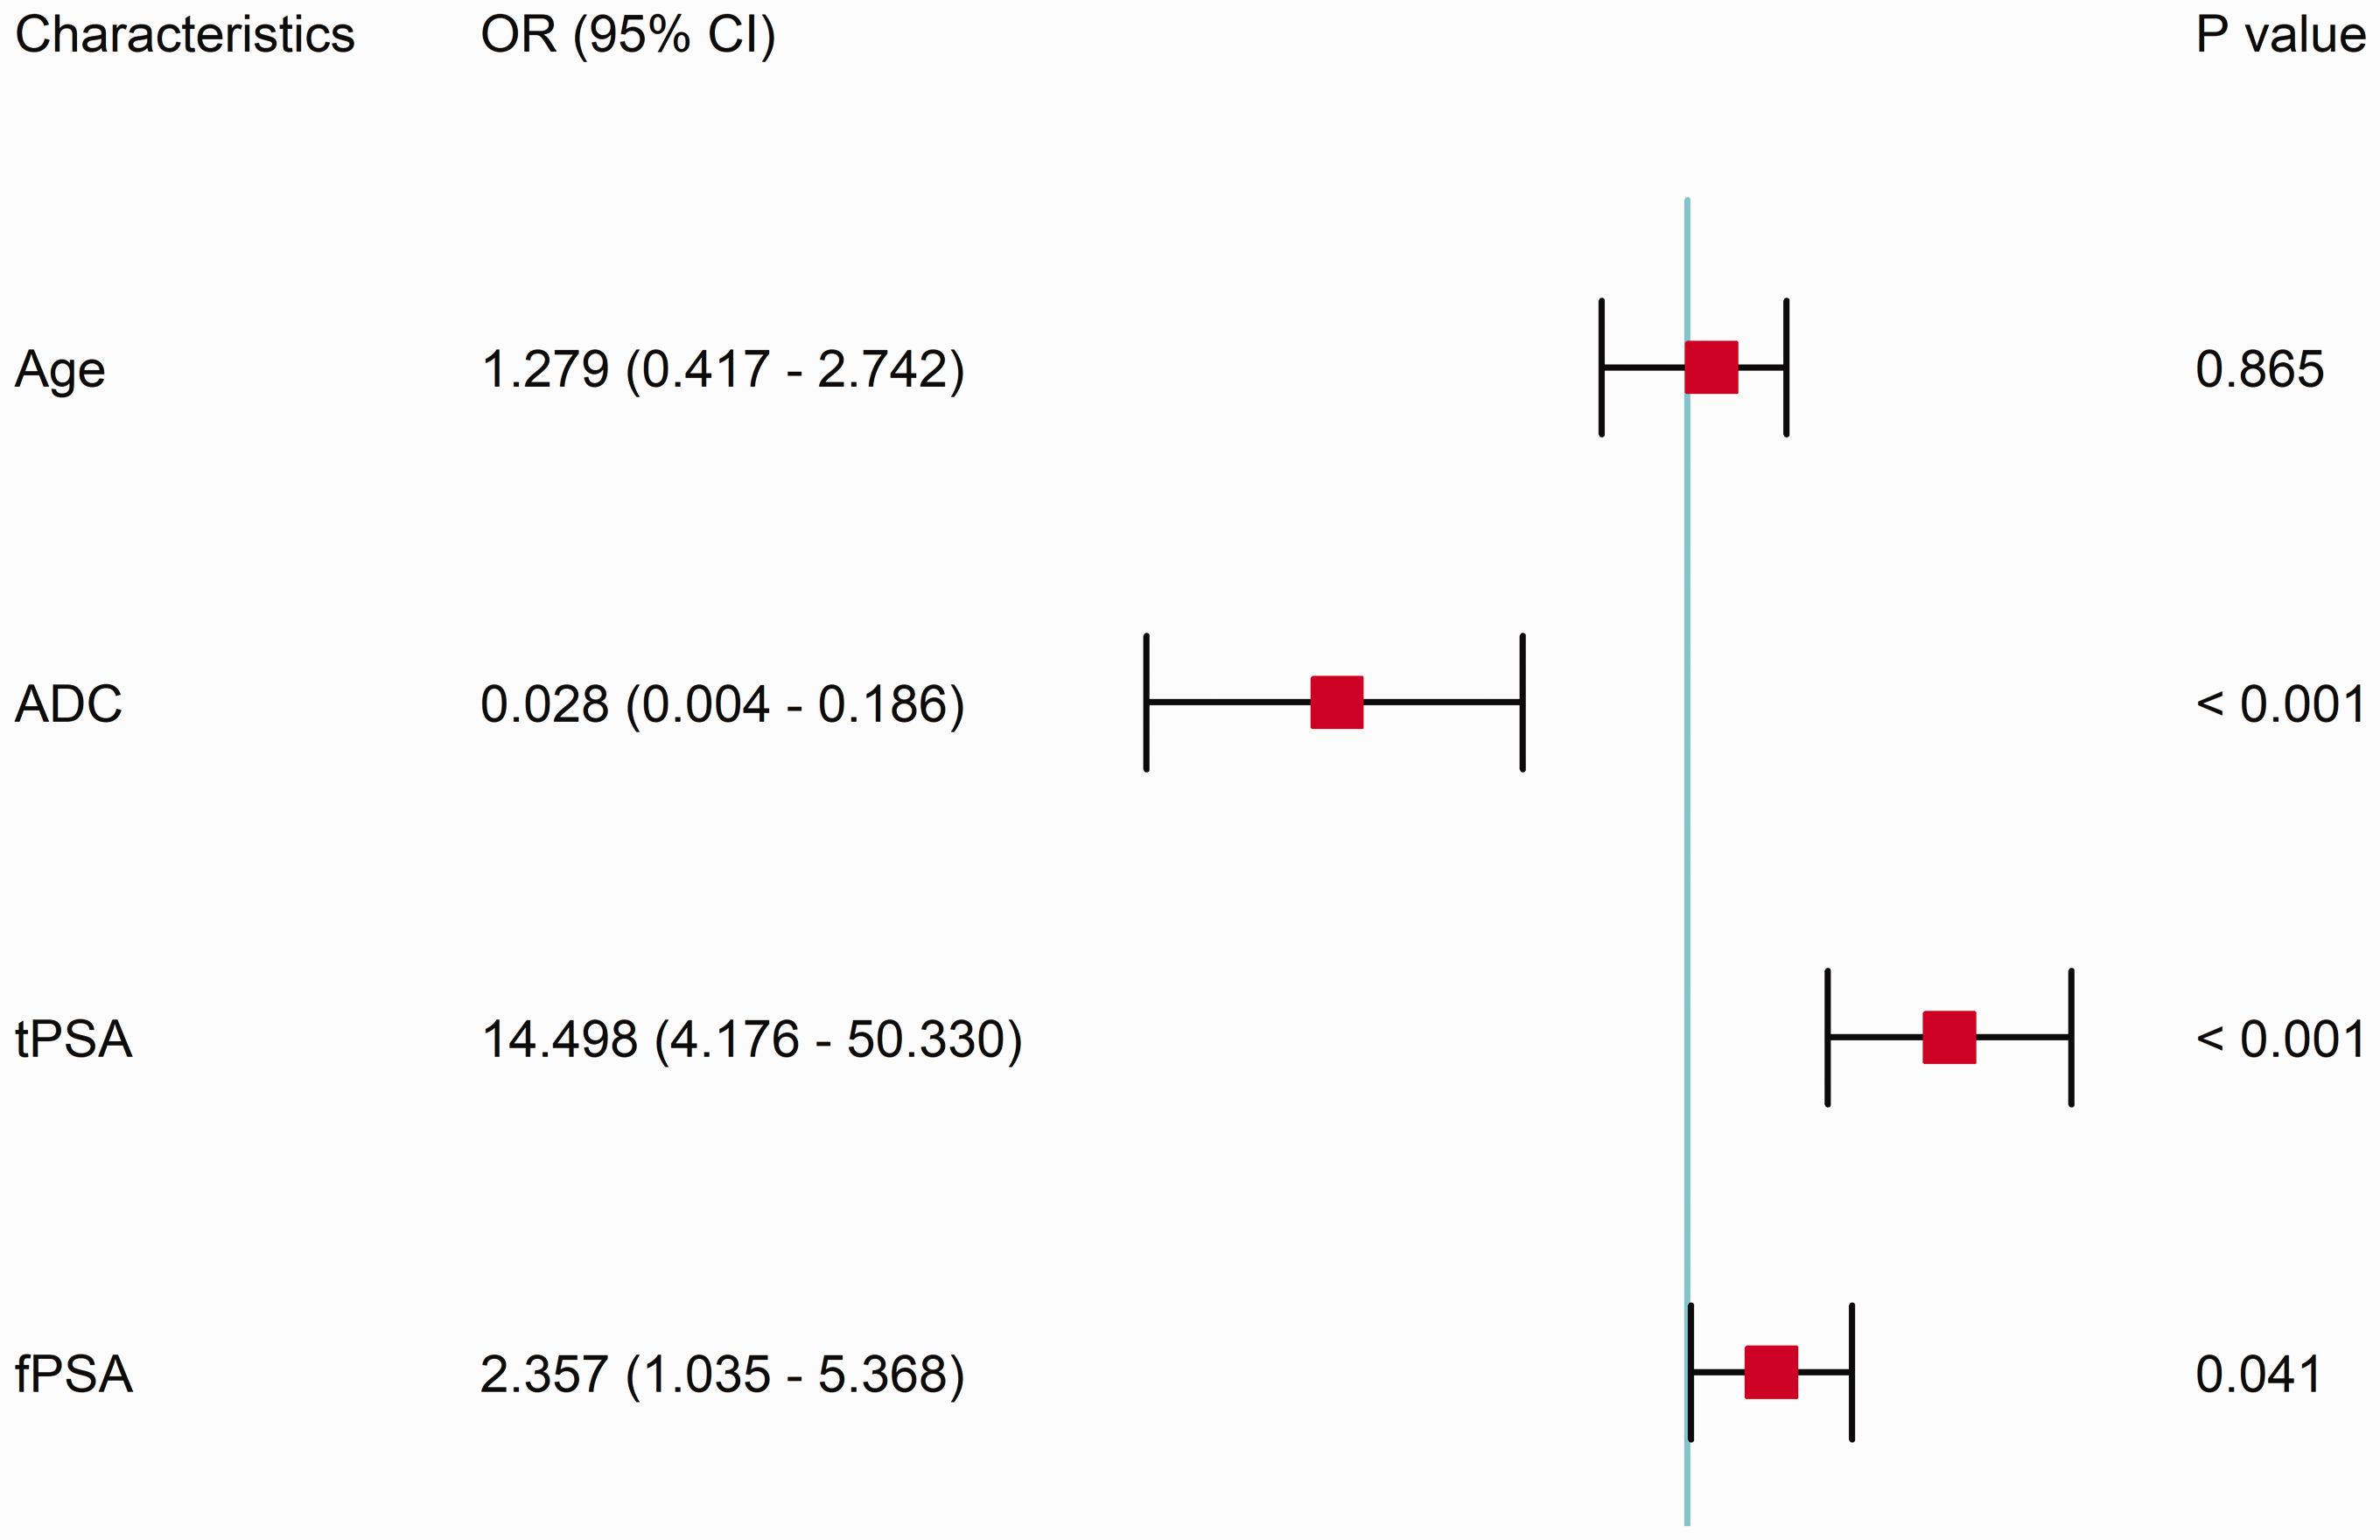
Forest plot showing the results of the multivariate logistic regression analysis. ADC, apparent diffusion coefficient; fPSA, free prostate-specific antigen; tPSA, total prostate-specific antigen; OR, odds ratio; CI, confidence interval.
Results of the ROC curve analysis
The ROC curve analysis revealed that the model had a large area under the curve (AUC) (Figure 2). Appropriate cut-off values were identified by calculating the Youden index, along with sensitivity and specificity values. The independent factor analysis yielded an optimal diagnostic cut-off value for ADC of 0.94, with sensitivity and specificity values of 72.2% and 74.7%, respectively, as shown in Table 2. tPSA had the highest AUC, of 0.914. This suggests that tPSA was the best predictor of PCa. The ROC curve analysis identified the optimal diagnostic threshold for tPSA to be 6.68 ng/mL, and this was associated with a positive predictive value of 88.9% and a specificity of 89.0%. When we established a predictive model using all three of these variables, the AUC was 0.959 (95% CI: 0.929–0.982), which was higher than that for any of the individual variables. Moreover, the model displayed higher specificity (92.3%), a positive predictive value of 92.0%, and a negative predictive value of 90.3%, making it the best predictor (Table 2).
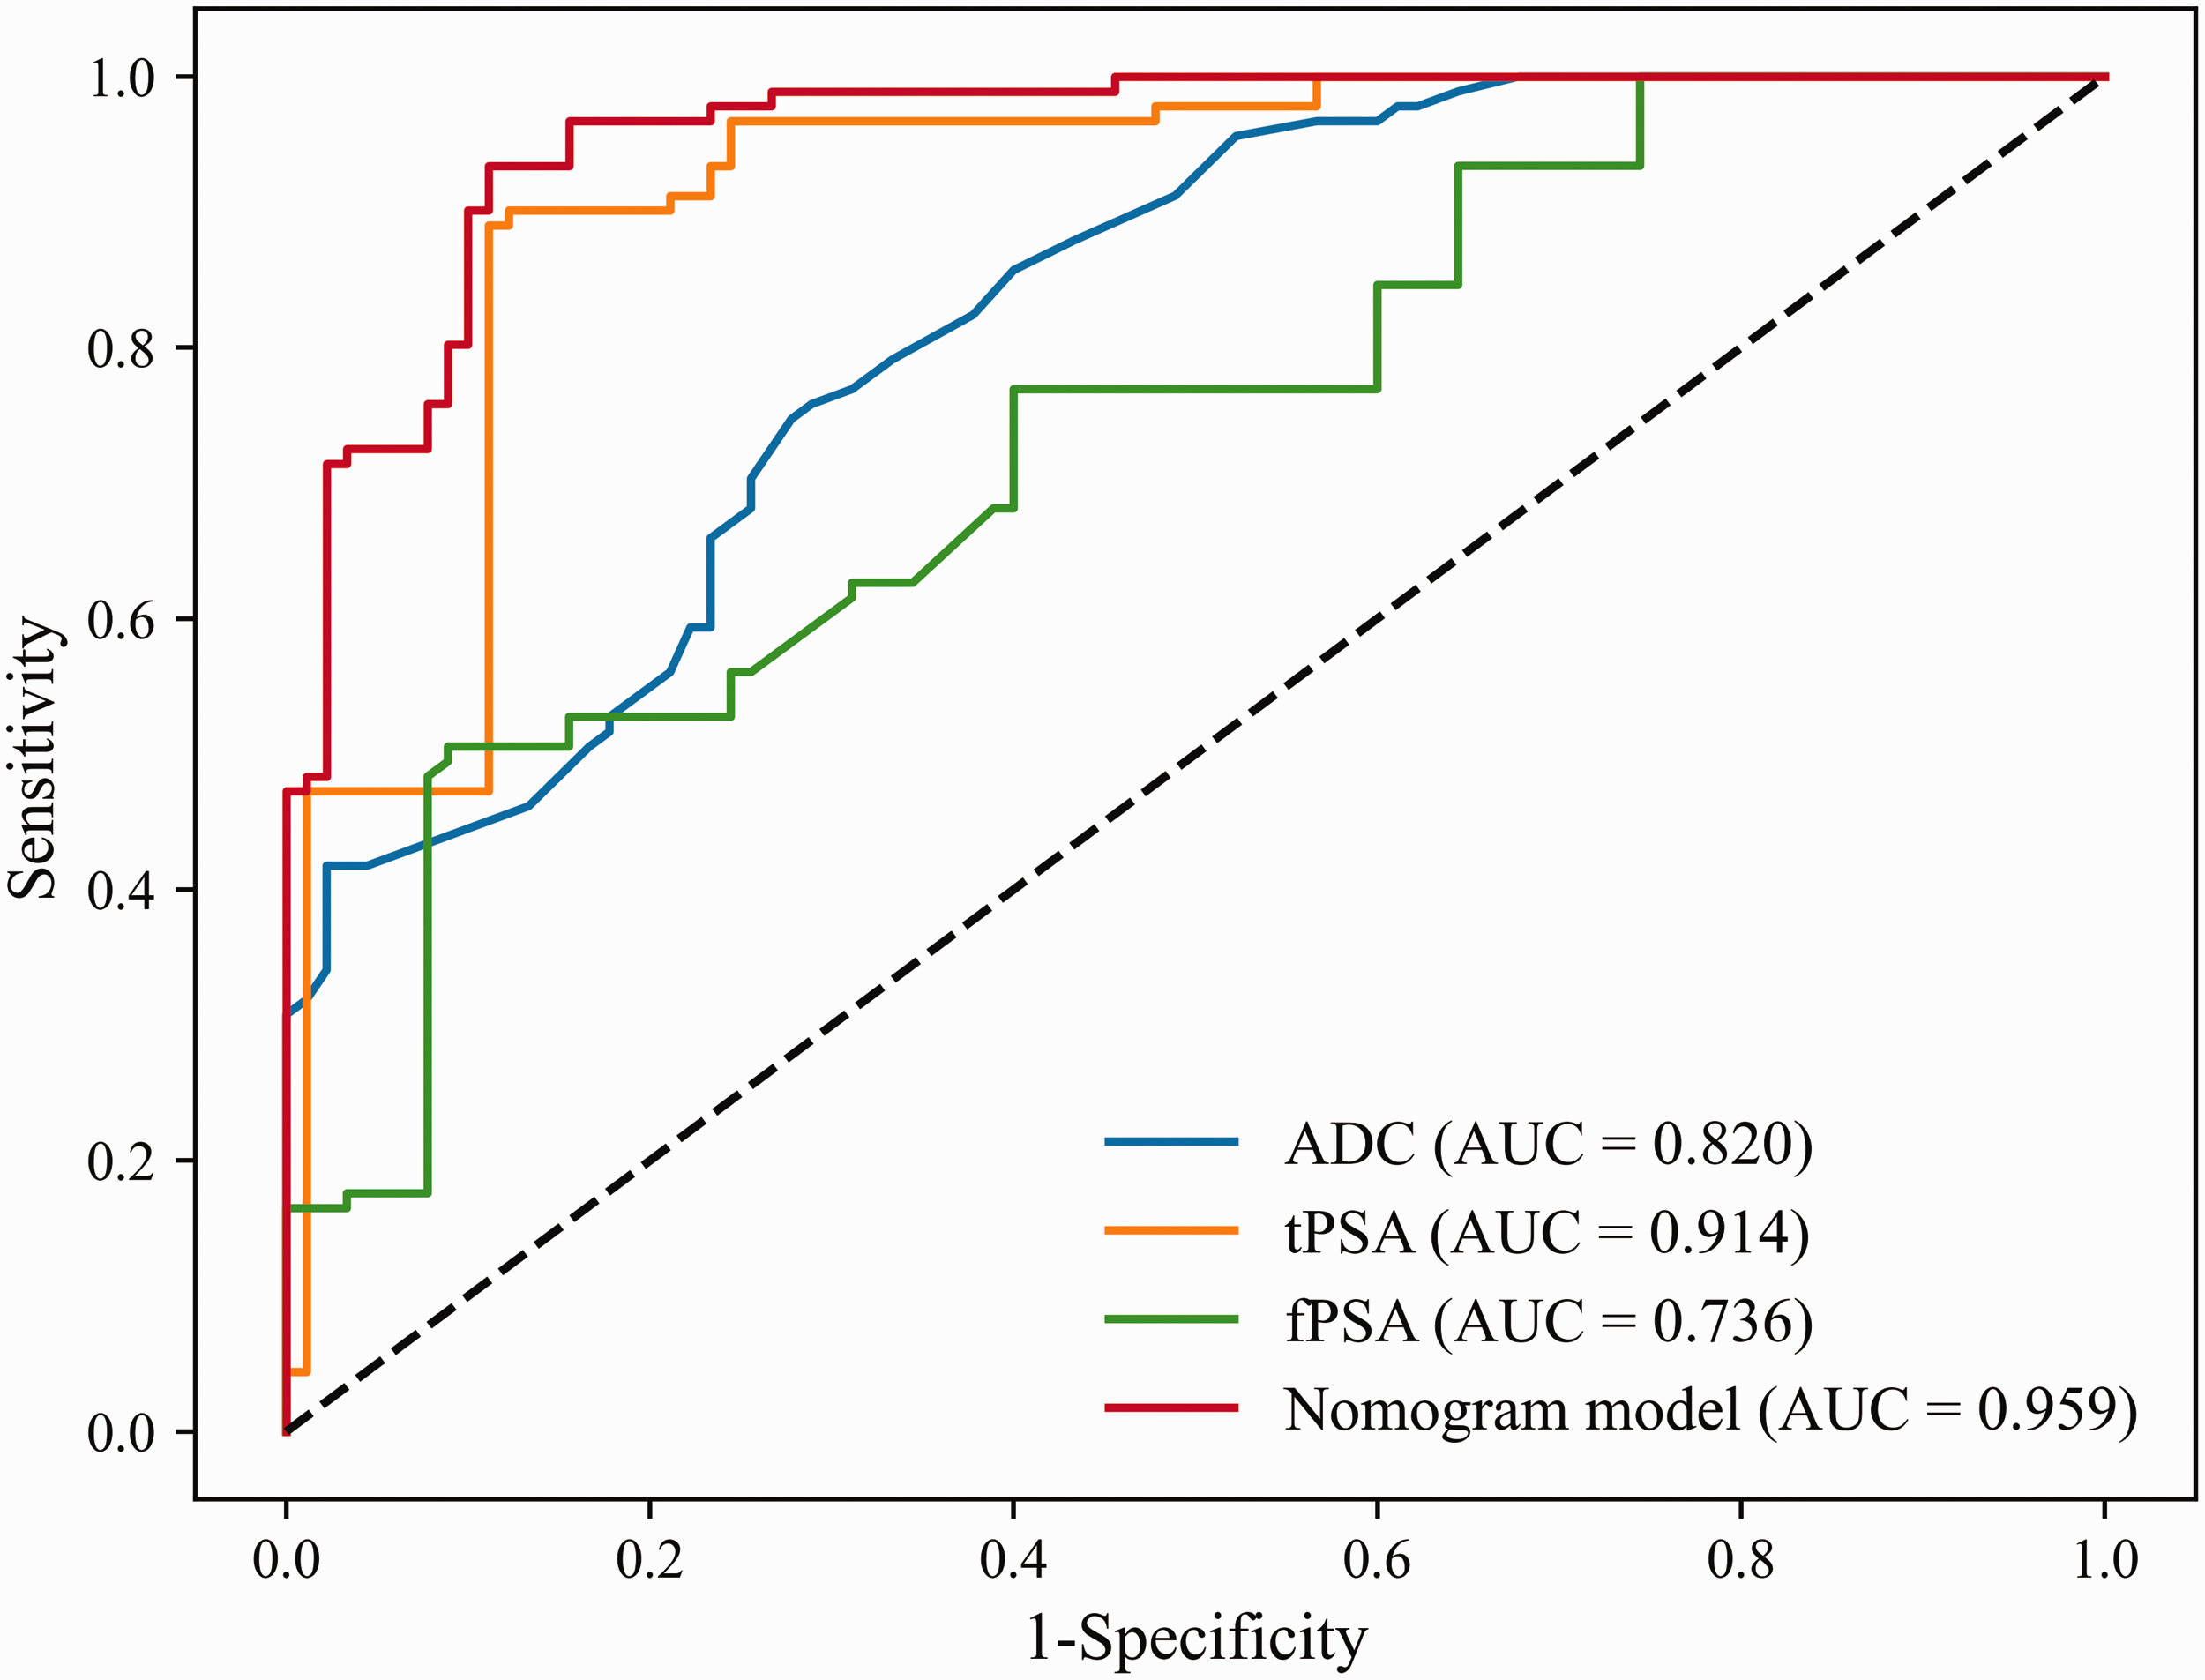
Receiver operating characteristic curves for the independent predictive factors and models. ADC, apparent diffusion coefficient; fPSA, free prostate-specific antigen; tPSA, total prostate-specific antigen; AUC, area under the curve.
Outcomes of the ROC analyses.

AUC, area under the ROC curve; NPV, negative predictive value; PPV, positive predictive value; ROC, receiver operating characteristic; SEN, sensitivity; SPE, specificity.
Nomogram development
On the basis of multiple logistic regression analysis, we constructed three single-parameter models and one combined three-parameter column line graph model, created using the three independent predictors identified above, as shown in Figure 3.

Nomogram model. ADC, apparent diffusion coefficient; fPSA, free prostate-specific antigen; tPSA, total prostate-specific antigen.
Calibration curve and model accuracy
The calibration performance of the models was evaluated using the Hosmer–Lemeshow test, and the results showed that all the models were well calibrated (p > 0.05). The calibration curve for the predictive model confirmed that it was highly accurate, with a concordance index (C-index) of 0.959, which confirms that it is a reliable means of predicting an individual’s risk of developing PCa (Figure 4).

Calibration curve for each model. ADC, apparent diffusion coefficient; fPSA, free prostate-specific antigen; tPSA, total prostate-specific antigen.
Decision curves for the models
The results of the decision curve analysis are shown in Figure 5. Within the threshold range of 0.01 to 1, the clinical net benefit of the column line graph model was greater than zero. In the DCA analysis, by examining the range and magnitude of the curve above the “none” and “all” baselines, we assessed whether the model’s net benefit at various thresholds was clinically meaningful. The predictive model curve was above the “all” line at the 0.01 threshold, demonstrating that even at the low threshold, the prediction made using the model was superior to the extreme strategy of “total treatment”. Within the threshold range of 0.01 to 1, the net clinical benefit of the predictive model was larger than the “none” line. Thus, the predictive performance of the model and its potential clinical value are apparent. Furthermore, with respect to most risk threshold ranges, the net clinical benefit of the predictive model was greater than that for the single-parameter models.
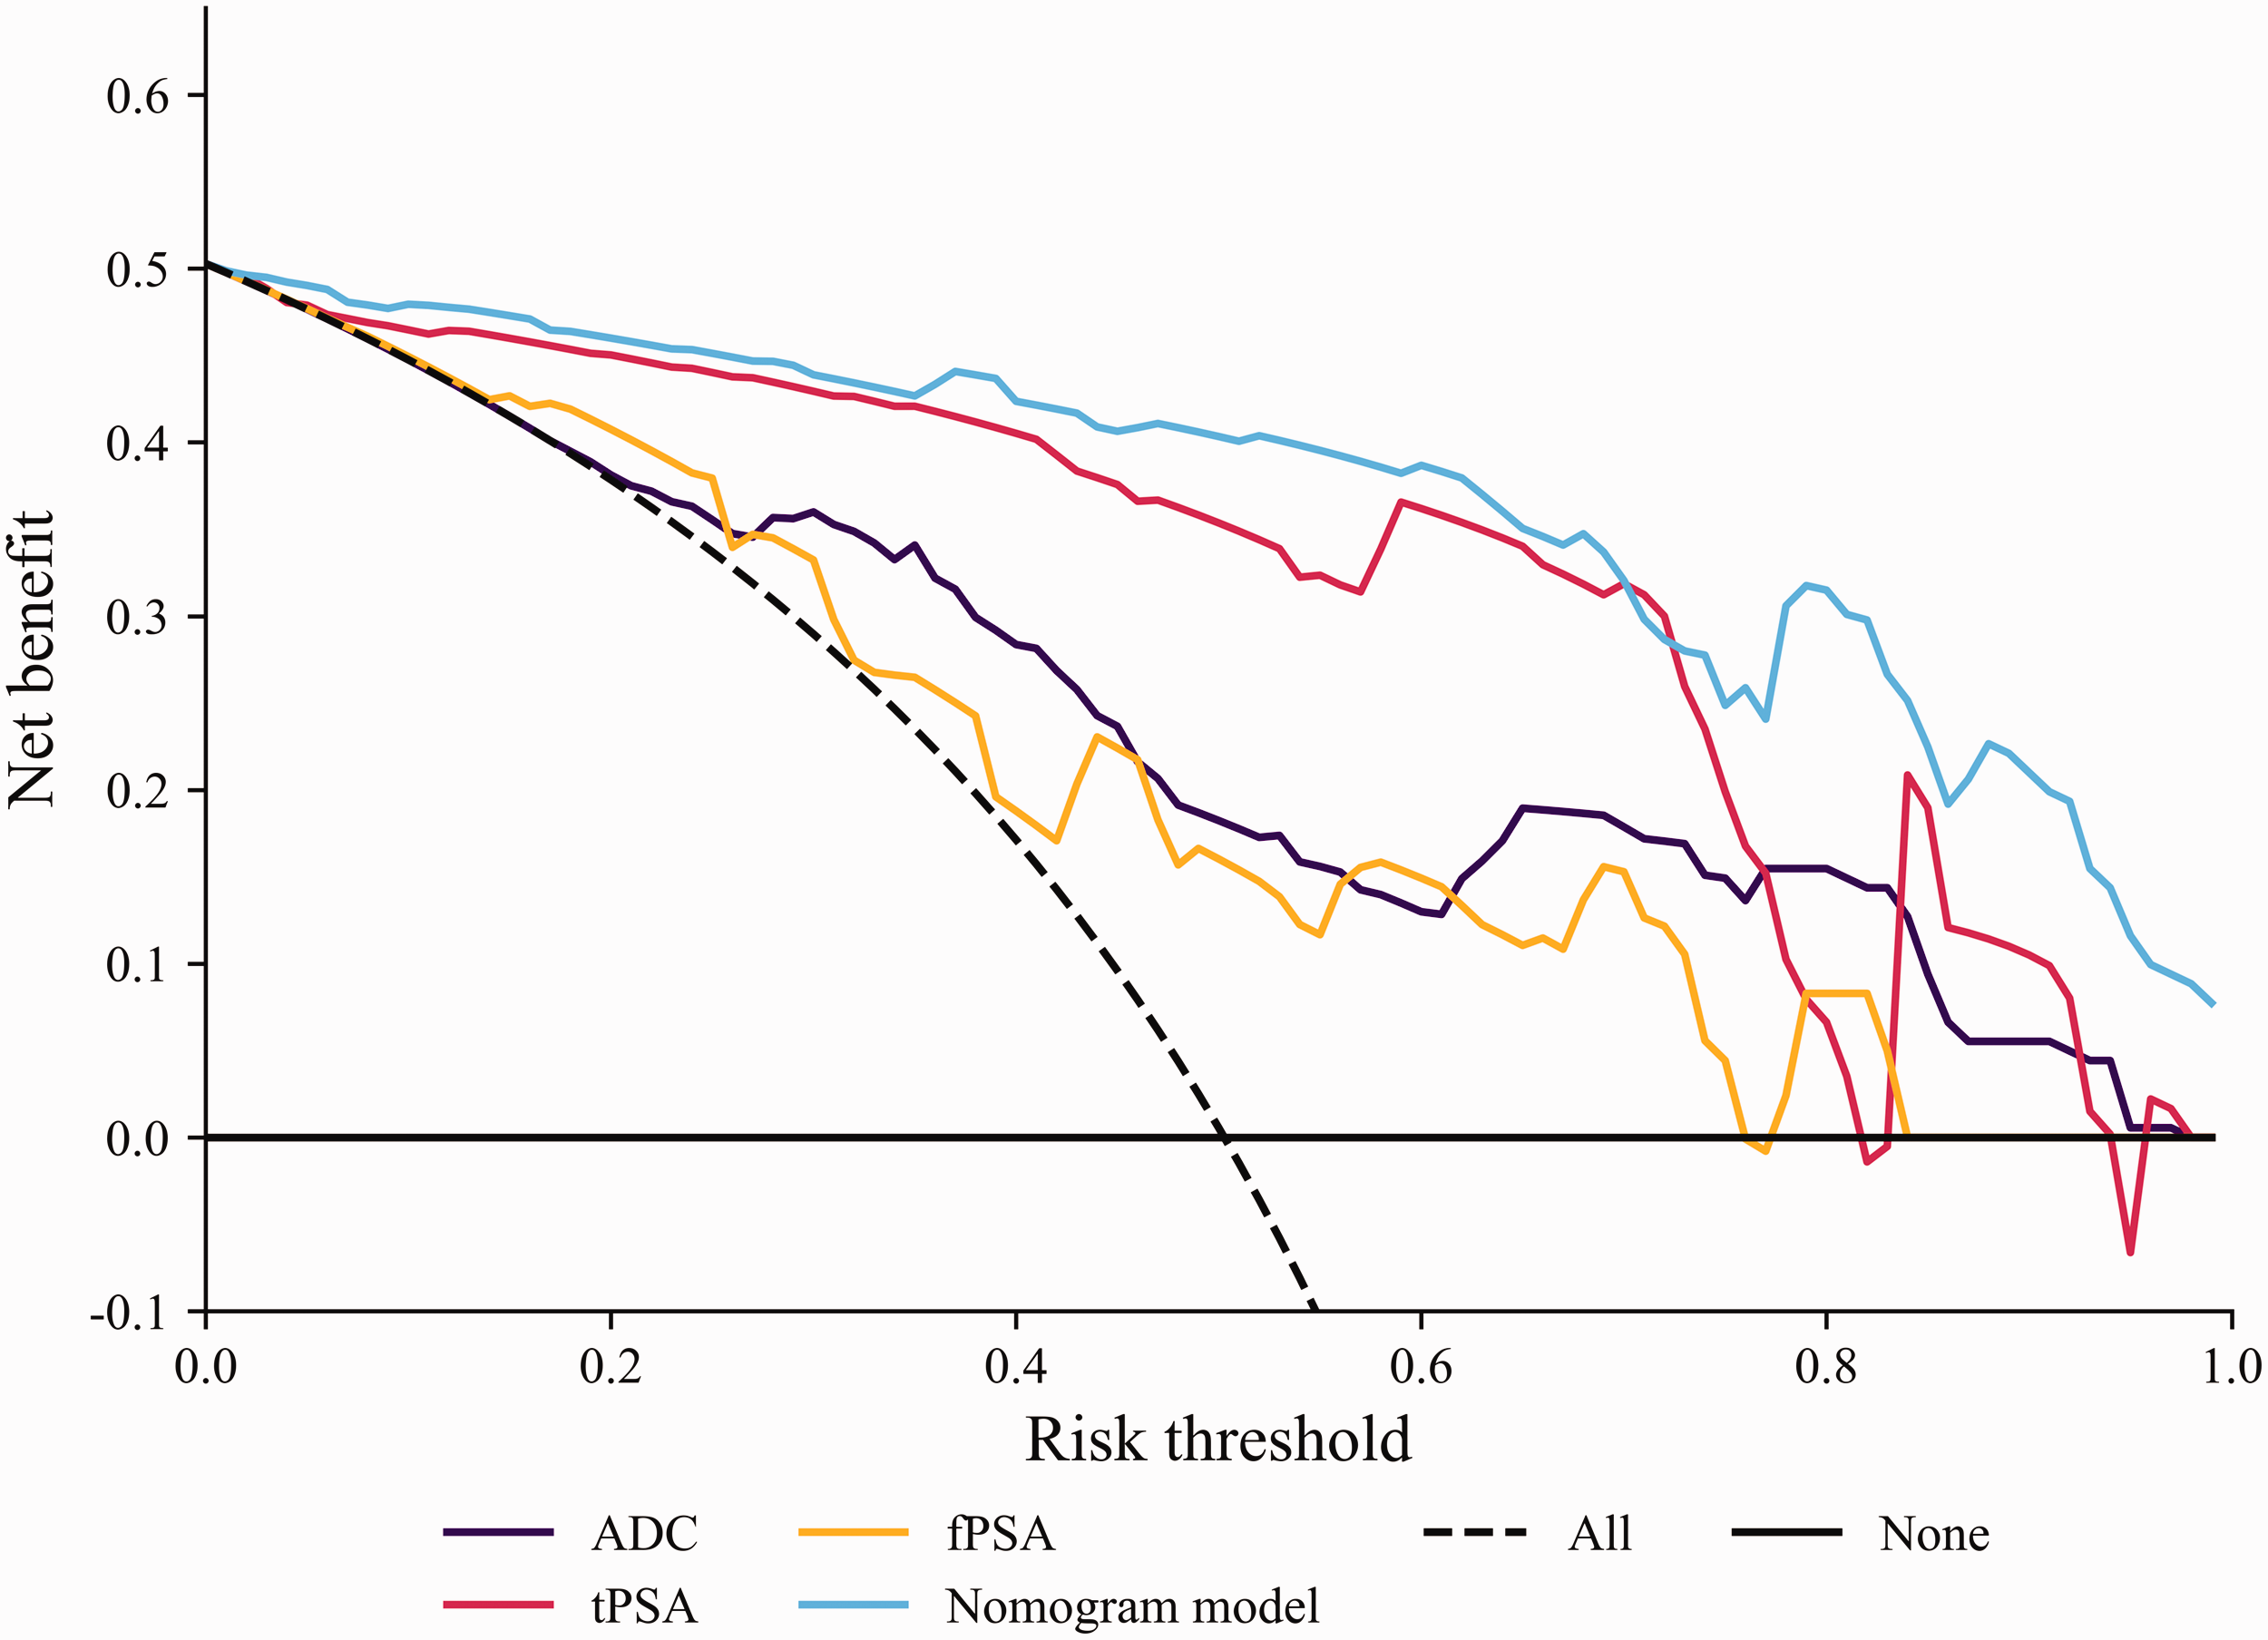
Decision curve for each model. ADC, apparent diffusion coefficient; fPSA, free prostate-specific antigen; tPSA, total prostate-specific antigen.
Discussion
PCa is a common malignancy in older men in China, and is characterized by an increasing incidence and an earlier onset. The identification of risk factors is essential for the timely clinical diagnosis and personalized treatment of patients with PCa. Therefore, the early detection of PCa is critical for effective patient management.13,14 The Prostate Imaging Reporting and Data System (PI-RADS) is widely used as a non-invasive means of assessing prostate cancer (PCa) in clinical practice. In 2019, PI-RADS v.2.1 was released, 6 and this recommended a multiparametric MRI (MP-MRI) approach that includes dynamic contrast-enhanced MRI (DCE-MRI), DWI, and T2WI. Extensive research has confirmed its diagnostic efficacy with respect to PCa. 15 However, MP-MRI has limitations as a screening tool, owing to the long duration of the imaging procedure, high cost, and risk of contrast agent allergies. 6 Moreover, there is still controversy regarding the value of DCE-MRI for the diagnosis of PCa. 16 Currently, studies are being conducted to explore the clinical diagnostic value of MP-MRI in combination with predictors of clinically significant PCa.17,18 However, these studies had the limitation that they involved a limited range of participants, which may have introduced bias into the results. Na et al. 19 reported that the use of a combination of multi-b-values from DWI and serum PSA-related parameters improves the efficacy of the diagnosis of transition-zone prostate cancer within the gray zone between benign prostatic hyperplasia and peripheral-zone prostate cancer.
DWI, a non-invasive MR imaging technique, assesses the microscopic motion of water molecules, and thereby provides insight into changes in tissue metabolism and lesion characteristics. ADC values derived from DWI quantify the diffusion of water molecules in various directions, which aids with the diagnosis of disease. The diffusion of water molecules is impeded in PCa, owing to the higher density of the tissue versus normal tissue, resulting in hyperintensity on DWI images and hypointensity on ADC maps, and therefore lower ADC values. 20 Thus, DWI clearly shows areas of limited diffusion in the prostate. Conventional prostate biopsy is the gold-standard method of diagnosing prostate cancer, and normally involves multiple punctures of the prostate in a standard pattern. 21 DWI can detect more hidden lesions than conventional transrectal ultrasound (TRUS)-guided puncture. For example, in some patients with high PSA levels but normal TRUS results, DWI can detect tiny cancerous lesions in the peripheral or transitional bands of the prostate, permitting the biopsy needle to be precisely directed to sample these suspect sites. However, for some patients with only slightly high PSA levels and for whom negative findings are obtained on conventional imaging, 68Ga-prostate-specific membrane antigen (PSMA) positron emission tomography (PET)/computed tomography (CT) can detect latent prostate cancer lesions, which enables these patients to receive a timely and accurate diagnosis. Because PSMA PET/CT can be used to identify highly metabolically active lesions in the prostate, the biopsy needle can be guided directly to such areas, thereby improving the diagnostic efficacy of biopsy. 13 However, because PET/CT involves a large dose of radiation, is relatively expensive, and requires significant precautions before the examination, it is not as easy to perform in a clinical setting as DWI. Therefore, we aimed to establish a novel predictive model by combining ADC with key clinical parameters and to determine its diagnostic performance.
DWI is often used in combination with other MRI sequences, such as T2-weighted imaging (T2WI). T2WI provides anatomic information about the prostate, whereas DWI provides information regarding the functional properties of the tissue. The use of multi-parameter imaging permits physicians to obtain a more complete picture of the location, size, and shape of lesions within the prostate. For example, when determining the boundary of the lesion, DWI in combination with T2WI provides a more accurate outline of the extent of the cancer, which assists with the planning of biopsies and improves their diagnostic efficacy.
PSA, a prostate-specific enzyme, is pivotal in the diagnosis and differential diagnosis of PCa. It is essential for the screening, early detection, clinical staging, treatment monitoring, and assessment of the prognosis of this disease. 22 The circulating PSA concentration increases in response to structural damage to the prostate. The shape of the ROC curve reflects the performance of the model established, and the AUC is an important quantitative index derived from the ROC curve. The value of the AUC ranges from 0.5 to 1, and an AUC of 0.5 indicates that the predictive efficacy of the model does not differ from a random outcome. An AUC >0.5 indicates that the model has some utility as a predictor, and the closer the AUC is to 1, the more accurate the model is. 23 During the ROC analysis, the Youden index and cut-off value for tPSA concentration were calculated as 0.779 and 6.68 ng/mL, respectively. The use of 6.68 ng/mL as a threshold could help with the initial identification of prostate cancer and the confirmation of a diagnosis. This study's ROC curve analysis revealed that a tPSA level greater than 6.68 ng/mL yields a sensitivity of 56.79% and specificity of 79.86% for PCa diagnosis.
It is widely thought that the incidence of prostate cancer increases with age; however, some studies have shown no correlation between age and PCa.24,25 This discrepancy may be explained by ethnic or geographic variations among study samples. In the present study, the univariate analysis revealed a statistically significant difference in the age distributions of the Malignancy and Benign groups (p < 0.01), but multivariate regression analysis showed no differences between patients of differing age. In addition, BMI has been proposed to be a risk factor for PCa, but we did not find any significant difference in the BMIs of the two groups, which may be attributable to the retrospective design of the study or its small sample size. 26
The identification of an appropriate cut-off value for ADC should help improve the early detection rate of prostate cancer, and the sensitivity of the diagnosis of some small PCa lesions should be significantly improved. This is because such lesions already show limited water molecular dispersion at an early stage, and these foci of potential cancer could be more readily identified by comparing their ADC values with the cut-off values. 27 The present analysis indicated that the use of an ADC value >0.935 significantly increases its diagnostic efficacy for PCa, and implies that ADC values could provide important assistance with the diagnosis of PCa. We found that a high tPSA level is an independent risk factor for PCa, and particularly when it is >6.68 ng/mL, demonstrating its utility for diagnosis. The fPSA level, reflecting the portion of PSA in the plasma that is not protein-bound, is also of diagnostic utility when considered alongside that of tPSA. In the present study, we calculated an optimal cut-off value for fPSA of 1.11 ng/mL. A combination model that comprised the ADC value, tPSA, and fPSA significantly outperformed the use of either parameter alone for the prediction of PCa. Therefore, individuals with an ADC value >0.935, a tPSA level >6.68 ng/mL, and an fPSA level >1.11 ng/mL are at a relatively high risk of PCa, and therefore require regular monitoring. We next constructed a predictive nomogram based on these findings, which should enable personalized diagnostic and treatment strategies. This nomogram assigns scores to ADC and tPSA values, and uses these for the accurate calculation of an individual’s risk of PCa. The model’s strength is its ability to precisely estimate the individual risk of PCa on a scale of 0% to 100%.
A calibration curve is used to evaluate the consistency of the results of a predictive model and actual observations. It is constructed by comparing the probability (or other predictor) generated by the model with the actual frequency of an event. If the calibration curve created is close to the diagonal, this indicates that the model is well-calibrated and that the probability generated by the model is a good reflection of reality. For the prostate cancer risk prediction model created in the present study, the calibration curve was close to the diagonal for most of the probability intervals, indicating that the model can not only distinguish whether a patient has PCa or not, but can also be used to estimate the probability of disease accurately. The C-index is a statistic used to evaluate the ability of a predictive model to differentiate between outcomes by measuring the level of agreement between the predictions made using a model and actual observations. Here, we used the C-index to determine the accuracy of the predictions made using the model, with a high C-index indicating good performance. The C-index obtained in the present study was 0.959, implying that the model is highly accurate.
DCA is a method of evaluating the clinical utility of a predictive model at various decision thresholds that generates its results in the form of a decision curve. It takes into account the probability predicted by the model, the relative harms associated with false positives and true positives, and the baseline risk of patients under different clinical decision scenarios. In the present study, multiple diagnostic prediction models were generated, and the decision curves were used to compare their clinical utility. By plotting decision curves for the various models and comparing their net benefits within appropriate ranges, it is possible to determine which model is most useful in clinical practice. In the present study, DCA showed that the predictive model curve was high at the 0.01 threshold, close to the “all” line, showing that even at the low threshold, the prediction made using the model was superior to the extreme strategy of “total treatment”. Throughout the 0.01 to 1.0 threshold range, the model’s clinical net benefit was greater than zero, and the curve was consistently above the “none” line. The combined model had the highest net benefit, suggesting that this model may be best suited for use in the clinical decision-making process.
The present study had some limitations. First, the specificity of ADC for the diagnosis of PCa was found to be suboptimal. If circumstances allow, the use of enhanced MRI might be associated with greater diagnostic efficacy for PCa. Second, multiple factors can interfere with the optimal selection and delineation of the ROI during the measurement of ADC. Third, it is also important to note that the retrospective design of the study and the relatively small number of patients limit the generalizability of the findings. Further studies of larger cohorts and comprehensive datasets should be performed to refine the predictive model and confirm its utility in clinical practice. We hope that such future studies will further improve the accuracy of the model and look forward to establishing its clinical applicability.
Conclusion
ADC, tPSA, and fPSA were found to be independent risk factors for prostate cancer. The nomogram model established using the clinical data for patients with PCa in our hospital is a highly accurate predictor, and we intend to provide guidance to clinicians on the incorporation of PCa models into the process of risk assessment and stratification for patients with suspected PCa. If the model predicts a high probability of PCa in a patient and the results are consistent with those of imaging, this should enhance the physician’s confidence in recommending biopsy and help determine the optimal biopsy sites. The use of a combination of the output of the model and the pathologic findings should optimize the diagnostic efficacy of PCa.
Footnotes
Acknowledgements
The authors would like to thank Ruiqiang Xin for his assistance with the statistical analysis and my colleagues in the Nuclear Medicine Department and the Department of Medical Imaging, Beijing Luhe Hospital, affiliated with Capital Medical University, for the provision of the pathology data.
Author contributions
All the authors contributed substantially to the manuscript. PH and RX conceived and designed the study. CL and XN acquired data. JZ analyzed the data. LS, RP, and XL recorded the data.
Declaration of conflicting interest
The authors declare that there is no conflict of interest.
Funding
This research received no specific grant from any funding agency in the public, commercial, or not-for-profit sectors.