
Abstract
The effects of increasing blood flow on the pathogenic wall shear stress (pWSS) of subclavian arteries (SAs) are currently unclear. Patient-specific models of the SA were constructed based on computed tomographic images from two patients. Using the Ansys Fluent 19.0 transient laminar flow solver, the finite volume method was chosen to solve the Navier–Stokes equation governing fluid behavior. The time-averaged wall shear stress, ratio of risk area, cumulative ratio of risk area (
Keywords
Introduction
Stenosis of the subclavian artery (SA) may lead to symptoms that indicate ischemia of the posterior intracranial circulation and upper limbs, such as subclavian steal syndrome. SA stenosis is diagnosed when there is a blood pressure difference ≥15 mmHg between the bilateral brachial arteries. 1 In a previous study, patients with a bilateral blood pressure difference ≥15 mmHg had a 60% and 70% higher risk of cardiovascular and all-cause mortality, respectively, compared with the general population. 2 Atherosclerosis is the most common cause of SA stenosis; other causes, such as inflammation and dissection, account for <10% of all cases. 3 SA stenosis occurs on the left side in most cases,3,4 thus contributing to asymmetry. The prevention of atherosclerotic plaques in the left SA is therefore essential for preventing SA stenosis.
Wall shear stress (WSS) is the force per unit area caused by a moving fluid in the local tangent of a luminal surface. Biomechanical studies have revealed that arterial walls that possess a WSS <0.4 Pa are prone to the formation of atherosclerotic plaques. 5 Furthermore, there are clear differences between the bilateral SAs in terms of their distance from the heart and their three-dimensional (3D) morphology. These factors may have an impact on the distribution of pathogenic WSS (pWSS). 6 In addition, the bilateral arteries are affected by the same risk factors as for atherosclerosis, such as hypertension, hyperlipidemia, diabetes, and smoking. We therefore speculate that differences in pWSS may cause an asymmetric incidence of SA stenosis between the bilateral SAs, and that pWSS may be an important target for the prevention of atherosclerotic plaques in the left SA.
To the best of our knowledge, previous studies focusing on the SA have primarily reported that right SA cannulation may be cerebroprotective against the formation of ascending aortic plaques, and that the right SA is a feasible anastomosis location for left ventricular assist devices (standard treatment options for end-stage heart failure patients).7,8 No studies have directly reported on the asymmetric distribution of pWSS of the bilateral SAs, which may be a potential therapeutic target for the prevention of SA stenosis. The present study aimed to describe both the asymmetric pWSS distribution of the bilateral SAs and the effects of increasing blood flow on the pWSS of the left SA.
Case reports
Two patients were consecutively admitted to the Department of Neurology in February 2019 and underwent computed tomography angiography and ultrasonography of the bilateral SAs. Both patients were older men with dizziness but no abnormal neurological signs. They both had a history of hypertension and anti-hypertensive drugs. In addition, both were diagnosed with cerebral atherosclerosis and received antiplatelet drugs (100 mg aspirin orally once per day) for primary stroke prevention. This study followed the ethical guidelines of the 1975 Declaration of Helsinki. It was approved by the Ethics Committee of the First Affiliated Hospital of the College of Medicine of Zhejiang University (reference number 2018-591), and verbal consent for treatment was obtained from the patients or their legally authorized representatives. All patient details have been de-identified. The reporting of this study conforms to the CARE guidelines (for CAse REports). 9
Methods
Three-dimensional modeling
Mimics software (Materialise’s Interactive Medical Image Control System; Materialise, Leuven, Belgium) was used to extract 3D vascular morphology from each raw computed tomography angiography image; the SA segment from its origin to the vertebral artery ostium was selected. The vascular morphology of the bilateral SAs was established via the following steps: (1) the Dynamic Growing function of Mimics software was used to acquire the initial vascular geometry; (2) blood vessels that were not within the region of interest (ROI) were deleted and only the SA ROI was retained; (3) each pixel on the arterial section was reviewed individually and adjusted manually; and (4) smoothing was performed on the vascular geometry (Figure 1a–c and i–k). The bilateral ROI was defined as the area between the SA origin and vertebral artery ostium.

Three-dimensional (3D) model and mesh generation before fluid dynamics calculation. (a) computed tomography angiography (CTA) of the subclavian artery (SA) of Patient 1 (P1); (b) 3D modeling of the right subclavian artery (RSA) of P1; (c) 3D modeling of the left subclavian artery (LSA) of P1; (d) meshing of the RSA of P1; (e) meshing of the LSA of P1; (f) ultrasonography of the RSA of P1; (g) ultrasonography of the LSA of P1; (h) the inlet velocity (V)–time curve of the SA of P1; (i) CTA of the SA of Patient 2 (P2); (j) 3D modeling of the RSA of P2; (k) 3D modeling of the LSA of P2; (l) meshing of the RSA of P2; (m) meshing of the LSA of P2; (n) ultrasonography of the RSA of P2; (o) ultrasonography of the LSA of P2; (p) the inlet V–time curve of the SA of P2.
Meshing
The process of meshing was performed using Ansys Mesh, which is part of the solver package of Ansys Workbench (Ansys Inc., Canonsburg, PA, USA). Unstructured tetrahedral grids were used, and the surface grid size of the core area was 0.1 mm. Ten prism layers were adopted to accurately capture boundary phenomena in blood flow, and the height of the first layer was 0.01 mm with a growth rate of 1.2. The mesh in the key region was between two and three million (Figure 1d, e, l, and m). The independence of the mesh was calculated to ensure the results were limited to 1%.
Boundary conditions
To ensure full development of the SA flow, the inlet (10 times the diameter) and outlet (20 times the diameter) boundaries were extended as appropriate. The blood flow velocity was extracted from the blood flow spectrum measured using ultrasonography, and piecewise polynomial fitting was performed to obtain the dynamic curve of outlet blood flow velocity. Next, the inlet velocity–time curve was created according to the scaling principle (Figure 1f–h and n–p). Velocity was inputted as a boundary condition through a Fluent User-Defined Function.
We assumed that there was a no-slip boundary, rigid wall, velocity inlet boundary, and pressure outlet boundary, and we set the pressure to 0 (the SA outlet was used as the reference pressure of 0).
Blood is considered an incompressible non-Newtonian fluid, with a density of 1060 kg/m3. A Carreau fluid is an intuitive shear-thinning fluid that conforms to the shear thinning of blood.
10
The specific parameters were as follows:

Hemodynamic analysis
A finite volume laminar flow solver package, Ansys Fluent 19.0 (Ansys Inc.), was selected to solve the Navier–Stokes equation that governs 3D incompressible fluids. The time step was set at 1/400 of the cardiac cycle, and the convergence criterion of the iterative residual was 10−5. To ensure the convergence of the solution, the overall result was calculated according to the cycle and time step until the data had <3% error.
The Navier–Stokes equation:

WSS was related to the velocity profile near the wall:
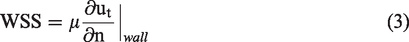
The viscosity follows Equation (1). WSS was defined as the normal velocity gradient at the wall, which is equal to the product of viscosity. Viscosity is dependent on stress and the gradient of the velocity at the wall,
The TAWSS was calculated to describe the temporal distribution of instantaneous pWSS within one cycle. The transient WSS of each grid cell was averaged over time to obtain its TAWSS distribution. The TAWSS of each grid cell was then weighted and averaged according to the grid cell area to obtain the final TAWSS of the overall arterial wall.

OSI is another vital parameter for the risk of atherosclerosis, and indicates the WSS vibration during a cardiac cycle.

The ratio of risk area (

The ratio of risk time was calculated. Additionally, the contour of the ratio of risk time was plotted to illustrate the spatial distribution of pWSS, to identify the arterial wall regions with the greatest risk of atherosclerosis. 11 The ratio of risk time was defined as the percentage of time in which pWSS occurred at each calculating mesh node on the arterial wall surface across the entire cycle. If any location had a ratio of risk time of 100%, then pWSS was considered present at that node throughout the entire cycle.
Intervention
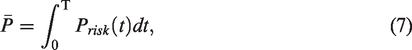
The equation for WSS suggests that WSS increases with increasing blood flow volume. To test the hypothesis that a higher blood flow volume can reduce pWSS, we calculated
Results
Asymmetric distribution of pWSS in the bilateral SAs
The TAWSS contour crudely showed that the WSS of the left SA was lower than that of the right SA (Figures 2 and 3). Patient 1 (P1) had low WSS at the left SA inlet (Figure 2a, b), whereas Patient 2 (P2) had low WSS in the midsection of the left SA (Figure 3a, b). Furthermore, the

Contours of the time-averaged wall shear stress (TWSS) and oscillatory shear index (OSI) of Patient 1 (P1). (a) TWSS on the ventral and dorsal sides of the right subclavian artery (RSA); (b) TWSS on the ventral and dorsal sides of the left subclavian artery (LSA); (c) OSI on the ventral and dorsal sides of the RSA; (d) OSI on the ventral and dorsal sides of the LSA.

Contours of the time-averaged wall shear stress (TWSS) and oscillatory shear index (OSI) of patient 2 (P2). (a) TWSS on the ventral and dorsal sides of the right subclavian artery (RSA); (b) TWSS on the ventral and dorsal sides of the left subclavian artery (LSA); (c) OSI on the ventral and dorsal sides of the RSA; (d) OSI on the ventral and dorsal sides of the LSA.

The temporal and spatial distributions of pathogenic wall shear stress (pWSS). (a) ratio of risk area (
The high OSIs in the left and right SAs were usually matched with low WSS, while the region of high OSI in the right SA was a little bigger than the one of low WSS (Figure 2c, d; Figure 3c, d). The more severe direction change of the WSS in the right SA may be caused by the high change rate of transient velocity.
In addition, the contour of the ratio of risk time revealed the arterial wall areas with the greatest risk of atherosclerosis; that is, the areas with the longest pWSS duration. Because of the higher incidence of SA stenosis on the left side than the right side, we focused mainly on the left SA. The ratio contour of risk time indicated that P1 had the greatest risk at the left SA inlet (Figure 4c), while P2 had the greatest risk at the proximal end of the dorsal midsection of the left SA (Figure 4f).
Effects of increasing local blood flow on pWSS of the left SA
Because there was a higher incidence of left SA stenosis than right SA stenosis, we mainly focused on the left SA. Compared with baseline (

Effects of increasing local blood flow on the pathogenic wall shear stress (pWSS) of the left subclavian artery (LSA) of Patient 1 (P1). (a) ratio of risk area (

Effects of increasing local blood flow on the pathogenic wall shear stress (pWSS) of the left subclavian artery (LSA) of Patient 2 (P2). (a) ratio of risk area (
Discussion
In the present study, we revealed that the left SA had significantly greater pWSS during the diastolic phase than the right SA, while its
This pWSS asymmetry between the bilateral SAs is consistent with the asymmetrical incidence of SA stenosis that is observed by clinicians; that is, the left SA is more susceptible to atherosclerotic stenosis. In recent decades, research in the field of biomechanics has confirmed that pWSS (<0.4 Pa) plays a crucial role in the pathogenesis and rupture of atherosclerosis. 12 Given that the bilateral SAs share the same risk factors (e.g., hypertension), arterial wall tissue components, and intraluminal blood components, it can be inferred that the asymmetry of shear stress is an important cause of the asymmetric incidence of SA atherosclerotic stenosis. A similar relationship has also been reported in a comparative study of the bilateral coronary arteries. 13 pWSS can inhibit a series of anti-atherosclerotic functions of arterial endothelial cells, such as nitric oxide synthesis and antioxidant activity. It also enhances a series of pro-atherosclerotic factors, such as the secretion of inflammatory and growth factors. 5 Therefore, the first clinical implication of our study is that pWSS may be a key target in the prevention of SA atherosclerosis.
With respect to the pWSS asymmetry of the bilateral SAs, our findings revealed that increasing blood flow can decrease the duration of pWSS in the left SA with no migration in areas at greatest risk of atherosclerosis. Thus, this intervention can theoretically reduce the risk of atherosclerotic stenosis in the left SA. Based on its definition, WSS is associated with the derivative of wall velocity. Because WSS increases with increased central blood flow velocity under no-slip boundary conditions, we can deduce that pWSS decreases with increasing flow and that minimal change occurs in the position with the most obvious pWSS under laminar flow. Limb movement is generally accompanied by an increase in local arterial blood flow, thus further increasing arterial WSS and reducing pWSS. Exercise prevents atherosclerosis not only by increasing shear stress to promote the transformation of endothelial cell function, but also by releasing anti-inflammatory factors through muscle contraction. 14 It is therefore necessary to further investigate the pWSS range of the left SA in the general population and to examine whether left upper limb movements that increase blood flow in the left SA can prevent its stenosis.
The second implication of our study involves the new index, the “cumulative ratio of risk area” (
The limitations of the present study are as follows. (1) Ultrasonography was unable to measure the finer velocity distribution of blood vessel sections; we were therefore unable to obtain more accurate data on blood flow. In the current study, we incorporated the theoretical velocity distribution patterns of a cylindrical section and calculated the blood flow according to the maximum velocity measured at the section. (2) The present study assumed that the arterial wall is a rigid structure and ignored the fact that it is an elastic tissue. However, because this was a bilateral comparison, assuming that the arterial wall is a rigid structure did not affect the differences in the distribution of pWSS bilaterally. (3) Partial corrections should be considered for the outlet pressure, such as the addition of autonomous regulation and other correction terms, to adapt to the changes in blood flow. 8 Numerical simulation should also be performed using medically related Windkessel models. 15 (4) There are certain WSS processing methods, such as the WSS temporal gradient, that can be used to describe the changes in WSS under different cycle conditions. 16 (5) No clinical cohort study on SA has verified the causal relationship between pWSS and the risk of atherosclerosis. However, previous studies have confirmed the causal relationship between pWSS and the site and size of atherosclerotic plaques and relative risk. 12 (6) Factors such as age, heart rhythm, blood pressure, and aortic arch type may affect WSS. Hence, it is necessary to expand the sample size and devote more computing resources to studying pWSS distribution of the bilateral SAs under differing pathophysiological conditions. This will enable us to obtain detailed evidence for determining the pWSS characteristics of patients at high risk for SA stenosis, thereby providing a clear target pWSS range for further interventional studies. (7) Our computational model was based on pressure-driven flow, and it was the pressure that led to our results. Although we acknowledge that the physiological components that influence real blood flow are intricate and complex, we have put forward a simplified model to show the tendencies of SA flow. All of the aforementioned limitations will be considered in our future work.
In conclusion, the left SA showed greater diastolic pWSS than the right SA, and increasing blood flow volume reduced the pWSS in the left SA. It is necessary to further investigate the pWSS range of the left SA in the general population, and to examine and confirm whether precise upper limb movements that increase the blood flow volume of the left SA can prevent stenosis.
Footnotes
Declaration of conflicting interest
The authors declare that there is no conflict of interest.
Funding
The authors disclosed receipt of the following financial support for the research, authorship, and/or publication of this article: This work was supported by the Natural Science Foundation of Zhejiang Province (grant number LSY19H020001).