
Abstract
Objective
Non-small cell lung cancer (NSCLC) accounts for approximately 80% of all lung cancers, but its pathogenesis has not been fully elucidated. Therefore, it is valuable to explore the pathogenesis of NSCLC to improve diagnosis and identify novel treatment biomarkers.
Methods
Circular (circ)RNA, micro (mi)RNA, and gene expression datasets of NSCLC were analyzed to identify those that were differentially expressed between tumor and healthy tissues. Common genes were found and pathway enrichment analyses were performed. Survival analysis was used to identify hub genes, and their level of methylation and association with immune cell infiltration were analyzed. Finally, an NSCLC circRNA–miRNA–mRNA network was constructed.
Results
Eight miRNAs and 211 common genes were identified. Gene ontology and Kyoto Encyclopedia of Genes and Genomes analyses revealed that cell projection morphogenesis, blood vessel morphogenesis, muscle cell proliferation, and synapse organization were enriched. Ten hub genes were found, of which the expression of DTL and RRM2 was significantly related to NSCLC patient prognosis. Significant methylation changes and immune cell infiltration correlations with DTL and RRM2 were also detected.
Conclusions
hsa_circ_0001947/hsa-miR-637/RRM2 and hsa_circ_0072305/hsa-miR-127-5p/DTL networks were constructed, and identified molecules may be involved in the occurrence and development of NSCLC.
Keywords
Introduction
Non-small cell lung cancer (NSCLC) is the most common type of lung cancer, and NSCLC patients are prone to recurrence and have a poor prognosis. 1 Changes in social lifestyles and environments have led to increases in the incidence of NSCLC, with around 234,000 new cases reported in the United States each year. 2 NSCLC patients have no obvious symptoms in the early stage of disease, although they may experience chest pain, fever, and cough. 3 Indeed, the pathogenesis of NSCLC has not been fully elucidated. Many factors including smoking, the environment, inflammation, and genetics may be related to the development of tumors,4,5 while small molecules such as circular (circ)RNAs and micro (mi)RNAs were also reported to be involved in tumor progression.6,7 Additionally, treatment methods and effects correlate with tumor stage. 8 For patients in the early stages of disease, surgery is the first choice of treatment. 8 Radiotherapy, chemotherapy, and bio-targeted therapy can be used in combination in advanced patients while avoiding unnecessary surgery. 9 However, the prognosis of patients is far from satisfactory because of the high tumor recurrence and metastasis rates.10,11 Therefore, it is valuable to further explore the pathogenesis of NSCLC and identify targets to aid early diagnosis and the development of specific treatments.
Bioinformation technology can identify molecular markers related to tumor progression by analyzing tumor sequencing data. Bai et al used weighted gene co-expression network analysis to identify multiple genes related to breast cancer subtypes, recognize key modules and hub genes, and prove that the tumor microenvironment and immune infiltration are involved in the occurrence and development of breast cancer. 12 Zhan et al found that CD276 regulates protein phosphorylation and thus participates in glioblastoma progression, suggesting that it could be used as a therapeutic biomarker for glioblastoma. 13 Additionally, Xiao et al analyzed circRNA and gene expression data to detect multiple molecules abnormally expressed in the pancreas of ductal adenocarcinoma patients, and constructed a circRNA–miRNA–mRNA network providing novel ideas for mechanism research and treatment. 14 Furthermore, Dai detected multiple genes that are abnormally expressed in patients with NSCLC and used bioinformatic analysis to identify hub genes as potential early diagnosis and treatment biomarkers. 15
In the present study, we screened differentially expressed circRNAs (DECs), miRNAs (DEMs), and genes (DEGs) between NSCLC tumor tissues and healthy lung tissues by bioinformatic analysis. Our findings were used to construct a circRNA–miRNA–mRNA network of NSCLC.
Materials and methods
NSCLC expression dataset
The gene expression omnibus (GEO; http://www.ncbi.nlm.nih.gov/geo) is a public platform for the storage of genetic data. 16 One circRNA expression profiling dataset [GSE112214 (GPL19978 platform)], one miRNA expression profiling dataset [GSE102286 (GPL23871 platform)], and one gene expression profiling dataset [GSE101929 (GPL570 platform)] were downloaded from the GEO database. The GSE112214 dataset includes three NSCLC lung samples and three matched adjacent healthy samples; GSE102286 includes 179 tumor and paired healthy tissues from African–Americans and European–Americans with NSCLC and we selected 10 paired tumor and healthy tissues from both ethnic groups; GSE101929 includes 66 tumor and paired healthy tissues from African–Americans and European–Americans with NSCLC and we again selected 10 from both ethnic groups.
DEC, DEM, and DEG identification
GEO2R (https://www.ncbi.nlm.nih.gov/geo/geo2r/) is an online tool used to identify DEGs in datasets from the GEO. 17 It may also be used to identify DEGs, DEMs, and DECs between NSCLC tumor and healthy tissue samples. We used it with statistical parameters: P-value <0.05 and fold change (FC) >1 or FC <–1 (GSE112214, GSE102286) or FC >2 or FC<–2 (GSE101929). Volcano diagrams were delineated by SangerBox software (http://sangerbox.com/), and circRNAs were analyzed in circBase (http://www.circbase.org/).
miRNA and mRNA prediction
The most 10 significantly changed DECs were used to predict downstream miRNAs through Circinteractome. 18 Additionally, intersection miRNAs of the predicted miRNAs and DEMs were used to predict downstream mRNAs through miRWalk 3.0. 19 Genes common to both predicted mRNAs and DEGs were identified. Venn diagrams were delineated by FunRich software (http://www.funrich.org).
KEGG and GO pathway enrichment analysis
The Database for Annotation, Visualization and Integrated Discovery (DAVID) (https://david.ncifcrf.gov/home.jsp; version 6.8) is an online suite of analysis tools. 20 We used the DAVID online tool to perform Gene Ontology (GO) and Kyoto Encyclopedia of Genes and Genomes (KEGG) analysis of common genes, with P < 0.05 indicating statistical significance. The online tool Metascape (http://metascape.org/gp/index.html) was used to visualize pathway and process enrichment analyses.
Protein–protein interaction (PPI) network analysis
The PPI network was constructed by the online tool Search Tool for the Retrieval of Interacting Genes (http://string.embl.de/). Next, Cytoscape visualization software (version 3.6.1) was used to visualize the network. 21 The judgment criterion was set as score >0.4.
Identification and analysis of hub genes
Significant modules were identified by the Cytoscape plug-in Molecular Complex Detection with degree cut-off = 2 and Max depth = 100. Then, cytoHubba, a free plug-in was used to determine hub genes when degrees ≥10.
Expression analysis of hub genes and survival analysis
UCSC Xena (https://xena.ucsc.edu/welcome-to-ucsc-xena/) was used to integrate public genomic data sets to analyze and visualize gene expression in tumors. Then, clustering analysis of hub gene expression levels was performed by heatmaps.
GEPIA is an online tool for analyzing gene expression in cancer and healthy samples (http://gepia.cancer-pku.cn/), 22 which we used to analyze the following survival times: 50 months, 100 months, 150 months, 200 months, and 250 months. GEPIA was also used to analyze the expression of hub genes in different tumor stages of NSCLC, and to verify the expression levels of hub genes. The following settings were used: Expression on Box Plots |Log2FC| Cutoff = 1, p-value cutoff = 0.01, jitter size = 0.4, and match TCGA data.
Candidate gene analysis
The methylation of candidate genes in NSCLC was assessed using DiseaseMeth version 2.0. 23 Additionally, the immune cell infiltration of candidate genes in NSCLC was analyzed by Tumor IMmune Estimation Resource. 24
CircRNA–miRNA–mRNA network construction
The circRNA–miRNA–mRNA network was constructed using Cytoscape visualization software (version 3.6.1; https://cytoscape.org/) according to the interaction between circRNA, miRNA, and mRNA.
Results
Screening of DECs, DEMs, and DEGs between NSCLC tumor and healthy tissues
Volcano plots show DECs, DEMs, and DEGs (Figure 1a–c). The five most significantly upregulated (hsa_circ_0017956, hsa_circ_0001998, hsa_circ_0007580, hsa_circ_0017109, and hsa_circ_0006006) and downregulated (hsa_circ_0072309, hsa_circ_0008234, hsa_circ_0006677, hsa_circ_0001947, hsa_circ_0072305) circRNAs were chosen to predict miRNAs. Basic information of these 10 differentially expressed circRNAs is shown in Table 1. Eight miRNAs (hsa-miR-598, hsa-miR-155, hsa-miR-644, hsa-miR-145, hsa-miR-637, hsa-miR-127-5p, hsa-miR-488, hsa-miR-369-5p) were found to be common between circRNA-predicted miRNAs and DEMs of dataset GSE102286 (Figure 1d). The 211 genes common to both the eight miRNA-predicted genes and DEGs of dataset GSE101929 are shown in a Venn diagram (Figure 1e).

Identification of differentially expressed circRNAs (DECs), miRNAs (DEMs), and genes (DEGs). Volcano plots show DECs (a), DEMs (b), and DEGs (c).
The top 10 most differentially expressed circRNAs.

Pathway and process enrichment analysis
Enrichment analysis showed that variations were predominantly enriched in cell projection morphogenesis, blood vessel morphogenesis, muscle cell proliferation, synapse organization, regulation of the MAPK cascade, regulation of cell junction assembly, and DNA replication initiation. Pathway and process enrichment analyses findings by Metascape are shown in Figure 2a–c.

Network of enriched terms. (a) Pathway and process enrichment analysis colored by cluster ID (b) and p-value (c).
PPI network and hub gene selection
The construction of a PPI network revealed 412 edges and 129 nodes (Figure 3a).The key module involved 21 nodes and 190 edges (Figure 3b).The top 10 hub genes were identified (HMMR, MCM10, NUSAP1, PBK, RRM2, ASF1B, OIP5, CDC6, DTL, and FANCI; Figure 3c).
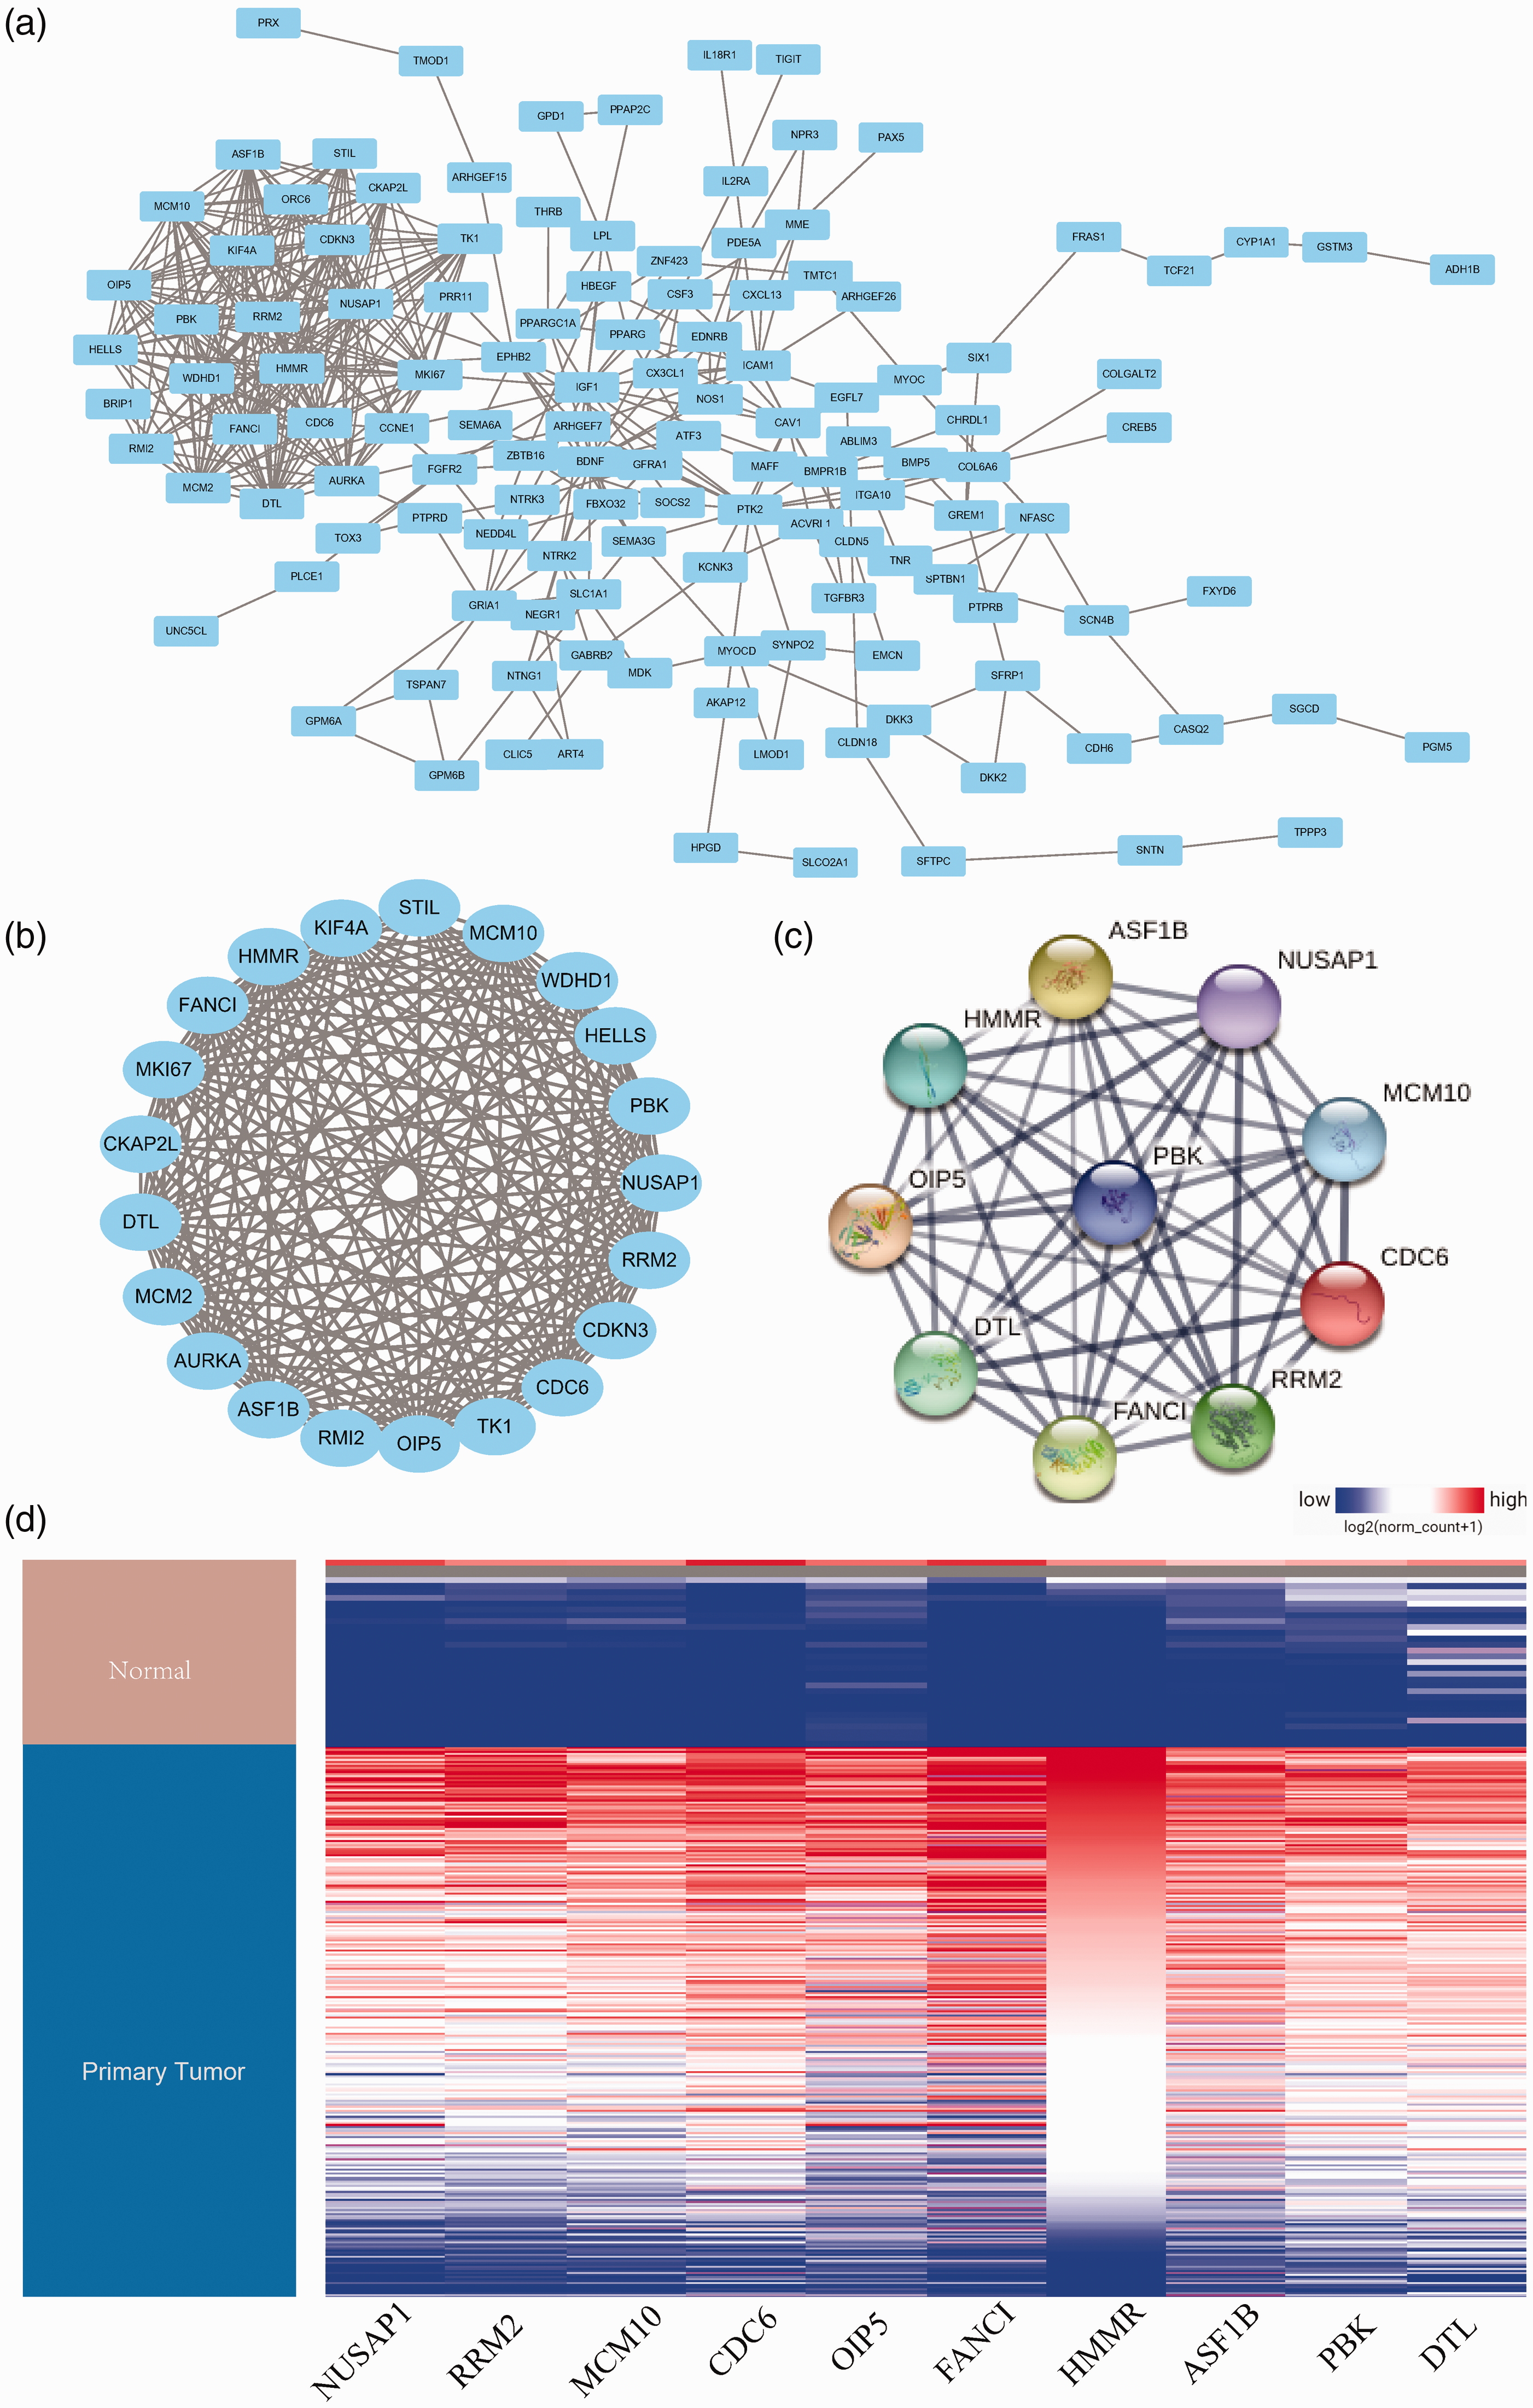
PPI network and expression analysis. (a) Protein–protein interaction (PPI) network of common genes, consisting of 412 edges and 129 nodes. (b) The most important module of the network map. (c) Hub genes identified within the PPI network. (d) Expression analysis in UCSC.
Hub gene analysis
Expression analysis in UCSC Xena showed that all 10 hub genes were highly expressed in NSCLC tumor tissues (Figure 3d). Survival analysis of the hub genes is shown in Figure 4a–j, and DTL and RRM2 were found to be significantly associated with patient prognosis (P < 0.05; Figure 4c, j) so were chosen as candidate genes. The correlation of hub genes and tumor stage is shown in Figure 5a–j, and suggested that these hub genes are involved in the occurrence and development of tumors and in promoting tumor progression. GEPIA analysis of hub gene expression in NSCLC is shown in Figure 6a–i.
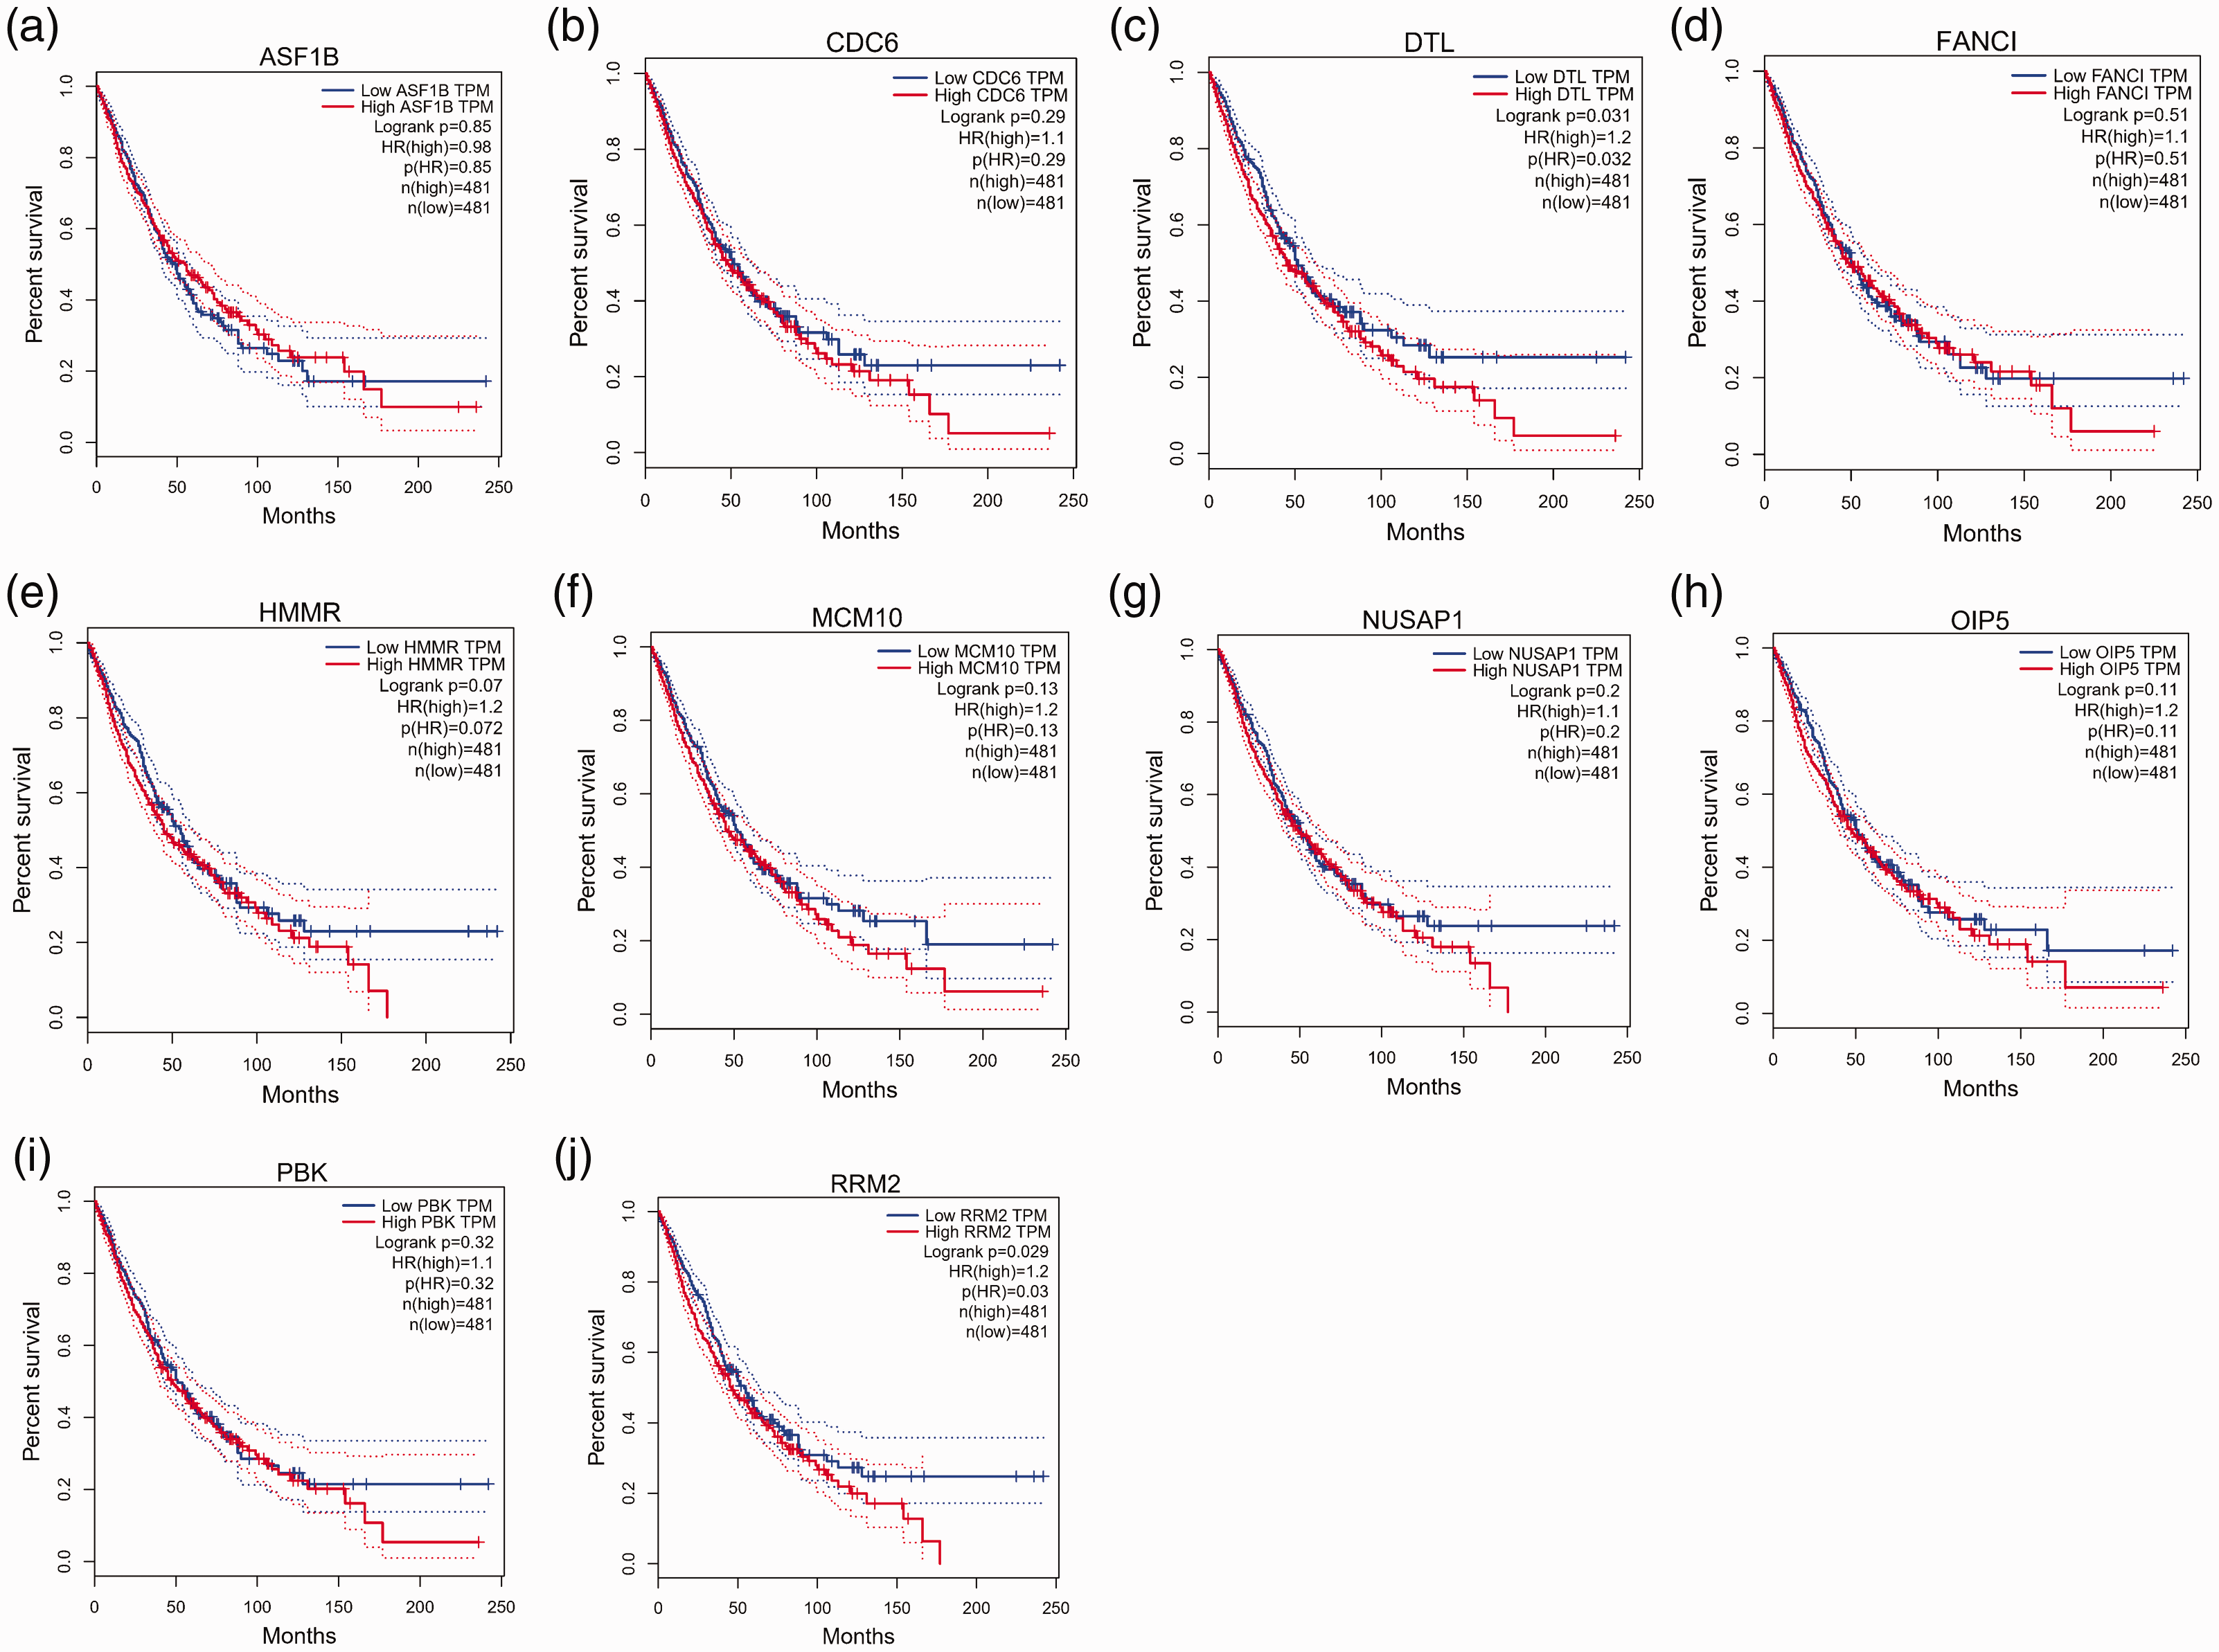
Survival analysis of hub genes. (a) ASF1B, (b) CDC6, (c) DTL, (d) FANCI, (e) HMMR, (f) MCM10, (g) NUSAP1, (h) OIP5, (i) PBK, and (j) RRM2.

The correlation of hub genes and the tumor stage. (a) ASF1B, (b) CDC6, (c) DTL, (d) FANCI, (e) HMMR, (f) MCM10, (g) NUSAP1, (h) OIP5, (i) PBK, and (j) RRM2.

Relative expression of the hub gene in NSCLC in GEPIA. (a) ASF1B, (b) CDC6, (c) DTL, (d) FANCI, (e) HMMR, (f) MCM10, (g) NUSAP1, (h) OIP5, and (i) RRM2.
Candidate gene analysis
The methylation levels of both DTL (Figure 7a, b) and RRM2 (Figure 7c, d) were lower in patients with lung adenocarcinoma and lung squamous cell carcinoma than in healthy controls. Immune infiltration analysis revealed a significant correlation between the expression of DTL and RRM2 and the abundance of immune infiltration in NSCLC (Figure 8a–d).

The methylation level of DTL and RRM2 in patients with lung adenocarcinoma and lung squamous cell carcinoma. (a, b) DTL and (c, d) RRM2.

Correlation analysis of hub gene expression and immune infiltration. (a, b) DTL and (c, d) RRM2.
Network construction
The circRNA–miRNA–mRNA network of NSCLC is shown in Figure 9a. Notably, the hsa_circ_0001947/hsa-miR-637/RRM2 and hsa_circ_0072305/hsa-miR-127-5p/DTL networks were found to be of interest and deserve further study (Figure 9b).

The circRNA–miRNA–mRNA network. (a) All related molecules. (b) The hub genes most significantly associated with miRNAs and circRNAs.
Discussion
NSCLC includes squamous cell carcinoma, adenocarcinoma, and large cell carcinoma, and accounts for approximately 80% of all lung cancers. 25 Because many NSCLC patients are in the advanced stage of disease at the time of diagnosis and as tumors are prone to recurrence, the patient 5-year survival rate is far from satisfactory. 2 Surgical resection is most effective for patients with early-stage disease, while chemotherapy and bio-targeted therapy are recommended for those at middle and advanced stages.8,26 Mitchell et al. identified multiple differentially expressed molecules in African–American and European–American patients with NSCLC through genetic and miRNA sequencing. They also used functional enrichment analysis and tumor immune microenvironment analysis to investigate the mechanism of NSCLC and the potential of immunotherapy. 27
In the present study, multiple differentially expressed molecules were found from the sequencing data of circRNAs, miRNAs, and mRNAs in NSCLC through bioinformatic analysis. CircRNAs most significantly altered in expression were used to predict relevant miRNAs, and the intersection of predicted miRNAs and DEMs calculated by datasets was determined. Furthermore, intersection miRNAs were successfully used to predict related mRNAs, and multiple genes common to these mRNAs and DEGs were identified. GO and KEGG analyses of common intersection genes enabled the construction of a PPI network and identification of hub genes (HMMR, MCM10, NUSAP1, PBK, RRM2, ASF1B, OIP5, CDC6, DTL, and FANCI) most likely to participate in NSCLC from the intersection genes. Finally, we constructed the circRNA–miRNA–mRNA network and identified regulatory molecule networks hsa_circ_0001947/hsa-miR-637/RRM2 and hsa_circ_0072305/hsa-miR-127-5p/DTL as potentially playing important roles in the occurrence and development of NSCLC. Candidate gene analysis involving an assessment of gene methylation levels and survival analysis of NSCLC data in the TCGA database identified RRM2 and DTL as having lower methylation in NSCLC patients than healthy controls, and being significantly correlated in expression levels with the abundance of immune infiltration in NSCLC.
RRM2 encodes ribonucleotide reductase regulatory subunit M2, which regulates ribonucleoside-diphosphate reductase activity, protein binding, and transcription in G1/S transition of the mitotic cell cycle, as well as DNA replication, oxidation-reduction, and G0 to G1 transition. The abnormal expression of RRM2 is seen in the occurrence and development of several diseases. Altinkilic et al found that RRM2 may participate in the occurrence and development of atherosclerotic plaques in the coronary arteries by regulating DNA damage repair. 28 Zhong et al showed that RRM2 is highly expressed in gastric cancer tissues, and that it may affect the proliferation and migration of gastric cancer cells by regulating AKT and nuclear factor-κB signaling pathways, suggesting that it could be used as a target for early diagnosis and treatment of gastric cancer. 29 Additionally, Castelblanco et al constructed a predictive model showing that RRM2 can be used to distinguish thyroid tumors from benign lesions, and providing new insights for the early diagnosis and treatment of thyroid tumors. 30 Similarly, Li et al reported that RRM2 participates in the occurrence and development of glioblastoma by regulating cell apoptosis, proliferation, and migration, indicating its potential as a therapeutic target. 31 Furthermore, Yang et al found that RRM2 is regulated by LINC00667/miR-143-3p and that it may affect the proliferation of NSCLC cells, thus affecting the prognosis of patients and suggesting that related molecules may be used as treatment targets. 32 Here, we observed that RRM2 is highly expressed in NSCLC patients, and survival analysis revealed a correlation between high expression and poor prognosis. We also detected significant RRM2 methylation changes in patients with NSCLC, and a significant correlation between RRM2 expression and multiple immune infiltrations was found. We speculate that RRM2 participates in the occurrence and development of NSCLC by regulating the cell cycle, apoptosis, and inflammation levels. The hsa_circ_0001947/hsa-miR-637/RRM2 network may serve as a target for the early diagnosis and specific treatment of NSCLC, and the related regulatory mechanism deserves further study.
DTL encodes denticleless E3 ubiquitin protein ligase homolog, which is mainly involved in the regulation of ubiquitin-protein transferase activity, protein polyubiquitination, DNA replication, and G2/M transition of the mitotic cell cycle. The abnormal expression of DTL is involved in the occurrence and development of various diseases. Baraniskin et al found that miR-30a-5p affected the cell cycle and apoptosis of colon cancer cells by regulating the expression of DTL, 33 while Perez et al detected abnormal DTL expression in patients with breast cancer which was associated with poor prognosis. Further analysis found that DTL may affect the sensitivity of tumor cells to drugs by regulating protein ubiquitination. 34 Additionally, Cui et al demonstrated that DTL may affect the apoptosis and proliferation of tumor cells by regulating the ubiquitination degradation of programmed cell death. 35 Thus, DTL could serve as a target biomarker for the immunotherapy of various tumors, offering new clues for tumor immunotherapy. Similar to this research, we found that DTL was highly expressed in NSCLC patients, and survival analysis found that high expression was associated with poor prognosis. Furthermore, we detected significant DTL methylation changes in patients with NSCLC, and found a correlation between DTL expression and multiple immune infiltrations. We speculate that DTL may also participate in the occurrence and development of NSCLC by regulating the cell cycle, apoptosis, and cellular information conduction. The hsa_circ_0072305/hsa-miR-127-5p/DTL network could also serve as a target for the early diagnosis and specific treatment of NSCLC, and the related regulatory mechanism deserves further exploration.
Despite the rigorous bioinformatics analysis of this study, there are still some shortcomings. First, the sample size in the dataset was small, so should be further expanded to obtain more accurate results. Second, functional verification experiments need to be performed.
In conclusion, bioinformatics analysis appears to be a useful tool to explore the pathogenesis and therapeutic targets of NSCLC. We successfully constructed a circRNA–miRNA–mRNA network of NSCLC, and the identified molecules may be involved in the occurrence and development of NSCLC so could serve as molecular targets for early diagnosis and specific treatment.
Footnotes
Author contributions
Xueying Cai and Lixuan Lin performed the experiments and were major contributors in writing and submitting the manuscript. Weixin Wu and An Su made substantial contributions to research conception and designed the research process. Qiuhua Zhang, Xueying Cai, and Lixuan Lin critically revised the manuscript for important intellectual content. All authors read and approved the final manuscript.
Acknowledgements
We are thankful to Chen Xi for her suggestions during the submitting process.
Availability of data and materials
The datasets used and/or analyzed during the current study are available from the corresponding author on reasonable request.
Declaration of conflicting interest
The authors declare that there is no conflict of interest.
Ethics approval and consent to participate
The data of this research were downloaded from the GEO database. All institutional and national guidelines for the care and use of participants were followed.
Funding
This research received no specific grant from any funding agency in the public, commercial, or not-for-profit sectors.
Patient consent for publication
Not applicable.