
Abstract
Objective
To investigate the prevalence of hyperuricemia in patients at different stages of chronic kidney disease (CKD) and the association of serum uric acid (SUA) with several clinical factors in a retrospective cross-sectional study of non-dialysis CKD patients at two hospitals in Shanghai, China.
Methods
The prevalence of hyperuricemia in CKD patients and the association of SUA with other clinical factors were examined using analysis of variance, chi-squared test, multivariate analysis, and other statistical methods.
Results
A total of 663 CKD patients were enrolled, of which approximately 52% had hyperuricemia. CKD patients with hyperuricemia had lower hemoglobin and estimated glomerular filtration rate (eGFR) levels but higher blood urea nitrogen, serum creatinine, and serum phosphate levels than those without hyperuricemia. Serum uric acid level was positively associated with age, blood urea nitrogen , serum creatinine, cystatin C, and serum phosphate and negatively associated with hemoglobin and eGFR. In addition, CKD patients with anemia and hyperphosphatemia had a higher prevalence of hyperuricemia than those without anemia or hyperphosphatemia.
Conclusions
The prevalence of hyperuricemia increased with CKD progression supporting the use of urate-lowering treatment for patients with CKD stage 1 to 4.
Introduction
In the past 25 years, chronic kidney disease (CKD) has become a significant public health concern and a leading contributor to all-cause mortality globally.1,2 In China, the overall prevalence of CKD was approximately 10.8% in 2012, corresponding to approximately 119.5 million patients. 3 In most countries, the overall prevalence of CKD is expected to increase in the future with a growing aging population. Therefore, it is a high priority in clinical research to identify the modifiable factors affecting the progression of CKD.
In addition to conventional risk factors such as hypertension and diabetes, hyperuricemia has been recently reported as an independent risk factor for the progression of CKD.4–8 Hyperuricemia, diagnosed from an abnormally high blood level of uric acid, emerges as an important “hyper-disease” after hypertension, hyperglycemia, and hyperlipidemia along with changes in lifestyle and conditions associated with economic development. Hyperuricemia results in not only the precipitation of urate in the renal tubules but also glomerular hypertension by inducing arteriolopathy in preglomerular vessels. 9 In contrast, progressive renal dysfunction has also been reported to increase blood uric acid levels by increasing the reabsorption of uric acid by the impaired kidney mediated by urate transporters such as urate anion transporter 1 (URAT1), organic anion transporter 4 (OAT4), and glucose transporter 9 (GLUT9).10,11 The controversy in these findings reiterates the complicated relationship between hyperuricemia and CKD and subsequent difficulties in formulating specific recommendations for the management of patients with hyperuricemia and CKD. In addition, both CKD and hyperuricemia have multiple causative factors, some of which are unique, environmentally specific, lifestyle-associated, or diet-related.12,13 Therefore, it is critical that clinicians understand the characteristics of hyperuricemia in patients with CKD and thus provide appropriate treatment. Here, we report the prevalence, correlation, and associated factors for hyperuricemia in a retrospective cross-sectional study among patients with CKD at two hospitals in Shanghai, China.
Materials and methods
This retrospective cross-sectional study was conducted on the north campus of Shanghai Ninth People’s Hospital and Fengxian Hospital from 1 February 2014 to 31 January 2015. The study was conducted according to the principles of the Declaration of Helsinki and was approved by the ethics committees of both hospitals. Written informed consent was obtained from all participating patients. Patients eligible for inclusion included 1) patients with a primary diagnosis of CKD attending the outpatient and inpatient departments at one of the two participating hospitals; 2) patients aged 18 years or older; 3) patients willing to participate in the study and who provided written informed consent. Patients were excluded if they 1) had severe co-morbidities such as cancer, infectious disease, chronic respiratory system disease, chronic digestive system disease, circulatory disease, or diabetes with HbA1c > 7.5%; 2) were receiving clinical treatment of heart failure, unstable angina, or stroke; 3) had hydronephrosis induced by posterior renal obstruction; 4) had a history of gout, or 5) were undergoing dialysis. The clinical data obtained from the participants included gender, age, disease diagnosis, and levels of serum creatinine (SCr), blood urea nitrogen (BUN), serum uric acid (SUA), serum cystatin C, blood hemoglobin (Hb), serum creative reactive protein (CRP), blood glucose (Glu), total protein, serum albumin, serum calcium (SCa), and serum phosphate (SP). The estimated glomerular filtration rate (eGFR) was calculated based on the individual SCr level using the online Chronic Kidney Disease Epidemiology Collaboration (CKD-EPI) calculator (https: //www.kidney.org/professionals/KDOQI/gfr_calculator), without removing the body surface adjustment. Patients were diagnosed as having hyperuricemia if they had a SUA level > 420 µmol/L for males and for females aged > 60 years, or > 360 µmol/L for females ≤60 years at two separate laboratory tests. 14 CKD was defined as either (1) renal damage caused by a structural or functional abnormality with or without reduced eGFR for > 3 months or (2) eGFR value < 60 mL/min per 1.73 m2 for > 3 months. CKD stage was classified according to KDIGO guidelines, based on eGFR values, as stage 1 (eGFR ≥ 90 mL/min per 1.73 m2), stage 2 (eGFR 60–89 mL/min per 1.73 m2), stage 3 (eGFR 30–59 mL/min per 1.73 m2), stage 4 (eGFR 15–29 mL/min per 1.73 m2), and stage 5 (eGFR < 15 mL/min per 1.73 m2). Anemia was defined as hemoglobin < 130 g/L for males and 120 g/L for females. Hyperphosphatemia was defined as serum phosphate > 1.46 mmol/L and hypophosphatemia was defined as serum phosphate < 0.81 mmol/L.
The study database was generated using Microsoft Excel (2016). Categorical data were expressed as frequencies (percentages) and continuous data were expressed as mean ± SD unless indicated otherwise. Comparisons of data were performed using chi-squared tests, independent sample t-tests, two-tailed Mann–Whitney tests, Kruskal–Wallis tests, or analysis of variance (ANOVA), as applicable. Data were analyzed using MedCalc (MedCalc, Ostend, Belgium) and IBM SPSS (SPSS Inc. Chicago, IL) software. Values of p < 0.05 were considered statistically significant.
Results
Patient demographics
A total of 691 patients were enrolled to this study. Based on the exclusion criteria, 15 patients with a history of gout, 10 with diabetes with HbA1c > 7.5%, and 3 with infectious diseases were excluded. Therefore, 663 patients with CKD from stage 1 to stage 5 were included in the analysis. The mean, standard deviation (s.d.), and minimum and maximum values for age, gender, Hb, SCr, CRP, BUN, serum cystatin C, blood glucose, SCa, SP, total protein, serum albumin, and eGFR for the participants are presented in Table 1. The distributions of these data were all non-normal. Among the participants, 354 patients were from the north campus of Shanghai Ninth People’s Hospital and 309 patients from Fengxian Hospital. A significant difference was observed in gender distribution, CRP, total protein, albumin, BUN, SUA, and serum phosphate between patients from the two hospitals (Table 1).
Patient demographics.

Data are presented as mean ± s.d. (minimum–maximum, 25th–75th percentiles). The p-value was determined using the chi-squared test for gender while a two-tailed Mann–Whitney test was used for other parameters.
aOne datum was missing. bSome data were missing for cystatin C. The data numbers from Ninth Hospital and Fengxian Hospital were 232 and 292, respectively. The data numbers for non-hyperuricemia and hyperuricemia groups were 264 and 260, respectively.
Hb, hemoglobin; CRP, C-reactive protein; BUN, blood urea nitrogen; SCr, serum creatinine; SUA, serum uric acid; eGFR, estimated glomerular filtration rate.
Renal dysfunction increases the prevalence of hyperuricemia
The overall prevalence of hyperuricemia among included patients was 52.0% (345/663, Table 1). However, the prevalence of hyperuricemia varied according to CKD stage and increased with disease progression. The prevalence of hyperuricemia in patients with CKD stage 3 was comparable to the overall prevalence, but was significantly higher in patients with CKD stages 4 and 5. As expected, the prevalence of hyperuricemia in patients with CKD stages 1 and 2 was lower than that for CKD stage 3 (Table 2).
Prevalence of hyperuricemia in patients with CKD at different stages.

* Data are presented as mean ± s.d. (minimum–maximum, 25th–75th percentiles). The statistical difference in hyperuricemia prevalence and gender was determined using the chi-squared test while the Kruskal–Wallis test with post-comparison using the Conover test was used for other parameters. Different superscript letters indicate a significant difference among groups (p < 0.05).
†One datum of CRP in the CKD 4 group was missing. The data numbers for cystatin C for CKD stages 1, 2, 3, 4, and 5 were 66, 78, 136, 94, and 150, respectively.
Hb, hemoglobin; CRP, C-reactive protein; BUN, blood urea nitrogen; SCr, serum creatinine; SUA, serum uric acid; eGFR, estimated glomerular filtration rate.
To further investigate the association between renal function and hyperuricemia prevalence, the correlation between SUA and serum Cr, cystatin C, BUN, and eGFR was analyzed. As illustrated in Table 3, SUA had a significant positive correlation with serum Cr, cystatin C, and BUN and a significant negative correlation with eGFR.
Correlation between uric acid and other clinical features.

Correlations of serum uric acid with other clinic features were determined using Spearman’s test. Hb, hemoglobin; CRP, C-reactive protein; BUN, blood urea nitrogen; SCr, serum creatinine; SUA, serum uric acid; eGFR, estimated glomerular filtration rate.
Hyperuricemia affects stage distribution in CKD
To determine whether hyperuricemia affects CKD progression, we analyzed the distribution difference between patients with and without hyperuricemia. The results indicated that hyperuricemia significantly changes the stage distribution of CKD patients. Specifically, the proportion of patients with CKD stage 1 or 2 in the non-hyperuricemia population was greater than that in the hyperuricemia population. In contrast, the proportion of patients with CKD stage 4 or 5 in the hyperuricemia population was greater than that in the non-hyperuricemia population. Interestingly, the prevalence of CKD stage 3 was comparable between the hyperuricemia and non-hyperuricemia populations (Figure 1).

Hyperuricemia changes the stage distribution in CKD patients. * 0.01 < P ≤ 0.05, and ****P ≤ 0.0001, gender difference between hyperuricemia and non-hyperuricemia was determined using a chi-squared test. The difference in stage distribution was significant (P < 0.0001), as determined using a chi-squared test. NHYU, non-hyperuricemia; HYU, hyperuricemia; F, female; M, male.
Gender difference in CKD patients with or without hyperuricemia
There were 377 males included in the present study, corresponding to 56.9% of the population (Table 1). A significant difference in gender was also found among patients at different CKD stages. The percentage of the males was comparative among CKD stages 2 to 4, and was significantly higher than that for patients with CKD stage 1 (Table 2). Moreover, a significant difference in gender was found between the hyperuricemia and non-hyperuricemia populations. The percentage of males was 70% in patients with hyperuricemia, which significantly higher than that in the non-hyperuricemia population (Table 1). Interestingly, a non-significant difference in gender was found within the hyperuricemia and non-hyperuricemia populations.
Correlation of renal function with other clinical features
To investigate the possible correlation of renal function with other clinical features, we analyzed the correlation of eGFR with other clinical features (Table 1). As expected, eGFR had a significant negative correlation with SCr, BUN, serum cystatin C, age, and SP. eGFR also had a significant positive correlation with Hb, serum albumin, and total protein but a significant negative correlation with SUA.
Impact of age on the prevalence of hyperuricemia and stage distribution in CKD
SUA levels correlated significantly with age in the study population. However, the correlation coefficient of SUA with age was < 0.1 (Table 3). When we classified the age of patients into seven periods, as shown in Figure 2, the impact of age on the prevalence of hyperuricemia was non-significant. The gross prevalence of hyperuricemia at most age periods was approximately 50%, except for patients aged 41 to 50 years. The percentage of CKD patients aged 41 to 50 years old with hyperuricemia (64.3%) was greater than that for patients without hyperuricemia (35.7%) at the same age period (Figure 2). In contrast, age had a significant impact on stage distribution in the study population. Specifically, for patients < 40 years, most were in the early stages of CKD (CKD stages 1–2). However, for patients aged 51 to 80 years, most had end-stage renal disease (CKD stage 5) (Figure 2).

Age affects the prevalence of hyperuricemia (a) and stage distribution in CKD patients (b). *0.01 < P ≤ 0.05, **0.001 < P ≤ 0.01, and ****P ≤ 0.0001, gender difference between hyperuricemia and non-hyperuricemia or among different stages of CKD population determined was determined using a chi-squared test. The difference in stage distribution was significant (P < 0.0001), as determined using a chi-squared test.
Association of anemia with prevalence of hyperuricemia and stage distribution in CKD
The serum Hb level significantly correlated with both SUA and renal function in the study population (Tables 3 and 4). In the overall population, with the majority of patients had anemia. However, the percentage of patients with anemia differed significantly according to CKD stage, and increased progressively with worsening of CKD (Figure 3). Furthermore, the presence of anemia significantly correlated with the prevalence of hyperuricemia. Among the study participants, the percentage of patients with anemia was greater in the hyperuricemia group than in the non-hyperuricemia group (Figure 3).
Correlation of eGFR with other clinical features in CKD.

Correlations of serum uric acid with other clinic features were determined using Spearman’s test. Hb, hemoglobin; CRP, C-reactive protein; BUN, blood urea nitrogen; SCr, serum creatinine; SUA, serum uric acid; eGFR, estimated glomerular filtration rate

Anemia affects the prevalence of hyperuricemia (a) and stage distribution in CKD patients (b). *0.01 < P ≤ 0.05, the significance of the difference in prevalence of hyperuricemia between anemia and non-anemia patients was determined using a chi-squared test; and ****P ≤ 0.0001, the difference in the stage distribution between anemia and non-anemia patients was determined using a chi-squared test.
Association between serum phosphate level and hyperuricemia prevalence and stage distribution in CKD
SP levels were found to correlate significantly with SUA and renal function in the study population (Tables 3 and 4). When CKD patients were divided into three groups by SP level as shown in Figure 4, the prevalence of hyperuricemia was about 1.8-fold of that of non-hyperuricemia for patients with hyperphosphatemia. However, for CKD patients with normal SP levels, the prevalence of non-hyperuricemia was slightly greater than that of hyperuricemia. In addition, for patients with hypophosphatemia, the prevalence of non-hyperuricemia was approximately 5.4-fold that of hyperuricemia. Furthermore, the CKD stage distribution varied significantly among the three groups with different SP levels (Figure 4). Specifically, for CKD patients with normal SP levels, the majority of patients were at CKD stage 3. However, for patients with hyperphosphatemia, the majority were at CKD stage 5.

Serum phosphate with prevalence of hyperuricemia (a) and stage distribution in CKD patients (b). *0.01 < P ≤ 0.05 and ****P ≤ 0.0001, gender difference between hyperuricemia and non-hyperuricemia or among different stages of CKD was determined using a chi-squared test. The differences in prevalence of hyperuricemia and in the stage distribution among patients with different SP levels were significant (P < 0.0001), as determined using a chi-squared test.
Logistic regression analysis of hyperuricemia and other clinical features
We conducted univariate logistic regression analysis for hyperuricemia with the other clinical features listed in Table 3 and identified Cr, BUN, CRP, Hb, SP, cystatin C, and eGFR as potential significant factors for hyperuricemia. The associated coefficients and constants of these factors are presented in Table 5. Next, we then performed multivariate logistic regression analysis for hyperuricemia with the identified factors and found that CRP, SCr, SP, cystatin C, and eGFR were nonsignificant. Therefore, these variables were excluded from the final multivariate logistic regression analysis, which resulted in formula (1) to predict the probability of hyperuricemia (Table 5), as below: p/(1−p) = Exp (0.10378*BUN + 0.00976* Hb−2.25018)(1)
Univariate and multivariate logic regression analyses of hyperuricemia with other clinical features.
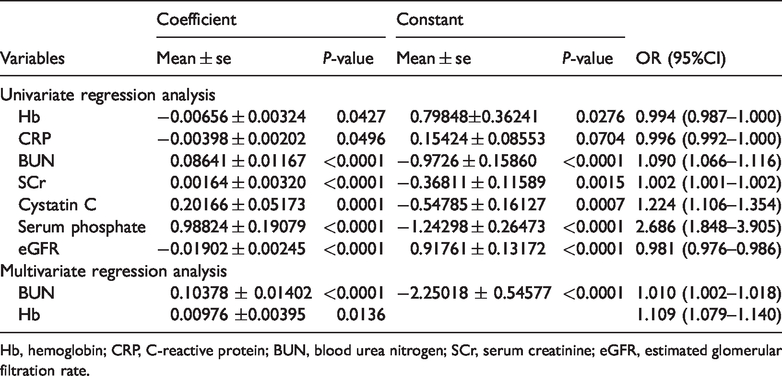
Hb, hemoglobin; CRP, C-reactive protein; BUN, blood urea nitrogen; SCr, serum creatinine; eGFR, estimated glomerular filtration rate.
where p is the probability of the presence of hyperuricemia. Using this formula, if values of p > 0.5 represent a higher likelihood of hyperuricemia, the overall accuracy of hyperuricemia prediction was 63.3%. In addition, when classification factors for CKD stages were applied (1–5 corresponding to CKD stage), presence of anemia (1 = presence; 0 = absence), and phosphate status (1: SP < 0.81 mmol/L; 2: 0.81 ≤ SP ≤ 1.46 mmol/L; and 3: SP>1.46 mmol/L), multivariate regression analysis of hyperuricemia with CKD stage, presence of anemia, and phosphate status resulted in an overall accuracy of case prediction of 66.4%. However, because the SUA measurement is a routine clinical test, it is meaningless to predict the presence of hyperuricemia according to other clinical features.
Discussion
In the present study, the prevalence of hyperuricemia and related risk factors for hyperuricemia was examined among patients with CKD at two hospitals in Shanghai, China. The overall prevalence of hyperuricemia in the study population was approximately 52%, which is lower than that reported in previous studies by Marie et al. 14 and Adejumo et al. 15 These differences may be attributable to the populations in the previous studies being from Cameroon and Nigeria, respectively, and may have had significant differences in diet and lifestyle as well as ethnicity than in the population examined in the present study. Overall, the prevalence of hyperuricemia in CKD patients is markedly higher than that in the general population,16–18 and also differs according to the stage of CKD. In CKD stages 1 to 4, the prevalence of hyperuricemia increased with CKD progression, which supports the previous finding that renal dysfunction increases uric acid accumulation. However, the overall prevalence of hyperuricemia was comparable between patients with CKD stages 4 and 5 (Table 2), consistent with the mean SUA levels. When the CKD stage distribution was compared between hyperuricemia and non-hyperuricemia groups, the percentage of CKD stage 3 patients was similar between the two groups. However, the percentage of CKD stage 5 patients in the hyperuricemia group was greater than that of CKD stage 3 patients (Figure 1). Furthermore, the mean SUA level increased with CKD progression for CKD stages 1 to 4 (Table 2). These data indicate that increased SUA levels may exacerbate the progression of CKD during stages 1 to 4, suggesting that urate-lowering therapy may be critical for delaying CKD progression for patients in these disease stages. However, renal dysfunction appears to be the determining factor for SUA in this population. These findings support those in a previous study by Krishnan et al. 19 Taken together, the study findings indicate that renal dysfunction facilitates the accumulation of uric acid. However, a prospective longitudinal study including hyperuricemia and non-hyperuricemia populations without CKD is required to clarify the potential causative effect of SUA on CKD progression.
Age is a factor affecting CKD, and the mean age of patients in the present study with CKD stage 1 to 4 increased with CKD progression. The average age of patients with CKD stage 5 was comparable with that of patients with CKD stage 3, indicating that renal dysfunction progressed rapidly among patients with CKD stage 5. This finding may also indicate that there are other risk factors involved in CKD progression. Although SUA was significantly associated with age (Table 3), 20 we observed a non-significant difference in age between CKD patients with and without hyperuricemia (Table 1), indicating that the prevalence of hyperuricemia strongly depends on renal function rather than on age. As expected, gender plays an important role in the prevalence of CKD-associated hyperuricemia. 16 Multiple factors contribute to the gender difference in the prevalence of hyperuricemia in CKD. In addition to differences in food consumption and lifestyle between male and female patients, sex-specific hormones such as estrogen are known to increase urate excretion. 21
Hb was found to have a significant positive association with eGFR and negative association with SUA. Anemia was associated not only with increased prevalence of hyperuricemia but also with severe renal dysfunction, as expected (Figure 3). We suggest that the association of anemia with prevalence of hyperuricemia can primarily be attributed to renal dysfunction. Although our findings are consistent with those of a previous study by Doualla et al., 14 the previous researchers considered this to be an incidental finding for the small sample size (103) in their study. In the atherosclerosis risk in the communities (ARIC) study, McAdams-DeMarco et al. reported that anemia was associated with an approximately two-fold increased risk of “self-reported” gout, independent of renal function. The mechanism underlying this association was not clearly outlined, but was hypothesized to be mediated by oxidative stress. 22 Increased oxidative stress has been observed in anemia that can cause hyperuricemia by increasing xanthine oxidase activity and cell death/turnover. 23
Hyperphosphatemia is a common comorbidity among patients with CKD as the kidneys play a critical role in the excretion of phosphate. In the present study, SUA had a significant positive correlation with SP (Table 3), and hyperphosphatemia was thus associated with increased prevalence of hyperuricemia (Figure 4). Surprisingly, 4.8% of CKD patients (32/663) had SP levels below the normal range, and among these patients the prevalence of hyperuricemia was lower than that for patients with normative serum phosphate and hyperphosphatemia. Although the mechanisms underlying the association between SP and SUA remain largely unknown and require further investigation, we suggest that renal dysfunction may represent a critical link between SUA and SP.
Of interest, the distribution of the ratio of SUA to Cr (Figure 5) may indicate differences in management for CKD patients with hyperuricemia. The population with an SUA/SCr ratio among the upper and lower outliers includes patients with or without hyperuricemia. Those with hyperuricemia and an SUA/SCr ratio among the lower outliers included patients who might not require specific therapeutic intervention to lower their SUA level. In contrast, patients with hyperuricemia and an SUA/Cr ratio among the upper outliers may require control of UA biosynthesis to reduce their SUA level. However, this hypothesis requires further examination in a future multicenter, large-scale prospective clinical trial.

Distribution of the ratio of serum uric acid to serum creatinine. Left: scatter plot with mean ± s.d.; right: box-and-whisker plot with 2.5th to 97.5th percentile.
A limitation of the present study was its retrospective observational design, meaning that some data that may affect CKD and hyperuricemia such as height, body weight, BMI, diet, lifestyle, medication history, and anthropometric data were incomplete. A future well-designed, large-scale, multicenter prospective trial among patients with hyperuricemia with and without CKD and non-hyperuricemia with and without CKD may clarify the relationship between renal dysfunction and SUA and the risk factors for CKD and hyperuricemia.
Among the CKD patients from two hospitals in Shanghai in the present study, approximately half had hyperuricemia. SUA was significantly associated with eGFR, Hb, SP, age, and gender. However, as all participants were patients with CKD, the results and conclusions of the present study cannot be readily extended to other populations.
Footnotes
Acknowledgements
We are grateful to all individuals who contributed to this study, especially the medical staff of the Division of Nephrology, Ninth People’s Hospital Affiliated to the School of Medicine of Shanghai Jiaotong University, and the Division of Nephrology, Fengxian Hospital Affiliated to Anhui University of Science and Technology.
Declaration of conflicting interest
The authors declare that there is no conflict of interest.
Funding
This research received no specific grant from any funding agency in the public, commercial, or not-for-profit sectors.