
Abstract
Objective
To explore the dose-response relationship and gender differences between serum uric acid (SUA) and total cholesterol (TC) in Chinese individuals.
Methods
This cross-sectional study included secondary data of Chinese adults, collected between 2010 and 2018. The exposure variable was SUA, the outcome variable was TC, and participants were split into five quantiles by SUA levels (Q1 [men, ≤283; women, ≤223] to Q5 [men, ≥416; women, ≥332]). Covariates included age, gender, laboratory and examination information. Multivariable linear regression and subgroup analysis were performed to examine the independent association between SUA and TC. Smooth curve fitting and threshold effect analysis was employed to assess potential non-linear relationships. Additionally, a sensitivity analysis was conducted to validate the robustness of the findings.
Results
The analysis included 6119 participants, of whom, 4078 (66.6%) were female, with a mean age of 63.7 years. After adjusting for potential confounders, SUA showed a significant association with TC in both men (β = 0.09; 95% confidence interval [CI] 0.05, 0.14) and women (β = 0.13; 95% CI 0.10, 0.17). The Q5 group exhibited higher TC levels than the Q1 group in both men (β = 0.26; 95% CI 0.16, 0.37) and women (β = 0.25, 95% CI 0.17, 0.32). In women, there was an inverted L-shaped relationship between SUA and TC with an inflection point at 359.962 μmol/L, whereas a linear relationship was exhibited in men. Subgroup analysis showed no significant interactions in men. Sensitivity analyses confirmed the robustness of the findings.
Conclusions
Significant sex differences and dose-response relationships exist between SUA and TC in the Chinese population. The study may provide new insights into cholesterol management.
Keywords
Introduction
Blood lipids are the total cholesterol (TC), triglycerides and various lipids, such as phospholipids, found in serum. Of these, cholesterol and triglycerides are the lipids most closely associated with clinical disease. Hypercholesterolemia is the most common type of lipid abnormality, characterized by a TC level ≥6.22 μmol/L (≥240 mg/dL). 1 Both genetic and non-genetic factors (such as diabetes, obesity or unhealthy lifestyle) contribute to the development of hypercholesterolemia, with the latter being more common. 2 The age-standardized mortality rate from coronary heart disease in the USA showed a downward trend from 1968 throughout the remainder of the 20th century, with a decline of more than 40% from 1980 to 2000, of which, the contribution of risk-factor control accounted for 44%, with the largest contribution coming from the reduction of TC levels, accounting for 24%. 3 However, the prevalence of blood lipid abnormalities among Chinese adults has remained high in recent years. 4 The results of a national survey showed that the overall prevalence of blood lipid abnormalities in adults aged ≥18 years was 35.6%, with the most significant increase being the prevalence of hypercholesterolemia. 5 The awareness, treatment and control rates of blood lipid abnormalities among the Chinese population are low. 6 Therefore, China is facing a continuous increase in the burden of atherosclerotic cardiovascular disease, 7 and lipid management is urgently needed.
Serum uric acid (SUA) is a metabolic byproduct of purine nucleotides in the body. About 80% of purines come from cell metabolism, while 20% are from food. The liver metabolizes purines into SUA, which is then excreted by the kidneys and intestines. 8 Hyperuricemia is usually defined as SUA level >420 μmol/L (7 mg/dl), 9 and is often caused by disorders of purine metabolism and/or decreased SUA excretion. Rapid economic development and significant lifestyle changes have markedly increased the prevalence of hyperuricemia and gout in China. 10 Currently, hyperuricemia affects 13.3% of the population, while gout prevalence ranges from 1% to 3% and continues to rise annually. 11 Hyperuricemia is closely associated with the onset and development of cardiovascular and cerebrovascular disease.12,13
Previous studies have shown a positive correlation between hyperuricemia and TC; 14 this association appears to be consistent across different age groups,15–17 and is particularly significant in patients with gout and metabolic syndrome. However, research in the general population is limited. Additionally, the association between hyperuricemia and TC remains unclear regarding differences in gender. Firstly, gender differences in SUA levels and TC are conflicting in previous studies.18,19 Secondly, gender differences and the dose-response relationship between SUA and TC in the general population are not well understood.20,21 Therefore, it remains important to investigate the relationship between gender differences in SUA and TC in the general population. The aim of the present study was to examine gender differences and the dose-response relationship between SUA levels and TC utilizing baseline data from a large community survey in southeastern China.
Participants and methods
Study population and study design
The original data for this cross-sectional study were collected from communities in southeastern China between 2010 and 2018, as previously described by Luo et al. 20 The research was approved by the Ethics Committee of Hangzhou Normal University School of Public Health (20220009). 20 Informed consent was waived for the present study due to the retrospective study design. All participant details were deidentified and data from the initial health check-ups were included to perform a cross-sectional analysis based on scientific hypotheses. The study was performed according to the 1975 Helsinki Declaration, as revised in 2013.
The study design and methodology have been previously described in detail. 20 Briefly, participants were excluded from the study if they met any of the following criteria: (1) incomplete SUA data; (2) missing data for blood pressure, fasting blood glucose (FBG), and TC; or (3) history of hypertension, hyperglycemia, or hypercholesterolemia at the beginning of the study. 20 The reporting of this study conforms to the strengthening the reporting of observational studies in epidemiology (STROBE) guidelines. 22
Data extraction
Participants completed face-to-face interviews using standardized questionnaires that included demographic characteristics (age and gender) and medical history (hypertension, diabetes, dyslipidemia, and medication history). Weight and height were measured using calibrated scales and height measuring devices. Blood pressure was assessed with a calibrated mercury sphygmomanometer. Venous blood samples were collected from all participants after at least an 8-h fast, and serum creatinine, SUA, FBG, and TC were measured using standard clinical laboratory methods, as previously described. 20
Definitions and outcomes
Hyperuricemia was defined as SUA ≥416 µmol/L for men, and SUA ≥357 µmol/L for women. 23 Hypercholesterolemia was defined as TC ≥6.22 mmol/L. Hypertension was defined as a systolic blood pressure (SBP) of ≥140 mmHg or a diastolic blood pressure (DBP) of ≥90 mmHg, or having been diagnosed with hypertension and currently receiving antihypertensive treatment. Hyperglycemia is defined as FBG ≥7.0 mmol/L or self-reported diabetes. Normal weight was defined as body mass index (BMI) 18.5 to <24.0 kg/m2, overweight was defined as BMI 24.0 to <28.0 kg/m2, and obese was defined as BMI ≥28 kg/m2, in accordance with Chinese BMI categorization guidelines. 24 The exposure variable was SUA, and the outcome variable was TC.
Covariates
Possible confounding factors were evaluated utilizing descriptive statistics, clinical significance, and the number of outcome events. 20 The following variables were included in the analyses: age, sex, SBP, DBP, FBG, TC, creatinine, SUA and estimated glomerular filtration rate (eGFR).
Statistical analyses
Continuous variables are presented as mean ± SD for data with normal distribution, or median and interquartile range (IQR) for data with skewed distribution. Histogram distribution, Q-Q plot, or Kolmogorov-Smirnov test was used for determining whether variables were normally distributed. Differences between SUA groups were analyzed with χ2-test (for categorical data), one-way analysis of variance (ANOVA, for continuous data with normal distribution), or Kruskal–Wallis H-test (for continuous data with skewed distribution). The Bonferroni correction P-value was used for multiple comparisons.
The association between SUA and TC was evaluated using linear regression models (regression coefficients β and 95% confidence interval [CI]) with adjustment for major covariables. For analyses, SUA (µmol/L) was entered either as a categorical variable, with participants grouped into 5 quantiles according to SUA levels; or as a continuous variable (per 100 unit). Confounders were selected on the basis of clinical relevance, as described previously, 20 or their associations with the outcomes of interest, or a change in effect estimate >10% (P < 0.05). Unadjusted, minimally adjusted, and fully adjusted findings are presented in accordance with STROBE guidelines, as follows: Crude model, a non-adjusted crude model; Model 1, adjusted for sociodemographic characteristics (age); Model 2, adjusted for Model 1 plus covariates with P < 0.05 in the univariate model, including BMI, SBP, DBP, and FBG; and Model 3, adjusted for Model 2 plus additional variables based on previous literature, 20 including creatinine and eGFR. A restricted cubic spline model was applied to develop smooth curves to examine the possible nonlinear dose-response associations between SUA and TC. In this model, SUA was used as a continuous variable with four knots (5th, 35th, 65th and 95th). A two-piecewise regression model was utilized to calculate the threshold effect of SUA on TC in terms of the smoothing plot. Subgroup analyses were conducted by subgroup variables. Heterogeneity across subgroups was tested by adding a term to the model, in which the two predictor variables are multiplied. A series of sensitivity analyses were conducted to evaluate the robustness of the findings. Firstly, the reliability of the results was validated using propensity score adjusted, 25 propensity score matching, 26 and the inverse probability of treatment weighting. 27 Secondly, if an interaction between different strata was found in the subgroup analysis, an additional correlation analysis was performed to confirm the consistency of the results with the main analysis.
Statistical analyses were conducted using R software, version 4.2.2 (The R Foundation; http://www.R-project.org) and Free Statistics software, version 1.9.2 (Free Clinical Medical Technology Co., Ltd, Beijing, China). Statistical significance was set at a two-sided P value <0.05.
Results
Characteristics of the participants
A total of 6119 adults were included in the study, of whom, 4078 (66.6%) were female. The baseline characteristics stratified by sex are shown in supplemental Table S1. The mean age of the female and male participants was 63.7 ± 9.0 and 69.8 ± 8.9 years, respectively. Men were older and had higher BMI, SBP, DBP, FBG, and SUA compared with the female population (P < 0.001). Women had greater mean TC than men (4.8 ± 0.7 and 4.5 ± 0.7, respectively; P < 0.001), and higher creatinine levels (P < 0.001).
Participants of both sexes were divided into five groups based on increasing SUA levels (Q1–Q5, Table 1). Age, BMI, SBP, DBP, creatinine, TC and FBG all consistently showed positive trends in female participants, but as SUA levels increased from Q1 to Q5, eGFR consistently showed an inverse trend. A similar trend was observed in male participants, but there was no statistically significant trend between SUA level and DBP or creatinine (P > 0.05).
Baseline characteristics of 6119 Chinese adults categorized according to sex and SUA levels.

Data presented as mean ± SD.
SUA, serum uric acid; BMI, body mass index; SBP, systolic blood pressure; DBP, diastolic blood pressure; FBG, fasting blood glucose; TC, total cholesterol; eGFR, estimated glomerular filtration rate.
Association between SUA level and TC
The results of univariate linear regression analysis (Table 2) showed that TC was strongly positively correlated with age, BMI, SBP, DBP, FBG, eGFR and SUA in women (P < 0.05), but TC and creatinine showed an inverse association. A similar trend was observed in men, however, SBP and creatinine were not associated with TC (P > 0.05).
Univariate linear regression analyses evaluating the association between demographic and clinical variables and total cholesterol in 6119 Chinese adults categorized according to sex.

BMI, body mass index; SBP, systolic blood pressure; DBP, diastolic blood pressure; FBG, fasting blood glucose; eGFR, estimated glomerular filtration rate; CI, confidence interval.
In multivariable linear regression analyses (Table 3), SUA expressed as a continuous variable (per 100 unit) increased in association with TC in men (β = 0.09; 95% CI 0.15, 0.14; P < 0.001) and in women (β = 0.13; 95% CI 0.10, 0.17; P < 0.001), independent of potential confounders. As a categorical variable, the Q5 group exhibited higher TC levels than the Q1 group in men (β = 0.26; 95% CI 0.16, 0.37; P < 0.001) and in women (β = 0.25; 95% CI 0.17, 0.32; P < 0.001; Table 3, model 3).
Multivariable linear regression analyses of SUA and clinical outcomes in 6119 Chinese adults categorized according to sex and SUA levels.

Crude model was unadjusted. Model 1 was adjusted for age. Model 2 was adjusted for model 1 plus BMI, SBP, DBP and FBG. Model 3 was adjusted for model 1 plus model 2 plus creatinine and eGFR.
SUA, serum uric acid; BMI, body mass index; SBP, systolic blood pressure; DBP, diastolic blood pressure; FBG, fasting blood glucose; TC, total cholesterol; eGFR, estimated glomerular filtration rate; CI, confidence interval.
Nonlinear relationship between SUA and TC in females
In male participants, multivariate smooth splines analysis showed that the nonlinear relationship between SUA and TC was not found to be statistically significant (P for nonlinearity = 0.969, Figure 1(a)). However, in female participants, an inverted L-shaped relationship was revealed between SUA and TC (P for nonlinearity = 0.004, Figure 1(b)). When SUA levels were <359.962 μmol/L, TC levels increased with rising SUA, and the correlation coefficient (β) for TC was 0.002 (95% CI 0.001, 0.002; Table 4).

Results of multivariate smoothing splines analysis, showing: (a) linear relationship between SUA and TC in male participants; and (b) nonlinear relationship between SUA and TC in female participants. Adjustment factors included age, body mass index, systolic blood pressure, diastolic blood pressure, fasting blood glucose, creatinine and estimated glomerular filtration rate, respectively. Only 99% of the data are shown. The red line and pink area represent estimated values and corresponding 95% confidence intervals, respectively. SUA, serum uric acid; TC, total cholesterol.
Linear regression models to analyze threshold effects of SUA and TC in 4078 Chinese female adults.
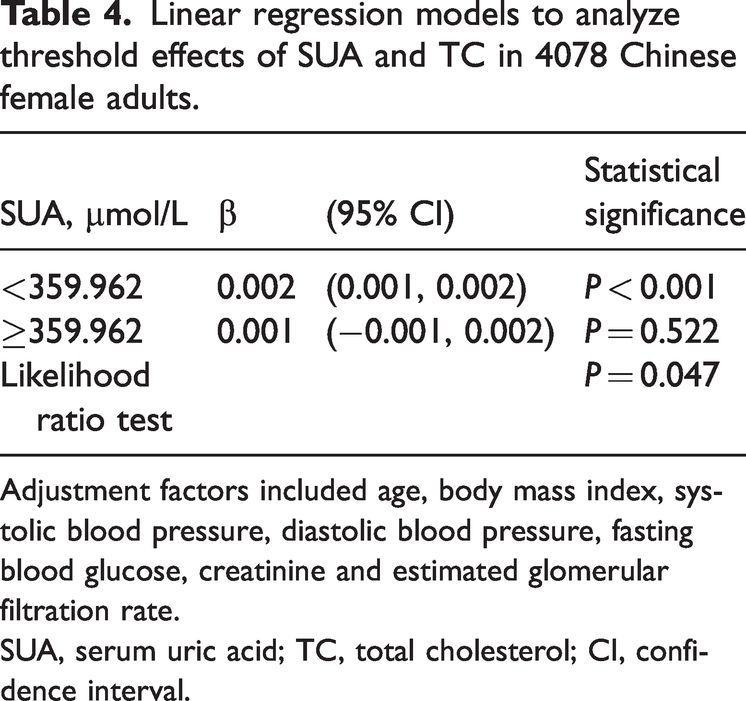
Adjustment factors included age, body mass index, systolic blood pressure, diastolic blood pressure, fasting blood glucose, creatinine and estimated glomerular filtration rate.
SUA, serum uric acid; TC, total cholesterol; CI, confidence interval.
Subgroup analyses
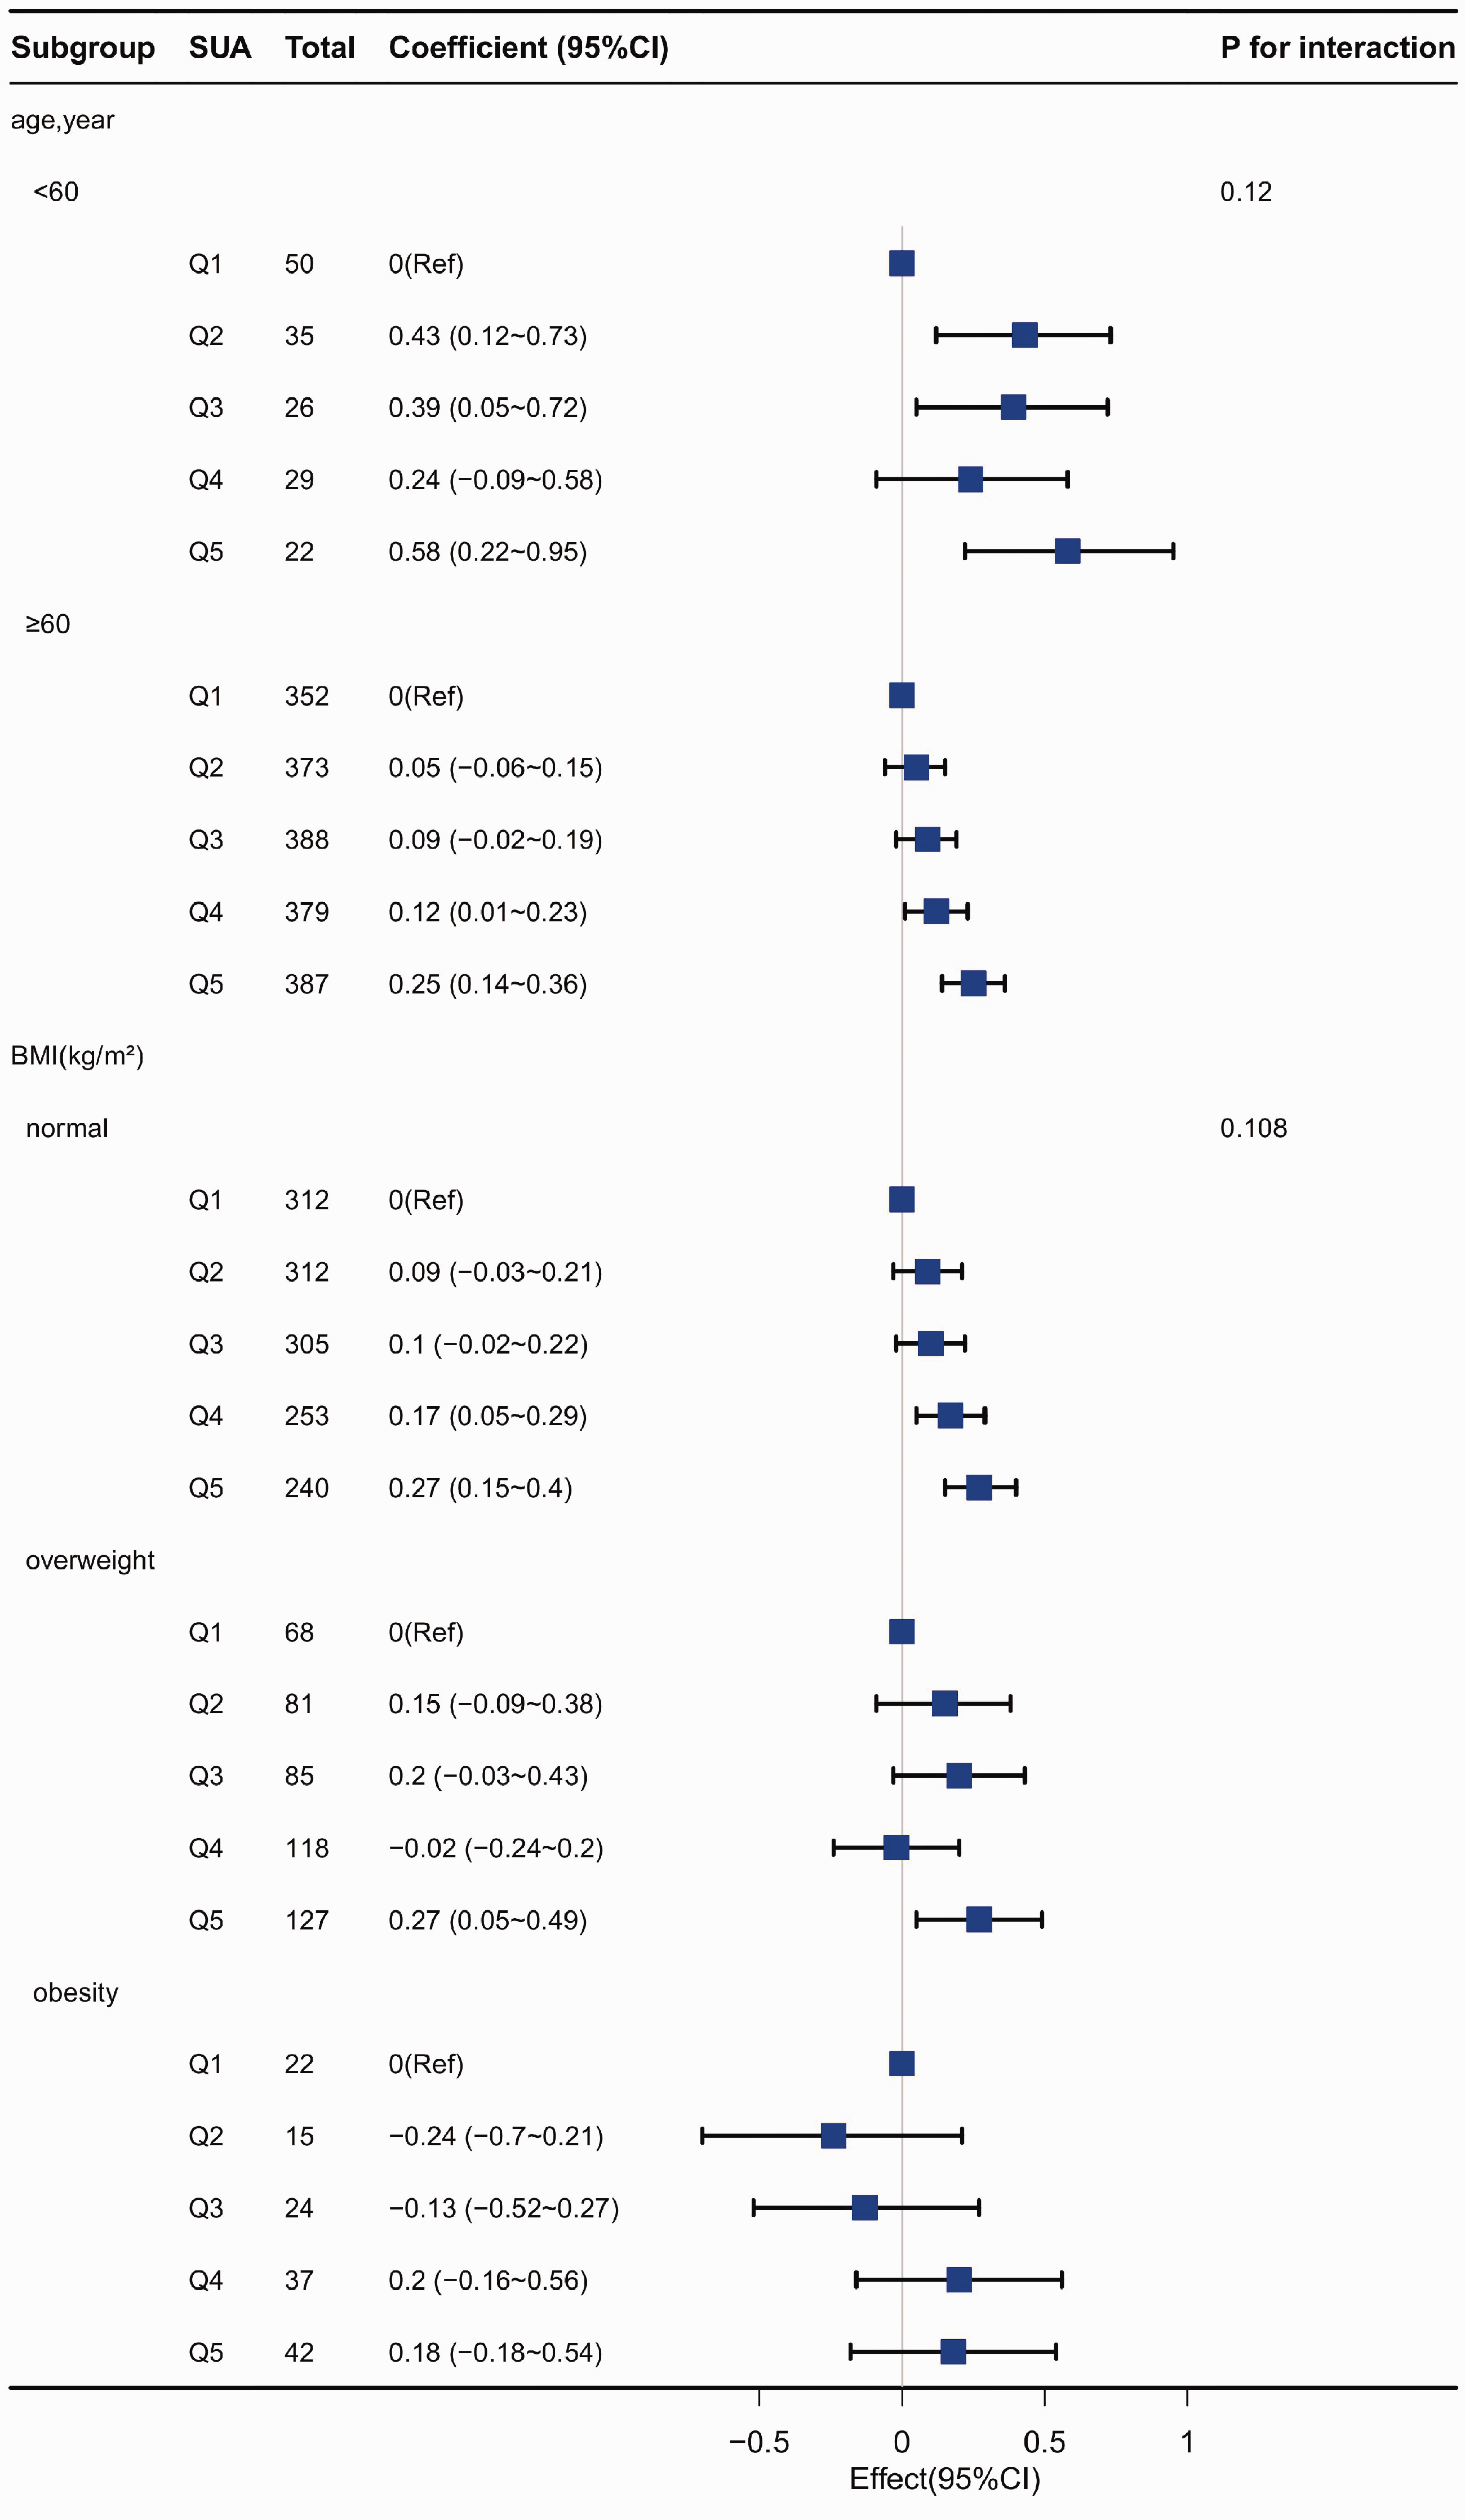
Subgroup analyses revealed significant interactions between age and SUA in female participants (P < 0.05; Figure 2). However, no interaction was shown between age, BMI and SUA levels in males (Figure 3).

Subgroup analysis of relationships between SUA and TC in female participants grouped into 5 quantiles according to increasing SUA level (Q1–Q5). Coefficient (β) adjusted for age, BMI, systolic blood pressure, diastolic blood pressure, fasting blood glucose, creatinine and estimated glomerular filtration rate, respectively. BMI, body mass index; CI, confidence interval; SUA, serum uric acid (µmol/L); TC, total cholesterol.
Subgroup analysis of relationships between SUA and TC in male participants grouped into 5 quantiles according to increasing SUA level (Q1–Q5). Coefficient (β) adjusted for age, BMI, systolic blood pressure, diastolic blood pressure, fasting blood glucose, creatinine and estimated glomerular filtration rate, respectively. BMI, body mass index; CI, confidence interval; SUA, serum uric acid (µmol/L); TC, total cholesterol.
Sensitivity analyses
In the sensitivity analyses, propensity score matching was used to adjust for baseline characteristics, and correlation analysis was performed.
After propensity score matching, 407 pairs from each group of male participants, and 533 pairs from each group of female participants, were well matched (supplemental Table S2), with no statistically significant differences between the two matched groups.
Both univariate and multivariable linear regression analyses, as well as propensity score adjusted, propensity score matched and inverse probability of treatment weighting, revealed a significantly higher incidence of TC in male and female participants with hyperuricemia. For both sexes, the coefficients (β) were P < 0.05 and varied between 0.16 and 0.21 for males, and 0.11 and 0.20 for females (Table 5).
Associations between hyperuricemia and outcome in the crude analysis, multivariable analysis, and propensity-score analyses.

Data presented as n prevalence.
Participants were divided into a normal serum uric acid group and hyperuricemia group according to the following cut-off values: men, ≥416 μmol/L; women ≥357 μmol/L, followed by propensity-score analyses.
SUA, serum uric acid; IPTW, inverse probability of treatment weighting.
A further sensitivity analysis was conducted in female participants aged < 60 years. In multivariable linear regression analyses, SUA expressed as a continuous variable (per 100 unit) was increased in association with TC (β = 0.22; 95% CI 0.16, 0.28; P < 0.001). As a categorical variable, the Q5 group exhibited higher TC levels (β = 0.36; 95% CI 0.24, 0.48; P < 0.001) than the Q1 group (supplemental Table S3, model 3).
Discussion
The present study revealed a consistently positive correlation between TC and SUA in male and female adult groups, which remained after adjusting for confounders. In females, there was an inverted L-shaped relationship between SUA and TC, with a cut-off value of 359.962 μmol/L. SUA and TC in men exhibited a linear association. Subgroup analysis revealed that, while there was an interaction in the age stratification (P < 0.05) for women, there were no significant interactions for men. Sensitivity analysis showed a robust and consistent correlation between SUA and TC. These observations have important implications for current TC management strategies, particularly for the Chinese population.
The relationship between SUA and dyslipidemia has yielded inconsistent results. Li et al. 28 found no association between SUA and various blood lipid parameters in obese individuals. However, Choe et al. 29 indicated that hyperuricemia is a risk factor for abnormal blood lipid levels. The present study found an independent correlation between SUA levels and TC. For lipid subtypes, a cross-sectional study of data from the USA National Health and Nutrition Examination Survey showed a positive correlation between hyperuricemia and high triglycerides. 16 In another study, abnormal levels of triglycerides and low-density lipoprotein cholesterol (LDL-C) were found to be positively correlated with SUA levels. 30 Similarly, Kuwabara et al. 31 identified a connection between elevated SUA levels and both LDL-C and triglycerides, and an analysis of data from the China Hainan centenarian cohort study (CHCCS) also found similar results. 17 Previous studies have concentrated on the relationships among LDL-C, triglycerides and SUA, but they have not addressed the overall effect of TC on SUA or the gender differences related to both. Although Luo et al. 20 found gender differences in the relationship between SUA levels and TC, they did not identify specific dose-response relationships between the two. The present study addresses this gap.
Regarding the dose-response relationship between SUA and dyslipidemia, a non-linear dose response among the general population has been previously described for triglycerides, LDL-C, and SUA, without exhibiting gender differences. 21 In addition, another study reported an inverse U-shaped association between SUA and high LDL-C. 32 The present study revealed an inverted L-shaped relationship between SUA and TC with a cut-off SUA value of 359.962 μmol/L in women, whereas a linear relationship was shown in men. In contrast, Kuwabara et al. 33 found a J-shaped association between SUA and dyslipidemia in both men and women. The optimal range of SUA for dyslipidemia was approximately 2–5 mg/dL in men and 1–4 mg/dL in women. Similar results have been reported elsewhere. 34 Differences between the present findings and those of previously reported studies may be related to variations in genetic factors and socioeconomic status.
Regarding the gender strength of the relationship between SUA and dyslipidemia, Lin et al. 19 found that the correlation between high triglycerides and LDL-C with SUA levels was significant only in men and not in women. Conversely, another study suggested that the relationship between SUA levels and dyslipidemia seems to be more significant in women, 35 which appears to concur with the present finding of a significantly stronger association between SUA and TC in women than in men. The gender differences between SUA and TC may be influenced by estrogen,36,37 which affects SUA excretion, the levels and activity of 3-hydroxy-3-methylglutaryl-coenzyme A reductase, and the expression of estrogen receptor alpha. Additionally, these significant gender differences offer important insights for managing and controlling SUA and TC, providing great hope for future prevention strategies and treatment approaches.
A study among menopausal women found that those with hyperuricemia showed significantly higher levels of triglycerides and LDL-C. 38 In the present subgroup analysis, an interaction between SUA and TC was identified across age-stratified groups, with a linear positive correlation observed between SUA and TC in women under 60 years-of-age. Comparable findings have been reported in previous studies. 39
The present study has several strengths. Firstly, the sample size was large enough to provide strong evidence for gender differences. Secondly, the study extends the association between SUA and TC to the general population. However, the present results may be limited by several factors. Firstly, the study was cross-sectional in design, thus, it is not possible to establish a causal relationship between SUA and TC. Further cohort studies are needed to clarify the relationship between SUA and TC. Secondly, the single-center and retrospective nature of the study may have resulted in selection bias. Thirdly, despite employing regression models, stratified analyses, and sensitivity analyses to adjust for potential confounders, residual confounding effects from unmeasured or unknown variables may still persist.
Conclusions
A significant gender difference was found in the association between uric acid and total cholesterol. A reverse L-shaped relationship between SUA and TC was found in adult females, while in males, a linear relationship was shown. Additionally, the association between SUA and TC was shown to be significantly stronger in females than in males.
Supplemental Material
sj-pdf-1-imr-10.1177_03000605251318203 - Supplemental material for The dose-response relationship and gender differences of serum uric acid with total cholesterol: a cross-sectional study
Supplemental material, sj-pdf-1-imr-10.1177_03000605251318203 for The dose-response relationship and gender differences of serum uric acid with total cholesterol: a cross-sectional study by Leilei Guo, Lina Cai, Li Hu and Yueshan Zhou in Journal of International Medical Research
Footnotes
Acknowledgements
We appreciate Dr. Jie Liu of the Department of Vascular and Endovascular Surgery, Chinese PLA General Hospital for statistics, study deign consultations and editing the manuscript.
Author contributions
LG designed the study, performed the primary research, and wrote the manuscript. LC supported manuscript revision. LC, LH, and YZ supported the data collection and analysis. All authors read and approved the final manuscript.
Data availability statement
Declaration of conflicting interest
The authors declare that there is no conflict of interest.
Funding
This research did not receive any specific grant from funding agencies in the public, commercial, or not-for-profit sectors.
Supplementary material
Supplemental material for this article is available online.
References
Supplementary Material
Please find the following supplemental material available below.
For Open Access articles published under a Creative Commons License, all supplemental material carries the same license as the article it is associated with.
For non-Open Access articles published, all supplemental material carries a non-exclusive license, and permission requests for re-use of supplemental material or any part of supplemental material shall be sent directly to the copyright owner as specified in the copyright notice associated with the article.