
Abstract
Objective
To investigate characteristics of peripapillary choroidal thickness (PCT) in Chinese patients with myopia without myopic maculopathy.
Methods
We retrospectively assessed 95 Chinese patients (95 eyes) with myopia without myopic maculopathy, who had visited the myopia clinic of Shandong Provincial Qianfoshan Hospital. Thirteen patients were excluded; the remaining 82 patients were divided into Groups 1 (spherical equivalent [SE], −0.5 to −6.0 D; axial length, 24–26 mm; n = 26), 2 (SE, −6.0 to −10.0 D; axial length, 26 to 28 mm; n = 34), and 3 (SE, ≥−10.0 D; axial length, ≥28 mm; n = 22). Enhanced depth imaging optical coherence tomography was used to measure PCT in inferior, superior, nasal, and temporal quadrants. Continuous variables were compared using one-way analysis of variance. Associations of PCT with SE and axial length were analyzed by Pearson correlation.
Results
PCT decreased with increasing SE and axial length in all quadrants. For each group, PCT was thickest in the temporal quadrant and thinnest in the inferior quadrant. PCT significantly differed between Groups 1 and 3 in superior, nasal, and temporal quadrants.
Conclusions
PCT decreased with increasing SE and axial length. PCT was thickest in the temporal quadrant and thinnest in the inferior quadrant in Chinese patients with myopia.
Keywords
Introduction
Myopia is currently the most common eye disease. The incidence of myopia in East Asia has been gradually increasing.1,2Notably, the incidence of myopia among young people (15–25 years of age) in Singapore is in the range of 30% to 65%. 3 Furthermore, compared with non-Chinese adults, Chinese adults have a higher prevalence of myopia, higher myopia, and longer axial length (AL). 4 Although myopia can be managed with corrective optics, it remains a risk factor for many retinal and optic neuropathies; these risks are increased when high myopia is present.5,6Thus, there is a need to explore the pathogenesis of myopia to aid in reducing the rate of blindness among individuals with myopia.
The blood supply to the prelaminar area of the optic nerve head is derived from the branches of blood vessels within the peripapillary choroid. Changes in the peripapillary choroid are presumably involved in the pathogenesis of certain ocular diseases, such as pathological myopia and glaucoma.7–12Therefore, assessment of peripapillary choroidal thickness (PCT) can be used to elucidate the pathogenesis of myopia and monitor its progression. In the past, choroidal thickness was approximated by indocyanine green angiography and ultrasonography assessments. 13 More recently, observation of choroidal structures in vivo has been commonly been performed by means of spectral domain optical coherence tomography using enhanced depth imaging (i.e., EDI-OCT). 13 In the present study, we aimed to assess the choroidal circulation of patients with low and high myopia. Therefore, we used EDI-OCT to investigate the distribution of PCT in patients with various degrees of myopia, as well as factors that influenced PCT in these patients.
Patients and methods
Ethical approval
This retrospective cross-sectional study complied with the tenets of the Declaration of Helsinki and was approved by the Ethics Board of the Shandong Provincial Qianfoshan Hospital. Written informed consent was obtained from all patients for inclusion in the study.
Study population
Patients aged 18 to 35 years, who had visited the myopia clinic of Shandong Provincial Qianfoshan Hospital from June 2017 to December 2017, were screened for inclusion in this study. The inclusion criteria for this study were refractive errors without myopic maculopathy and best corrected vision acuity better than 20/25. The International Photographic Classification and Grading System for Myopic Maculopathy 14 was used to assess fundus changes; these changes among included patients were category 0 (no myopic retinal degeneration) and category 1 (tessellated fundus, without lacquer cracks, Fuchs spot, myopic choroidal neovascularization, or posterior staphyloma). Fundus changes were assessed by two clinicians who were not authors of this study; when disagreement occurred, changes were assessed a third clinician who was not an author of this study. Exclusion criteria for this study were as follows: presence of ophthalmic diseases (e.g., dominant strabismus, cataract, glaucoma, and/or retinal choroidal lesions); previous history of eye trauma or eye surgery; and/or presence of systemic disease.
Data collection
The following eye examinations were performed for all included patients: refraction using a KR-1 refractometer (Topcon Corp., Tokyo, Japan); intraocular pressure using a Goldmann applanation tonometer; slit-lamp microscopy; and anterior and posterior photographic photography. Spherical equivalent (SE) was regarded as sphere plus one-half cylinder. The IOL Master 500 Optical Biometer (Carl Zeiss Meditec, Oberkochen, Germany) was used to measure the AL. Patients were divided into three groups according to SE and AL: Group 1 (SE, −0.5 to −6.0 D; AL, 24 to 26 mm), Group 2 (SE, −6.0 to −10.0 D; AL, 26 to 28 mm), and Group 3 (SE, ≥−10.0 D; AL, ≥28 mm).
A spectral domain optical coherence tomography scanner (Spectralis, Heidelberg Engineering, Heidelberg, Germany) was used to collect images of peripapillary choroid. PCT was measured by EDI-OCT. The annular scan was centered on the optic disc with a diameter of 3.4 mm. Each image contained 100 scans. PCT was assessed manually from the retinal pigment epithelium to the inner face of the sclera, in the inferior, superior, nasal, and temporal quadrants (Figure 1). PCT values were measured for all patients by two experienced ophthalmologists, who were masked to the patients’ clinical data; PCT values were averaged between the two clinicians for use in our analyses. Eyes with measurement differences >15% between the two clinicians were excluded from the study. To avoid diurnal fluctuations in measurement values,15,16optical coherence tomography scans were performed at a fixed time (between 9:00 am and 11:00 am).
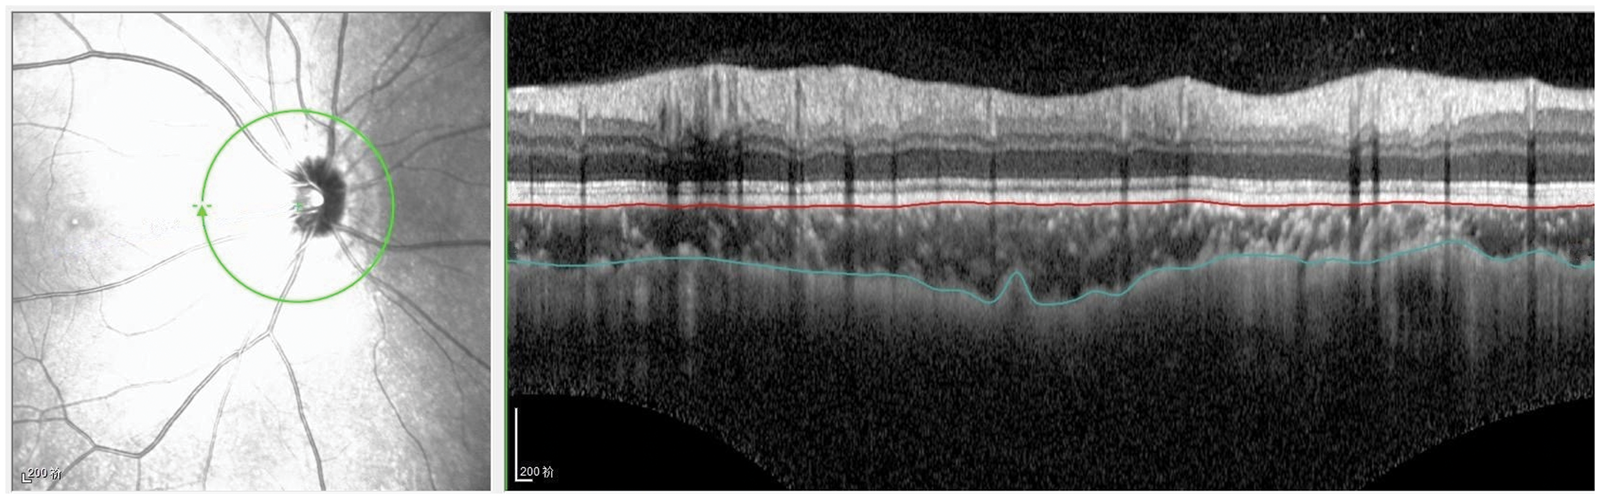
Peripapillary choroidal thickness measurement in four quadrants. Manual delineation of outer and inner choroid borders was performed using eye tracking software (Heidelberg Engineering).
Statistical analysis
Data analysis was performed using SPSS Statistics, version 19.0 (IBM Corp., Armonk, NY, USA). The PCT of the four quadrants of each group was analyzed and expressed as the mean ± standard error. The chi-squared test was used to compare categorical variables, while analysis of variance (with post hoc Student–Newman–Keuls analysis, where appropriate) was used to compare continuous variables. Correlation regression analysis was used to examine relationships of PCT with SE and AL. P < 0.05 was considered statistically significant.
Results
Ninety-five patients (95 eyes) were screened for inclusion in this study; 13 patients were excluded because measurement differences between the two clinicians were >15%. Thus, 82 eyes of 82 patients (43 men and 39 women) were enrolled; n = 26 in Group 1, n = 34 in Group 2, and n = 22 in Group 3. The patient characteristics are shown in Table 1. The mean SE and AL differed among the three groups (P < 0.001 for both). There were no significant differences in sex distribution, age, or intraocular pressure among the three groups.
Clinical characteristics of patients with myopia in this study.

Most data are shown as mean ± standard error; sex data are shown as n/n.
chi-squared test; 2one-way analysis of variance.
Table 2shows PCT findings among the three groups. PCT significantly differed among all groups in the superior and temporal quadrants (P = 0.006 and P = 0.046, respectively). When Group 1 was compared with Group 2, a significant difference was observed in the superior quadrant (P = 0.04). When Group 1 was compared with Group 3, significant differences were observed in the superior, nasal, and temporal quadrants (P = 0.001, P = 0.035, and P = 0.01, respectively). Differences between Groups 2 and 3 were not statistically significant. For each group, PCT was thickest in the temporal quadrant and thinnest in the inferior quadrant.
Peripapillary choroidal thicknesses of patients with myopia.
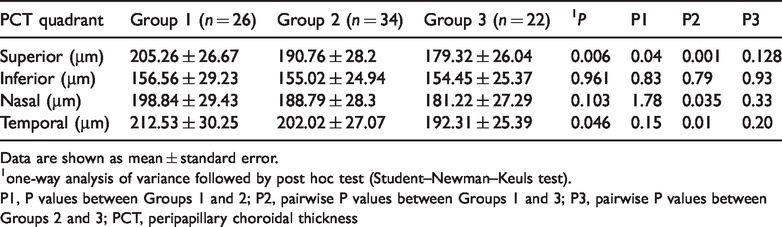
Data are shown as mean ± standard error.
one-way analysis of variance followed by post hoc test (Student–Newman–Keuls test).
P1, P values between Groups 1 and 2; P2, pairwise P values between Groups 1 and 3; P3, pairwise P values between Groups 2 and 3; PCT, peripapillary choroidal thickness
Table 3shows the relationships of PCT with SE and AL. There was a positive relationship between PCT and SE in each quadrant (P<0.001 for superior, nasal, and temporal; P = 0.034 for inferior), whereas there was a negative relationship between PCT and AL in each quadrant (P<0.001 for superior, nasal, and temporal; P = 0.005 for inferior).
Correlations of peripapillary choroidal thickness with spherical equivalent and axial length.

PCT, peripapillary choroidal thickness.
Discussion
Changes in choroidal anatomy and function contribute to the onset and progression of many eye diseases. 17 Abnormal blood flow in the peripapillary choroid may contribute to the pathogenesis of pathological myopia and glaucoma. 18 PCT may also be an important factor associated with the onset and progression of myopia. 19 To clarify the role of peripapillary choroid in myopia, we used EDI-OCT to precisely measure PCT in patients with various degrees of myopia.
Our findings differed from those reported by Erigabci et al. 13 and Huang et al., 20 who found no significant associations between PCT and refractive error, or between PCT and AL. These disparities may be due to differences in inclusion criteria. Huang et al. 20 excluded patients with high myopia or hyperopia (SE, >+6 D or >−6 D), while Erigabci et al. 13 included patients with SE of −3.75 to +3.00 D. In the present study, we found that the PCT became thinner as AL increased. Positive relationships were observed between PCT thickness and SE in all four quadrants included in the analysis. Negative relationships were observed between PCT thickness and AL in all four quadrants included in the analysis. As noted above, previous studies have shown no significant association between PCT and AL.13,20This is presumably because the prior studies did not include patients with high myopia, or because they used small sample sizes. With increasing AL, we observed that PCT became thinner. This suggests that reductions in choroidal circulation lead to further degeneration of the choroid and retina in individuals with high myopia, which may cause the onset and/or progression of high myopia-related complications.
This study showed that PCT exhibits regional variation. PCT was thickest in the temporal quadrant and thinnest in the inferior quadrant. Our results are consistent with findings described by Erigabci et al. 13 Conversely, Tanabe et al. 21 showed that PCT was thickest in the superior quadrant. The reasons for regional variation of PCT have remained unclear thus far. Thinning in the inferior quadrant is presumably related to embryonic development of the eyeball; during this process, the optic nerve fissure eventually closes below the optic cup. 22 Because choroidal thickness is thinnest in the inferior quadrant, this quadrant of the optic disc is more susceptible to changes in choroidal blood flow. In the pathogenesis of glaucoma, narrowing of the lower disc is more common, which supports this hypothesis.21,23
Among individuals with myopia, the rate of glaucoma differs according to age. Shim et al. 24 divided patients with myopia into groups on the basis of age; they found that the prevalence of glaucoma in younger adults with high myopia was comparable to the prevalence in older adults with low myopia. Thus, screening for glaucoma in patients with high myopia should presumably begin at an earlier age, such as 40 years. 22 The participants in the present study were patients with myopia, aged 18 to 35 years; therefore, the present findings are useful for elucidating the relationship between myopia and glaucoma, and suggest the need for early monitoring and treatment of glaucoma.
Limitations of this study include the use of manual measurement of PCT, which may have resulted in interobserver bias. To reduce this potential bias, PCT measurements were performed independently by two experienced ophthalmologists, who were masked to clinical patient data; PCT values were then averaged between the two clinicians for use in our analyses. Importantly, eyes with measurement differences >15% between the two clinicians were excluded from the study. Additional limitations include the retrospective nature of the study, as well as its small sample size. Future studies should include larger sample sizes to confirm these findings.
In conclusion, assessment of PCT may be useful for monitoring of myopia progression. Additional prospective trials with larger sample sizes are needed to confirm the findings of the present study.