
Abstract
Objective
This study was performed to explore the association of the high-resolution computed tomography (HRCT) score with ventilator weaning and 28-day mortality of patients with acute respiratory distress syndrome (ARDS).
Method
In total, 197 patients treated for ARDS from October 2004 to December 2015 were retrospectively analyzed. Univariate analysis and multifactor regression analysis were used to determine the relationship of the HRCT score with ventilator weaning and 28-day mortality. Curve-fitting analysis and threshold analysis were further used to explore the association of the HRCT score with ventilator weaning and 28-day mortality.
Results
The multifactor regression analysis showed that the HRCT score was significantly associated with a lower rate of ventilator weaning and a higher risk of 28-day mortality in patients with ARDS. HRCT scores of 257.0 and 243.2 were the thresholds for ventilator weaning and 28-day mortality, respectively. When the HRCT score was below the threshold, every 1-point increase in the HRCT score was associated with a 4.6% decrease in the ventilator weaning rate and a 4.6% increase in the 28-day mortality rate.
Conclusion
The HRCT score was associated with ventilator weaning and 28-day mortality with a threshold of 257.0 and 243.2 points, respectively.
Keywords
Introduction
Acute respiratory distress syndrome (ARDS) is a diffuse pulmonary injury with various intrapulmonary and extrapulmonary causes,1–3 and it is characterized by acute hypoxic respiratory failure and high mortality.4,5 Almost all patients with ARDS require endotracheal intubation and mechanical ventilation because of severe disease, and a high proportion of patients are unable to be weaned from a ventilator. 6 Patients who cannot undergo ventilator weaning are at higher risk of mortality, and the risk of mortality increases as the mechanical ventilation time lengthens. 7 High-resolution computed tomography (HRCT) can often provide more information than either chest radiography or conventional CT scanning, 8 allowing for accurate assessment of the pattern, distribution, activity, and potential reversibility of diffuse lung disease. 9 One study showed that HRCT was highly correlated with radiographic and histopathologic appearances. 10 Anan et al. 11 showed that fibroproliferative changes on HRCT were associated with mortality and ventilator weaning in patients with ARDS. However, their study had a relatively small sample size, and adjustment was not performed for possible confounding factors that may affect the outcome of ARDS. Research of the relationship of the HRCT score with ventilator weaning and 28-day mortality of patients with ARDS is limited. Therefore, the present study was performed to explore the relationship of the HRCT score with ventilator weaning and 28-day mortality of patients with ARDS.
Methods
Study design
The data for this retrospective cohort study were provided by Keisuke Anan and are stored in the Dryad Database (https://datadryad.org/resource/doi:10.5061/dryad.7d8k0).11
The objective of the study was to explore the relationship of the HRCT score with ventilator weaning and 28-day mortality of patients with ARDS. The inclusion criterion was a diagnosis of ARDS based on the Berlin definition criteria from October 2004 to December 2015 in the intensive care unit of a teaching hospital. The exclusion criteria were chronic interstitial lung disease, including idiopathic pulmonary fibrosis; vasculitis or alveolar hemorrhage; acute tissue pneumonia; acute hypersensitivity pneumonitis; acute eosinophilic pneumonia; and missing data.
Treatment
Ventilator management was based on the guideline-recommended low tidal volume ventilation strategy (6–8 mL/kg), and ventilator weaning was based on the guidelines provided by the American College of Chest Physicians. The airway pressure was limited to <30 cmH2O, and the positive end-expiratory pressure was set at 8 to 12 cmH2O. During hospitalization, the peak inspiratory pressure, positive end-expiratory pressure, and tidal volume were recorded daily. No patients in this study were treated with extracorporeal membrane oxygenation.
HRCT examination, assessment, and scoring
All patients underwent a whole lung volume HRCT chest scan on the day of diagnosis of ARDS. All multi-slice CT scans were performed at a surface speed of 2-mm thickness and 15 mm at full aspiration from the tip of the lung to the bottom of the lung. A high-spatial-frequency algorithm was used to reconstruct adjacent CT slices. Slices were displayed on the entire chest at 10-mm intervals with the patient lying on his or her back without intravenous contrast agent. This process did not have a negative impact on the patient’s condition. We evaluated the single CT scan obtained on the first day of diagnosis of ARDS because it was difficult to perform a continuous CT scan when the patients required mechanical ventilation and had high positive end-expiratory pressure. Each HRCT scan was evaluated by two independent observers (K.F. and T.J.) on the day of diagnosis of ARDS. They were chest radiologists with 23 and 20 years of experience, respectively, and were blinded to the patients’ conditions. Disagreements were resolved by consultation with a third radiologist with more years of experience. We evaluated the existence and degree of regions containing frosted glass attenuation, air space consolidation, traction bronchiectasis, and honeycombing. HRCT examination results were graded according to the following pathologic classification system: normal attenuation, ground-glass attenuation, integration, frosted glass attenuation with traction bronchiectasis, and honeycombing The presence of these five abnormalities was independently evaluated in three regions (upper, middle, and lower) of each lung. The degree of each abnormality was determined by visual observation of the percentage of affected lung parenchyma in each region (the closest being 10%). The assessments of the two observers were averaged. The anomaly score for each area was calculated by multiplying the percentage area by the point value. The scores of the five zones were averaged to determine the total score of abnormalities for each patient. The five average scores were summed to obtain the total CT score of each patient. This scoring system has been previously described and evaluated in other diseases. 12
Outcome measurements
The outcome measurements in this study were ventilator weaning and 28-day mortality after the diagnosis of ARDS. We also examined whether the Acute Physiology and Chronic Health Evaluation II (APACHE II) score, Sequential Organ Failure Assessment (SOFA) score, albumin concentration, platelet count, presence of drug-associated ARDS (DARDS), and McCabe score were associated with ventilator weaning and 28-day mortality.
Statistical analysis
Continuous baseline variables are expressed as mean ± standard deviation, and count data are expressed as numerical value and percentage. A univariate analysis was performed to detect the possible risk associated with ventilator weaning and 28-day mortality. In the multifactor analysis, we adjusted for the possible variables that may affect the outcome of ventilator weaning and the prognosis of patients to determine the relationship of the HRCT score with ventilator weaning and 28-day mortality. A two-piecewise linear regression model was used to examine the threshold effect of the HRCT score on ventilator weaning and 28-day mortality of patients with ARDS using a smoothing function. The threshold level (i.e., turning point) was determined using trial and error; turning points were selected along a predefined interval, and the turning point that gave the maximum model likelihood was then chosen. We also conducted a log likelihood ratio test to compare the one-line linear regression model with the two-piecewise linear regression model. Pearson’s test was used for analysis of the correlation between these two models. The log likelihood ratio test result of the HRCT score for both ventilator weaning and 28-day mortality was <0.001. All statistical analyses were performed by EmpowerStats, version number 2018-05-05 (X&Y Solutions, Inc., Boston, MA, UA) and R software. A P value of <0.05 was considered statistically significant.
Results
Patients
A total of 391 patients met the inclusion criteria, 194 of whom were excluded (chronic interstitial lung disease, including idiopathic pulmonary fibrosis, n = 131; vasculitis or alveolar hemorrhage, n = 26; acute tissue pneumonia, n = 13; acute hypersensitivity pneumonitis, n = 5; acute eosinophilic pneumonia, n = 2; and missing data, n = 17). Thus, 197 patients were finally included in the study. The patients’ clinical characteristics are shown in Table 1.
Patients’ clinical characteristics.

Data are presented as mean ± standard deviation, n, or n (%).
APACHE II, Acute Physiology and Chronic Health Evaluation II; Alb, serum albumin; CRP, C-reactive protein; DARDS, drug-associated acute respiratory distress syndrome; F, female; FiO2, fractional inspired oxygen; HRCT, high-resolution computed tomography; M, male; PaO2, arterial oxygen tension; PEEP, positive end-expiratory pressure; PIP, peak inspiratory pressure; PLT, platelets; SOFA, Sequential Organ Failure Assessment; WBC, white blood cells.
Univariate analysis
The univariate analysis showed that with each 1-point increase in the HRCT score, the risk of ventilator weaning decreased by 1.0% (odds ratio [OR], 0.99; 95% confidence interval [CI], 0.986–0.995; P < 0.001) and the risk of 28-day mortality increased by 0.8% (OR, 1.008; 95% CI, 1.003–1.012; P < 0.001). We also found that the APACHE II score (P = 0.01), SOFA score (P = 0.006), albumin concentration (P = 0.003), platelet count (P = 0.04), and presence of DARDS (P = 0.003) were associated with ventilator weaning and that age (P = 0.04), the albumin concentration (P = 0.008), and a McCabe score of 3 (P = 0.03) were associated with 28-day mortality (Table 2).
Univariate analysis for ventilator weaning and 28-day mortality.
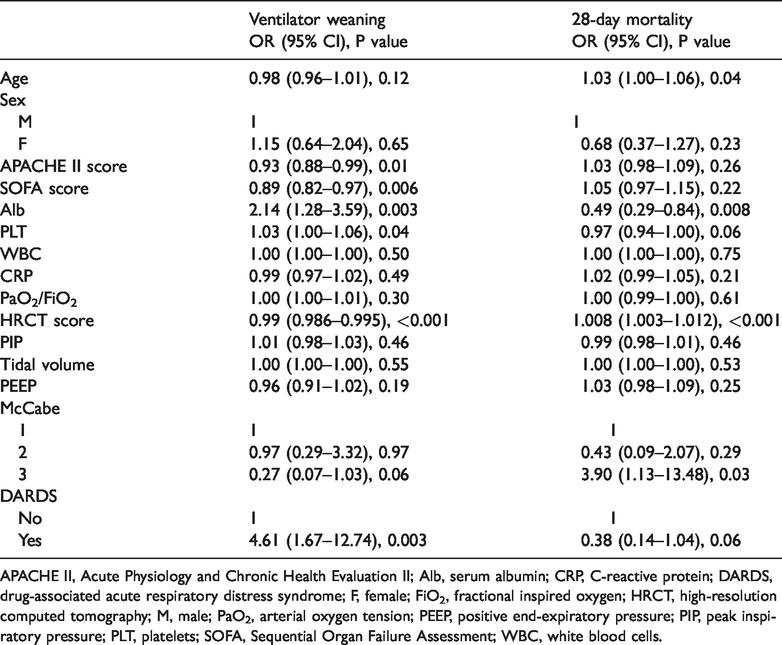
APACHE II, Acute Physiology and Chronic Health Evaluation II; Alb, serum albumin; CRP, C-reactive protein; DARDS, drug-associated acute respiratory distress syndrome; F, female; FiO2, fractional inspired oxygen; HRCT, high-resolution computed tomography; M, male; PaO2, arterial oxygen tension; PEEP, positive end-expiratory pressure; PIP, peak inspiratory pressure; PLT, platelets; SOFA, Sequential Organ Failure Assessment; WBC, white blood cells.
Multifactor regression analysis
In the multifactor regression analysis, we adjusted for the following variables: age, albumin concentration, platelet count, DARDS, McCabe score, APACHE II score, and SOFA score. In the adjusted models, with each 1-point increase in the HRCT score, the risk of ventilator weaning decreased by 2.3% (adjusted OR, 0.977; 95% CI, 0.969–0.985; P < 0.001) and the risk of 28-day mortality increased by 1.3% (adjusted OR, 1.013; 95% CI, 1.006–1.020; P < 0.001) (Table 3).
Effect of HRCT score on ventilator weaning and 28-day mortality by multifactor regression analysis.
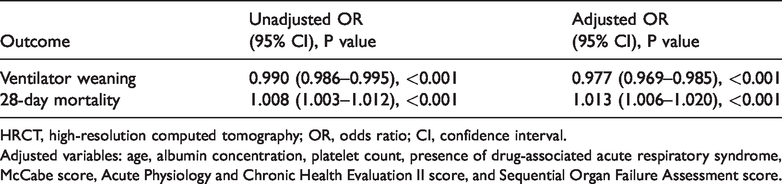
HRCT, high-resolution computed tomography; OR, odds ratio; CI, confidence interval.
Adjusted variables: age, albumin concentration, platelet count, presence of drug-associated acute respiratory syndrome, McCabe score, Acute Physiology and Chronic Health Evaluation II score, and Sequential Organ Failure Assessment score.
Curve-fitting analysis
Both the unadjusted and adjusted curve-fitting analyses showed that as the HRCT score increased, the rate of ventilator weaning decreased and the 28-day mortality rate increased. In the adjusted curve-fitting analysis, an HRCT score cut-off value was identified for both ventilator weaning and 28-day mortality. When the HRCT score was below the cut-off value, an increase in the HRCT score was associated with a decrease in the rate of ventilator weaning and an increase in the 28-day mortality rate. In both the unadjusted curve and the adjusted smooth-fitting curve, when the HRCT score was above the cut-off value, an increase in the HRCT score was not associated with an increase in either the rate of ventilator weaning or the 28-day mortality rate. The rate of ventilator weaning decreased to ≤20% and the 28-day mortality rate increased to about 60% in the adjusted smooth-fitting curve (Figures 1–4).

Unadjusted smooth-fitting curve of HRCT score for ventilator weaning. HRCT, high-resolution computed tomography.
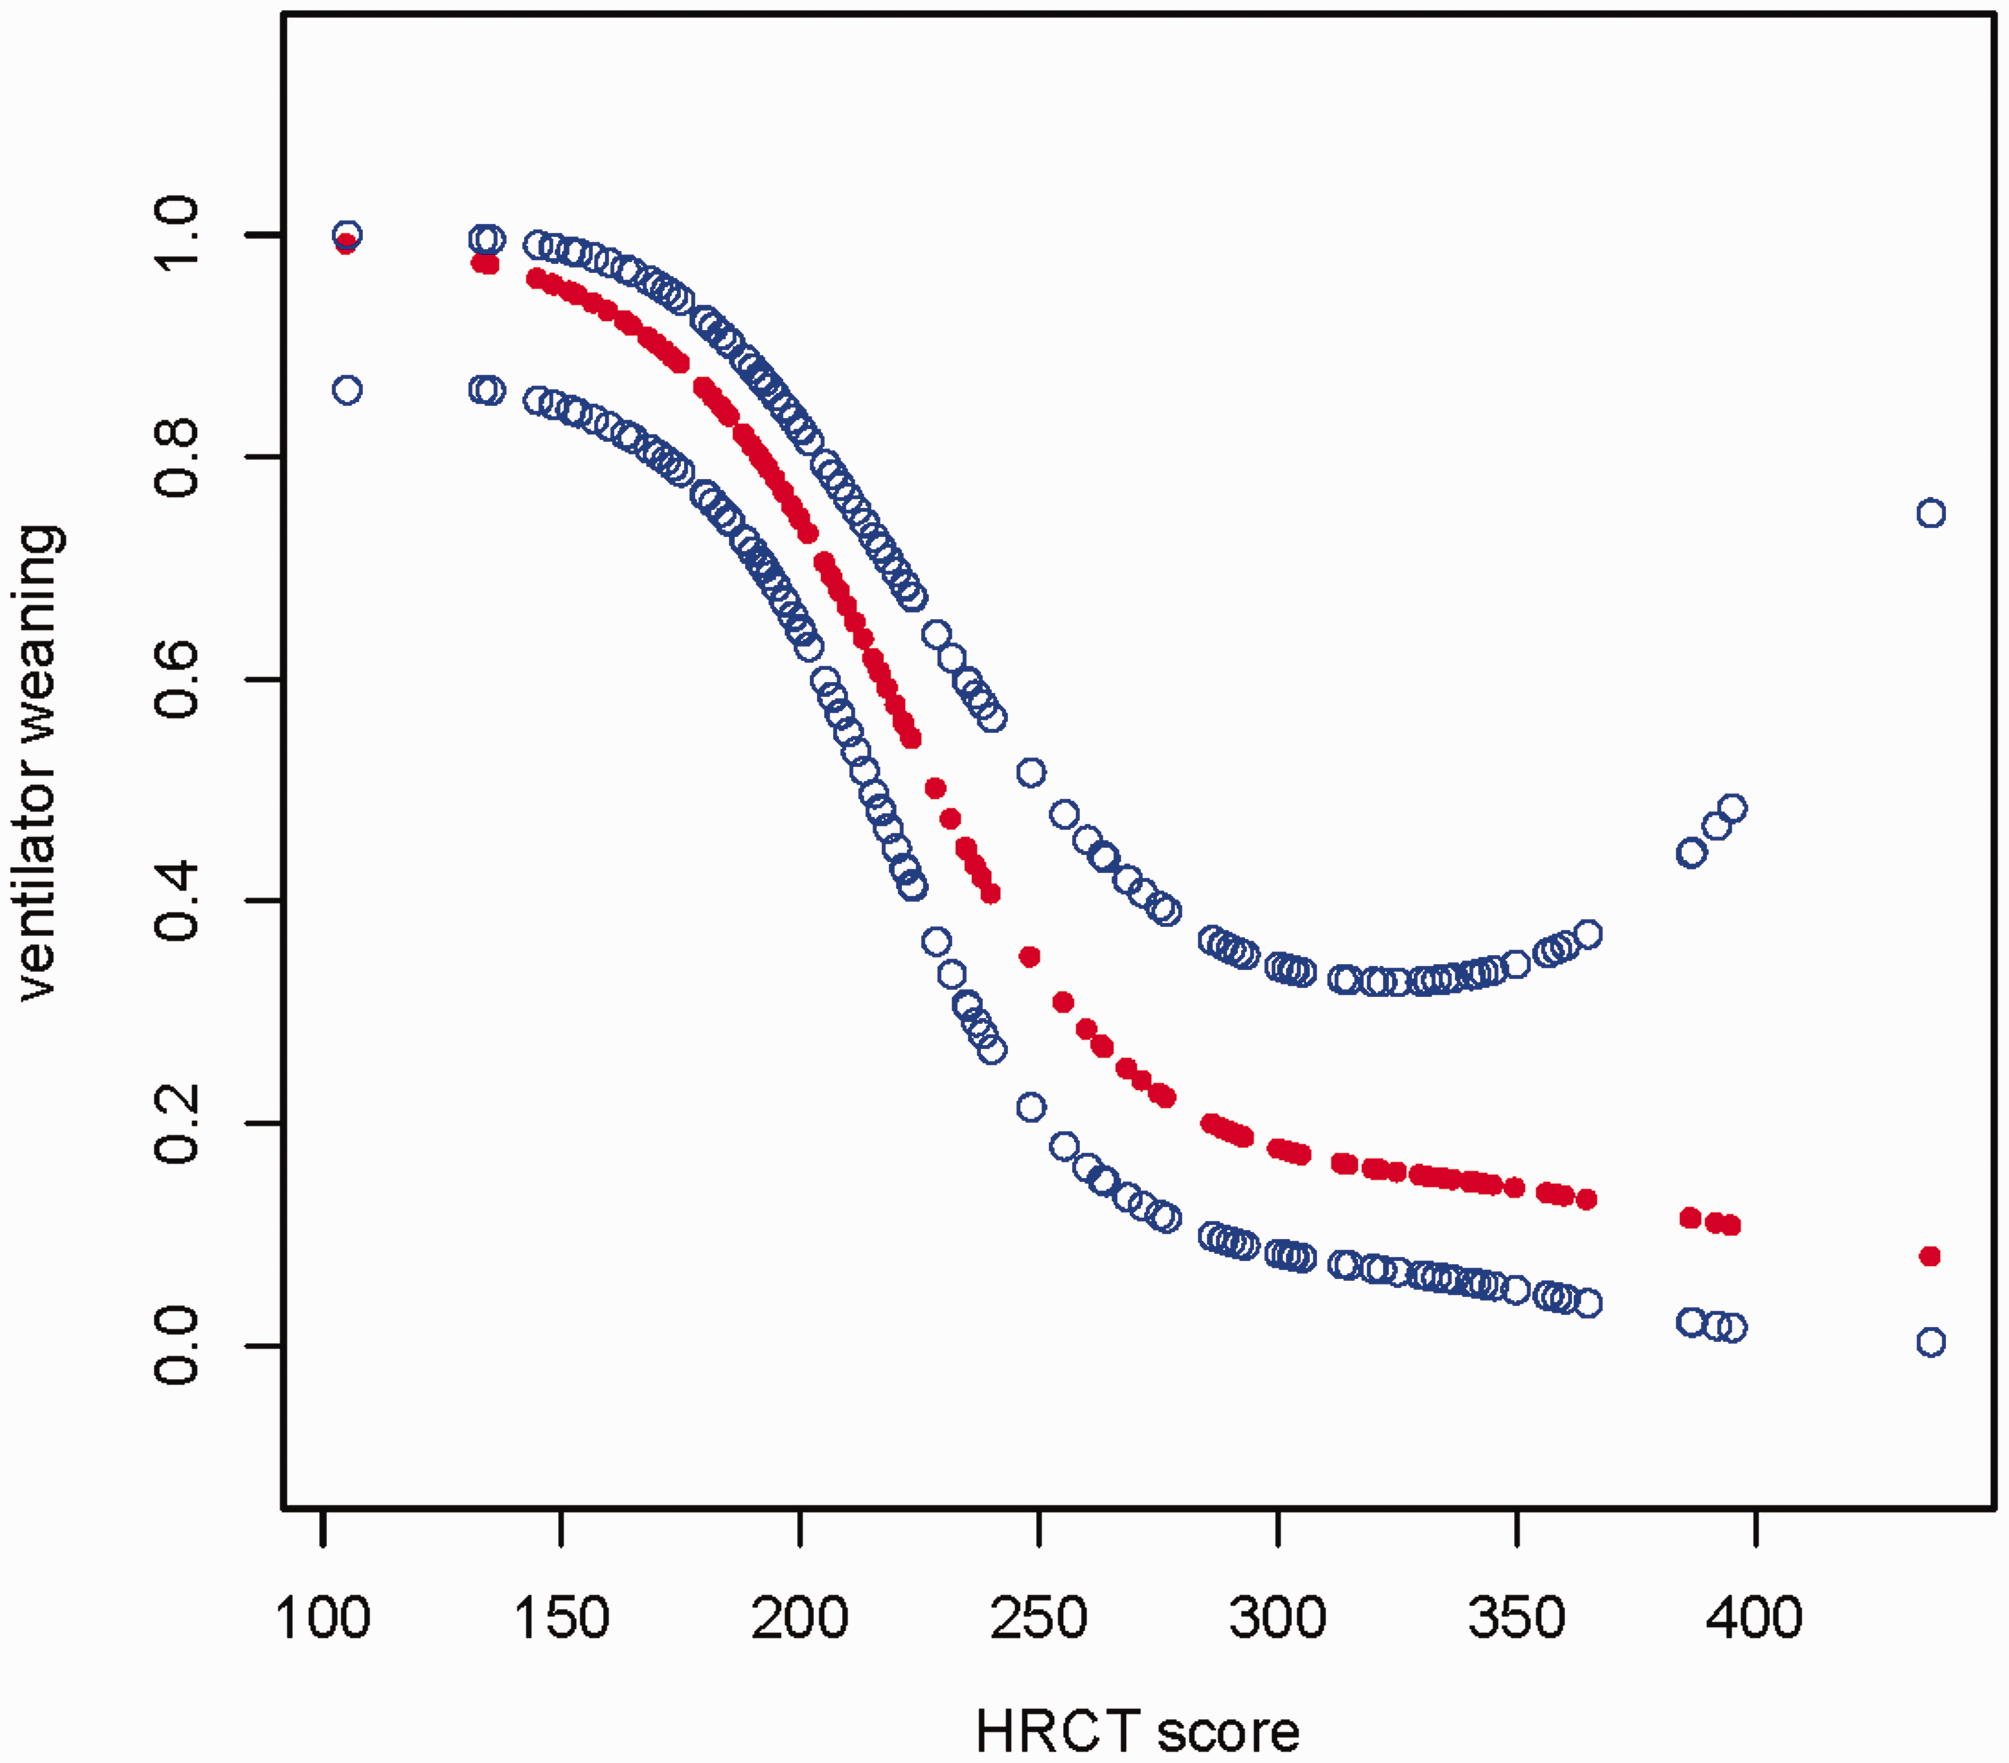
Adjusted smooth-fitting curve of HRCT score for ventilator weaning. HRCT, high-resolution computed tomography.

Unadjusted smooth-fitting curve of HRCT score for 28-day mortality. HRCT, high-resolution computed tomography.

Adjusted smooth-fitting curve of HRCT score for 28-day mortality. HRCT, high-resolution computed tomography.
Threshold analysis
The threshold analysis showed that the threshold HRCT score for ventilator weaning and 28-day mortality was 257.0 and 243.2 points, respectively. When the HRCT score was <257.0, each 1-point increase in the HRCT score was associated with a 4.6% decrease in the rate of ventilator weaning (adjusted OR, 0.954; 95% CI, 0.936–0.972). When the HRCT score was ≥257.0, the rate of ventilator weaning decreased to ≤20% but without statistical significance. When the HRCT score was <243.2, each 1-point increase in the HRCT score was associated with a 4.6% increase in the 28-day mortality rate (adjusted OR, 1.046; 95% CI, 1.026–1.067). When the HRCT score was ≥243.2, the 28-day mortality rate increased to about 60% but without statistical significance (Table 4).
Threshold effect analysis of HRCT score on ventilator weaning and 28-day mortality using piecewise linear regression.

HRCT, high-resolution computed tomography; OR, odds ratio; CI, confidence interval.
Adjusted variables: age, albumin concentration, platelet count, presence of drug-associated acute respiratory syndrome, McCabe score, Acute Physiology and Chronic Health Evaluation II score, and Sequential Organ Failure Assessment score.
Discussion
In this study, we found that the HRCT score was significantly associated with a lower rate of ventilator weaning and a higher risk of 28-day mortality in patients with ARDS. In addition, HRCT scores of 257.0 and 243.2 were the thresholds for ventilator weaning and 28-day mortality, respectively. When the HRCT score was above the threshold, the rate of ventilator weaning decreased to ≤20% and the 28-day mortality rate increased to about 60%. When the HRCT score was below the threshold, each 1-point increase in the HRCT score was associated with a 4.6% decrease in the rate of ventilator weaning and a 4.6% increase in the 28-day mortality rate.
Several studies have shown that HRCT can provide an accurate assessment of the pattern, distribution, activity, and potential reversibility of diffuse lung disease in patients with ARDS.9,13,14 A study by Li et al., 15 which included eight survivors of severe ARDS after extracorporeal membrane oxygenation, post-treatment lung HRCT showed various degrees of morphological changes in the lung parenchyma, and the authors found that the severity of these changes may be associated with the disease duration. In another prospective observational cohort study of 85 patients with ARDS, pulmonary fibroproliferation assessed by HRCT in patients with early ARDS predicted increased mortality with an increased susceptibility to multiple organ failure, including ventilator dependency and its associated outcomes. 16 The conclusions of these studies are consistent with our conclusion that HRCT has high predictive value for the severity and prognosis of ARDS. Compared with these studies, however, we had a larger sample size and adjusted for possible confounding factors that may affect the outcome of ARDS, making our conclusions be more reliable. 17
A major finding of the present study is that the HRCT score was an important risk factor for ventilator weaning and a higher risk of 28-day mortality in patients with ARDS. A study by Anan et al. 11 showed that fibroproliferative changes on HRCT were associated with ventilator weaning and 60-day mortality. Although there seems to be a great difference between their study results and ours, Anan et al. 11 adopted data transformation to increase the effect of their results by 10 times. Therefore, our results are consistent with theirs.
In the study by Anan et al., 11 receiver operating characteristic curve analysis was used to identify a cut-off value (HRCT score of 210) with relatively low accuracy for ventilator weaning (area under the curve, 0.77; 95% CI, 0.67–0.88) and 60-day mortality (AUC, 0.71; 95% CI, 0.61–0.82) and without adjustment for possible risk factors. In our study, we adopted a curve-fitting analysis and threshold analysis to identify the threshold for ventilator weaning and 28-day mortality with adjustment for possible risk factors. HRCT scores of 257.0 and 243.2 were the thresholds for ventilator weaning and 28-day mortality, respectively. When the HRCT score was >257.0, the rate of ventilator weaning decreased to ≤20%. When the HRCT score was >243.2, the 28-day mortality rate increased to about 60%. When the HRCT score was <257.0, each 1-point increase in the HRCT score was associated with a 4.6% decrease in the rate of ventilator weaning. When the HRCT score was <243.2, each 1-point increase in the HRCT score was associated with a 4.6% increase in the 28-day mortality rate. Hence, the results of our study are more reliable and have better clinical application value.
Limitations
This study has two main limitations. First, it was a retrospective study with a relatively small sample size. Therefore, its conclusions require further verification in a prospective study with a larger sample size. 18 Second, the study data were obtained from a shared database; thus, some potential confounding variables could not be fully controlled.
Conclusion
The HRCT score was associated with ventilator weaning and 28-day mortality at thresholds of 257.0 and 243.2, respectively.
Footnotes
Abbreviations
HRCT, high-resolution computed tomography; ARDS, acute respiratory distress syndrome; OR, odds ratio; CI, confidence interval; APACHE II, Acute Physiology and Chronic Health Evaluation II; SOFA, Sequential Organ Failure Assessment; DARDS, drug-associated acute respiratory distress syndrome.
Acknowledgement
The authors thank Keisuke Anan for providing the data in the Dryad Database.
Authors’ contributions
Kun Zhao and Shu-juan Bai wrote the manuscript. Zhi-tao Wang, Yu-he Zhang, Hai-gang Song, and Hai-bo Wang performed the statistical analysis. Xin Li checked and corrected the data. Wen-liang You was responsible for the research design and guidance.
Availability of data and material
Please see the additional materials.
Declaration of conflicting interest
The authors declare that there is no conflict of interest.
Ethics approval and consent to participate
New ethics approval was not required because the original author had obtained ethical approval when conducting this study. Consent to participate was also not required because the study was retrospective in nature and the patients’ anonymity was preserved.
Funding
This research received no specific grant from any funding agency in the public, commercial, or not-for-profit sectors.