
Abstract
Objective
To investigate the relationships among serum resistin, adiponectin, and leptin and microvascular complications in patients with type 2 diabetes mellitus (T2DM).
Methods
A total of 120 patients with T2DM were divided into non-microangiopathy and microangiopathy groups. Sixty age- and sex-matched healthy subjects were used as a normal control (NC) group. Body height, body mass, waist circumference, and blood pressure were determined, and waist/hip ratio (WHR), body mass index, blood glucose, lipids, resistin, leptin, adiponectin, free fatty acids (FFA), high-sensitivity C-reactive protein (hs-CRP), fasting insulin, hemoglobin A1c, and homeostatic model assessment of insulin resistance (HOMA-IR) were compared among the three groups.
Results
Serum levels of resistin, leptin, FFA, and hs-CRP were significantly higher and levels of adiponectin were significantly lower in patients in the non-microangiopathy (n = 60) and microangiopathy groups (n = 60) compared with the NC group (n = 60). Serum resistin and leptin levels in patients with T2DM were positively correlated with WHR, hs-CRP, FFA, HOMA-IR, and triglycerides, but negatively correlated with high-density lipoprotein-cholesterol (HDL-C). Serum adiponectin levels in patients with T2DM were negatively correlated with WHR, hs-CRP, FFA, HOMA-IR, and triglycerides, but positively correlated with HDL-C.
Conclusion
Serum resistin, adiponectin, and leptin levels correlate with the occurrence of T2DM and microvascular complications.
Introduction
Diabetic microangiopathy (DMAP) is a complication of diabetes involving pathological changes in the microvascular structure and function of tissues and organs, and includes diabetic retinopathy, diabetic neuropathy, and diabetic nephropathy. 1 DMAP may gradually develop into atherosclerosis, hypertension, and peripheral vascular disease. It is therefore important to ensure the early prevention, identification, treatment, and monitoring of DMAP in patients with type 2 diabetes mellitus (T2DM). 2
Several cytokines may affect insulin sensitivity and glucose metabolism. Resistin is secreted by adipocytes and leptin is an obesity gene-encoded protein, and both are related to abnormal diabetic metabolism, 3 while adiponectin, which is secreted by mature adipocytes, can protect against cardiovascular disease. 4 We explored the relationships among these three cytokines and the occurrence of microangiopathy in patients with T2DM and insulin resistance.
Materials and methods
Subjects
A total of 120 patients with T2DM treated at The First Affiliated Hospital of Hebei North University between December 2014 and December 2015 were recruited for this study. This research was approved by the Ethics Committee of The First Affiliated Hospital of Hebei North University. All patients agreed to participate by providing written informed consent.
Diabetes was diagnosed 5 as a fasting plasma glucose (FPG) level >7.0 mmol/L and a 2-hour oral glucose tolerance test blood glucose level ≥11.1 mmol/L.
A diagnosis of DMAP included the following criteria: (1) diabetic nephropathy: urine albumin (µg)/urine creatinine (mg) ≥300 macroalbuminuria, 30–299 microalbuminuria; (2) diabetic retinopathy: nonproliferative retinopathy including phase I (microaneurysm), phase II (hard exudate and hemorrhagic spots), and phase III (cotton wool spot), and proliferative retinopathy including phase IV (retinal neovascularization and vitreous hemorrhage), phase V (fibroplasia), and phase VI (tractional detachment of retina); (3) diabetic neuropathy: peripheral neuropathy symptoms and reduced conduction velocity of motor and sensory nerves.
The exclusion criteria were chronic heart failure, myocardial infarction, acute cerebrovascular disease, severe liver dysfunction, uremia, Cushing’s syndrome, and malignancy.
Groups
The 120 patients were divided evenly into microangiopathy (MAP) and non-MAP groups. Sixty age- and sex-matched healthy subjects were included as the normal control (NC) group. Information regarding the trial was posted on our hospital’s website, allowing people who wanted to participate in the trial to contact us. The healthy subjects were selected from among these people.
Reagents and methods
Blood glucose and lipid kits were obtained from Ningbo Asia-Pacific Biotechnology Ltd. (Ningbo, China). Resistin, leptin, adiponectin, and free fatty acid (FFA) kits were from RapidBio (Richmond, VA, USA). All analyses were carried out according to the manufacturers’ instructions.
Observation indexes
Body height, body mass, waist circumference, and blood pressure were determined and body mass index (BMI) was calculated. Fasting venous blood was collected and centrifuged at 1509.3 × g, and FBG, triglycerides (TG), total cholesterol (TC), high-density lipoprotein cholesterol (HDL-C), and low-density lipoprotein cholesterol (LDL-C) levels in the supernatant were measured using an AU5400 automatic biochemical analyzer (Hitachi Medical Corporation, Tokyo, Japan). Fasting insulin (FINS) was measured by radioimmunoassay, and hemoglobin A1c (HbA1c) was determined by colorimetry using appropriate kits (Cusabio, Houston, TX, USA). Serum resistin, leptin, adiponectin, and FFAs were detected by enzyme-linked immunosorbent assays (Cusabio). Homeostatic model assessment of insulin resistance (HOMA-IR) was calculated as = FPG × FINS/22.5.
Statistical analysis
Statistical analyses were carried out using SPSS Statistics for Windows, Version 17.0 (SPSS Inc., Chicago, IL, USA). Measured data were expressed as mean ± standard deviation. Numerical data were compared by χ2 tests, variables were compared between groups by analysis of variance, and means were compared by t-tests. We also performed multivariate stepwise regression analysis using resistin, leptin, and adiponectin as dependent variables and BMI, WHR, FPG, FINS, HOMA-IR, and TG as independent variables. The significance level was set as P = 0.05.
Results
Patient characteristics
The patient characteristics are detailed in Table 1. The mean disease-progression times were 10.3 ± 2.4 years (range, 6–13 years) and 11.0 ± 2.1 years (range, 7–14 years) in the non-MAP and MAP groups, respectively.
Comparison of indexes in relation to presence of diabetic microangiopathy in patients with type 2 diabetes mellitus.

*P < 0.05 compared with NC group; †P < 0.05 compared with non-MAP group.
NC, normal control; MAP, microangiopathy; M, male; F, female; BMI, body mass index; WHR, waist-hip ratio; SBP, systolic blood pressure; DBP, diastolic blood pressure; FPG fasting plasma glucose; HbA1c, hemoglobin A1c; FINS, fasting insulin; HOMA-IR, homeostatic model assessment of insulin resistance; TC, total cholesterol; TG, triglycerides; HDL-C, high-density lipoprotein cholesterol; LDL-C, low-density lipoprotein cholesterol; FFA, free fatty acids; Hs-CRP, high-sensitivity C-reactive protein.
General condition and related indexes
The waist-hip ratio (WHR), FPG, HbA1c, FINS, HOMA-IR, TG, FFA, and high-sensitivity C-reactive protein (hs-CRP) levels were all significantly increased in the MAP and non-MAP groups compared with the NC group (P < 0.05), and WHR, FINS, HOMA-IR, HbA1c, and TG levels were all significantly increased in the MAP compared with the non-MAP group (P < 0.05) (Table 1).
Comparison of serum resistin, leptin, and adiponectin levels
Serum resistin and leptin levels were significantly higher in the MAP and non-MAP groups compared with the NC group (P < 0.05), and were significantly higher in the MAP compared with the non-MAP group (P < 0.05). In contrast, serum adiponectin levels were significantly lower in the MAP and non-MAP groups compared with the NC group (P < 0.05), and significantly lower in the MAP compared with the non-MAP group (Table 1).
Correlation analyses of resistin, leptin, and adiponectin levels
Serum resistin and leptin levels were positively correlated with FFA (P = 0.001 and P < 0.001, respectively), hs-CRP (both P < 0.001), WHR (P = 0.036 and P = 0.005, respectively), TG (P = 0.014 and P = 0.011, respectively), and HOMA-IR levels (P = 0.002 and P < 0.001, respectively), and were negatively but not significantly correlated with HDL-C levels. Furthermore, adiponectin levels were negatively correlated with FFA (P = 0.003), hs-CRP (P = 0.002), WHR (P = 0.022), TG (P = 0.009), and HOMA-IR (P < 0.001), and positively but not significantly correlated with HDL-C levels. However, none of the three cytokines were correlated with BMI, TC, LDL-C, systolic blood pressure (SBP), or diastolic blood pressure (DBP). In addition, serum resistin and leptin levels were significantly positively correlated with each other (r = 0.545, P < 0.001), and both were significantly negatively correlated with adiponectin levels (r = −0.429, P < 0.001; r = −0.469, P < 0.001, respectively) (Table 2).
Correlations between serum resistin, leptin, and adiponectin and related indexes in patients with type 2 diabetes mellitus.

BMI, body mass index; WHR, waist-hip ratio; FINS, fasting insulin; HOMA-IR, homeostatic model assessment of insulin resistance; TC, total cholesterol; TG, triglycerides; HDL-C, high-density lipoprotein cholesterol; LDL-C, low-density lipoprotein cholesterol; FFA, free fatty acids; Hs-CRP, high-sensitivity C-reactive protein.
Multivariate stepwise regression analysis
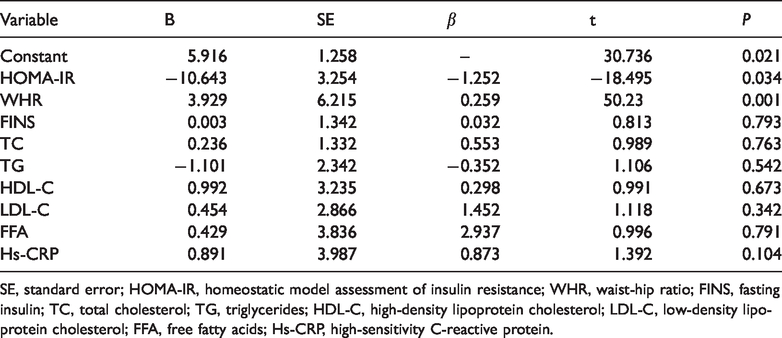
Multivariate stepwise regression analysis using resistin, leptin, and adiponectin as dependent variables and BMI, WHR, FPG, FINS, HOMA-IR, and TG as independent variables (Tables 3–5) showed that HOMA-IR and WHR had the greatest influences on resistin, leptin, and adiponectin.
Multiple stepwise regression analysis with resistin as the dependent variable.

SE, standard error; HOMA-IR, homeostatic model assessment of insulin resistance; WHR, waist-hip ratio; FINS, fasting insulin; TC, total cholesterol; TG, triglycerides; HDL-C, high-density lipoprotein cholesterol; LDL-C, low-density lipoprotein cholesterol; FFA, free fatty acids; Hs-CRP, high-sensitivity C-reactive protein.
Multiple stepwise regression analysis with leptin as the dependent variable.

SE, standard error; HOMA-IR, homeostatic model assessment of insulin resistance; WHR, waist-hip ratio; FINS, fasting insulin; TC, total cholesterol; TG, triglycerides; HDL-C, high-density lipoprotein cholesterol; LDL-C, low-density lipoprotein cholesterol; FFA, free fatty acids; Hs-CRP, high-sensitivity C-reactive protein.
Multiple stepwise regression analysis with adiponectin as the dependent variable.
SE, standard error; HOMA-IR, homeostatic model assessment of insulin resistance; WHR, waist-hip ratio; FINS, fasting insulin; TC, total cholesterol; TG, triglycerides; HDL-C, high-density lipoprotein cholesterol; LDL-C, low-density lipoprotein cholesterol; FFA, free fatty acids; Hs-CRP, high-sensitivity C-reactive protein.
Discussion
Resistin strongly affects insulin and promotes elevated blood glucose, adipocyte proliferation, and obesity.6,7 Shanker et al. 5 reported that leptin upregulated expression levels of matrix metalloproteinases 2 and 9 and tissue inhibitor matrix metalloproteinase 1 in endothelial cells and promoted extravascular matrix recombination, resulting in atherosclerosis. Leptin may also affect vascular calcification.8–10 Adiponectin is negatively correlated with body lipid content and can correct glucose and lipid disorders, reduce inflammation and insulin sensitivity, and inhibit the development of AS.11–13
We found that serum levels of resistin, leptin, FFA, and hs-CRP were significantly higher in patients with T2DM compared with healthy subjects, and resistin, leptin, and hs-CRP were also significantly higher in the MAP compared with the non-MAP group. In contrast, adiponectin levels were significantly decreased in the non-MAP and MAP groups compared with the NC group, and were significantly lower in the MAP compared with the non-MAP group. These results were consistent with the study of Fang et al.,14,15 indicating crucial roles for serum resistin, leptin, and adiponectin in the incidence and evolution of DMAP.
Serum resistin and leptin were also positively correlated with FFA, hs-CRP, WHR, TG, and HOMA-IR, while adiponectin was negatively correlated with these same parameters. However, although WHR can affect resistin, leptin, and adiponectin levels, it was not considered as a confounding factor when comparing resistin, leptin, and adiponectin levels among the groups in this study, and this should be accounted for in future studies. In addition, the sample size in the current study was small. Furthermore, the use of fewer variables may produce more confirmative results. We also did not explore the mechanisms responsible for the phenomena observed in this study. These limitations should be addressed in future studies.
In conclusion, WHR, FINS, HOMA-IR, HbA1c, and TG were all significantly increased in patients with T2DM and MAP. Serum resistin and leptin were positively correlated with WHR, hs-CRP, FFA, HOMA-IR, and TG, but negatively correlated with HDL-C, while serum adiponectin was negatively correlated with WHR, hs-CRP, FFA, HOMA-IR, and TG, but positively correlated with HDL-C. Serum resistin was positively correlated with leptin, but negatively correlated with adiponectin. In conclusion, serum resistin, adiponectin, and leptin levels are correlated with the occurrence of T2DM and microvasculopathy complications.