
Abstract
Background
Because of the finite size of the development sample, predicted probabilities from a risk prediction model are inevitably uncertain. We apply value-of-information methodology to evaluate the decision-theoretic implications of prediction uncertainty.
Methods
Adopting a Bayesian perspective, we extend the definition of the expected value of perfect information (EVPI) from decision analysis to net benefit calculations in risk prediction. In the context of model development, EVPI is the expected gain in net benefit by using the correct predictions as opposed to predictions from a proposed model. We suggest bootstrap methods for sampling from the posterior distribution of predictions for EVPI calculation using Monte Carlo simulations. We used subsets of data of various sizes from a clinical trial for predicting mortality after myocardial infarction to show how EVPI changes with sample size.
Results
With a sample size of 1000 and at the prespecified threshold of 2% on predicted risks, the gains in net benefit using the proposed and the correct models were 0.0006 and 0.0011, respectively, resulting in an EVPI of 0.0005 and a relative EVPI of 87%. EVPI was zero only at unrealistically high thresholds (>85%). As expected, EVPI declined with larger samples. We summarize an algorithm for incorporating EVPI calculations into the commonly used bootstrap method for optimism correction.
Conclusion
The development EVPI can be used to decide whether a model can advance to validation, whether it should be abandoned, or whether a larger development sample is needed. Value-of-information methods can be applied to explore decision-theoretic consequences of uncertainty in risk prediction and can complement inferential methods in predictive analytics. R code for implementing this method is provided.
Keywords
Highlights
Uncertainty in the outputs of clinical prediction models has largely been approached from a purely statistical perspective.
In decision theory, uncertainty is associated with loss of benefit because it can prevent one from identifying the most beneficial decision.
This article extends value-of-information methods from decision theory to risk prediction and quantifies the expected loss in net benefit due to uncertainty in predicted risks.
Value-of-information methods can complement statistical approaches when developing or validating clinical prediction models.
Introduction
A risk prediction model can be seen as a mathematical function that maps an individual’s characteristics to their predicted risk of an event, enabling risk-stratified treatment decisions. The development of a risk prediction model is typically based on individual-level data from a finite sample. As such, the resulting predictions are inherently uncertain. In practice, uncertainty in predictions is often ignored, and a deterministic function is advertised as the final model. For example, the proposed model can be the set of (penalized) maximum likelihood estimates of coefficients in a classical regression framework or the final state of a machine-learning model such as an artificial neural network. Such determinism in predictions might have stemmed from the need to use the model at the point of care, where it is most practical to make decisions based on a single good estimate of risk. Notwithstanding such practicality, uncertainty in predictions remains relevant: had we used another sample for model development, we could have arrived at a different model, a different predicted value for the patient, and thus potentially a different treatment decision.
The topic of the development sample size in risk prediction is a subject of active research. Recent developments on sample size calculations have focused on meeting prespecified criteria on prediction error 1 or on overall calibration performance such as mean calibration or the degree of optimism in predictions.2,3 The adequacy of the development sample of a given size has also been investigated in terms of the stability of predictions. 4 Despite targeting different objectives, such approaches are fundamentally concerned with the accuracy of predictions from a purely statistical perspective. Given that risk prediction models are used for patient care, of ultimate relevance is to what extent such uncertainty affects the outcome of treatment decisions. This perspective of prediction uncertainty is not sufficiently investigated.
We are motivated by the approach taken in the field of decision analysis to tackle a similar problem. In informing policy decisions about the adoption of new interventions, decision-analytic (e.g., cost-effectiveness) models are developed that quantify the net benefit (NB) of each competing intervention at the population level. 5 Such models are based on uncertain input parameters such as treatment effect or costs of disease management. Thus, the resulting NB projections are uncertain. The impact of such uncertainty is that the intervention that is identified as having the highest expected NB might not be the one with the highest true NB. Consequently, uncertainty is associated with an expected loss in NB. The expected value of this loss, termed the expected value of perfect information (EVPI), can be quantified from the output of a probabilistic decision-analytic model. 6 This approach and its extensions, broadly referred to as value-of-information analysis, 7 provide a fully decision-theoretic framework for quantifying the impact of uncertainty in health policy making. 8
In this work, we extend the definition of EVPI from decision analysis to the development phase of risk prediction models, with the aim of quantifying the expected loss in NB due to uncertainty in estimating model parameters from a finite development sample. This provides a decision-theoretic approach to the question that naturally arises after the development of a risk prediction model: whether the model is “good enough” and can advance to the next stage of research, whether it should be abandoned, or whether more evidence is needed to decide.9,10
Net Benefit Calculations for Risk Prediction Models
The NB approach for evaluating the utility of risk prediction models has gained significant popularity because of its rigorous decision-theoretic underpinning as well as its relative ease of calculation.
11
To turn a continuous predicted risk to a binary action (treat or not treat), one needs to specify a context-dependent treatment threshold on predicted risks. Such a threshold should ideally be informed by the relative weight of clinical consequences of false-positive (harm) versus true-positive (benefit) classifications. Vickers and Elkin showed that this threshold acts as an exchange rate between true- and false-positive outcomes, enabling the calculation of NB.
11
Imagine a decision maker (e.g., a guideline development team after consulting a patient group about their preferences) concludes that patients with acute myocardial infarction (AMI) should receive a more aggressive treatment if their 30-d risk of mortality is >2% and no such treatments if the predicted risk is <2%. The group is ambivalent between treatment and no treatment if the predicted risk is precisely 2%. Such ambivalence indicates that the decision maker equates the benefits associated with a 2% chance of true positive to be equal to the harms associated with a 98% chance of false positive. This itself means the benefit of a true-positive diagnosis is 49 times the harm of a false-positive diagnosis. This enables the calculation of NB in true-positive units net of harms in false-positive units. Generalizing this approach, at threshold value of
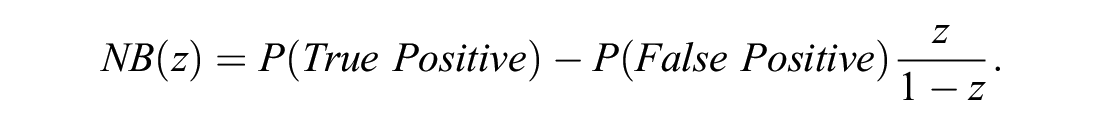
Here,
Imagine we have a proposed model based on a development sample of

The NB of the model should always be compared with that of at least 2 alternatives: treating none and treating all. We use the “opt-in” definition of NB and set the default decision to be treating no one, with NB = 0. 9 The decision to treat all is equal to assuming each individual is positive, whose NB can be consistently estimated as

If there are preexisting models applicable to this decision context, their NB should also be compared with the NB of the model. However, to facilitate the developments and without loss of generality, we assume the proposed model is the only relevant risk prediction algorithm.
Evaluating a model in the same sample in which it is developed might result in optimistic conclusions about its performance. 12 A commonly employed method for correcting for such optimism is the Harrell's bootstrap. 13 This approach involves obtaining a bootstrap sample from the development data set, fitting a new model in this sample, and calculating the NB (or other metrics) for the new model in the same bootstrap sample as well as in the original sample and then recording the difference. Repeating these steps many times and averaging the differences will provide an estimate of optimism. This approach is based on the notion that the difference between the performance of the model in the bootstrap sample and in the original sample is an almost unbiased estimate of the difference between its performance in the original sample and in the generating population. 14
A Bayesian Approach toward NB Calculation
Value-of-information analysis is a strictly Bayesian paradigm as it treats the unknown true associations as random entities for which we have partial information.
6
Here, the random entity of interest is the “correct” (i.e., strongly calibrated
15
) model, indexed by a set of unknown parameters θ, that for the ith individual returns the correct risk
The crucial next step is to recognize that if the correct risks are available, we can replace the observed response

This equation is similar to the equation for

Unlike the conventional estimator for NB, this estimator is the posterior mean in a Bayesian framework, and the frequentist notion of optimism is not directly applicable to it: rather than being based on a single value of θ that might provide an overly good fit to the data, it is the average of NB estimates across the distribution

which is, again, the same as

The EVPI
If we know the correct model, the optimal decision is to use it, instead of the proposed model, for prediction. Indeed, no decision that is based on candidate predictors is more efficient than giving treatment only to those whose correct risk, based on such predictors, is above the threshold. If the true θ is known, the NB of such an optimal strategy can be estimated consistently in the sample as

Again, we do not know the true value of

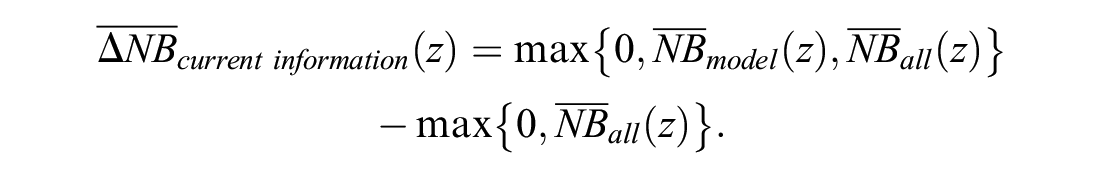
On the other hand, without knowing the correct model, the best we can do is to decide whether to use the model, treat no one, or treat all based on their expected NB. The expected NB under current information is therefore
The difference in expected NB with perfect information compared with current information is the expected gain due to knowing the correct model (or expected loss due to not knowing the correct model), which we call the EVPI for model development:

EVPI is a nonnegative scalar quantity that is in the same unit as the NB for risk models, and its higher values indicate higher expected loss due to prediction uncertainty.
Relative EVPI
The scale of NB in risk prediction is domain specific, unlike in decision analysis, where NB is typically in the universally interpretable monetary units. As such, the numerical value of EVPI here is the most interpretable in comparison with the expected NB that the model provides. To facilitate this comparison, we suggest a relative version of EVPI. Without using any model, we can choose between treating none or treating all, a decision that confers an expected NB of
Similarly, the expected ΔNB with knowing the correct risks is

The EVPI is the difference between the 2 terms. We suggest the relative EVPI (EVPIr) as their ratio:

This quantity is ≥1 and can be expressed in percentages. An EVPIr of 1 +α means that against the baseline strategy of not using any model, the expected gain in NB with the use of the correct model is α×100% higher than the expected gain in NB with the use of the proposed model. The EVPIr is +∞ when the denominator is zero but the numerator is positive. This indicates that under current information, the proposed model is not expected to provide extra NB, but the correct model is. Thus, further development might be justified.
A Generic Algorithm for EVPI Calculation Based on Bootstrapping
The Bayesian estimators in the previous sections require taking expectations with respect to
A more flexible approach is to obtain samples from
The ordinary bootstrap can also be seen as assigning weights to the sample, with weights coming from
This bootstrap-based approach for sampling from
Generic Algorithm (Left) and an Exemplary R Implementation (Right) for the Bootstrap-Based EVPI Calculations a
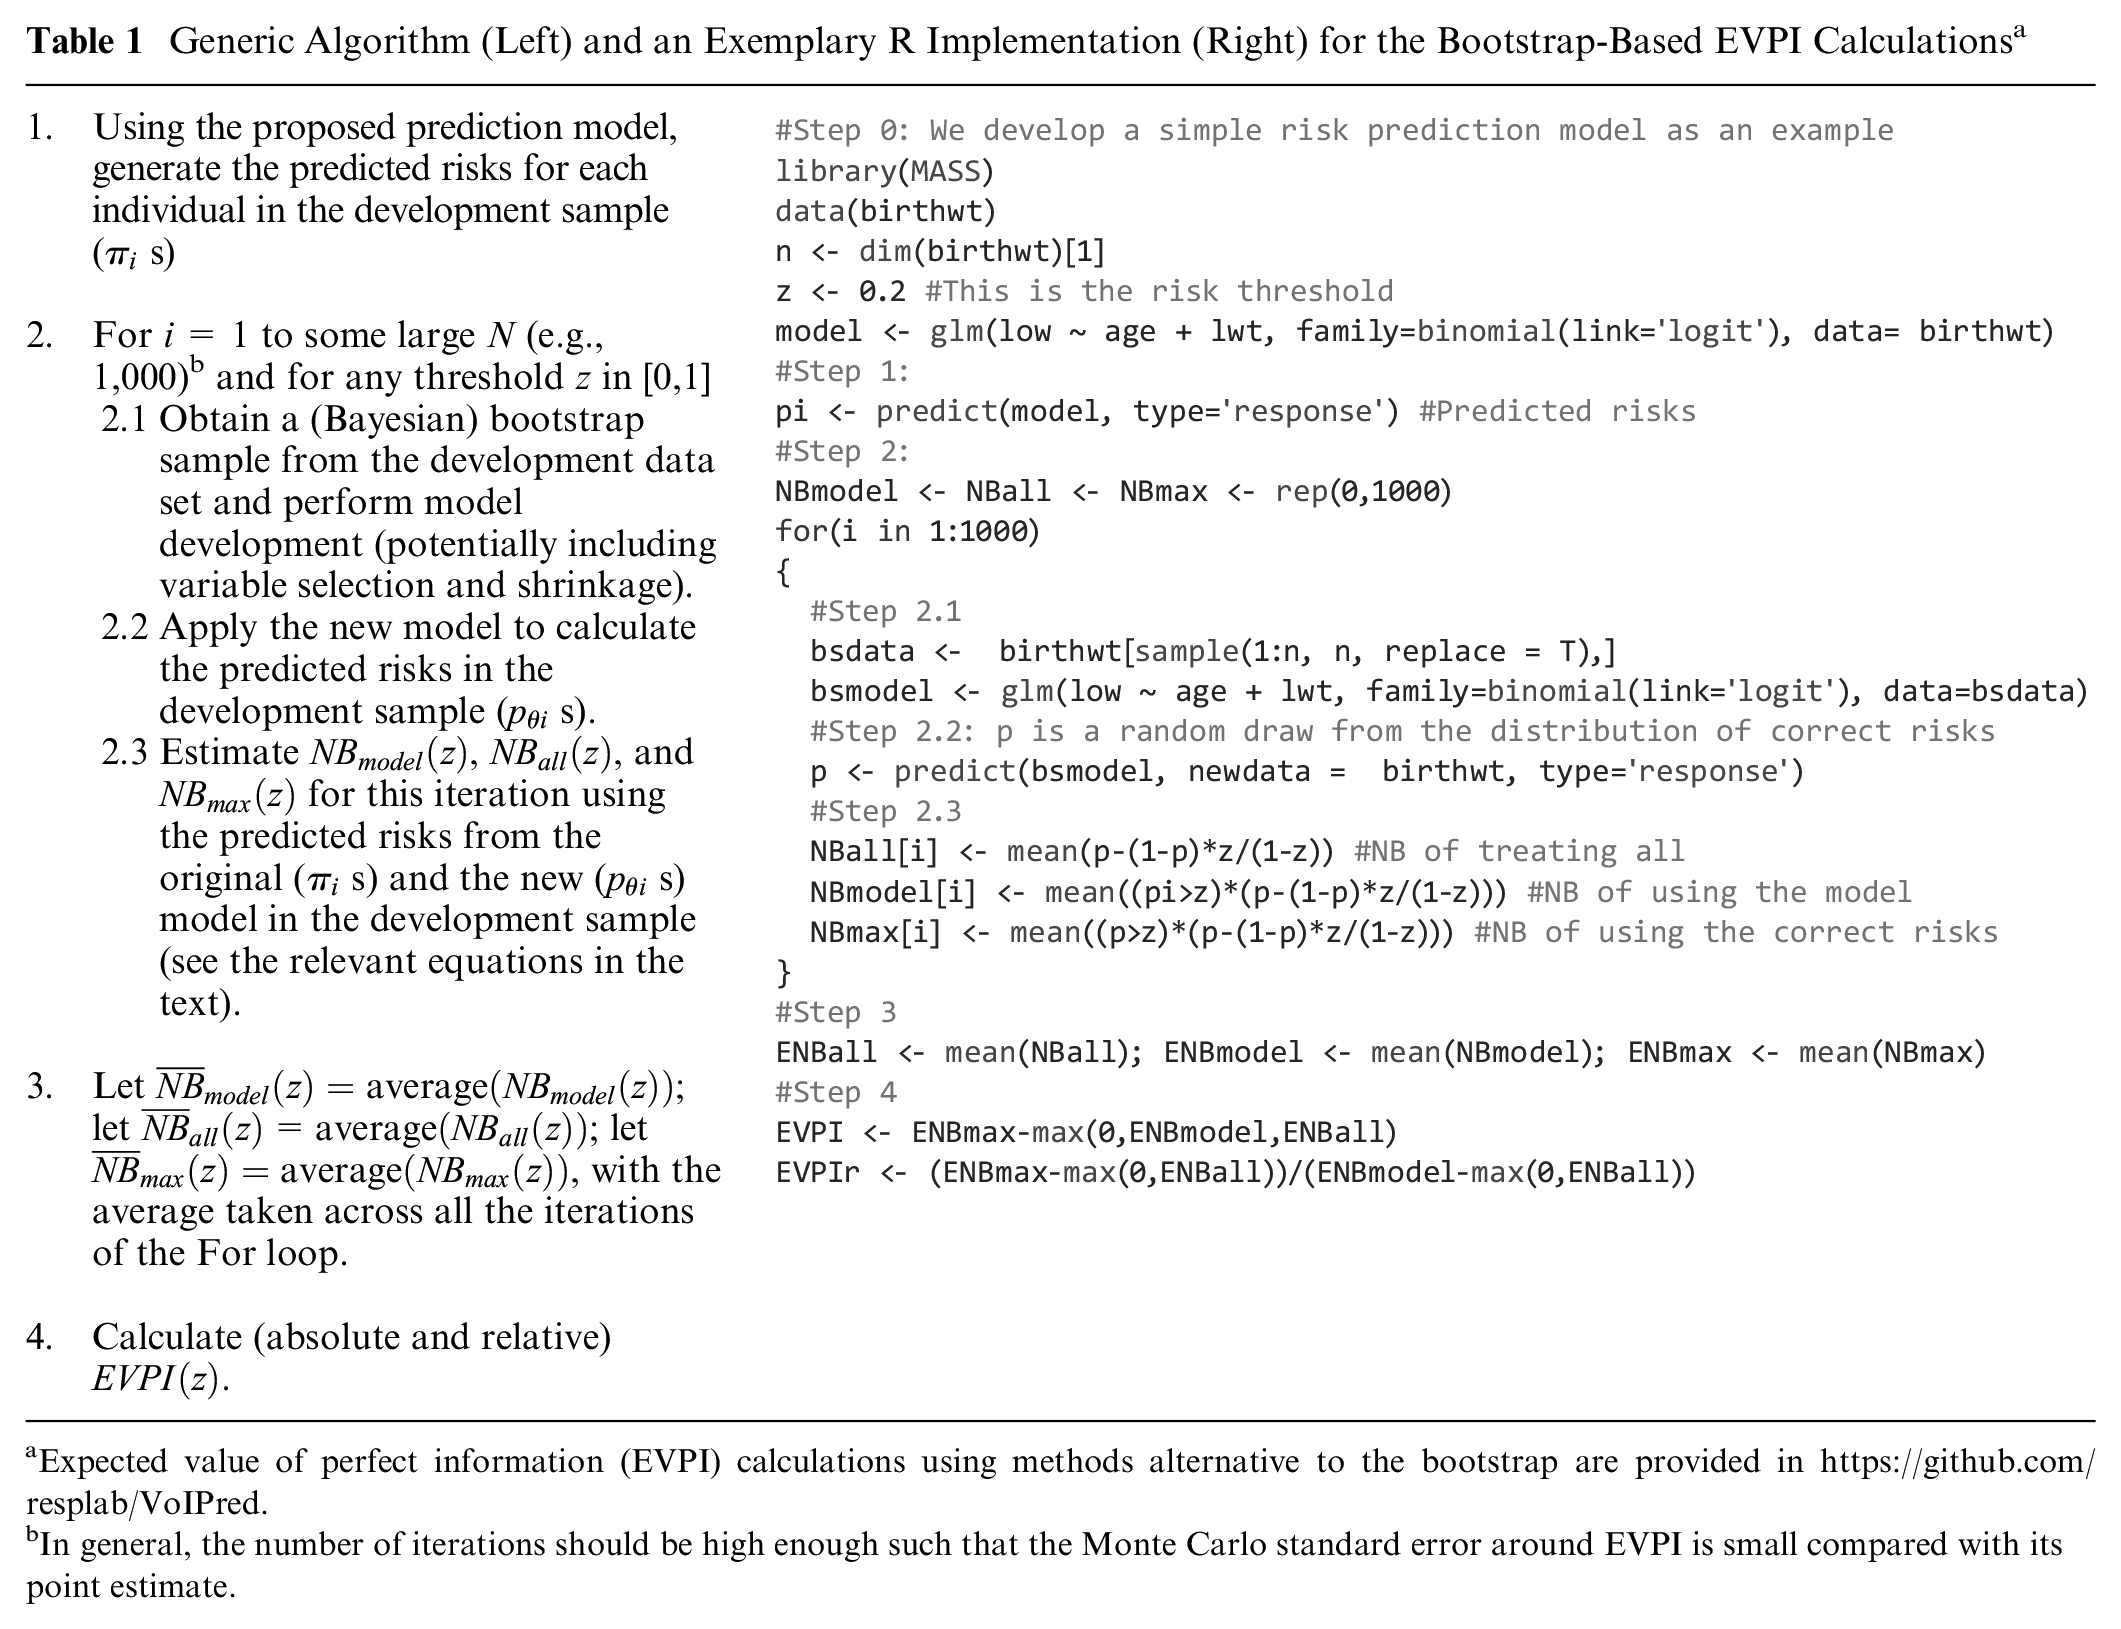
Expected value of perfect information (EVPI) calculations using methods alternative to the bootstrap are provided in https://github.com/resplab/VoIPred.
In general, the number of iterations should be high enough such that the Monte Carlo standard error around EVPI is small compared with its point estimate.
Case Study: Prediction of Mortality after AMI
Identifying the risk of immediate mortality after an AMI can enable stratification of more aggressive treatments for high-risk individuals. GUSTO-I was a large clinical trial of multiple thrombolytic strategies for AMI. 19 We used data from this study to create a risk prediction model for 30-d mortality after AMI (the primary endpoint of the trial). GUSTO-I’s sample size of 40,830 is larger than typical sizes of development samples in most practical contexts, resulting in a low level of prediction uncertainty. 20 This provides an opportunity for simulating development samples of smaller sizes that are more typical and studying how EVPI changes as the sample size varies. To start, we assume that we have access to data for only 1000 patients. We randomly selected, without replacement, 1000 individuals from the full sample of GUSTO-I to create such an exemplary development data set. Thirty-day mortality risk was 7.0% in the full sample and 6.7% in this subsample.
In line with previous studies using this data set,21,22 our candidate predictors included Killip score (an indicator of heart failure), age, blood pressure, pulse, infarction location, preexisting hypertension, and diabetes. To mitigate the risk of overfitting, we fitted a logistic model via the least absolute shrinkage and selection operator (LASSO), with 10-fold cross-validation to find the optimum shrinkage. Table 2 provides the coefficients of the proposed model. Three candidate predictors were shrunk to zero (not selected) in the final model. To demonstrate uncertainty in regression coefficients, we also report the bootstrap-based 95% confidence intervals and the proportion of bootstraps in which each predictor was selected by LASSO. Confidence intervals, optimism corrections, and EVPI calculations were based on 1000 bootstraps. Computations were performed in R development environment (with glmnet package for LASSO). 23
Regression Coefficients for the Proposed Model
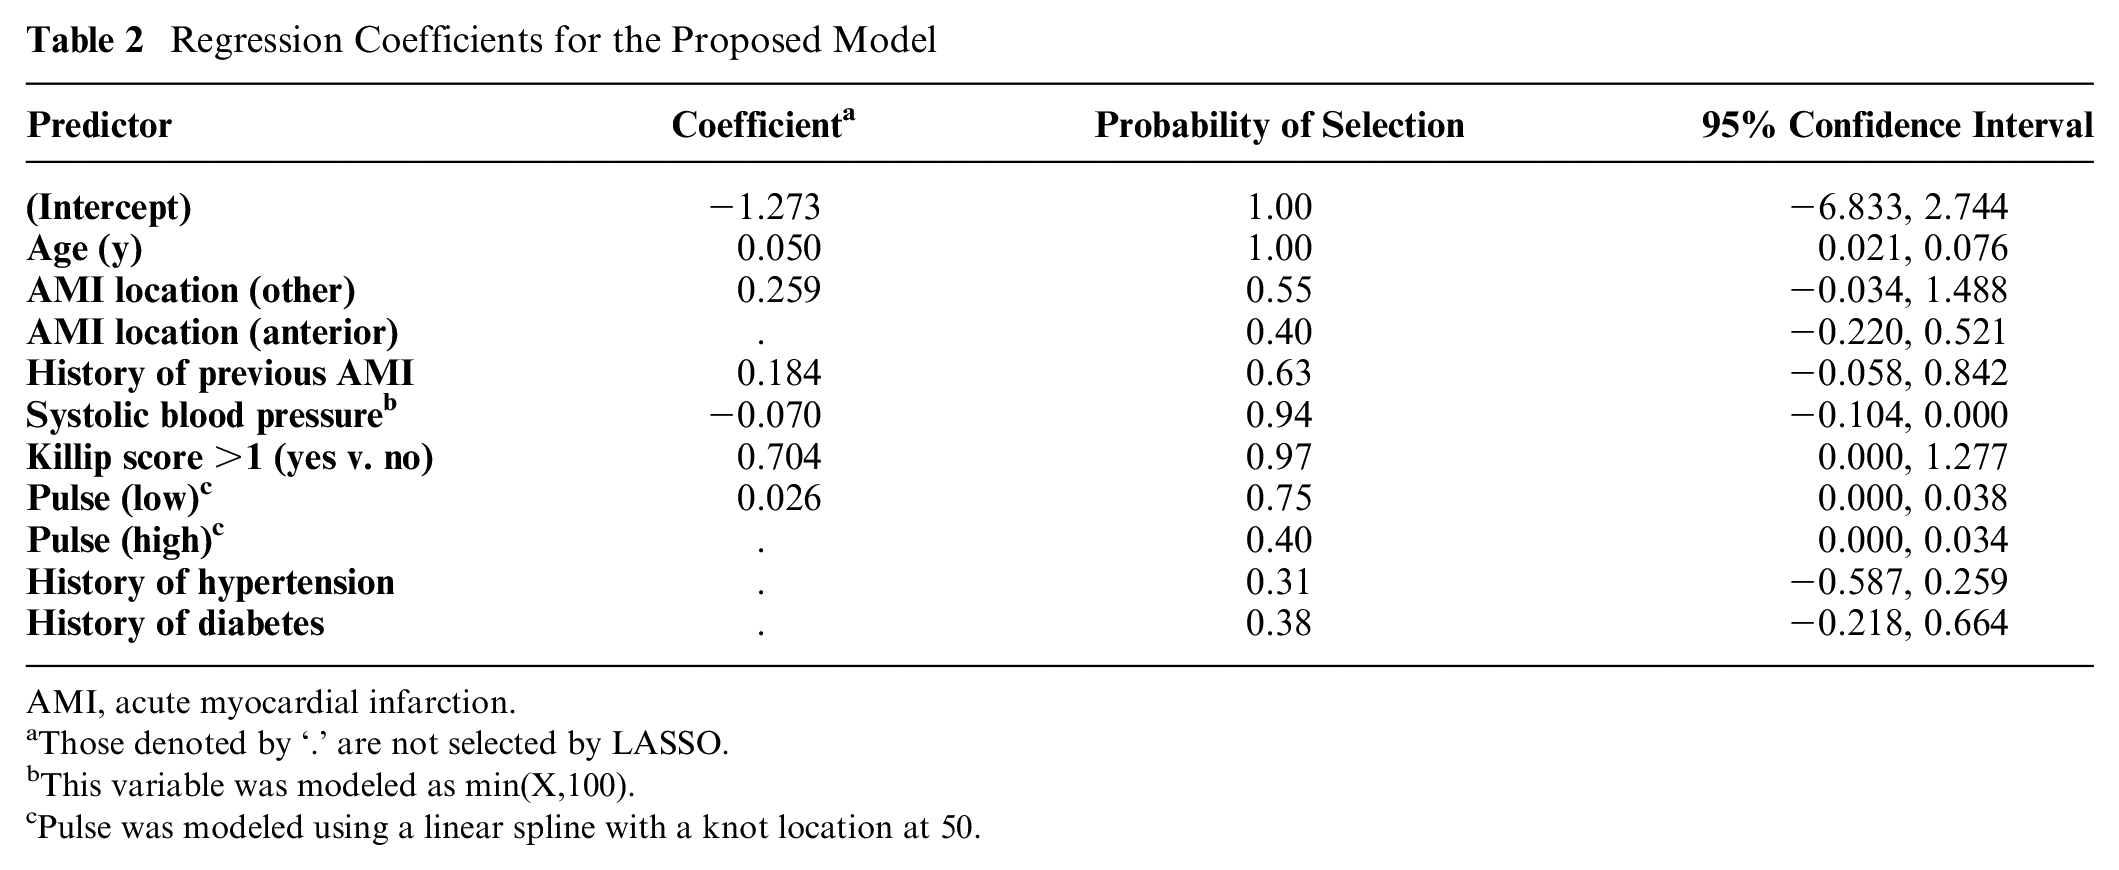
AMI, acute myocardial infarction.
Those denoted by ‘.’ are not selected by LASSO.
This variable was modeled as min(X,100).
Pulse was modeled using a linear spline with a knot location at 50.
The optimism-corrected c-statistic of the proposed model was 0.758. Figure 1 is the “decision curve” that depicts the optimism-corrected empirical NB (
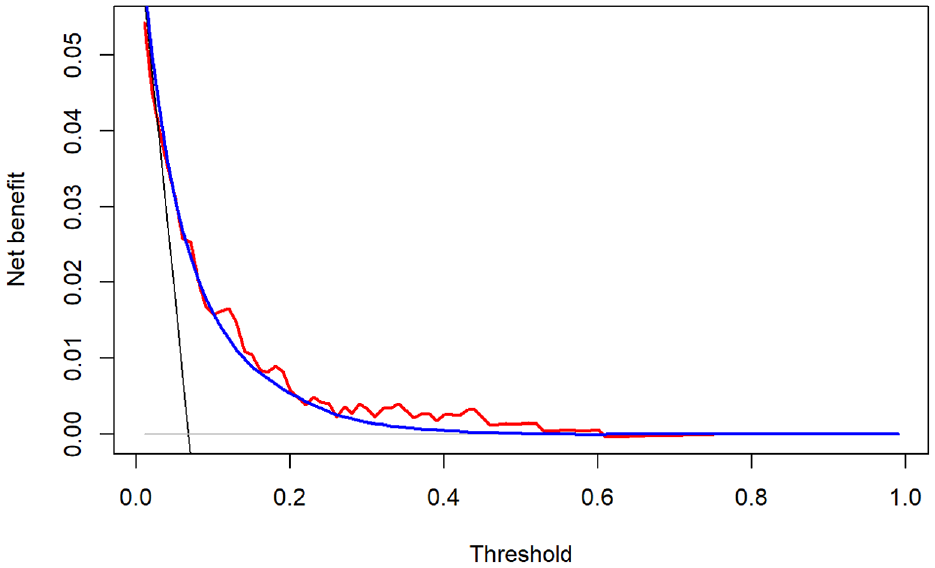
Optimism-corrected (red) net benefit (NB) of the proposed model and its Bayesian estimator (blue), compared with the NB of treating all (black) and treating none (gray). The Bayesian estimation is based on the Bayesian bootstrap (see the relevant section in the text). The optimism correction and Bayesian estimates are based on 1000 bootstraps.
Figure 2 depicts the expected incremental NB under current and perfect information (left panels) and EVPI (right panels) at the entire range of thresholds. Results are generated using both ordinary and Bayesian bootstraps, which were very similar. Interpreting the results based on the ordinary bootstrap, at the exemplary threshold of 0.02, the expected NB of treating all was 0.0478, while the expected NB of the model was 0.0484. Thus, the best decision under current information is to use the proposed model, with an expected ΔNB of 0.0006 (black curve in the top-left panel). The expected NB under perfect information was 0.0489, corresponding to an expected ΔNB of 0.0011 (red curve in the top-left panel). Thus, the EVPI is 0.0489 − 0.0484 = 0.0005. The relative EVPI at this threshold is 0.0011/0.0006 = 1.87. That is, knowing the correct prediction model is expected to confer 87% more NB compared with the proposed model. The EVPI is nonzero unless the threshold is unrealistically high (>0.85). The largest gain is obtained within the 0.1–0.3 range. The Bayesian bootstrap generated similar results (EVPI at 0.02 threshold: 0.0005, relative EVPI at this threshold: 1.82).
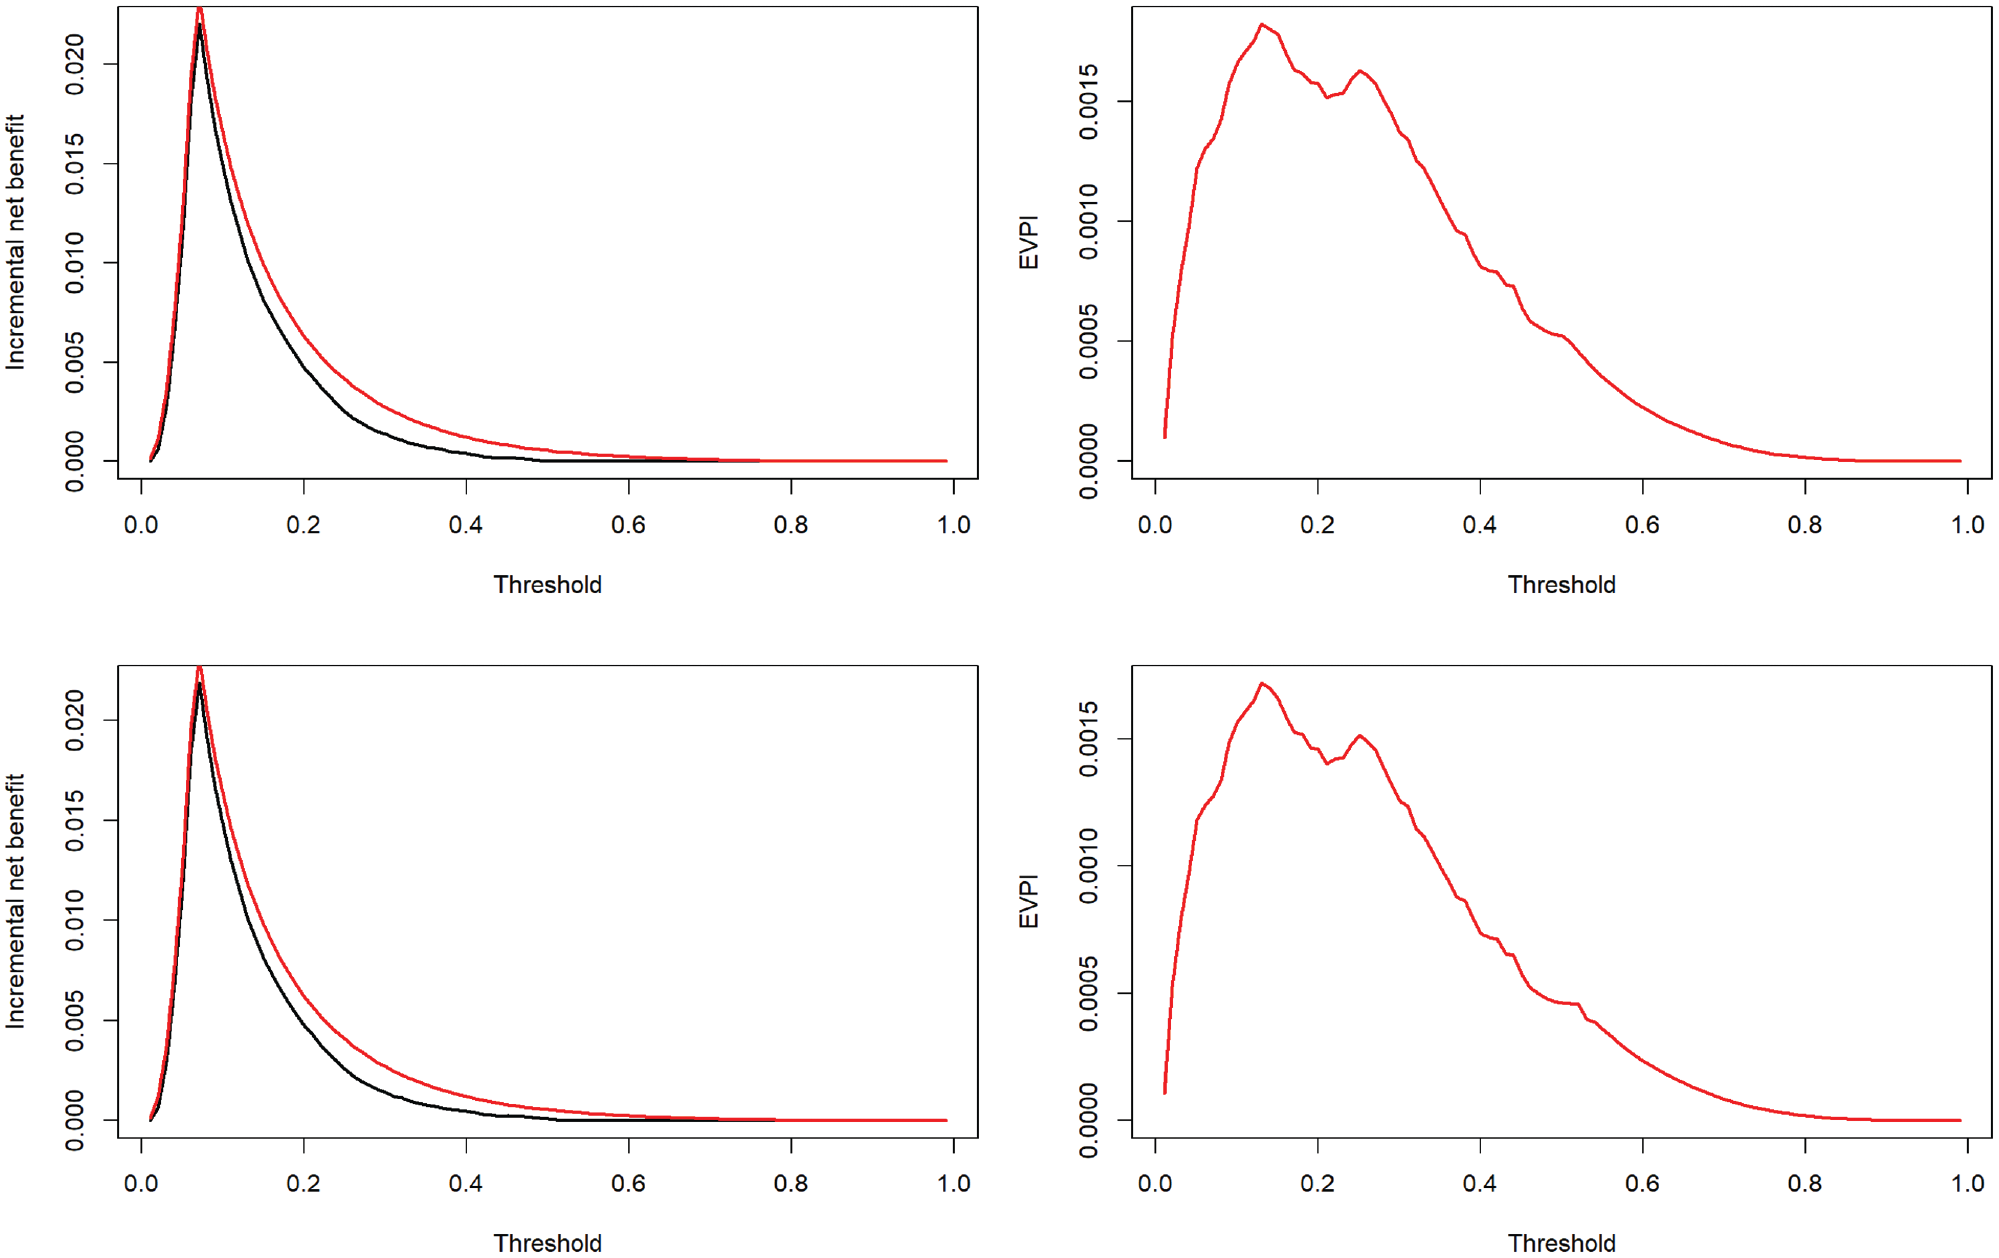
The incremental net benefit curves under current (black) and perfect (red) information (left) and expected value of perfect information (EVPI; right).
Figure 3 demonstrates how EVPI changes with sample size in GUSTO-I at the exemplary thresholds of 0.01, 0.02, 0.05, and 0.10. We started with n = 250 observations and doubled it at each step. For each step, the EVPI (top) and relative EVPI (bottom) were, respectively, the average and median of 10 independent simulations. Both metrics indicated a diminishing gain with larger samples. The median relative EVPI was +∞ for threshold values of 0.01 and 0.02 at n = 250 and also at n = 500 for the 0.01 threshold. On the other hand, for the model based on the entire GUSTO-I data, the impact of uncertainty was minimal, with EVPI < 0.00001 and relative EVPI = 1.004 at 0.02 threshold. Results of proof-of-concept simulation studies on how EVPI changes with other sample or model characteristics (event probability, model calibration, and discrimination) are provided in the Supplementary Material.
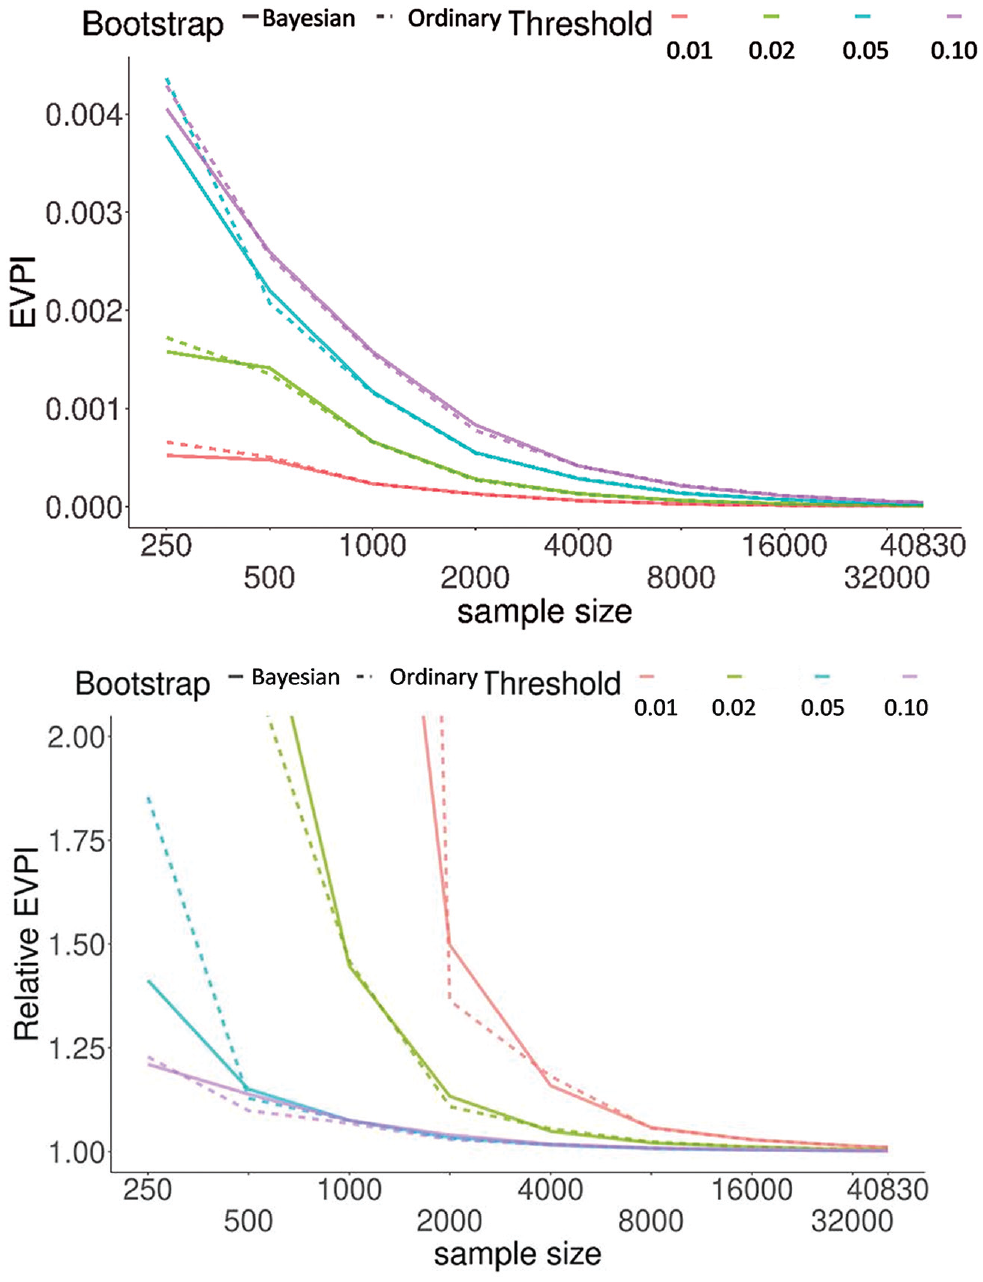
Change in expected value of perfect information (EVPI) (top) and relative EVPI (bottom) as a function of sample size. Results were generated based on randomly obtaining samples, without replacement, of a given size. Results are the average (top) and median (bottom) of 10 independent simulations for each sample size. We discarded data sets with fewer than 8 events as the glmnet optimizer does not reliably converge with too few events. For relative EVPI, the regular bootstrap at 0.01 threshold had a value of 9.7 at sample size 1000; all other truncated lines (reaching >2.0) indicate that the median value was +∞ at smaller sample sizes.
Discussion
Creating a risk prediction model based on a finite development sample means the resulting predictions are inevitably uncertain. The management plan of a patient based on such predictions might be different from the decision that would have been made had the correct risks been known. As such, prediction uncertainty can result in the loss of NB. We extended the value-of-information methodology from the decision analysis to the development phase of the risk prediction models and applied the definition of EVPI to this context. The proposed development EVPI is a scalar metric that quantifies, for a given risk threshold, the expected loss due to uncertain predictions, with the loss being defined on the same NB scale as is commonly used to assess the utility of the risk prediction models. 11 In a case study using data from a clinical trial, we demonstrated how EVPI can be calculated and interpreted, for example by determining the range of thresholds within which obtaining a larger development sample could potentially be warranted. We also showed how EVPI behaves when the development sample size is increased. We proposed relative EVPI as a scale-free metric and outlined a generic bootstrap-based algorithm for EVPI calculations that can be embedded within established algorithms for quantifying the optimism of risk prediction models.
How should these developments be used in practice? Once the risk model is developed, the investigators need to decide whether the model is good enough to go to the next stage (i.e., validation), the model should be abandoned, or further model development is required. 9 Classical arguments in decision theory stipulate that under the conditions of risk neutrality and the absence of irrecoverable costs associated with implementing a health technology, the “adoption decision” and “research decision” are independent: it is solely the expected NB that should determine whether to adopt the model or not, 24 while value-of-information metrics determine whether further evidence (e.g., obtaining a larger development sample) is required. However, model developers as scientists generally have a preference against seeing their discoveries proven incorrect or harmful, 25 and patients, care providers, and the general public are on average risk averse.26,27 As well, there are significant irreversible costs associated with implementing a risk stratification algorithm only to abandon it later (updating guidelines, incorporating the model into electronic health records). Consequently, uncertainty and the resulting potential for harm become relevant when deciding whether a model should advance to the next stage.
If risk behaviors in the given clinical domain are to be considered, one can update the decision criterion and value-of-information equations with explicit formulation of risk attitudes. 28 However, in the early phases of model development, investigators might be unwilling to make such judgment calls. We think in this phase what is the most helpful is general guidance on whether the expected loss due to prediction uncertainty is low enough that justifies moving toward model validation. In this context, a zero EVPI indicates that the currently identified best decision is the correct one in this patient population. Similarly, a low EVPI indicates that the potential for harm with current information is small. Such results can motivate model developers to focus on the next stage (e.g., depending on the NB of the model, abandon the model, or move to validation). On the other hand, when the EVPI is large, one should not proceed before an updated model based on a larger development sample is produced. This invokes the question of what value of EVPI is large enough to warrant further model development. Although this is context specific, during the development phase it might make sense to specify thresholds on EVPI as general guidance. For example, an expected loss that is similar to the expected gain by using the proposed model (i.e., relative EVPI ∼2) can be interpreted as the presence of substantial uncertainty and potential for harm. Such a threshold on EVPI can be more relatable than thresholds on statistical metrics such as calibration or shrinkage, whose implications for medical decisions are less clear. This approach can thus potentially lead to stronger consensus among stakeholders and defendable recommendations by authorities who formulate best practice standards in predictive analytics.
The EVPI as defined in this work represents the uncertainty due to the finite development sample, resulting in uncertainty in the regression coefficients of the prediction model. Importantly, this EVPI does not represent the value of knowing the true risk for each individual, which is also a function of predictors that are unknown, unmeasured, or intentionally left out of the model. It also does not include uncertainty due to the potentially systematic differences between the development and the target population (related to external validation which is discussed below). However, modifications of this definition are conceivable that can bring other sources of uncertainty into consideration. Consider, for example, that there is a strong predictor in the development sample that is intentionally excluded because of difficulty in measuring it in practice. If in the Monte Carlo bootstrap algorithm for producing draws from
The Bayesian inference underlying EVPI calculations is based on the assumption that the prior distribution
The application of value of information in risk prediction can be a fruitful endeavor on many fronts. An important area of inquiry is the application of this concept to external validation of risk prediction models. Unlike during model development when the ultimate goal is to identify the correct model, in external validation, the goal is to evaluate whether a prespecified model performs well and thus using it will be beneficial. The expected gain by perfectly knowing if a prespecified model is net beneficial in a new population is different from the expected gain by knowing the correct model in this population. As such, the validation EVPI is distinct from the development EVPI proposed in this article and needs to be pursued independently. Further, the expected value of sample information is a related metric in decision analysis that quantifies the expected gain in NB from conducting a specific study with a given design and sample size. 8 Defining the equivalent of this metric for risk prediction seems feasible and an immediate extension of the proposed framework. NB calculations have been extended from risk prediction models to models that aim at predicting the benefit of specific interventions, 30 and value-of-information methods can conceivably be extended to such context.
Contemporary approaches toward evaluating uncertainty in risk prediction target prediction error, calibration, or stability. Despite significant contributions, these metrics are statistical in nature, as they do not relate prediction uncertainty to the outcome of medical decisions. Evaluating the NB of a risk prediction has complemented purely statistical approaches for the assessment of risk prediction models, in a way that is considered a breakthrough in predictive analytics. 9 We think the assessment of uncertainty in such models can also be augmented with a decision-theoretic perspective.
Supplemental Material
sj-docx-1-mdm-10.1177_0272989X221078789 – Supplemental material for Uncertainty and the Value of Information in Risk Prediction Modeling
Supplemental material, sj-docx-1-mdm-10.1177_0272989X221078789 for Uncertainty and the Value of Information in Risk Prediction Modeling by Mohsen Sadatsafavi, Tae Yoon Lee and Paul Gustafson in Medical Decision Making
Footnotes
Acknowledgements
We would like to thank Dr. Abdollah Safari from the University of British Columbia for their insightful comments on earlier drafts. We also thank the anonymous reviewers for their constructive suggestions.
The authors declared no potential conflicts of interest with respect to the research, authorship, and/or publication of this article.
The authors disclosed receipt of the following financial support for the research, authorship, and/or publication of this article: Financial support for this study was provided by a team grant from the Canadian Institutes of Health Research (PHT 178432). The funding agreement ensured the authors’ independence in designing the study, interpreting the data, writing, and publishing the report.
Ethics Statement
Ethics approval was not required as the empirical component of this study was based on anonymized, publicly available data (the GUSTO-I trial).
Data-Sharing Statement
References
Supplementary Material
Please find the following supplemental material available below.
For Open Access articles published under a Creative Commons License, all supplemental material carries the same license as the article it is associated with.
For non-Open Access articles published, all supplemental material carries a non-exclusive license, and permission requests for re-use of supplemental material or any part of supplemental material shall be sent directly to the copyright owner as specified in the copyright notice associated with the article.