
Abstract
Background
The purpose of external validation of a risk prediction model is to evaluate its performance before recommending it for use in a new population. Sample size calculations for such validation studies are currently based on classical inferential statistics around metrics of discrimination, calibration, and net benefit (NB). For NB as a measure of clinical utility, the relevance of inferential statistics is doubtful. Value-of-information methodology enables quantifying the value of collecting validation data in terms of expected gain in clinical utility.
Methods
We define the validation expected value of sample information (EVSI) as the expected gain in NB by procuring a validation sample of a given size. We propose 3 algorithms for EVSI computation and compare their face validity and computation time in simulation studies. In a case study, we use the non-US subset of a clinical trial to create a risk prediction model for short-term mortality after myocardial infarction and calculate validation EVSI at a range of sample sizes for the US population.
Results
Computation methods generated similar EVSI values in simulation studies, although they differed in numerical accuracy and computation times. At 2% risk threshold, procuring 1,000 observations for external validation, had an EVSI of 0.00101 in true-positive units or 0.04938 in false-positive units. Scaled by heart attack incidence in the United States, the population EVSI was 806 in true positives gained, or 39,500 in false positives averted, annually. Validation studies with >4,000 observations had diminishing returns, as the EVSIs were approaching their maximum possible value.
Conclusion
Value-of-information methodology quantifies the return on investment from conducting an external validation study and can provide a value-based perspective when designing such studies.
Highlights
In external validation studies of risk prediction models, the finite size of the validation sample leads to uncertain conclusions about the performance of the model. This uncertainty has hitherto been approached from a classical inferential perspective (e.g., confidence interval around the c-statistic).
Correspondingly, sample size calculations for validation studies have been based on classical inferential statistics. For measures of clinical utility such as net benefit, the relevance of this approach is doubtful.
This article defines the expected value of sample information (EVSI) for model validation and suggests algorithms for its computation. Validation EVSI quantifies the return on investment from conducting a validation study.
Value-based approaches rooted in decision theory can complement contemporary study design and sample size calculation methods in predictive analytics.
Risk prediction models that quantify the probability of clinical events are a key aspect of individualized medicine. Once developed, these models are often used in diverse populations. Before being trusted for clinical use in a new population, a prediction model needs to undergo validation in a representative sample from that population. 1 For example, the original Framingham risk scores for cardiovascular disease risk are developed using data from the Framingham County in the United States but are externally validated for use in many different populations. 2
During a validation study, the performance of the prediction model is assessed in terms of average prediction error, discrimination (e.g., c-statistic), calibration (e.g., calibration intercept and slope), and net benefit (NB). 3 Among such metrics, NB is a decision-theoretic one, as it enables direct assessment of the clinical utility of a model (i.e., if a model’s expected NB (ENB) is higher than that of alternatives, it is expected to confer clinical utility). Due to such decision-theoretic underpinnings, and despite its relatively new arrival in the field of predictive analytics, NB has gained significant momentum and has become a standard component of modern external validation studies. 4
When interpreting the results of a validation study, the finite size of the validation sample means that the assessment of model performance is accompanied by uncertainty. Uncertainty in conventional metrics of model performance is communicated using classical inferential methods (e.g., 95% confidence interval [CI] around the c-statistic or calibration slope). Similarly, sample size considerations when planning a validation study are based on inferential statistics.5,6 However, the relevance of this approach to uncertainty around NB as a decision-theoretic metric is doubtful, as arbitrary significance levels or prespecified confidence bands do not necessarily translate to better decisions.7–9
Decision theory provides an alternative view to the consequences of uncertainty by relating it to the outcome of decisions. A decision maker should adopt the strategy with the highest expected utility, which, if implementation costs are comparable, is the one with the highest ENB. While uncertainty around NB should not affect the adoption decision, it is associated with utility loss as it hinders our ability to identify the decision with the highest true NB. The extent of uncertainty should thus inform the research decision: whether the expected utility loss is large enough to necessitate collecting further evidence. This approach toward uncertainty quantification is referred to as value-of-information (VoI) analysis.10–12
VoI methods are widely accepted in health policy making.11,13 However, their relevance to clinical decision making and risk prediction has only recently been highlighted. 14 In particular, the expected value of perfect information (EVPI), the expected gain in NB by completely eliminating uncertainty, has been applied to both the development and validation phases of risk prediction models.14,15 However, to the best of our knowledge, the expected value of sample information (EVSI), the expected gain in NB by conducting a study of a given sample size, has not been defined and applied to clinical prediction models.
The aim of the present work is to define EVSI for the external validation studies of risk prediction models and propose algorithms for its computation. The rest of this article is structured as follows. After outlining the context, we define EVSI for a future validation study aimed at evaluating the clinical utility of a model in a new population. We propose different algorithms for EVSI computations, elaborate on their use case, and compare their performance in simulation studies. A case study puts the developments in context. We conclude by proposing areas of further inquiry.
Methods
Context
We focus on validating a previously developed risk prediction model in a new target population. The developments are presented for prediction models for binary responses but are generally applicable to any context where NB can be assessed (e.g., survival outcomes,
16
models for treatment benefit
17
). A risk prediction model is advertised as a function that maps patient characteristics to an estimate of event risk. We have some current information about the performance of this model in the target population (for example, from expert opinion or from a pilot study) but are uncertain if using the model in this population is net beneficial. We are planning to obtain a random sample
NB Calculations for Risk Prediction Models
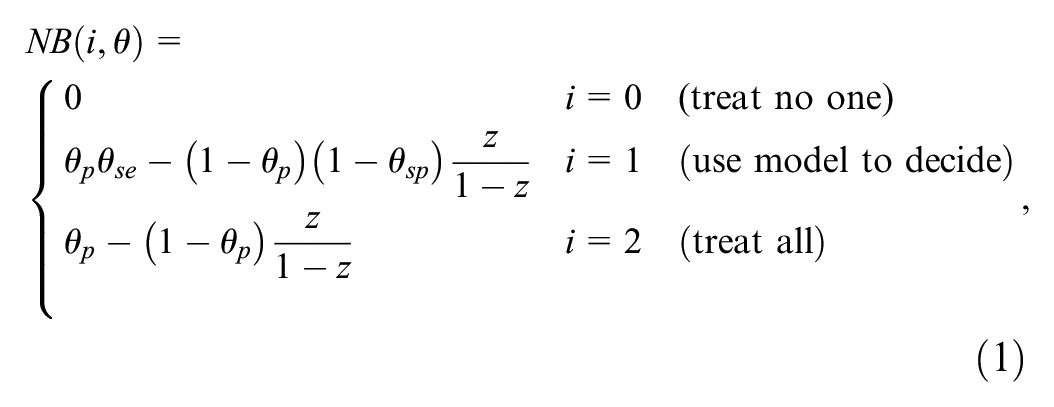
Details of NB calculations for risk prediction models are explained in its original article and in many tutorials.4,18,19 In brief, to turn a continuous predicted risk to a binary classification to inform a treatment decision, a decision maker needs to specify a risk threshold
It is often more intuitive to express
Any given model should be compared with at least 2 “default” strategies of treating no one and treating all. Treating no one has NB = 0 by definition, and NB calculations for treating all follow the same logic as above but by considering all individuals as positive. Thus, we have 3 competing strategies: do not treat anyone, use the model to treat those with predicted risk
For time-to-event outcomes,
VoI Analysis
VoI analysis is a Bayesian approach and requires explicit specification of current information on the performance of the model in the target population. By default, we assume this information is generated from a preliminary validation exercise based on a random sample
The Expected Value of Current Information
Our current information about

where the expectation is with respect to
EVPI
Details of the reasoning and algorithms behind calculating EVPI are presented previously.
15
In brief, if we could know the true values of

The EVPI is then the difference in ENB of having perfect information versus current information:

The EVPI is a scalar quantity and quantifies the expected loss in NB due to uncertainty, or alternatively, the expected gain in NB by completely resolving uncertainty (i.e., conducting a validation study of infinite size). We have proposed a generic algorithm based on bootstrapping to estimate this expectation as well as an asymptotic approach based on the central limit theorem and 2-dimensional unit normal loss integral. 15
EVSI
The reasoning behind the EVSI calculation is similar to that of EVPI, with the modification that instead of knowing the truth, we will have more (but not perfect) information about
The NB of this approach once future data are obtained is

The EVSI is the difference between this ENB and ENB under current information:

The EVSI is a nonnegative scalar quantity in the same NB units as EVPI. It quantifies the expected gain in NB by procuring a validation sample of a given size. The higher the EVSI, the higher the expected gain from the planned validation study. EVPI, quantifying the ENB gain by completely resolving uncertainty, puts an upper limit on EVSI.
EVSI Computation Algorithms
The challenge for EVSI calculation is the 2 nested expectations in
A Bootstrap-Based Algorithm
If the current evidence
Bootstrap-Based Computation of EVSI
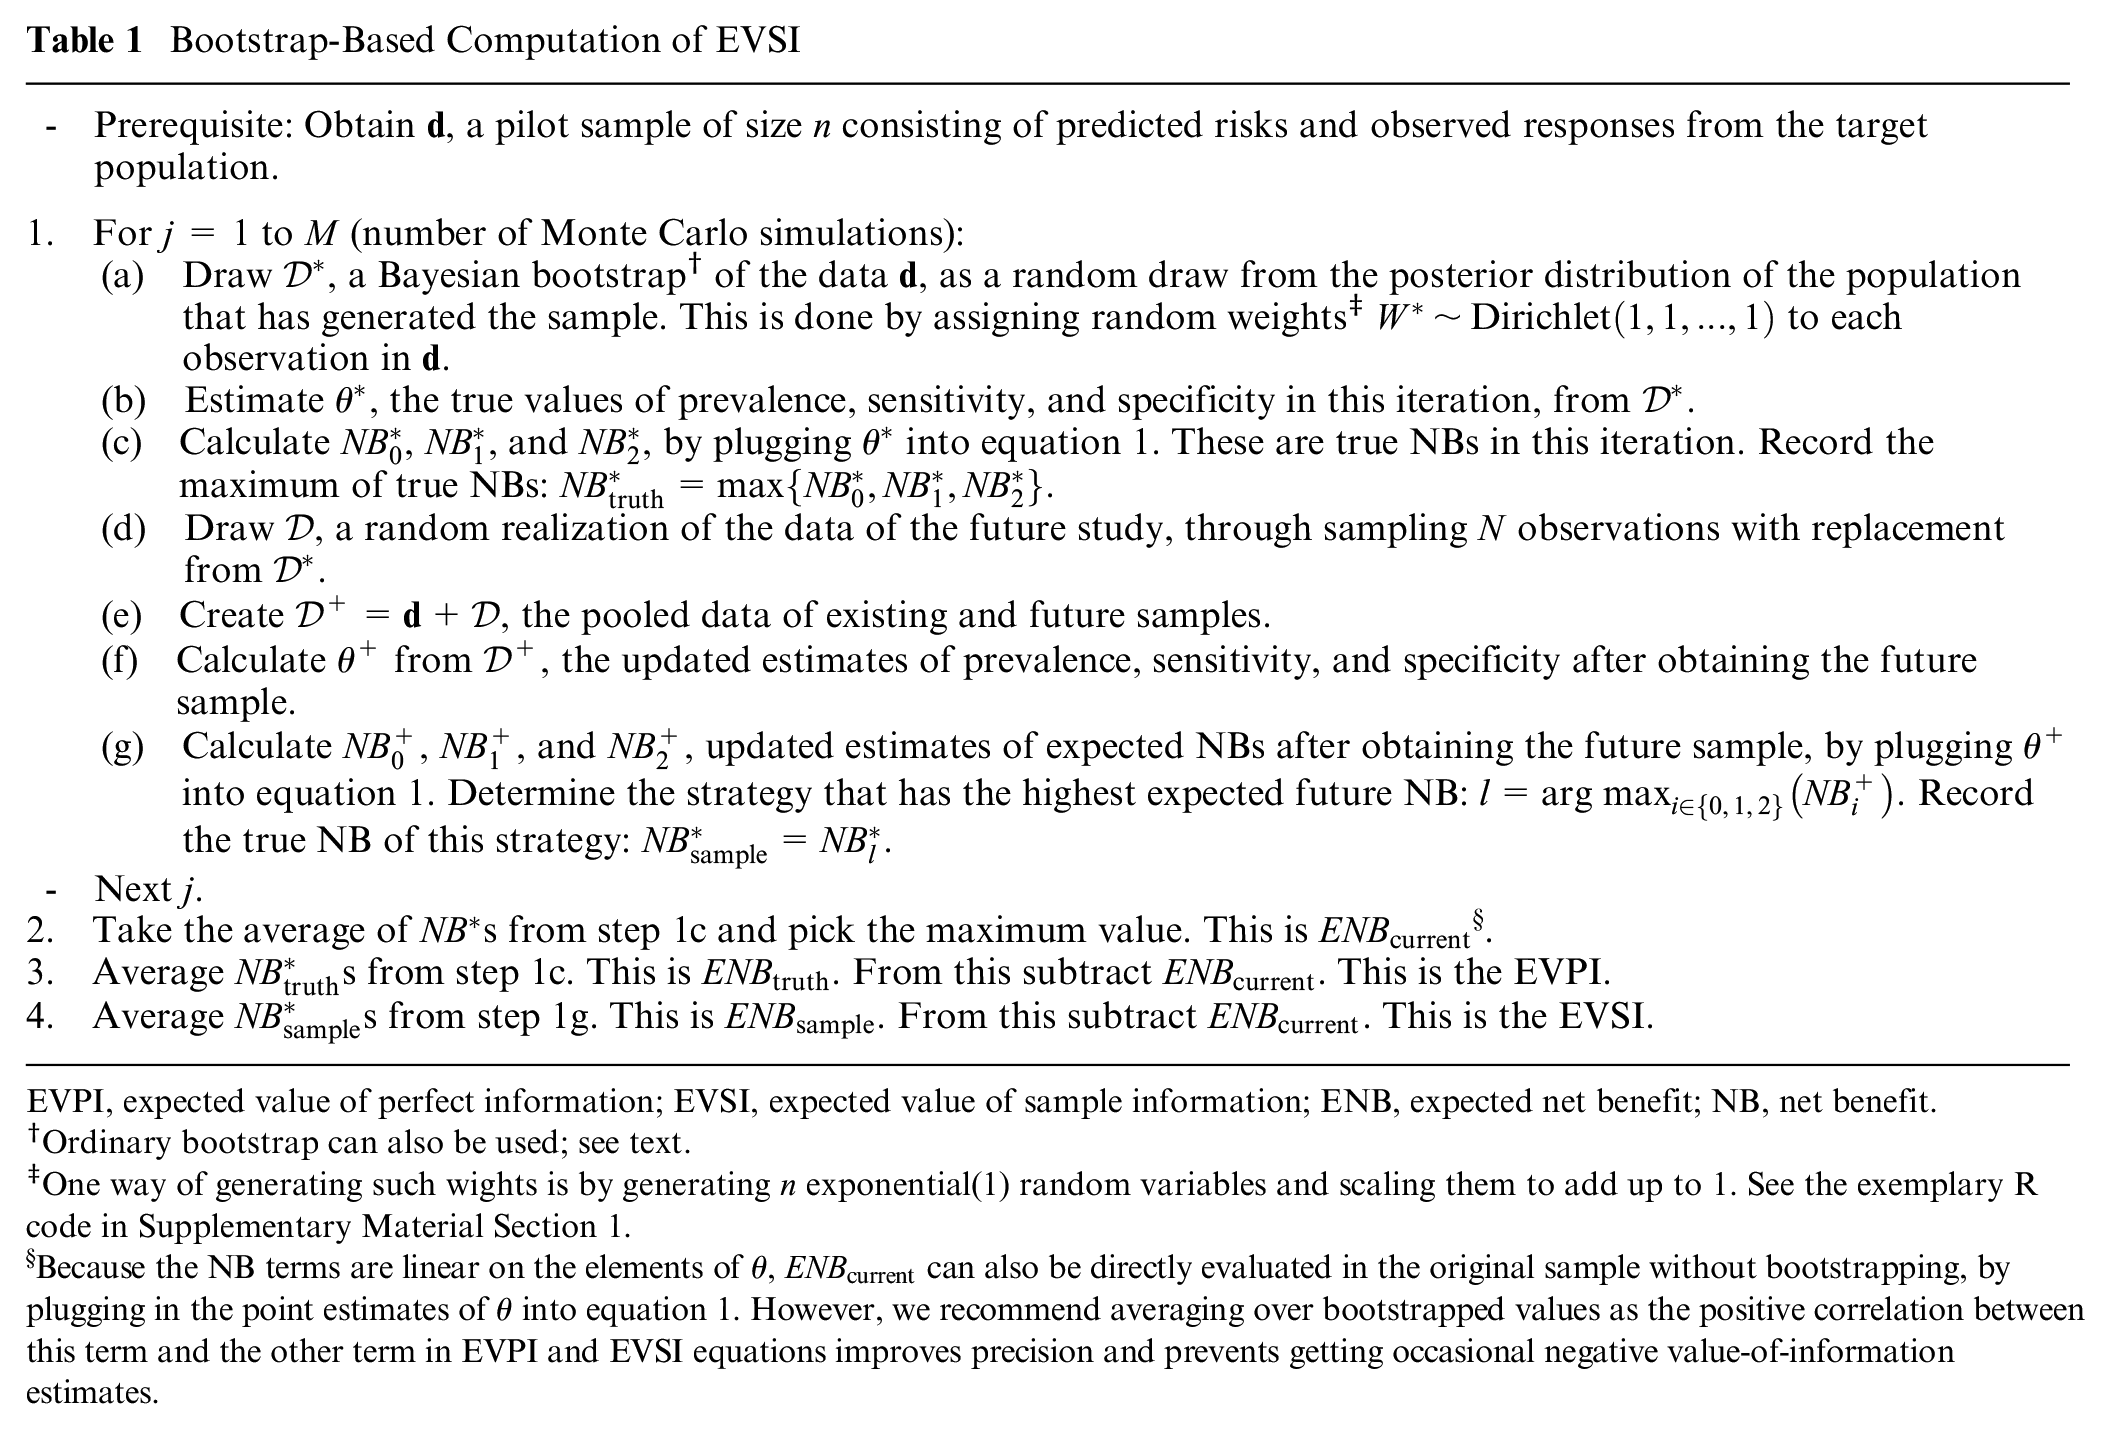
EVPI, expected value of perfect information; EVSI, expected value of sample information; ENB, expected net benefit; NB, net benefit.
Ordinary bootstrap can also be used; see text.
One way of generating such wights is by generating
Because the NB terms are linear on the elements of
The power of this approach is in the flexibility of the bootstrap method in accommodating different types of outcomes and practical considerations in validation studies. For example, if
The ordinary bootstrap, which assigns weights from a scaled multinomial (1,1,…,1). distribution to observations in
A Fast Algorithm Based on Beta-Binomial Modeling for Binary Outcomes
In their proposal for a parametric Bayesian NB estimation for binary outcomes, Netto Flores Cruz and Korthauer
28
note that the likelihood function for
Computation of EVSI Based on Beta-Binomial Modeling
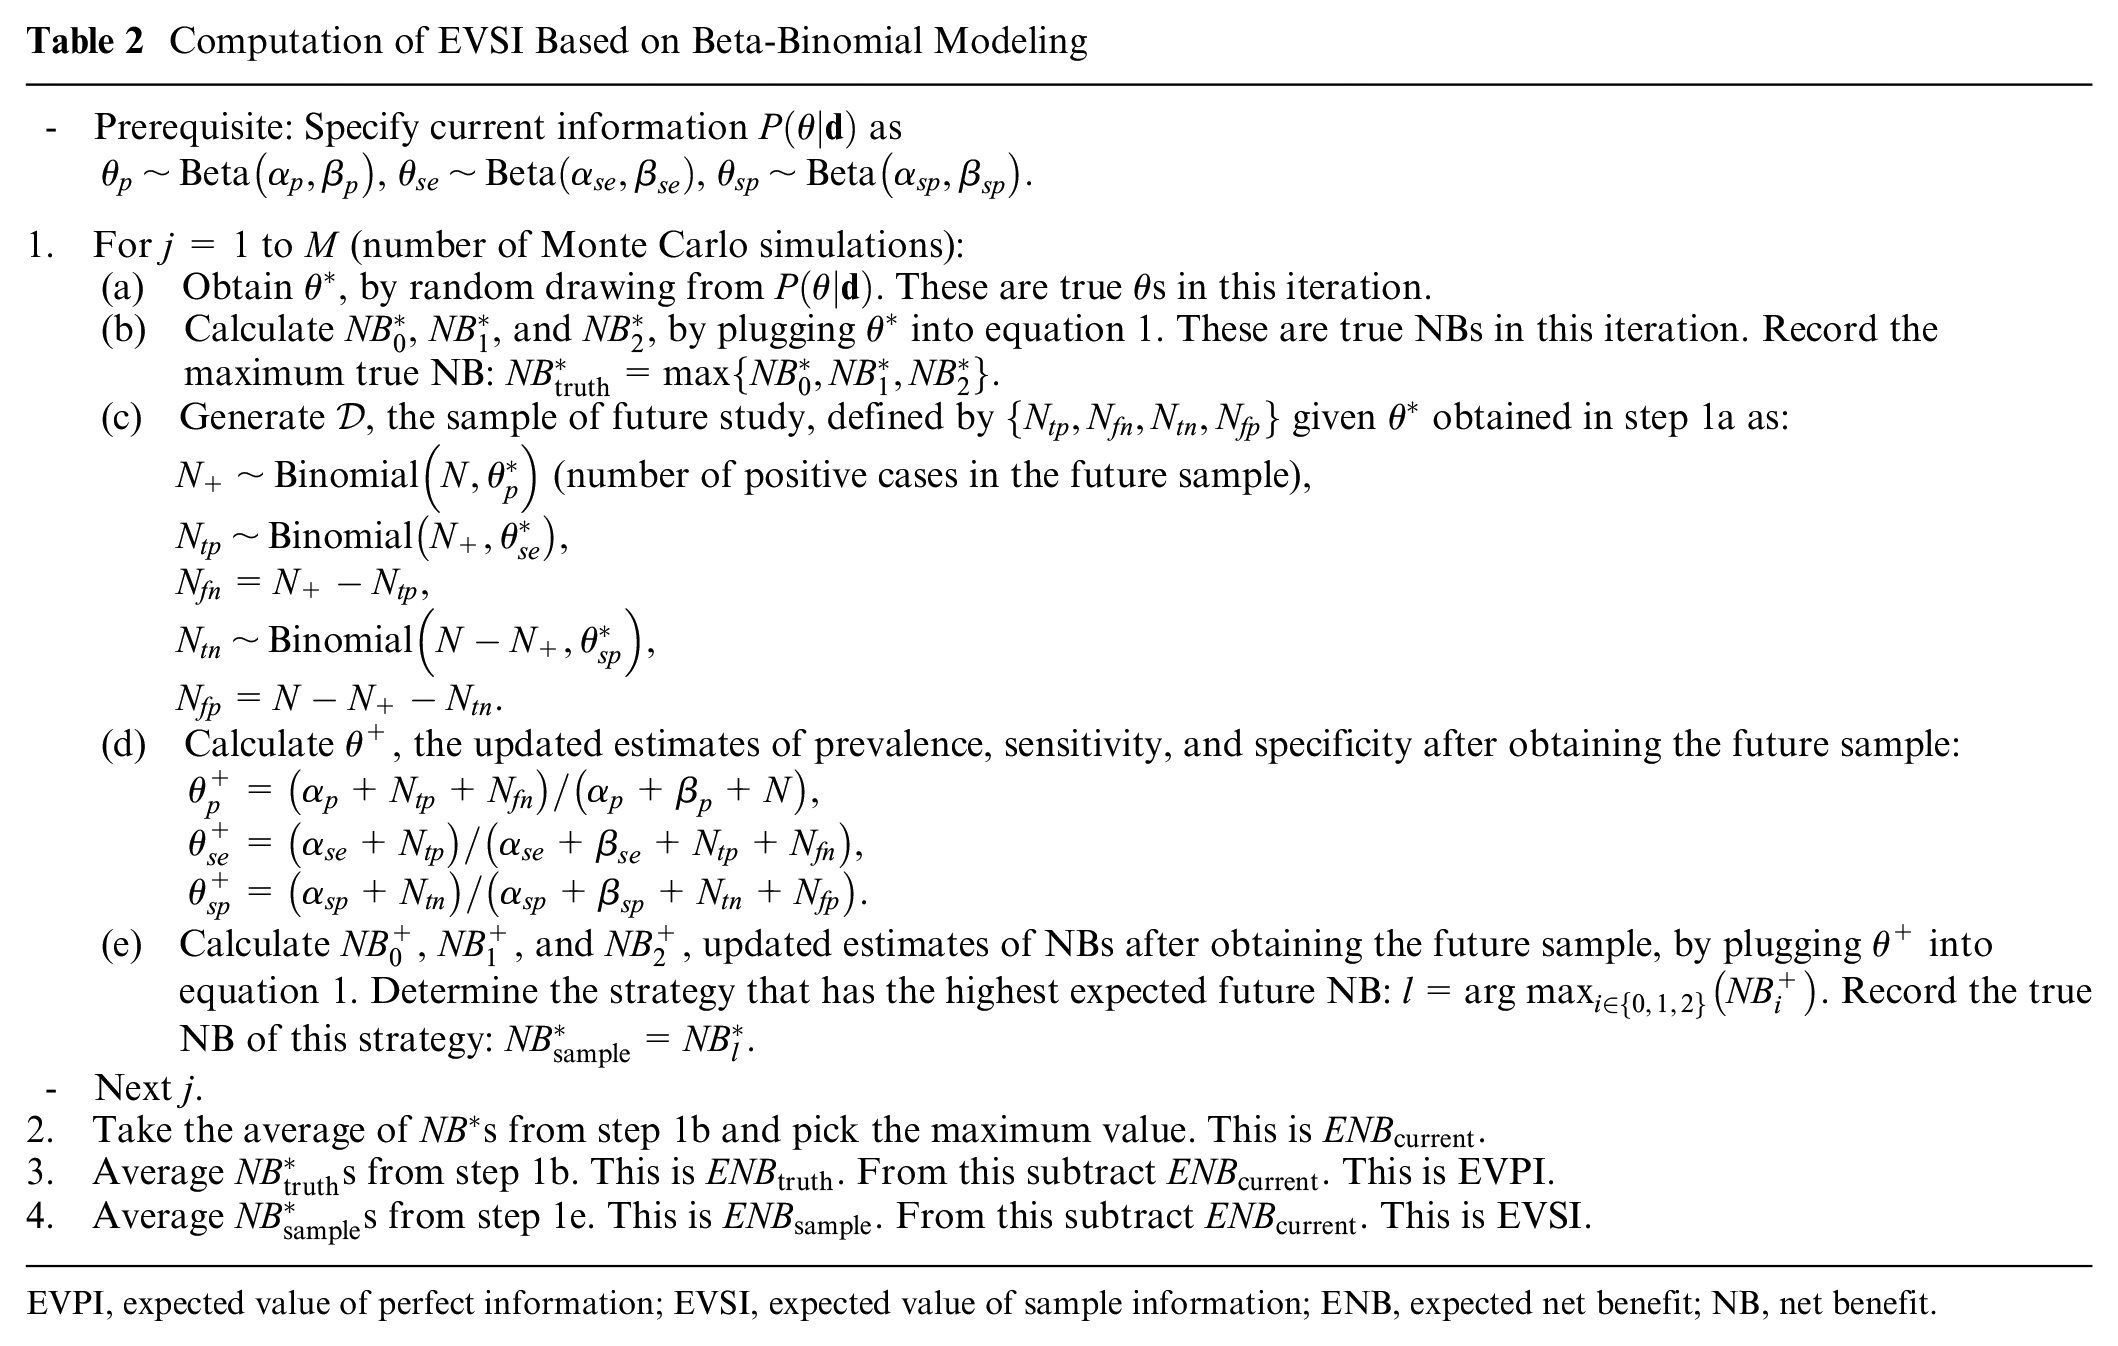
EVPI, expected value of perfect information; EVSI, expected value of sample information; ENB, expected net benefit; NB, net benefit.
Independent beta distributions for each component of
Importantly, for binary outcomes and in the absence of missing data, the Bayesian bootstrap approach explained previously reduces to this beta-binomial model. This is because the information in a sample
Yet another utility of this approach is that instead of the improper prior employed in the Bayesian bootstrap, the user can specify informative priors. Imagine in the current sample
A General Algorithm for Arbitrary Specification of
In many practical situations, our current information
For such a general case in which we have a sample from
EVSI Computation for Binary Outcomes for General, Nonconjugate Distributions
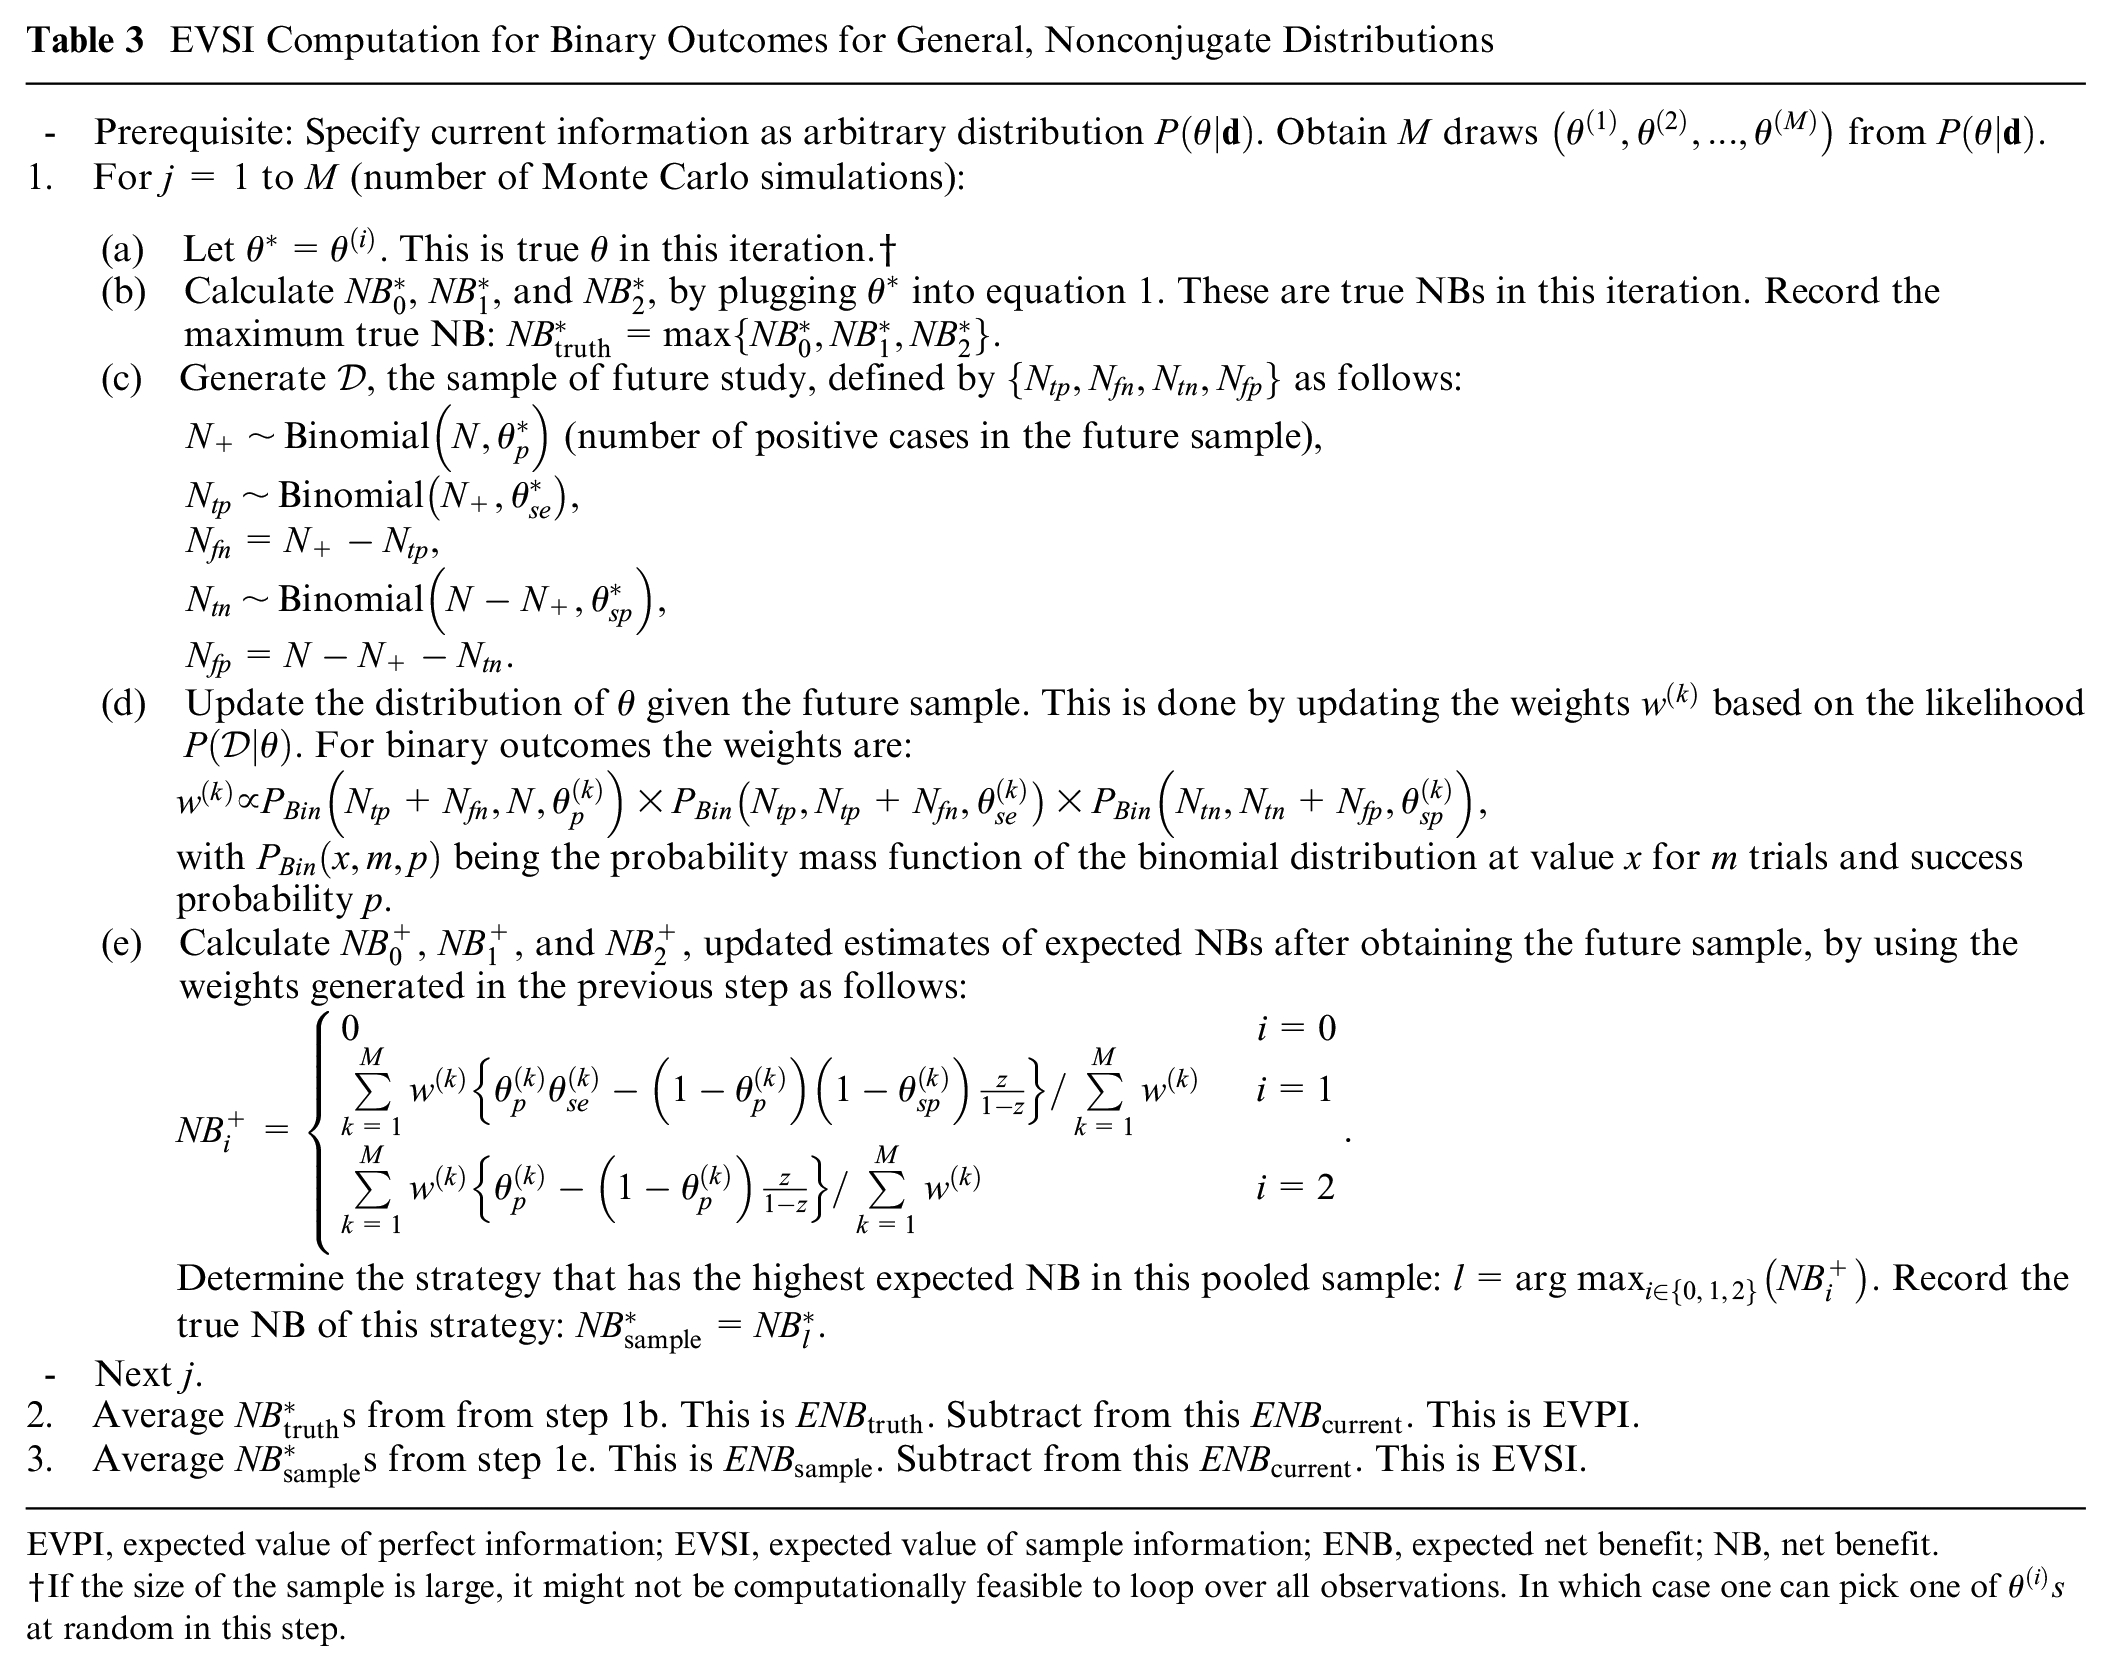
EVPI, expected value of perfect information; EVSI, expected value of sample information; ENB, expected net benefit; NB, net benefit.
If the size of the sample is large, it might not be computationally feasible to loop over all observations. In which case one can pick one of
Case Study
We used data from GUSTO-I, a clinical trial of multiple thrombolytic strategies for acute myocardial infarction (AMI), as our case study. 31 This dataset has been widely used for methodological research in predictive analytics.32–34 All analyses are conducted in R, 35 with a fast implementation of the general EVSI algorithm in C++ (please refer to the evsiexval R package for details).
For the present case study, we use a similar setup as our previous work, with a risk prediction model for 30-day mortality developed using the non-US sample of this dataset and validated in the US subsample. The risk prediction model is a logistic regression model fitted to the entire non-US subset (sample size 17,796). We initially assume we have access to only
Using this setup, we performed 2 simulation studies to explore the face validity of the proposed algorithms. In the first set, we aimed at comparing the numerical stability and computational time of the 3 algorithms. In the second set, we explored how EVSI changes as a function of the amount of current information, represented by
Results
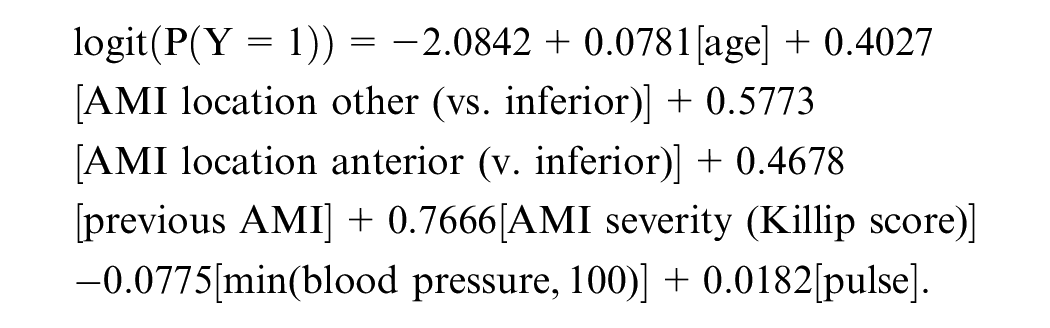
The prevalence of the outcome in the development sample (entire non-US sub-sample) was 0.0723; in the current validation sample it was 0.0860, while in the entire US sub-sample it was 0.0679. The risk prediction model was of the form:
The decision curve depicting the NB of the model alongside alternative strategies is presented in Figure 1. Panel (a) shows the NB, and panel (b) shows the difference between the NB of the model and the best default strategy (
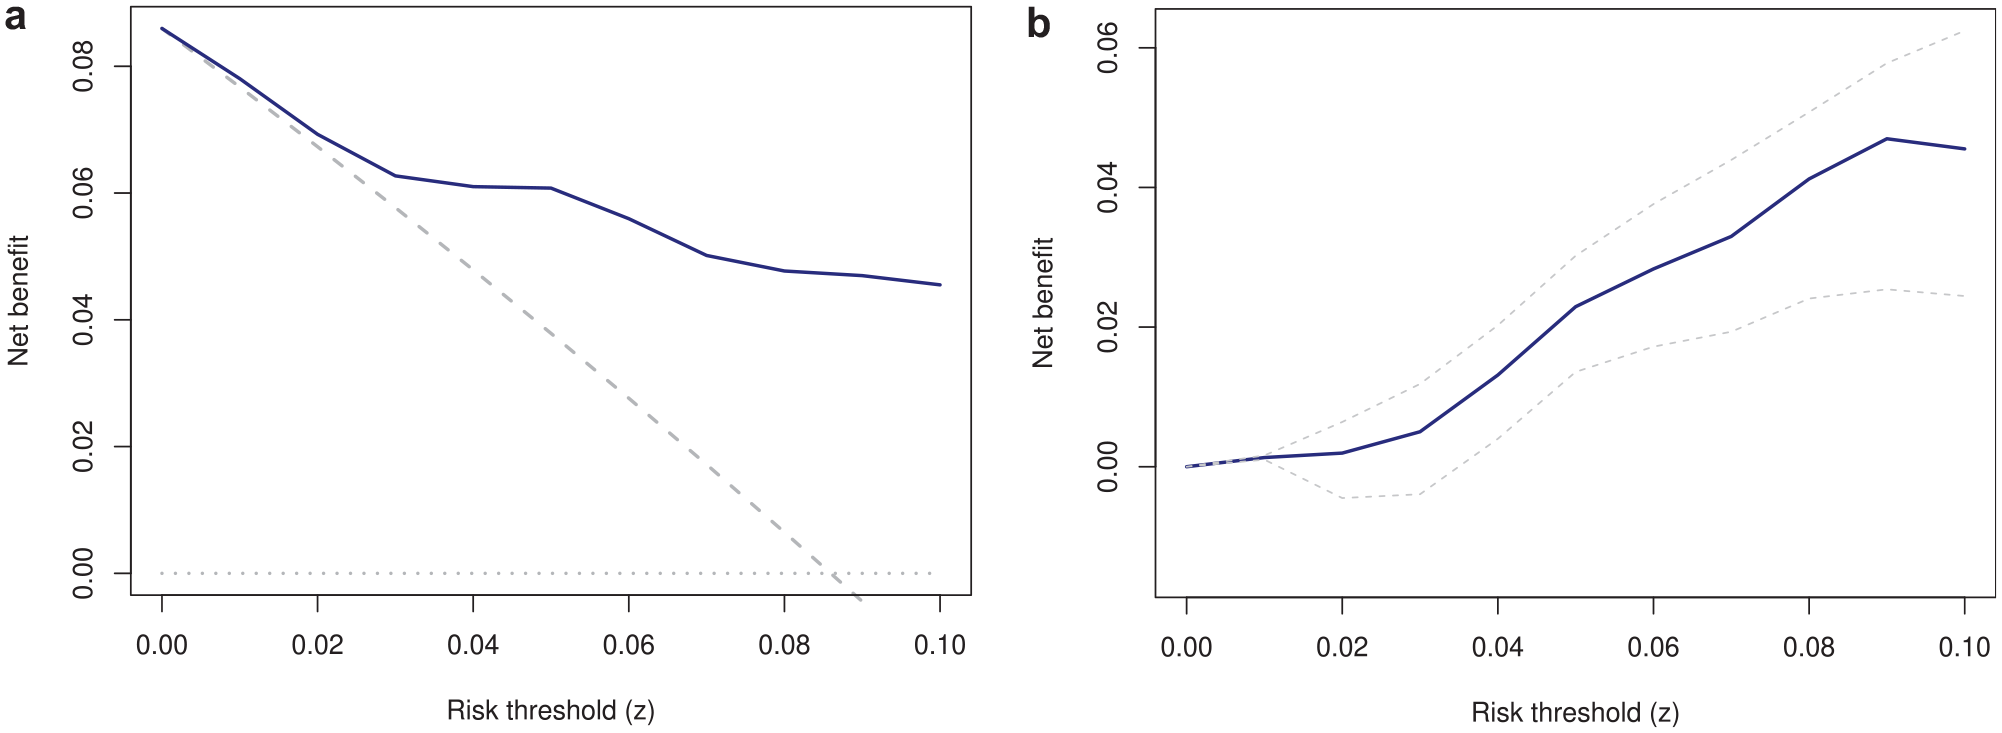
Decision curve (a) and incremental net benefit of the model versus the best alternative strategy (b). (a) Solid blue: use the model; dashed gray: treat all; dotted gray: treat none. (b) Dashed lines are 95% confidence intervals.
Among 500 observations in the current sample, 43 experienced the outcome. Given the prior
The EVPI curve is presented in Figure 2. The EVPI at 0.01 threshold was 0.00037. At the 0.02 threshold it was 0.00125. The EVPI was 0 at 0.05 and 0.10 thresholds (so EVSI for any
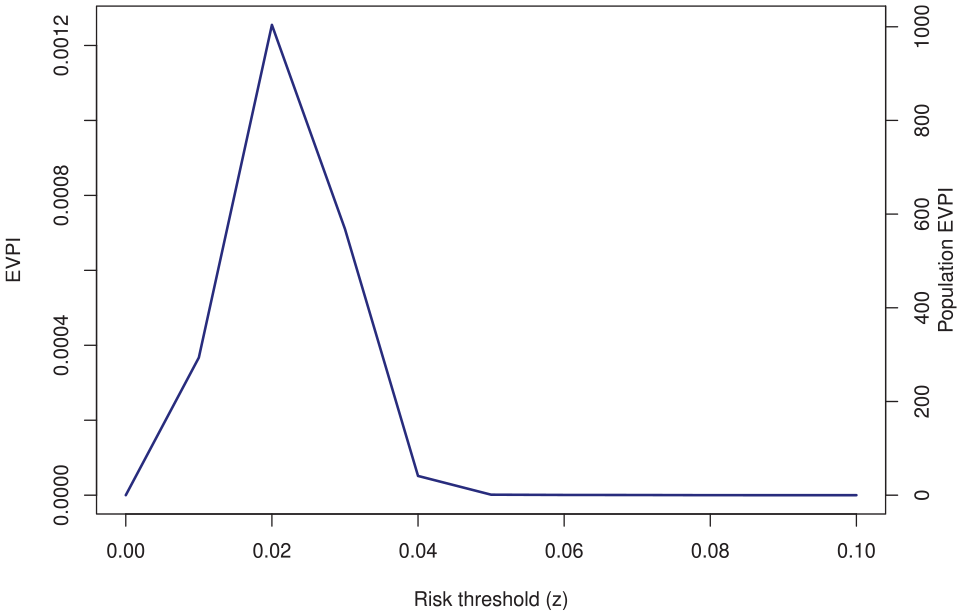
The expected value of perfect information (EVPI) of the validation sample.
The EVSI curves are shown in Figure 3. Generally, it is expected that EVSI will increase with a larger future study and will asymptote to EVPI, a pattern that is obvious for both thresholds. The “diminishing return” pattern is also clear: the ENB gain steeply rises at small samples and plateaus as
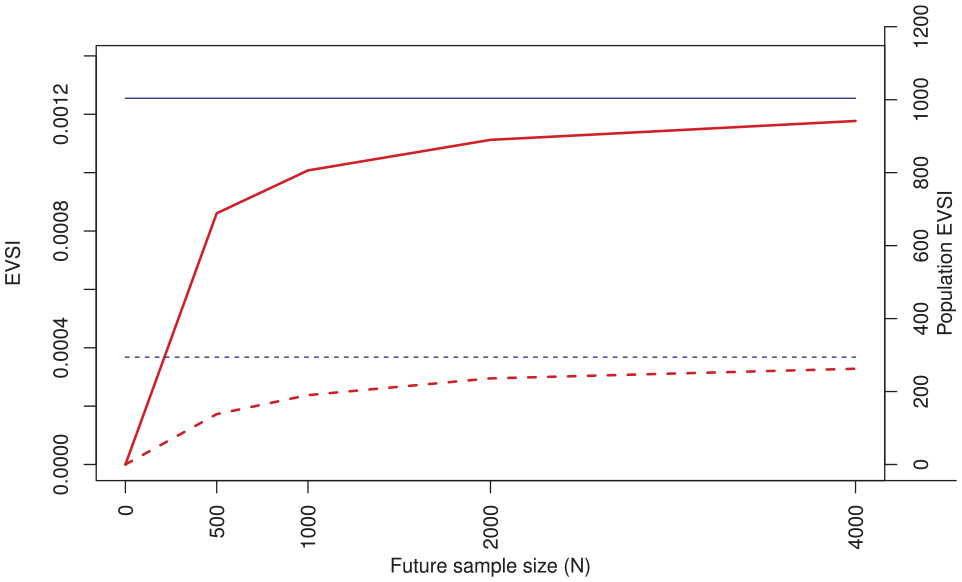
The expected value of sample information (EVSI) for the case study. Red: EVSI; blue (horizontal): the expected value of perfect information (EVPI). Dashed lines:
Supplementary Material Section 2 provides results of the simulations comparing the 3 algorithms. All algorithms generated comparable VoI values and demonstrated the expected monotonicity behavior: the higher the
Discussion
Evaluating the performance of a model in a finite sample is fraught with uncertainty. In this work, we applied the VoI framework to investigate the decision-theoretic consequences of such uncertainty. We defined validation EVSI as the expected gain in NB by obtaining an external validation sample of a given size from the target population of interest. In a case study we showed the feasibility of EVSI calculations and studied how EVSI is affected by the amount of current information and the sample size of the future study. We suggested scaling the EVSI to the population to quantify the overall gain in clinical utility in true- (or false-) positive units from conducting an external validation study of a given sample size.
We proposed 3 algorithms for EVSI computations (with implementation in R as part of the evsiexval package: https://github.com/resplab/evsiexval). The bootstrap-based algorithm is applicable when previous individual-level data (e.g., from a pilot validation study) are at hand. The main advantage of this algorithm is in its flexibility, for example, in mimicking expected patterns of missingness in data. Among the 3 algorithms, this algorithm is the one that can most readily be extended to survival outcomes (similar to the extension of the bootstrap method for inference around NB
16
). However, this algorithm is applicable only when individual-level data are available and can be slow. The beta-binomial algorithm is applicable when current evidence on model performance can be expressed as independent beta distributions for prevalence, sensitivity, and specificity and is the fastest of the 3 algorithms. We showed that for binary outcomes and in the absence of censoring, this algorithm is equal to the Bayesian bootstrap (with the added flexibility that prior information can be incorporated). The general algorithm is the most versatile one as it works with any joint distribution of
How can EVSI analysis inform study design in predictive analytics? Conducting a validation study is an investment in resources that will generate further information on the performance of a clinical prediction model in a target population. The decision whether to undertake a validation study should ultimately hinge on whether the information gained from such a study is worth the required investments. The EVSI, when scaled to the population, determines the expected return on investment in NB unit. Ultimately, such return should be contrasted against the efforts and resources required for such a study. In decision-analytic (health policy) modeling, EVSI is typically in net monetary units, and when scaled to population, can be compared with the budget of a planned data collection activity. The optimal sample size will be one that maximizes the difference between population EVSI and study costs. 36 The NB for risk prediction models, on the other hand, is in net true- or false-positive units and as such cannot directly be compared with the budget of a validation study. One can always embark on full decision analysis to translate all outcomes to net monetary units, but this will likely require sophisticated decision modeling and context-specific assumptions on long-term outcomes, a process that might take a significant amount of time and require further data collection (e.g., to obtain utility weights for outcomes). To us, a main reason for the vast popularity of decision curve analysis is that it provides an assumption-free, reproducible method for NB calculation based on the very same data that are used for studying model calibration and discrimination. We think VoI analysis during model development and validation should generally keep the same spirit. A full decision analysis should be relegated to after an impact analysis has measured the resource-use implications of implementing the model. This, however, means the decision rules for determining the optimal sample size of development and validation studies based on the VoI framework would be different than those used in health policy analysis. This article deliberately stayed away from proposing such rules and instead focused on defining concepts and proposing computation methods for EVSI. Proposing such decision rules is detached from EVSI calculations and deserves its own airing.
There are multiple areas of further inquiry. The EVSI framework should also be applied to the development phase of prediction models. This can guide the investigator on whether further development, or moving to validation, should be prioritized. We mainly focused on NB loss due to sampling uncertainty. However, there are several sources of uncertainty, such as whether our existing information on the performance of the model is directly applicable to the target population, or if predictors and outcome are measured with the same quality between the study and usual practice. The comparative statistical and computational performance of the EVSI computations algorithms, and the adequacy of a given number of simulations for each algorithm, should be evaluated in dedicated studies. We also do not claim the algorithms we proposed are the only ones that can be used for EVSI computations. Other algorithms, such as those based on the central limit theorem,38,39 can prove useful. VoI analysis in decision modeling has received a significant boost in computational speed in recent years due to the arrival of algorithms based on nonparametric regression modeling.40,41 This approach can facilitate VoI analysis in risk prediction as well. The EVSI defined in this work is for a single, homogeneous target population and does not consider heterogeneous settings. VoI metrics and corresponding computation algorithms for multicenter studies should be developed separately. Further, during external validation, often a secondary aim is to update the model if its performance turns out to be suboptimal. 42 Such model revision can take different levels of complexity, 43 and one might be interested in the expected yield of a given sample size for such model revision. This will get connected to the VoI concepts for model development. As stated earlier, how VoI metrics for prediction models should inform objective functions for determining the optimal sample size should be debated by the community in the hope of generating consensus and best practice standards.
There is an ongoing debate on the appropriateness of conventional metrics of uncertainty when reporting the NB of a clinical prediction model.7–9 The same concerns can logically be extended to the frequentist method for sample size and power calculations around NB.5,6 VoI methodology provides a rigorous, utilitarian response to such controversies. The toolbox of VoI methods for clinical prediction models is growing, and perhaps it is time to formalize the role of VoI in uncertainty quantification and design of empirical studies in predictive analytics.
Supplemental Material
sj-docx-1-mdm-10.1177_0272989X251314010 – Supplemental material for Expected Value of Sample Information Calculations for Risk Prediction Model Validation
Supplemental material, sj-docx-1-mdm-10.1177_0272989X251314010 for Expected Value of Sample Information Calculations for Risk Prediction Model Validation by Mohsen Sadatsafavi, Andrew J. Vickers, Tae Yoon Lee, Paul Gustafson and Laure Wynants in Medical Decision Making
Footnotes
Acknowledgements
We would like to thank members of the RESP lab for their insightful comments on earlier drafts.
The authors declared no potential conflicts of interest with respect to the research, authorship, and/or publication of this article. The authors disclosed receipt of the following financial support for the research, authorship, and/or publication of this article: Financial support for this study was provided in part by the Canadian Institutes of Health Research with a Team Grant to the University of British Columbia (PHT 178432) and by the National Institutes of Health/National Cancer Institute (NIH/NCI) with a Cancer Center Support Grant to Memorial Sloan Kettering Cancer Center (P30 CA008748). The funding agreements ensured the authors’ independence in designing the study, interpreting the data, writing, and publishing the report.
Ethics Statement
Ethics approval was not required as the empirical component of this study was based on anonymized, publicly available data (the GUSTO-I trial).
References
Supplementary Material
Please find the following supplemental material available below.
For Open Access articles published under a Creative Commons License, all supplemental material carries the same license as the article it is associated with.
For non-Open Access articles published, all supplemental material carries a non-exclusive license, and permission requests for re-use of supplemental material or any part of supplemental material shall be sent directly to the copyright owner as specified in the copyright notice associated with the article.