
Abstract
Background
Although immunotherapy (IMT) provides significant survival benefits in selected patients, approximately 10% of patients experience (serious) immune-related adverse events (irAEs). The early detection of adverse events will prevent irAEs from progressing to severe stages, and routine testing for irAEs has become common practice. Because a positive test outcome might indicate a clinically manifesting irAE that requires treatment to (temporarily) discontinue, the occurrence of false-positive test outcomes is expected to negatively affect treatment outcomes. This study explores how the UPPAAL modeling environment can be used to assess the impact of test accuracy (i.e., test sensitivity and specificity), on the probability of patients entering palliative care within 11 IMT cycles.
Methods
A timed automata-based model was constructed using real-world data and expert consultation. Model calibration was performed using data from 248 non–small-cell lung cancer patients treated with nivolumab. A scenario analysis was performed to evaluate the effect of changes in test accuracy on the probability of patients transitioning to palliative care.
Results
The constructed model was used to estimate the cumulative probabilities for the patients’ transition to palliative care, which were found to match real-world clinical observations after model calibration. The scenario analysis showed that the specificity of laboratory tests for routine monitoring has a strong effect on the probability of patients transitioning to palliative care, whereas the effect of test sensitivity was limited.
Conclusion
We have obtained interesting insights by simulating a care pathway and disease progression using UPPAAL. The scenario analysis indicates that an increase in test specificity results in decreased discontinuation of treatment due to suspicion of irAEs, through a reduction of false-positive test outcomes.
Non–small-cell lung cancer (NSCLC) is associated with significant mortality. The incidence of lung cancer is estimated to be 11.6% of all new cancer diagnoses worldwide and is considered the leading cause of cancer-related mortality. 1 Until September 2018, in the Netherlands, the first-line treatment in the metastatic disease setting (stage IV NSCLC) was chemotherapy with platinum doublets in patients without a targetable mutation, and patients presenting with a targetable mutation (e.g., epidermal growth factor receptor or anaplastic lymphoma kinase mutation) received a targeted therapy (e.g., erlotinib, crizotinib, or gefitinib). 2 Since then, the treatment landscape has fundamentally changed with the introduction of immunotherapy, which now has become a standard treatment. Initially, nivolumab and pembrolizumab were approved in the second-line setting, but, since 2018, immunotherapy based on PD-L1 expression with or without added doublet chemotherapy has been the standard first-line treatment. Clinical studies have shown that about 20% to 40% of patients respond to immunotherapy, with substantially prolonged survival benefit. Despite the clinical benefits of the use of immunotherapy treatments, immunotherapy is also known to be associated with immunogenic reactions that severely affect treatment schedules and outcomes. 3 To manage immunotherapy-related adverse events (irAEs), suspicion of irAEs is determined using a standardized set of blood tests. However, no clear guidance is available on aspects such as the frequency of tests, required test specifications, or interpretation of results. This might result in suboptimal diagnostics and outcomes, in terms of survival. 4
At the Netherlands Cancer Institute, a diagnostic panel was implemented and routinely used at 2-weekly intervals. Test outcomes are used to aid clinical decision making on treatment continuation, to confirm the suspicion of an irAE, and to grade the severity of an irAE. The diagnostic panel aimed to detect irAEs in an early stage to improve clinical management and outcomes. The diagnostic kit covers a broad spectrum of blood markers. Some of these tests are used in a different setting (e.g., screening for irAE without clinical complaints) as compared with their original routine use, which could result in suboptimal performance in detecting irAEs. In addition, there are no data on the optimal frequency and use of diagnostic tests for irAEs. Hence, there is an interest in optimizing the diagnostic workflow to, for example, reduce unnecessary testing. Optimizing the test sequence using a prospective or retrospective study design to test different diagnostic setups would be unfeasible given the number of possible diagnostic strategies, time, and financial constraints. In such cases, it is possible to construct simulation models based on real-world data to evaluate diagnostic strategies aimed at the detection of irAEs on disease management and patient outcomes.
This study explores the use of UPPAAL to model diagnostic strategies. UPPAAL was developed by computer scientists at Uppsala University (Sweden) and Aalborg University (Denmark). 5 The UPPAAL software uses a distributed modeling paradigm that allows for modeling a system using networks’ of timed automata (TA). The UPPAAL tool enables modelers to construct networks of TA. These networks consist of a finite set of automata with real-valued clocks and constraints. Automata can be seen as a state in which a predefined process will be executed automatically (e.g., changing an integer according to a predefined function). Within the network, clock values increase with equal speed, and clock values can be compared with integers to control transitions between automata. 6 Moreover, in these networks of TA, communication channels are used to allow for multiple types of synchronization signals that allow for communication between different automata in the network. Generally, TA models consist of multiple templates, with each template containing a network of automata used to model a specific function. The communication channels allow different templates to communicate with and influence each other. The ability to model substructures makes UPPAAL especially suited for modeling complex structures in which multiple agents have the ability to influence each other (e.g., a clinical pathway). In addition, UPPAAL provides extensive model-checking capabilities, which allow model developers to check the reachability of states or pathways. UPPAAL provides an environment that aids interdisciplinary communication (e.g., by using multiple templates to model subprocesses while using a graphical user interface). The heterogeneous treatment path and importance of event timing in the detection of irAEs requires a flexible modeling approach. In the field of health economics, patient-level Markov models, discrete event simulations (DES), or agent-based models are generally applied approaches when flexibility is required. A unique benefit of TA-based models over the currently preferred modeling approaches is the compositional model structure that allows modeled agents to interact with and influence each other through communication channels. This compositional nature of TA-based models makes them more flexible to adjust and also allows modeling of a continuous process that involves multiple decisions, as in the case of treatment of advanced cancers. A downside of TA-based models is the limitation in statistical distributions, which are limited to a uniform and exponential distribution in UPPAAL. However, in UPPAAL, there are workarounds that allow for the incorporation of other statistical distributions into the model. 7
Our research aims to use a TA-based routine to model the clinical-diagnostic pathway of irAEs and to populate and calibrate the model using real-world survival data. This model will then be used to demonstrate the feasibility of UPPAAL by evaluating different test scenarios with increasing diagnostic performance of a broad spectrum of irAEs tests. We hypothesize that a TA-based model created in UPPAAL will be versatile enough to capture the complexity of the clinical path and decision making.
Methods
Study Cohort
The model was developed using a cohort of patients treated with nivolumab through the compassionate use program and regular care, containing 248 patients. A description of the study cohort, response assessment, and safety assessment was published in Lung Cancer in 2017. 8 Of these patients, 133 were recruited through the compassionate use program, whereas 115 patients started treatment in regular care. All patients received at least 1 line of previous treatment (chemotherapy) before nivolumab. In August 2015, nivolumab was available through the compassionate access program by Bristol-Myers-Squibb in 8 different hospitals in the Netherlands (NCT02475382). In this program, patients who had received at least 1 previous line of anticancer treatment were eligible to receive nivolumab if they had a good clinical performance with no or mild symptoms (World Health Organization performance status 0–1) and had adequate lab values for blood markers specific for organ (dys)function (e.g., aspartate aminotransferase, alanine aminotransferase, or creatinine). 9 Data used in this study were limited to data acquired by the Netherlands Cancer Institute.
As part of routine care, patients were seen in the hospital every 2 wk, and laboratory tests were administered at baseline and every 2 wk thereafter. The laboratory assessment consisted of 30 blood tests including hematology, clinical chemistry, and hormonal measures, as depicted in Table 1.
A description of the biomarker test panel used in the detection of immune related Adverse Events
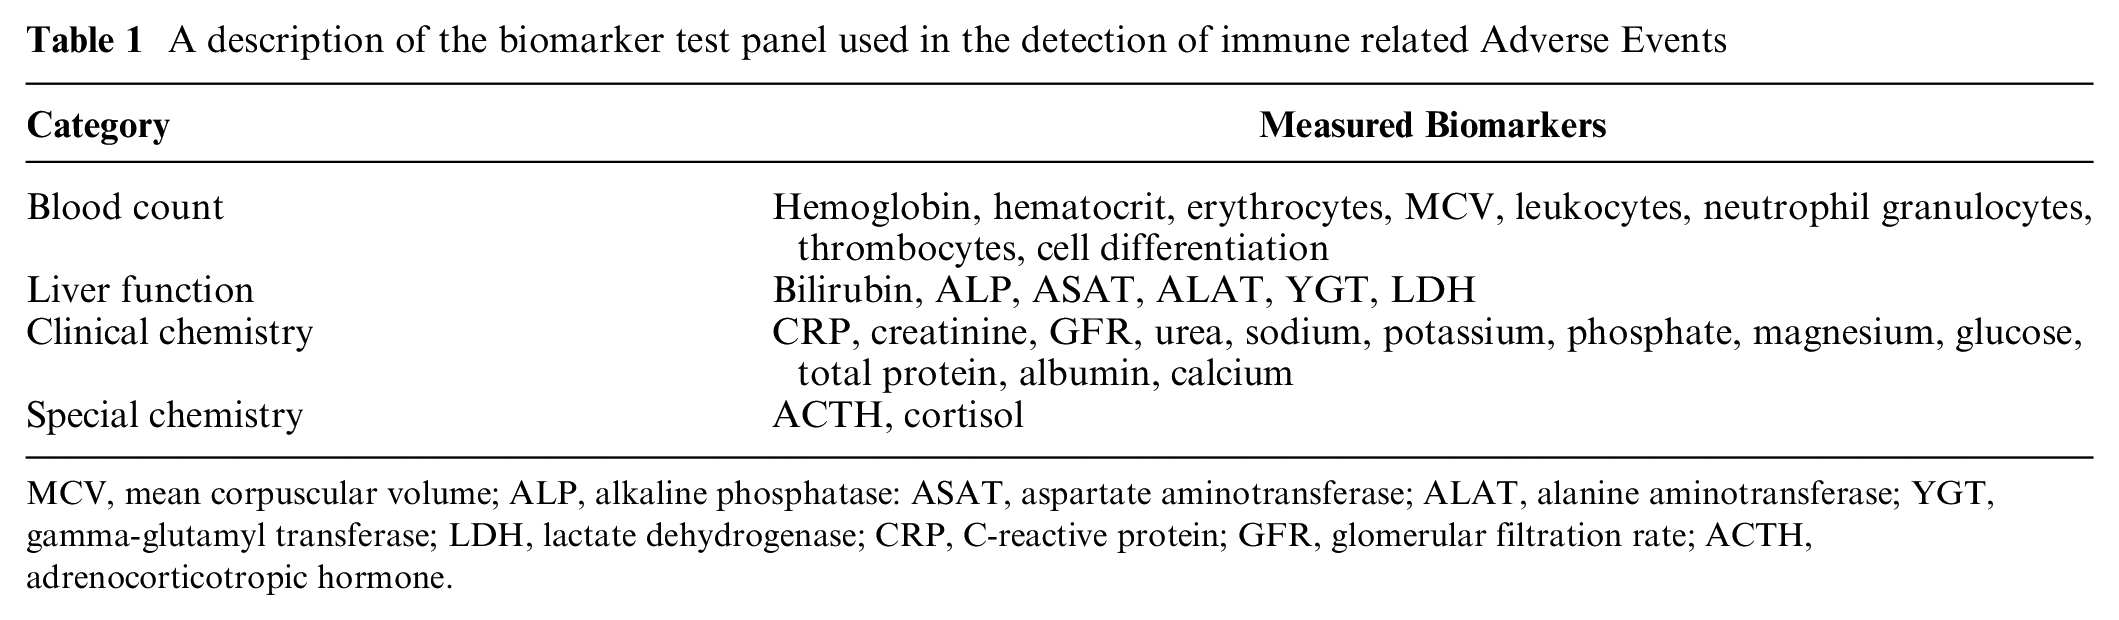
MCV, mean corpuscular volume; ALP, alkaline phosphatase: ASAT, aspartate aminotransferase; ALAT, alanine aminotransferase; YGT, gamma-glutamyl transferase; LDH, lactate dehydrogenase; CRP, C-reactive protein; GFR, glomerular filtration rate; ACTH, adrenocorticotropic hormone.
Disease progression was monitored through computed tomography imaging at 6 wk, 12 wk, 3 mo, 6 mo, 9 mo, 12 mo, and 15 mo after initiation of IMT. IMT was ceased in patients presenting with progressive disease. When any grade of irAE was clinically confirmed, patients were either withdrawn from IMT for the duration of a recovery period, which could take up to 5 wk, or IMT therapy was ceased definitively, and the patients proceeded to the next line of treatment. The NSCLC treatment landscape is heterogeneous. Therefore, in this model, the assumption is made that patients will transition to palliative chemotherapy after IMT is ceased definitively. During recovery, patients received appropriate treatment to recover from the incurred irAE. In practice, patients continued to the next line of therapy after discontinuation of IMT; in the model, we refer to this next line of treatment as “palliative care,” since only the IMT phase was incorporated in the model. The data used from this cohort included the time on treatment in weeks, the frequency, and the incidence of toxicities and progressive disease. All relevant irAEs incorporated in the model are described in Table 2.
A description of immune related Adverse Events included in the model, based on data from the Nivo chohort (n=248). The primary aim of the test lies in the detection of irAEs; however, these tests results are also part of the diagnostic process
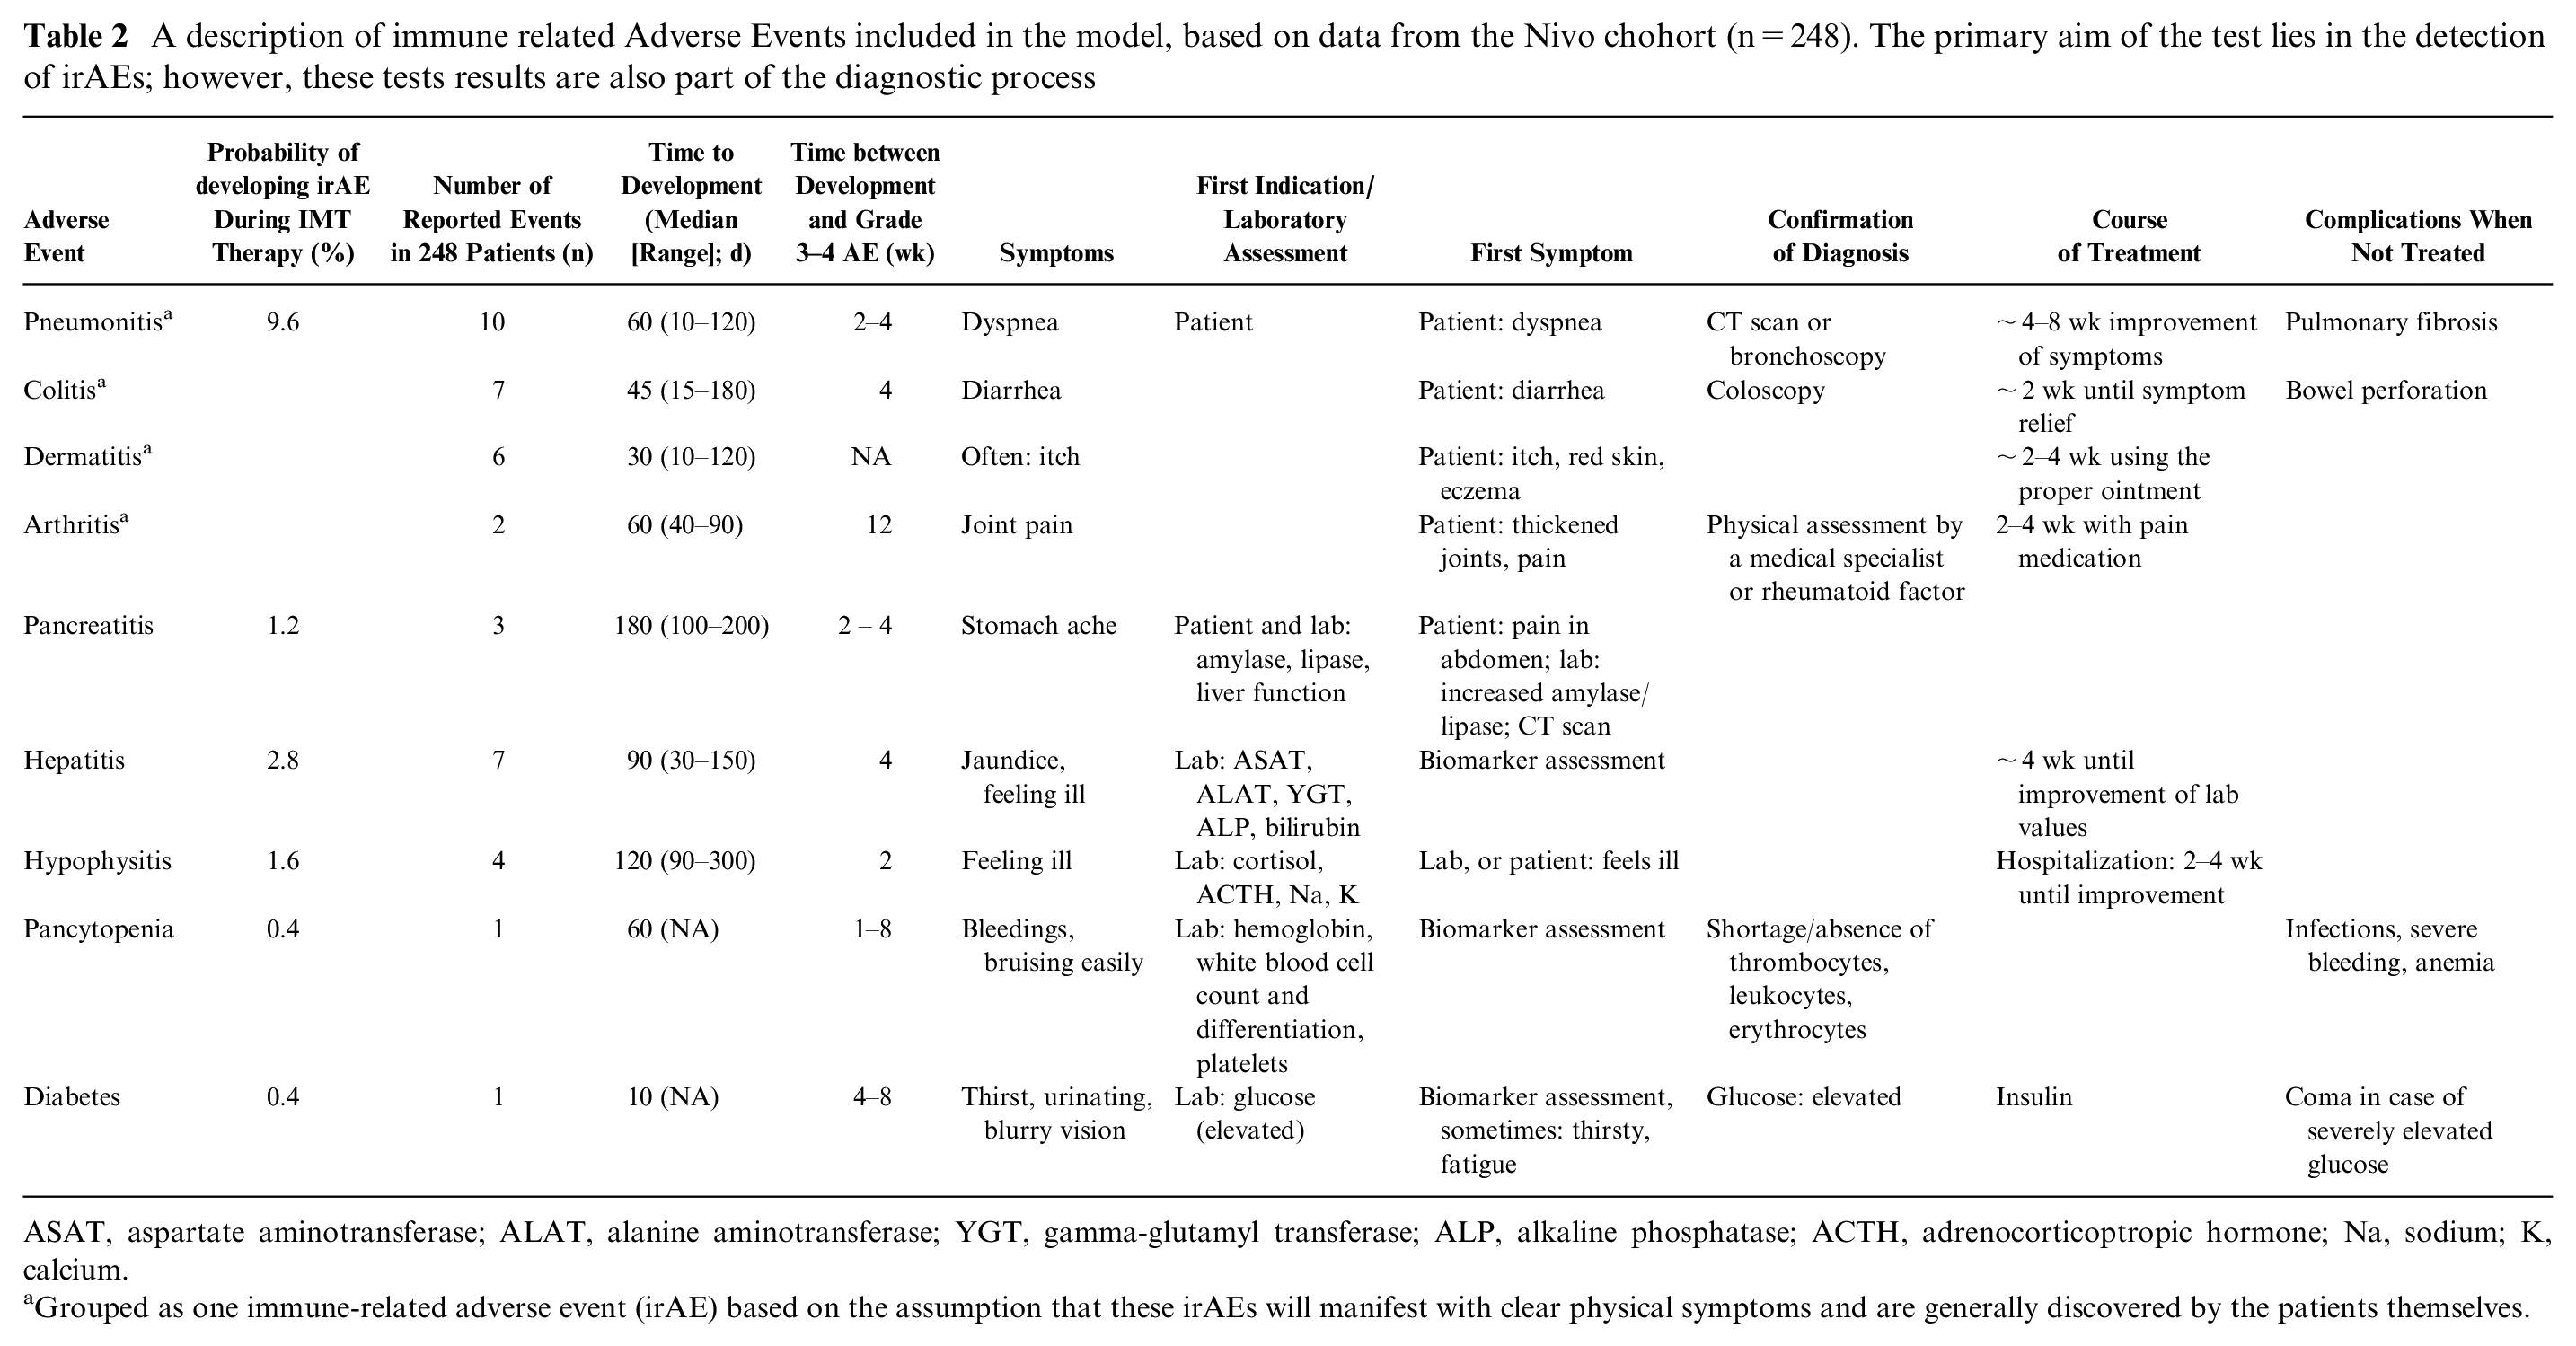
ASAT, aspartate aminotransferase; ALAT, alanine aminotransferase; YGT, gamma-glutamyl transferase; ALP, alkaline phosphatase; ACTH, adrenocorticoptropic hormone; Na, sodium; K, calcium.
Grouped as one immune-related adverse event (irAE) based on the assumption that these irAEs will manifest with clear physical symptoms and are generally discovered by the patients themselves.
Expert Consultations
A multidisciplinary team involving experts in computer science, medical oncology, laboratory medicine, epidemiology, and decision science was involved in the development of the model. During the model development phase, 5 meetings were arranged with the multidisciplinary team, in which the research questions, model structure, model inputs, and results were discussed.
Model Construction
Although TA-based models have been established in other fields, in decision science, TA-based models have rarely been used or published. The care pathway described in this study consists of 2 distinct events that are monitored independently during the treatment process (i.e., the development and detection of irAEs and the development and detection of disease progression). Markov or DES models use “events” or “timing of events” to dictate the flow of patients through the model. Most of these models are built around 1 decision and process (i.e., a flow of subsequent actions). However, these models are less able to model asynchronous, parallel processes with multiple decision points and events causing an interruption of a process at arbitrary moments. A DES model does provide a more flexible approach, and depending on software-specific abilities, a DES model should be able to reflect the 2 independent subroutines. However, it would require a more complex model structure for which competing risks are defined for each combination of events. When using a Markov model, short cycle times could be used to allow for the evaluation of events at each cycle. However, a Markov model is less able to capture complex pathways with time-varying probabilities. UPPAAL provides the ability to model independent processes asynchronously, while synchronization channels can be used to interrupt processes in subroutines when necessary. Other merits of using UPPAAL are the ability to create substructures that represent a specific aspect of the simulated pathway and its model-checking engine. The ability to model substructures aids interdisciplinary communication, since each substructure is assigned its own template in a graphical user interface. In addition, the model-checking engine enables model developers to check the reachability of each state or pathway. A high-level overview of the clinical pathway is depicted in Figure 1. This high-level overview was translated into 6 templates used to capture different parts of the clinical pathway. In our model, the IMT is stopped if the patient has received 11 cycles of IMT, the patient develops progressive disease, or treatment is ceased because of irAEs. Therefore, our model adopts a time horizon of 66 wk, that is, 11 treatment cycles with a duration of 6 wk per cycle. A comprehensive overview of all transition probabilities, time constraints, and the underlying data source is provided in Table 3.
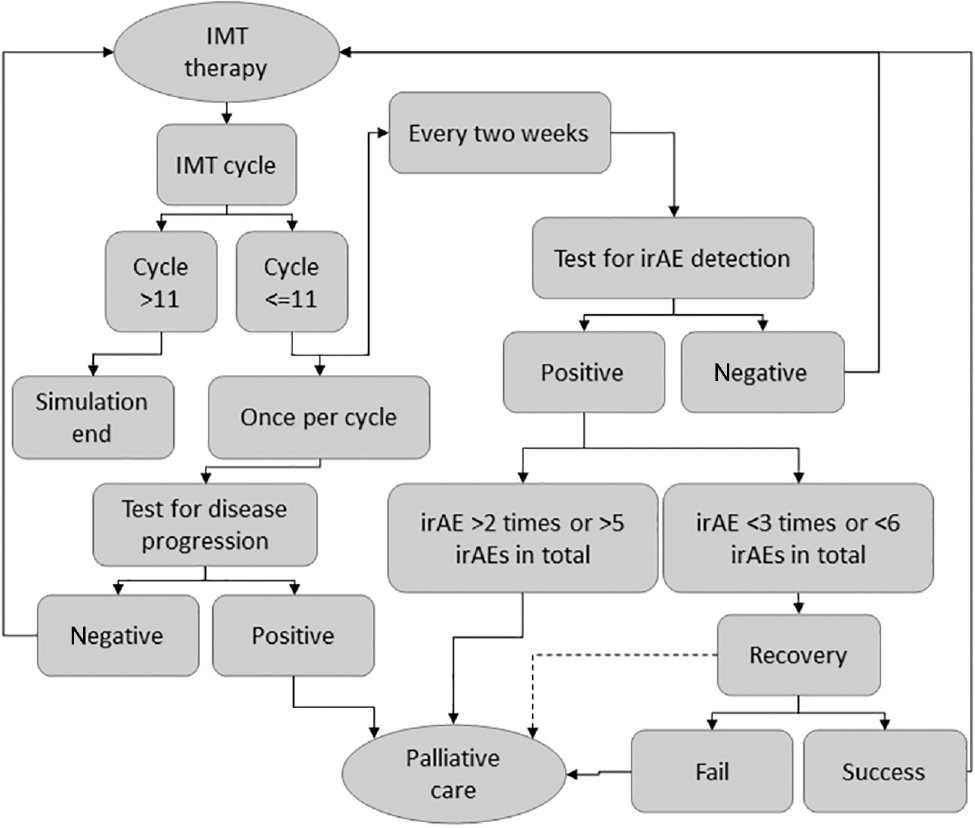
High-level overview of the clinical pathway. One IMT cycle consists of 6 wk of treatment with nivolumab. A test to detect progressive disease is performed once during every treatment cycle, and tests to detect irAEs are performed every 2 wk. All patients who are diagnosed with progressive disease, or who incur a specific irAE a third time, or who incur an irAE for a sixth time, transition to palliative care. Solid lines are used to depict standard transition options, and the dashed line represents a conditional transition (i.e., the transition depends on the outcome of a separate process, in this case, the detection of progressive disease). IMT, immunotherapy; irAE, immune-related adverse event.
Model parameters and a description of the source on which the model parameter was based
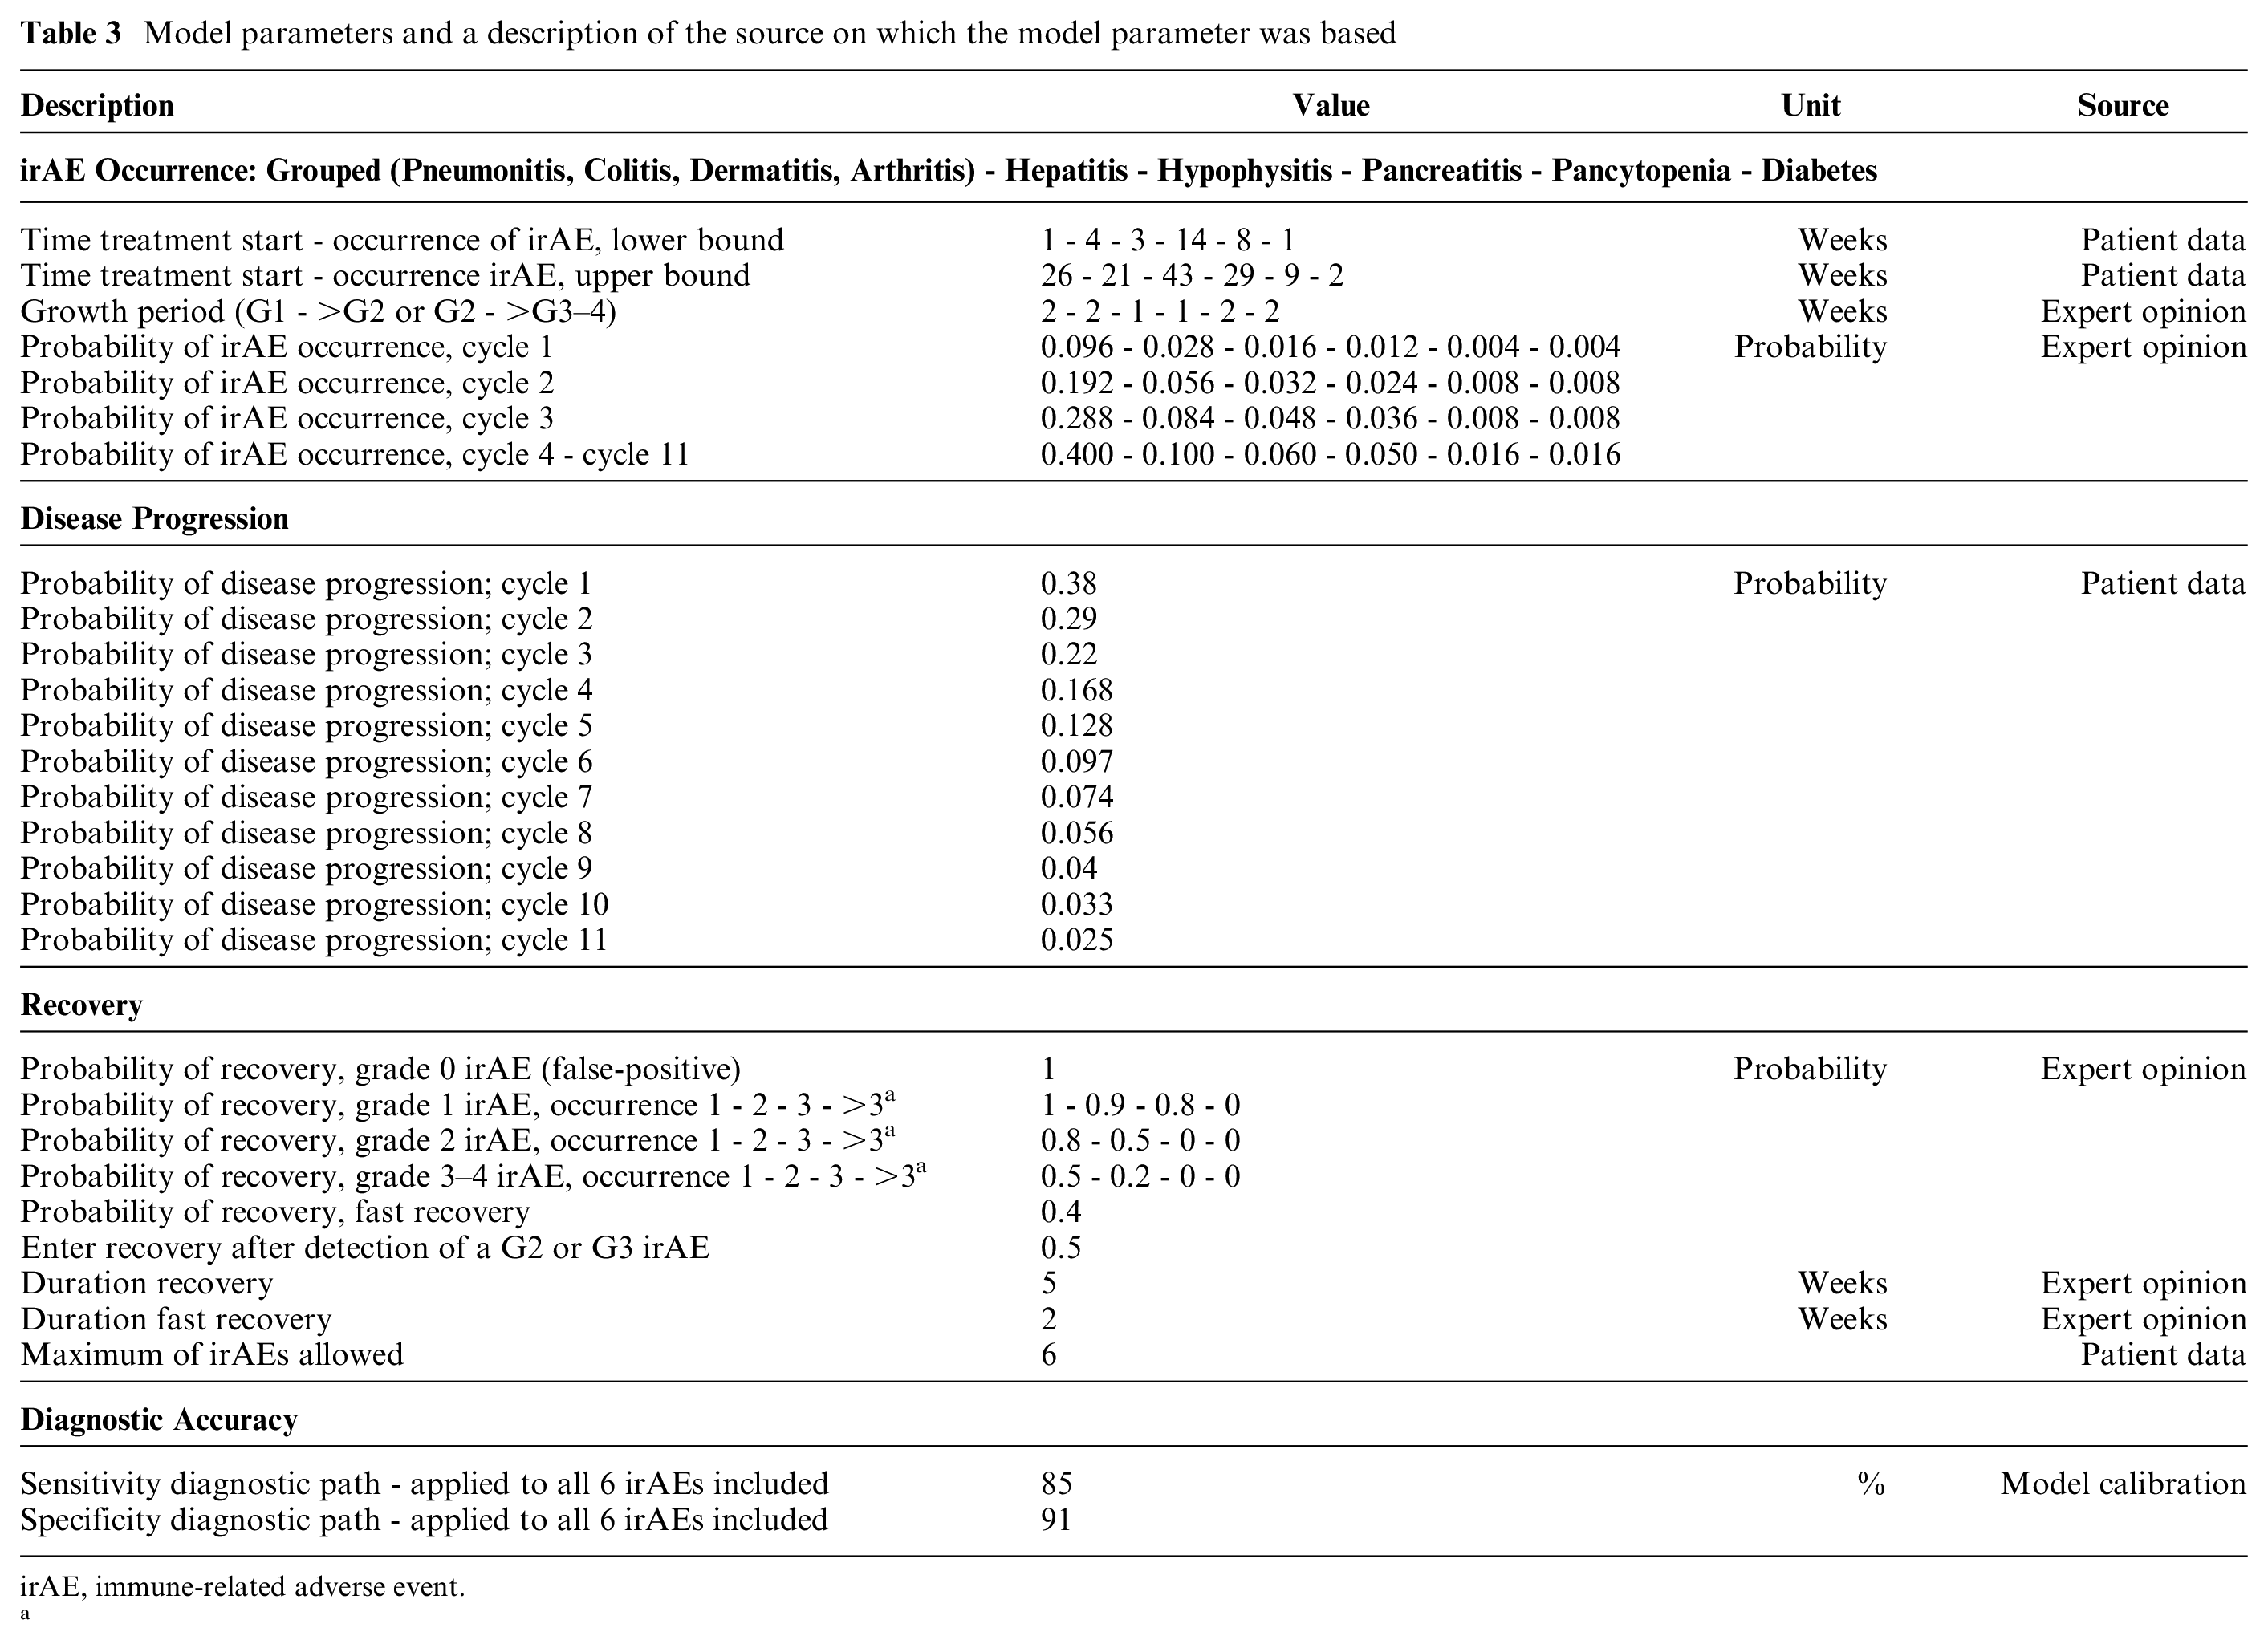
irAE, immune-related adverse event.
a
The 6 templates in the model are referred to as “Protocol,”“Patient,”“Toxic,”“Test,”“Monitor,” and “Progression Check.” Each of these templates fulfills a specific role in the model. The Protocol template is built to indicate whether a patient should receive tests aimed at the detection of irAEs, move to a recovery state, or transition to palliative care. The Patient template keeps track of the physical state of a patient (e.g., the grade of irAE incurred). The Toxic template determines whether a patient will incur a certain irAE. For patients who would develop an irAE, the template is also used to determine the point in time at which the irAE will manifest itself, simulate the progression of the irAE to a more severe grade, and determine whether a patient will recover once the patient enters the recovery phase. The Test template simulates outcomes of tests aimed at the detection of irAEs. The Monitor template is used to log the time patients spend in palliative care, which was chosen as the primary model outcome. Disease progression is modeled using the Progression Check template, in which the probability of disease progression is derived from patient data and decreases over time (Table 3). An extensive model description was published in an online repository. 10
Modeling of irAEs and Recovery
The severity of irAEs is described in grades ranging from grade 0 to grade 5. The absence of an irAE is defined as grade 0, whereas grade 5 is used to represent death caused by an irAE. 11 Within our model, grade 3, 4, and 5 irAEs are aggregated in a “grade3_and_4” irAE, because all of these grades of irAEs manifest with severe physical ailments that requiring clinical management. IrAEs progress from stage 1 to stage 3 within prespecified time intervals. The described time intervals are based on the average time between irAE development and presentation of severe physical symptoms (i.e., grade 3 irAEs). Therefore, patients transition from grade 1 to grade 2 and from grade 2 to grade 3 in 0.5 times the time it takes from irAE development until symptomatic disease (i.e., grade 3 irAEs; Table 2, “Time between Development and Grade 3–4 AE” column).
As shown in Figure 1, patients in whom 1 of the tests results in a positive outcome can either enter a recovery phase or transition to palliative care. During the recovery period, patients are withheld from IMT for a duration of 5 wk. Patients who are diagnosed with an irAE within the first IMT cycle transition to a “fast recovery” state, in which the recovery period is reduced to 2 wk. The fast recovery state is introduced to resemble clinical decision making during the first IMT cycle. During the first cycle, physicians strive to optimize the chances of IMT to have a beneficial effect. During recovery, the test for disease progression continues according to the 6-wk schedule, and patients diagnosed with progressive disease during recovery transition to palliative care directly. Recovery from irAEs in the recovery phase is dependent on a prespecified probability. This recovery probability is based on the IMT cycle number, the grade of irAE, and the number of previous irAEs (Table 3). A transition to palliative care is made when recovery from the irAE fails. IMT treatment is ceased indefinitely after entering palliative care. Moreover, the model allows for recovery of the same type of irAE twice, and patients are allowed to recover 5 times from any combination of irAEs included in the model. In case a specific irAE occurs for the third time or a patient develops an irAE for the sixth time, a transition to palliative care is made directly without entering the recovery phase.
Model Calibration
Because the accuracy of the diagnostic pathway (i.e., the combined accuracy of the tests and interpretation of test results by a physician) aimed at the detection of irAEs is unknown because of a paucity of information regarding the accuracy of tests in this specific application (i.e., the detection of irAEs and the influence of a physician interpreting these test results), model calibration is performed to improve the accuracy of the diagnostic path and ensure the internal validity of the model by comparing the model output to real-world patient data. The model was calibrated by changing the input values for the sensitivity and specificity of the diagnostic pathway and comparing the probability of patients entering palliative care over time. The cumulative probability of patients entering palliative care over time is calculated based on real-world data using R statistical software version 3.6.1 and the ecdf function included in the stats package.12,13 Within UPPAAL, a query is run to simulate 11 treatment cycles (i.e., 66 wk) and 100,000 patients. The probability of entering palliative care over time is retrieved directly from the query output in UPPAAL. Model outputs are compared with real-world data through data visualization using the ggplot2 package (version 3.2.1) in R. 14 The model calibration is considered successful when the model outputs are within the confidence bounds surrounding the real-world patient data. Confidence bounds are generated according to the Dvoretzky–Kiefer–Wolfowitz inequality. 15
One of the shortcomings of using only the test outcomes is the incapability of expressing the overall physical state of the patient, which might be of great influence concerning the decision on treatment continuation. In practice, test results are interpreted by a physician; this interpretation step is likely to result in an increase in the accuracy of the diagnostic process. Herein we define the accuracy of the diagnostic process as the accuracy of the test after interpretation of the test results by a physician. The accuracy of the diagnostic process is expressed in terms of test sensitivity and specificity. Conversely, the test accuracy is still used to refer to the sensitivity and specificity of each test when outcomes are solely compared with the threshold values for disease detection. Since the accuracy of the diagnostic process is unknown, we adjusted this accuracy until the described model outcomes closely match the observed patient data.
Scenario Analysis
A scenario analysis is performed to assess the influence of changes in diagnostic accuracy, that is, the sensitivity and specificity of the diagnostic process on the probability of patients entering palliative care within 66 wk of IMT. The scenario analysis makes use of a query, which provides the probability of patients entering palliative care within 66 wk. For this scenario analysis, 14 scenarios with different input values for the test sensitivity and specificity are drafted, including 2 sensitivity values to represent a high and low test sensitivity. The scenario analysis includes 7 specificity values chosen after empirical tests during model calibration show that a specificity lower than 88% results in a probability of 1 that patients would enter palliative care before week 66.
Results
Model Construction
As described in the Methods section, the constructed model consists of 6 templates, with each template fulfilling a specific function in modeling the clinical pathway. Here, we describe 2 templates in more detail to provide insight into the inner workings of the model.
Figure 2 depicts the template used to model the 6 different diagnostic processes that correspond to the irAEs included in the model. The template is replicated 6 times during a simulation, and each copy of the template is assigned an irAE through an identifier ([id]). Each test template is initiated in the “Start” location, and all tests are performed simultaneously when a signal is received through the synchronization channel indicated by “test?” When this synchronization signal is received, a transition is made from the start location to the location indicated by “irAE present?” The test outcomes depend on the presence of an irAE; in the model, “g[id]” is used to indicate the grade of irAE for each of the irAEs included in the model. In case a patient presents with the irAE corresponding to the respective test, the patient will follow the path “g[id]>0.” Patients free of the irAE continue through the path indicated by “g[id]==0.” For patients who present with an irAE, the test outcomes depend on the test sensitivity defined by “sens[id].” Patients presenting with an irAE transition to the location “Positive” in case of a positive test result. The probability of this true-positive test result is equal to the test sensitivity, whereas the probability of a false-negative test result (i.e., a transition to the location “Negative”) is equal to 1 minus the test sensitivity. Patients free of an irAE follow the path downward from “irAE present?” and can receive either a true-negative (transition to the location “Negative”) or false-positive test result (i.e., transition to the location “FalsePos”). The probability of receiving a true-negative test result equals the specificity of a test (spec[id]). The probability of receiving a false-positive test result is equal to 1 minus the test specificity. From the location “Positive,”“FalsePos,” or “Negative,” the patient returns to start. This transition automatically updates the values of “r,” which represents the grade of irAE incurred, and “rr,” which represents the number of times a specific irAE occurred.
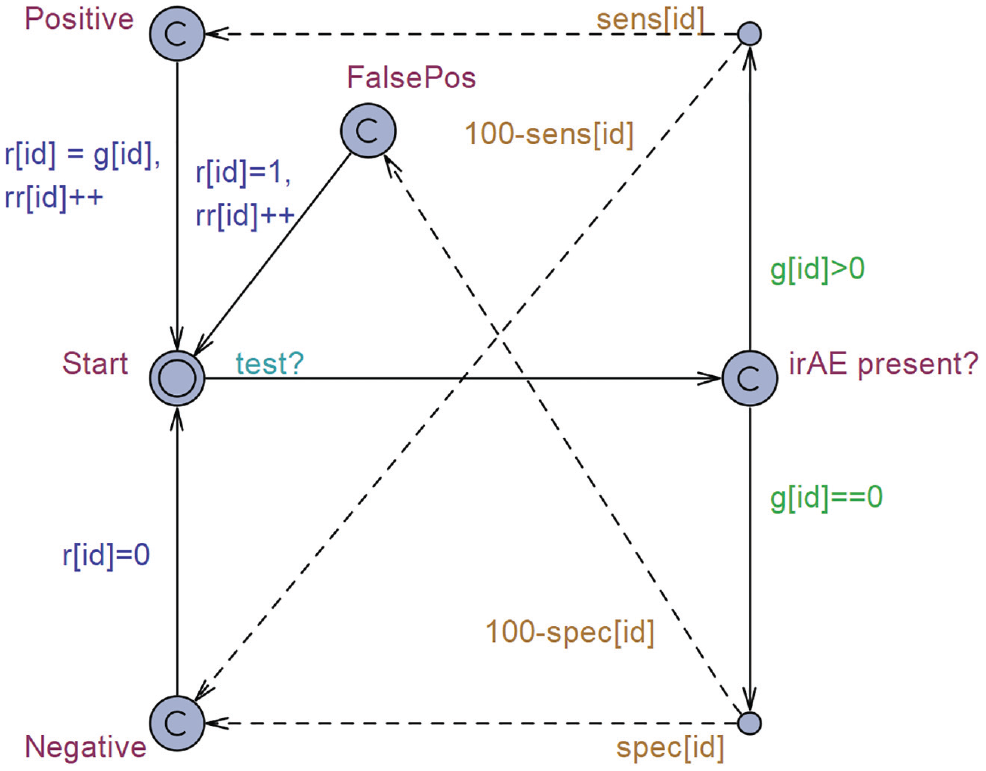
Template “Test,” a simulation of tests aimed to detect immune-related adverse events (irAEs) based on the test sensitivity, specificity, and presence of an irAE. Solid line: transition path; dashed line: transition based on a probability of that line being executed. Green text: guards, a requirement that must be met to allow the transition to occur. Orange text: probability, the probability with which a transition will occur. Blue text: update, once the transition occurs, the defined parameters will receive an update. Light-blue text: synchronization, the transition name followed by a “?” is a receiving channel, and the transition will take place once the synchronization signal is received. If the name is followed by a “!,” the channel will be used as a broadcasting channel, and a synchronization signal will be sent once the transition occurs.
The test protocol template as depicted in Figure 3 is initiated in the “Start” location. This template is used to simulate the IMT treatment cycles and interpretation of test results. The actions taken in the test protocol depend on a time in weeks indicated by “period.” During IMT, patients receive tests every 2 wks aimed at the detection of irAEs. The tests are performed when the patient transitions from the location “Neutral” to the location “Check.” During this transition, the communication channel “test!” is activated. Test results are evaluated in the location “Check.” Depending on the test result, patients can either continue the standard test sequence when no irAEs are found, that is, the patient transitions to the location “Wait” through the path indicated by “allvalues0()”. Go into a fast recovery phase “FastRecover” if the patient is diagnosed with an irAE during the first treatment cycle (path: !allvalues0 && cycle<=1). Enter the normal recovery phase “Recover” if the patient is diagnosed with a grade 1 irAE, is diagnosed with an irAE fewer than 3 times, and has completed at least 1 IMT cycle (path: somevalue1() && maxtwice() && cycle >1). Patients diagnosed with a grade 2 or 3 irAE, who have been diagnosed with an irAE fewer than 3 times, and who have completed at least 1 IMT cycle have an equal probability of 0.5 of either entering the recovery phase (location: Recover) or transitioning to palliative care (location: Palliative). This probability of 0.5 is indicated by the number 50 near the dashed arrows. Patients who receive a third positive test result for one of the included irAEs or who are diagnosed with an irAE for the sixth time transition to palliative care (location: Palliative) directly. The fast recovery period is defined to last 2 wk, as defined by the guard “period>=2” and the invariant “period<=2”, meaning the transition has to occur when the value of period equals 2. The standard recovery period is defined to last 5 wk (guard: period>=5, invariant: period<=5). The probability of recovery depends on the grade of irAE and the number of times the patient is diagnosed with the irAE. This probability is looked up in a table using the notation c[g[id]][rec[id]], in which “c” indicates the probability of recovery based on “g,” which represents the grade of irAE, and “rec” represents the number of real detected irAEs (i.e., the number of previously incurred true-positive test results).
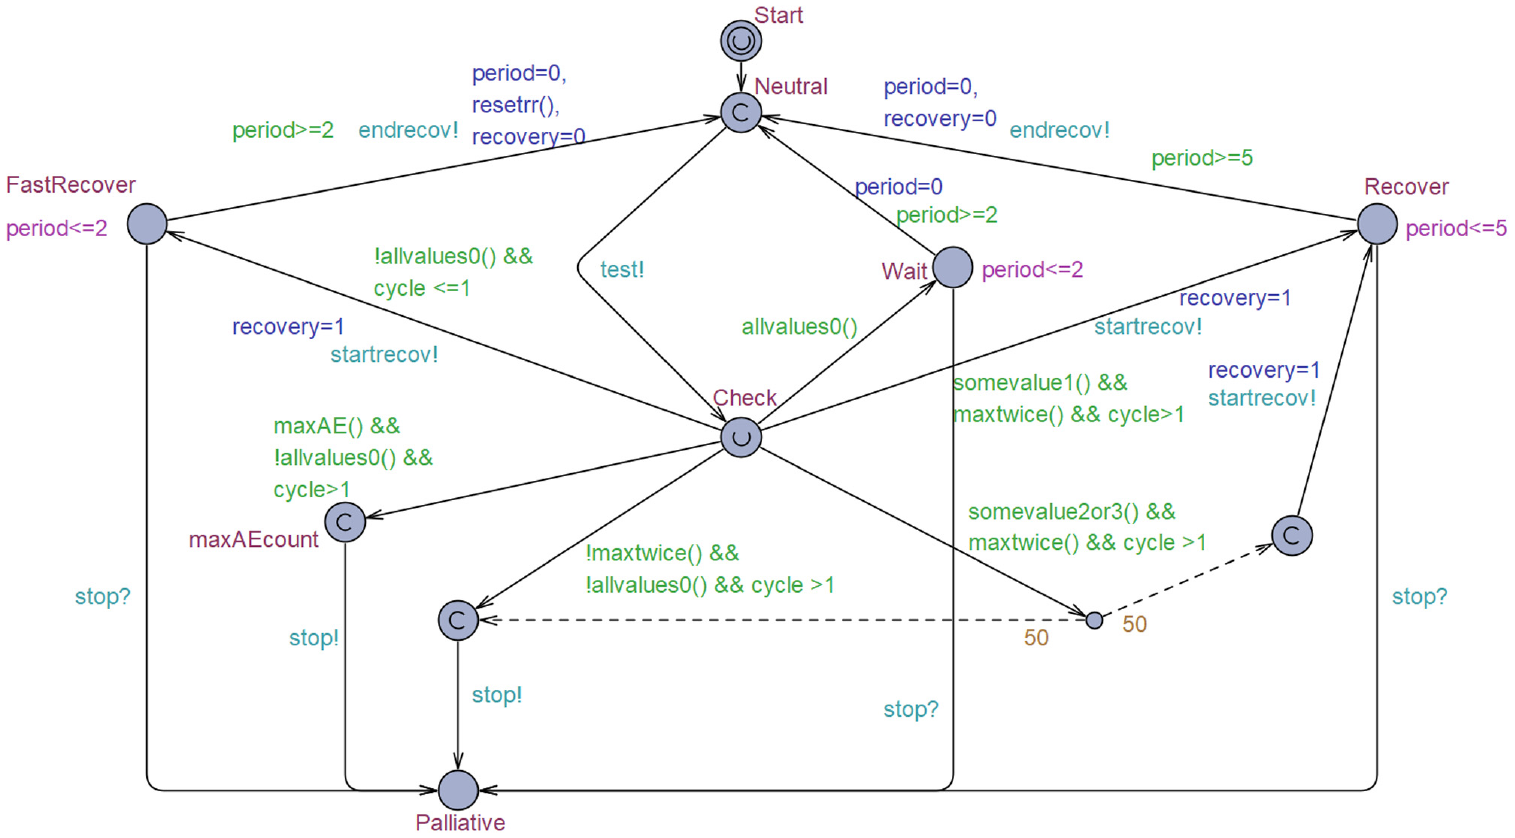
Template “Protocol,” which simulates the test protocol and clinical decision making. Solid line: transition path; dashed line: transition based on a probability of that line being executed. Green text: guards, a requirement that must be met to allow for the transition to occur. Orange text: probability, the probability with which a transition will occur. Blue text: update, once the transition occurs the defined parameters will receive an update. Light-blue text: synchronization, the transition name followed by a “?” is a receiving channel, and the transition will take place once the synchronization signal is received. If the name is followed by a “!,” the channel will be used as a broadcasting channel, and a synchronization signal will be sent once the transition occurs. Pink text: invariant, an upper limit for the maximum time until the next transition has to occur from this location.
Model Calibration
The model was calibrated by comparing the cumulative probability distribution of patients entering palliative care over time to observed patient data. Ultimately, a sensitivity and specificity of 85% and 91% provided a satisfactory fit, respectively. The choice was based on the visual fit of the model outcome as compared with patient data and its corresponding confidence bounds. However, after calibration, the model still underestimates the probability of patients entering palliative care slightly between week 8 and 48 of IMT and overestimates this probability from week 50 until week 66. Figure 4 depicts the cumulative probability distribution of patients entering palliative care over time, derived from patient data and model outcomes.
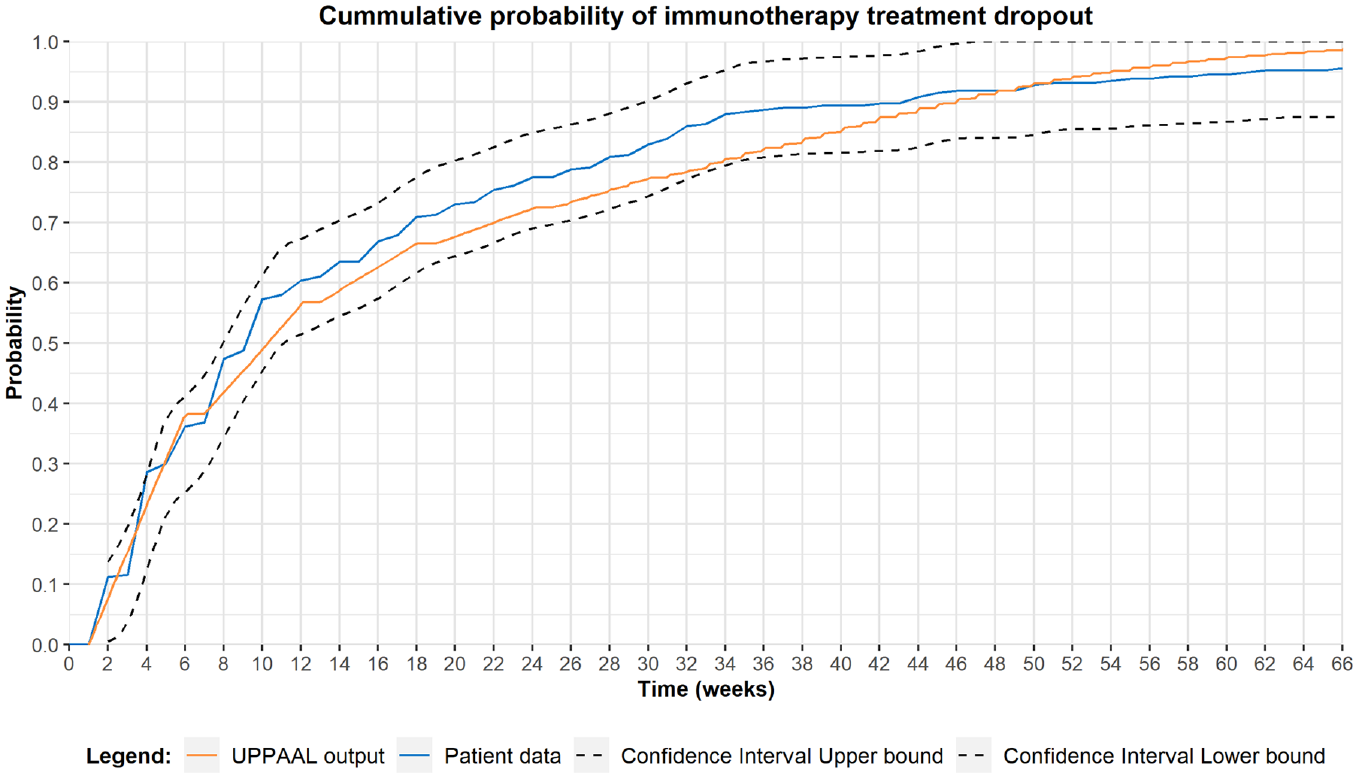
Model calibration, the probability of patients transitioning to palliative care over time. The blue line represents patient data, the orange line depicts model output, and the black lines represent the confidence bounds surrounding the patient data based on the Dvoretzky–Kiefer–Wolfowitz inequality. The model calibration was performed using the accuracy of the diagnostic process. Satisfactory results (i.e., model outputs are located within confidence bounds surrounding the patient data over the full 66-wk period) were provided using a sensitivity and specificity of 85% and 91%, respectively. Model outcomes were derived using the query: E[<=66;100 000](max:paltime).
Scenario Analysis
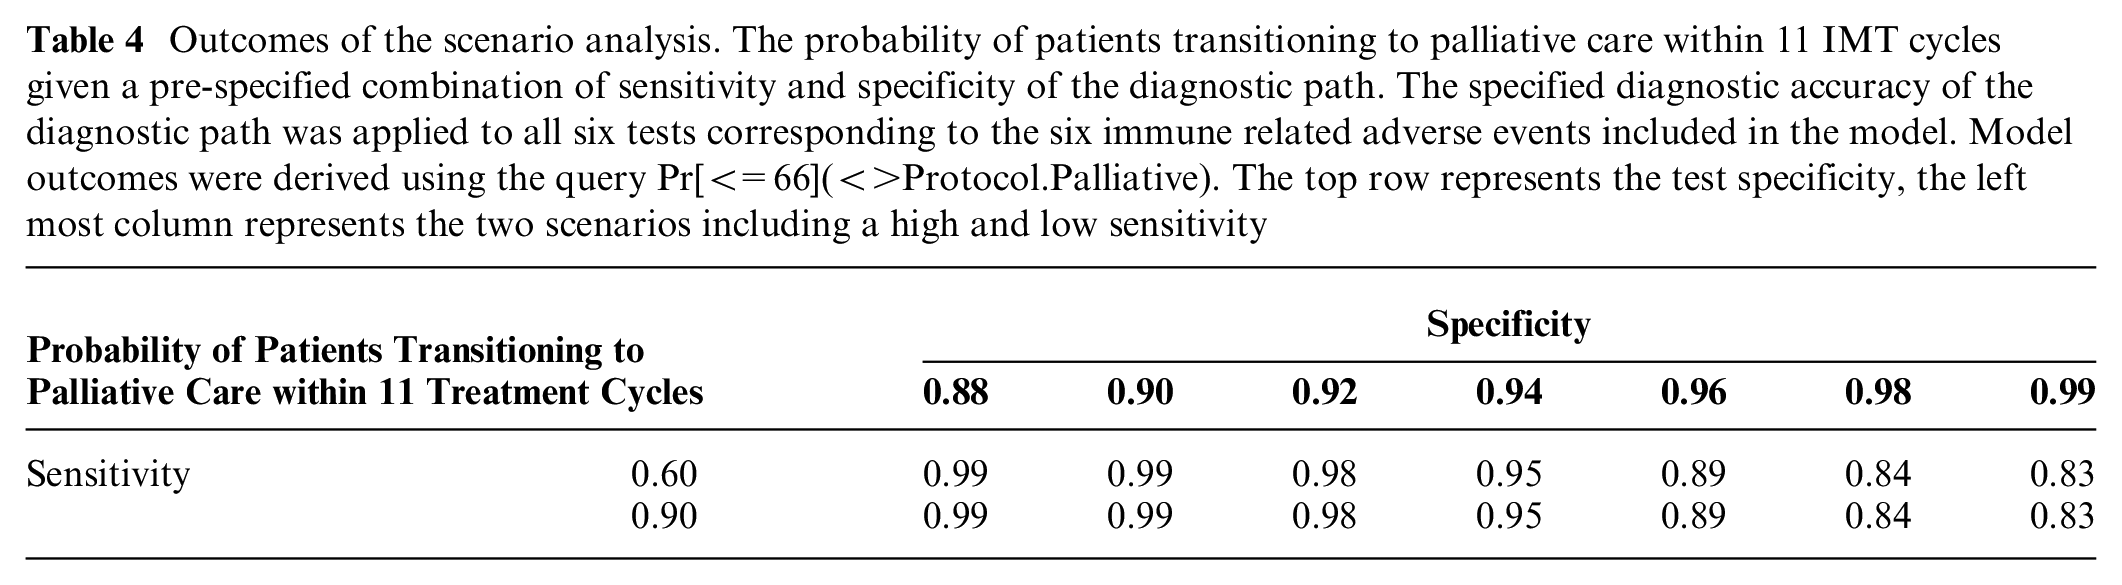
A scenario analysis was performed to evaluate the effect of the accuracy of the diagnostic process on the probability of patients entering palliative care. Table 4 depicts the probability of patients entering palliative care within 11 IMT cycles given a combination of sensitivity and specificity values for the diagnostic process (i.e., test results, including interpretation of test results by a physician). Our results show that changes in test specificity can have a significant effect on the probability of patients entering palliative care within 11 IMT cycles, with a difference of 15% between a test specificity of 88% and 99% (Table 4). Moreover, there was no significant difference between the scenario with the high sensitivity and low sensitivity in patients entering palliative care before week 66 of IMT, ceteris paribus.
Outcomes of the scenario analysis. The probability of patients transitioning to palliative care within 11 IMT cycles given a pre-specified combination of sensitivity and specificity of the diagnostic path. The specified diagnostic accuracy of the diagnostic path was applied to all six tests corresponding to the six immune related adverse events included in the model. Model outcomes were derived using the query Pr[<=66](<>Protocol.Palliative). The top row represents the test specificity, the left most column represents the two scenarios including a high and low sensitivity
Discussion
Managing IMT-induced irAEs is one of the great challenges in cancer management today. Several attempts have been made to predict patients’ susceptibility to irAEs in the treatment of solid tumors using immune checkpoint inhibitors. A variety of biomarkers have been studied in this context, including pretreatment serum antibody levels in melanoma patients 16 and baseline thyroid peroxidase, thyroglobulin, follistatin, and human interferon-inducible protein-10 levels in NSCLC patients.17,18 Moreover, a review by von Itzstein et al. 19 demonstrated the large variety of biomarkers studied in relation to the diagnosis and prediction of irAEs. Although predictive biomarkers might aid the identification of patients with a high susceptibility for irAEs, monitoring is still needed to identify any occurring irAEs. To our knowledge, there are no previous studies that have aimed to construct a model to analyze the development and detection of IMT-induced adverse events in lung cancer patients. In this article, we present a model that can eventually be used to evaluate the influence of test accuracy, timing, and composition of the diagnostic test panel on treatment continuation. Optimization of the diagnostic test panel might ultimately lead to a cost reduction through less frequent testing or a reduction in biomarkers included in the test panel. In addition, as depicted in Table 1, the current diagnostic panel consists of 30 biomarkers assigned to 1 of 4 analysis categories (i.e., blood count, liver function, clinical chemistry, and special chemistry). Although the current model aggregates all relevant biomarkers and their interpretation into a single test per irAE, an extension of the proposed model could be used to evaluate the added value of each individual biomarker in the diagnostic panel. Currently, a physician needs to analyze results from all biomarkers included in the diagnostic panel, resulting in a complex decision scheme. However, optimization of the diagnostic panel results in removal of tests with little added value from the test panel, resulting in a potentially less complex decision scheme. Although optimization of the test sequence would be unfeasible in prospective or retrospective studies because of the number of possible diagnostic strategies, a modeling approach allows for the evaluation of a large number of test sequences with less financial and time constraints. Our results indicate the feasibility of developing and calibrating a TA-based model developed in UPPAAL to simulate IMT in lung cancer patients, including disease progression and development of irAEs.
During model development, the probability of completing all 11 IMT treatment cycles was chosen as the outcome parameter to calibrate the model and compare different scenarios. This parameter was chosen in combination with the time horizon, which was limited to the IMT treatment period. It is known that the care pathway in NSCLC is very heterogeneous, and various treatment options are available after IMT. This heterogeneity in therapeutic pathways makes it unfeasible to include all relevant pathways in the model and to incorporate the effect of IMT on quality of life and survival during subsequent treatment lines. In the model, it is assumed that a 5-wk treatment cessation during a recovery period does not influence treatment outcomes. However, ceasing treatment too early might result in withholding a potentially beneficial treatment from patients.
With regard to model calibration, the model still slightly underestimates the probability of patients transitioning to palliative care during the period of week 8 to week 48 of treatment. Conversely, the model slightly overestimates this probability for the remaining 18 wk. These differences might be explained by 3 modeling challenges.
First, the diagnostic process of irAE detection is difficult, and there is a lack of strict guidelines on restarting IMT after a patient recovers from an irAE. Second, irAEs occur with a relatively low incidence, and patients are more likely to stop IMT because of disease progression. This might result in an underestimation of the probability of developing irAEs or the probability of recurrence after recovery. In the data set used during model construction, the percentage of incurred irAEs ranged from 0.4% up to 6.5% for individual irAEs, whereas in total, 18.1% of patients incurred an irAE. This low prevalence directly affects the uncertainty regarding the timing of events and the probability of occurrence. However, this does not affect the viability of UPPAAL in modeling the clinical pathway or the ability to calibrate the model. Third, little is known about the actual sensitivity and specificity of the diagnostic process in this specific setting, mostly because thresholds for disease detection are derived from other patient groups or a healthy population. In addition, because test results contribute to the decision-making process, the sensitivity and specificity of the diagnostic process can never be 100%, as many other factors influence the decision on treatment continuation. Moreover, within this process, it is unclear how much the true diagnostic accuracy of the tests is influenced by the physician, since the data used during model construction provide information only on the actual clinical decision. Although the true accuracy of the test is unknown, the model could be used to assess the influence of removing a test or changing the test frequency on the probability of completing all IMT cycles on cohort level.
We performed the scenario analysis to evaluate the influence of the accuracy of the diagnostic process on the probability of patients transitioning to palliative care. This scenario analysis shows a strong influence of test specificity, although the influence of test sensitivity did not appear to affect model outcomes. These results match our expectations given the low incidence of irAEs. The absence of an effect of test sensitivity might partially be explained by the low incidence of irAEs. However, the relatively high test frequency is also likely to lower the effect of changes in test sensitivity on model outcomes, as this could limit the impact of false-negative test results on model outcomes. Moreover, the direct effect of test sensitivity is not fully captured by the outcome measure, because a low test sensitivity might only delay the time until the irAE is detected in the model. This delayed detection could occur through a positive test later on or due to a symptomatic presentation of the irAE. Hence, the influence of the sensitivity of the diagnostic path on the probability of patients entering palliative care before week 66 is limited. However, there is a difference in the recovery probability depending on the grade of irAE at the time of diagnosis. Therefore, a high test sensitivity might allow for the earlier identification of irAEs (i.e., lower grade), resulting in more patients successfully recovering from the irAE and completing the 66 wk of IMT. Unfortunately, the low incidence of irAEs reduces the effect size of the sensitivity on cohort level.
In the currently used protocol, patients provide a blood sample every 2 wk. However, the blood samples are obtained at random time points throughout the day, depending on the patient’s appointment. The accuracy of the test might be influenced by this inconsistency in timing, since it is known that some blood values fluctuate during the day because of biological variability or under the influence of external factors (e.g., food or beverages). With the introduction of a new test to the test panel, it is key to keep an eye on the influence of the test on clinical decision making. A diagnostic test will provide added value only if it provides actionable results and when a physician acts on these results, in combination with tests already used. In patients with stable disease or response, it might be detrimental to stop IMT because of an irAE in cases of a lower grade or relatively harmless irAE.
Modeling the care pathway and evaluating treatment protocols might be helpful for identifying the most optimal test strategy, based on the composition of the diagnostic kit. Moreover, it would be unfeasible and potentially unethical to evaluate all options in a trial-based setting. Herein we present how UPPAAL can be used to develop a model that emulates the clinical pathway. As with most model-based evaluations, the generalizability of the results strongly depends on the underlying data, the alignment of the model structure with real-world clinical guidelines and pathways, and assumptions about the prior knowledge of physicians using the diagnostic information. Although we do not expect significant differences in the prevalence of irAEs or progressive disease, the clinical pathways and the prior knowledge of physicians do differ between health services. Because the diagnostic accuracy largely depends on the interpretation of results by a physician, and clear guidance regarding the interpretation of the test is lacking, it is expected that there will be differences in management between physicians, not only on an international level but also on an institutional level. In this study, the diagnostic accuracy was estimated in the model calibration and reflects the average accuracy of the diagnostic path for the group of physicians involved in the treatment of the study cohort. It is likely that physicians working in another health service have different experience and prior knowledge, and the generalizability of the current study critically depends on the extent of clinical expertise and variation in prior knowledge. Future work will involve expanding the model to identify the optimal diagnostic strategy in terms of costs and outcomes.
In conclusion, we have shown that it is worthwhile to construct a TA-based model to emulate complex clinical decisions in the management of NSCLC using UPPAAL. Based on assumptions that can be changed and adapted in the model, we calibrated the model using real-world data. The scenario analysis indicated that the effect of test accuracy on the probability of lung cancer patients treated with immunotherapy transitioning to palliative care is predominantly dependent on the test specificity. Moreover, the influence of test sensitivity is limited, and a high test specificity is important to prevent the too-early termination of IMTs.
Footnotes
The authors declared no potential conflicts of interest with respect to the research, authorship, and/or publication of this article.
The authors disclosed receipt of the following financial support for the research, authorship, and/or publication of this article: Financial support for this study was provided entirely by an unrestricted research grant from a charity foundation which prefers not to release information to the public. The funding agreement ensured the authors’ independence in designing the study, interpreting the data, writing, and publishing the report.