
Abstract
Obtaining the arterial input function (AIF) is essential for quantitative regional cerebral perfusion (rCBF) measurements using [15O]H2O PET. However, arterial blood sampling is invasive and complicates the scanning procedure. We propose a new non-invasive dual scan technique with an image derived input function (IDIF) from an additional heart scan. Six patients and two healthy subjects underwent [15O]H2O PET imaging of 1) heart and brain during baseline, and 2) heart and brain after infusion of acetazolamide. The IDIF was extracted from the left ventricle of the heart and compared to the AIF. The rCBF was compared for six bilateral cortical regions. AIFs and IDIFs showed strong agreement. rCBF with AIF and IDIF showed strong correlation for both baseline rCBF (R2 = 0.99, slope = 0.89 CI: [0.87; 0.91], p < 0.0001) and acetazolamide rCBF (R2 = 0.98, slope = 0.93, CI:[0.90;0.97], p < 0.0001) but showed a positive bias of 0.047 mL/(g·min) [−0.025; +0.119] for baseline and 0.024 [−1.04, +1.53] mL/(g·min) for acetazolamide. In conclusion, the invasive arterial cannulation can be replaced by an additional scan of the heart with a minor bias of rCBF estimation. The method is applicable to all scanner systems.
Introduction
Stroke is one of the leading causes of death worldwide responsible for about 5.5 million deaths annually and another 5 million of the survivors severely chronically disabled.1,2 While magnetic resonance imaging (MRI) is the method of choice for diagnosing stroke, positron emission tomography (PET) is the gold standard for measuring regional cerebral perfusion (rCBF) using [15O]H2O. 3 Quantitative perfusion measurements may offer complementary clinical information, and we have recently shown that rCBF after acetazolamide administration for vasodilation is a highly prognostic marker of cerebrovascular events compared to MRI. 4 However, to achieve quantitative rCBF, invasive arterial blood sampling to measure the arterial input function (AIF) is necessary. 3 The use of arterial cannulation does not only come with risks of discomfort, arterial injury and hematoma, but it also extends and complicates the procedure due to the additional invasive procedure and requirement of cross-calibration between blood measurement instruments and PET-scanners.5 –8
Several alternative non-invasive methods for cerebral perfusion PET measurements have been proposed. Most methods center on constructing image-derived input functions (IDIF) from carotid arteries and require partial volume correction due to their limited diameter.6,9 –11 Using new long-axial field-of-view (LAFOV) scanners, the cerebral measurements may be obtained simultaneously with an IDIF from the heart or aorta, which has increased interest in the field. 8 The present study continues the work of establishing non-invasive methods for rCBF measurements applicable to all scanner systems.
We propose a sequential dual-scan approach: First, imaging the heart to construct the input function. Second, imaging the brain to obtain the rCBF measurements. Thus, eliminating the need for invasive arterial cannulation and reducing associated risks and complexities. We aimed at evaluating our dual scan method for measuring quantitative rCBF as a reliable non-invasive method that can be used across most PET systems.
Methods
Study population
Eight subjects were included consisting of six clinical patients with cerebral steno-occlusive arterial disease suspected of hemodynamic insufficiency and two healthy elderly subjects. Patients were referred to clinical [15O]H2O PET by the Department of Neurology, Copenhagen University Hospital Bispebjerg. The study was performed according to the Helsinki declaration and national regulations and consents to participate were obtained from all individuals after receiving oral and written information. The study of the patients was registered at the Regional Committee of Health Research Ethics for the Capital Region of Denmark (ID: 21069067) that waived need for ethical approval. The healthy subjects were recruited at the Department of Clinical Physiology and Nuclear Medicine as part of another ongoing study, which was approved by the Regional Committee of Health Research Ethics for the Capital Region of Denmark (ID: H-21076058). Exclusion criteria for the healthy subjects were age <60, claustrophobia, previous neurological or psychiatric illness, significant somatic illness, and allergy to acetazolamide.
[15O]H2O PET
Subjects underwent four scans each using a Discovery 710 PET/CT scanner (GE Healthcare, Milwaukee, USA): heart and brain scans during baseline (10 min between injections) and brain and heart scans 20 min after start of infusion of acetazolamide (1000 mg Diamox®) in 50 mL saline over 5 min. A low-dose CT scan was used for attenuation correction and anatomic localization. For each scan, a bolus with mean dose of 447 MBq [15O]H2O (range 345–556 MBq) was injected using an automated injection system, Hidex RadiowaterGenerator (Hidex, Turku, Finland) ensuring reproducible bolus injections. Reconstruction of dynamic PET images (18 × 5 s, 9 × 10 s, 3 × 15 s and 3 × 30 s; 5 min 15 s in total) was performed using ordered subset expectation maximization (OSEM) with Time of Flight (ToF) (2 iterations, 24 subsets and 6.4 mm in-plane, and standard z filtering) with corrections for attenuation, scatter and dead time.
Arterial input function (AIF)
Arterial cannulation was performed in the radial or brachial artery, preceded by local analgesia (40 mg Lidocaine). Continuous arterial blood sampling was conducted throughout each of the four scans. An on-line automatic blood sampling system (Allogg ABSS, Stockholm, Sweden) was configured to draw blood at a rate of 7 mL/min. Sampling was set to a frequency of 1 Hz. Measurements were synchronized to the scan time and corrected for decay, dead-time, and cross-calibrated to the scanner to construct an arterial input function (AIF). The AIF of each subject was dose corrected (scaled) to 400 MBq and the peaks were synchronized.
Image derived input function (IDIF)
The image derived input function (IDIF) was extracted from the left ventricle of the heart. An ellipsoid volume of interest (VOI) (approx. 1 cm3) was manually delineated in the lumen of the left ventricle based on the 3–4 frames with highest activity during first-pass in each subject. Care was taken to ensure that the VOI was as large as possible without interfering with the ventricle wall in any frame, as no movement correction was used. After a visual check for movement artifacts, the VOI was copied to the remaining heart frames. Using these VOIs, an activity curve was obtained as the IDIF.
The IDIF from the heart is earlier in time and not dispersed compared to the AIF from the wrist
12
To simulate the dispersed AIF, the IDIF was run through an in-house script, where it was dose-corrected (scaled) to match the brain scan dose, delayed, convoluted with the exponential kernel
Regional cerebral perfusion
PMOD 4.302 software (PMOD Technologies, Zurich, Switzerland) was used for analysis. Regional cerebral blood flow (rCBF) was calculated using a pixel-wise 1-tissue compartment model (PXMod tool, model: Zhou GRRSC) using either the AIF measured during the brain scan or the IDIF as input function. Dispersion and delay of the input functions was fitted to match the count rate in a large brain region and the fitted values were used to correct the input functions before modeling (see supplementary data). Brain regions were manually drawn at the level of the centrum semiovale for the 2 × 3 main brain arteries (anterior, middle, and posterior cerebral arteries) as previously described. 4
Statistical analysis
For all tests, a p-value less than 0.05 was considered statistically significant. The statistical software R (version 4.2.0) were used. To evaluate if the measured IDIF can replace the AIF, we used a two-step evaluation: 1) Are the AIF and IDIF curves similar? 2) Do AIF and IDIF give rise to similar rCBF?
Comparison of AIF and IDIF
The AIFs and IDIFs of each scan were dose corrected to 400 MBq and time-shifted, and the area under the curve (AUC) were measured. For comparison, each measurement of AIF during the brain scan and IDIFs were plotted against each other and AUCs were compared.
Comparison of brain perfusion using AIF and IDIF
Linear regression models were employed to examine rCBF obtained from respectively AIF and IDIF in the six selected cerebral regions both during baseline and acetazolamide. We chose to include several regions from each subject as independent measures to simplify the analysis, as the number of regions was identical in all subjects. A Bland-Altman plot was generated to estimate the systematic bias in the calculated rCBF. The 95% confidence interval and limits of agreement were calculated.
Can the second heart scan be omitted?
To simplify the procedure additionally, we evaluated if the second scan of the heart could be omitted. rCBF in the six brain regions using the first and the second IDIF was compared for each subject. Absolute and relative differences as well as mean values for each subject were calculated. Further, the relative increase in rCBF, cerebrovascular reactivity (CVR) after acetazolamide infusion using two heart scans was compared to using the baseline IDIF for both scans.
AIF reproducibility
Lastly, as a quality check we tested whether subsequent injections give rise to similar arterial curves for each subject. The AIFs of each scan were all dose corrected to 400 MBq, and the AUCs was calculated. As for comparison of AIF and IDIF, linear regression models of each measurement as well as AUCs were used to asses if subsequent AIFs during heart and brain scans were statistically different.
Simulations
In the present study, we transformed the IDIF to the dispersion and delay of the AIF as the PMOD software is optimized for AIF. For future non-invasive studies, we aimed to evaluate the impact of dispersion errors of the IDIF to evaluate if an undispersed IDIF provide more robust results. We simulated brain time-activity-curves (TAC) with increasing dispersion of the input function. An extracted IDIF was run through our in-house software with increasing dispersion (0–10 s). The resulting input functions were used to construct simulated TAC based on a one tissue compartment mode (1TCM) without delay or blood volume component (using K1 = 0.64 and k2 = 0.77). The resulting simulated TACs were loaded into to the PKIN tool (PMOD, PMOD Technologies) to fit a 1TCM using the input function dispersed to 0 s. Resulting K1 was estimated with and without correction for delay.
Results
Six patients (two females, median age 44, range 38–61) with steno-occlusive arterial disease (takayasu arteritis (n = 1), Moyamoya (n = 2), arteriosclerotic internal carotid artery occlusion (n = 3) were enrolled in the study as well as two healthy elderly volunteers (one female, 82 and 89 years). Each subject underwent four AIF measurements, resulting in a total of 32 datasets. Six of these measurements across three subjects were compromised due to clotting interference, specifically: one test was invalidated in one subject, two tests in another and three tests in the third subject. These AIF measurements were excluded from further analysis.
Comparison of AIF and IDIF
Figure 1 shows the comparison of the AIF and IDIF curve for a representative subject. AIF and IDIF showed strong correlation when comparing each measurement (R2 = 0.93, slope: 0.934, CI: [0.93;0.94], p < 0.05, intercept: 2.06 p < 0.05, and for comparing AUCs (Figure 2) (R2 = 0.93, slope 1.09, CI: [0.92–1.27], p < 0.0005, intercept: −1747.8, p > 0.05). Pearson correlations between measurements were r = 0.96 (p < 0.05) and for AUC r = 0.96 (p < 0.05). Thus, indicating significant statistical similarity between the individual participants’ AIF and IDIF curve shapes albeit with a systematically smaller AUC for the IDIF.
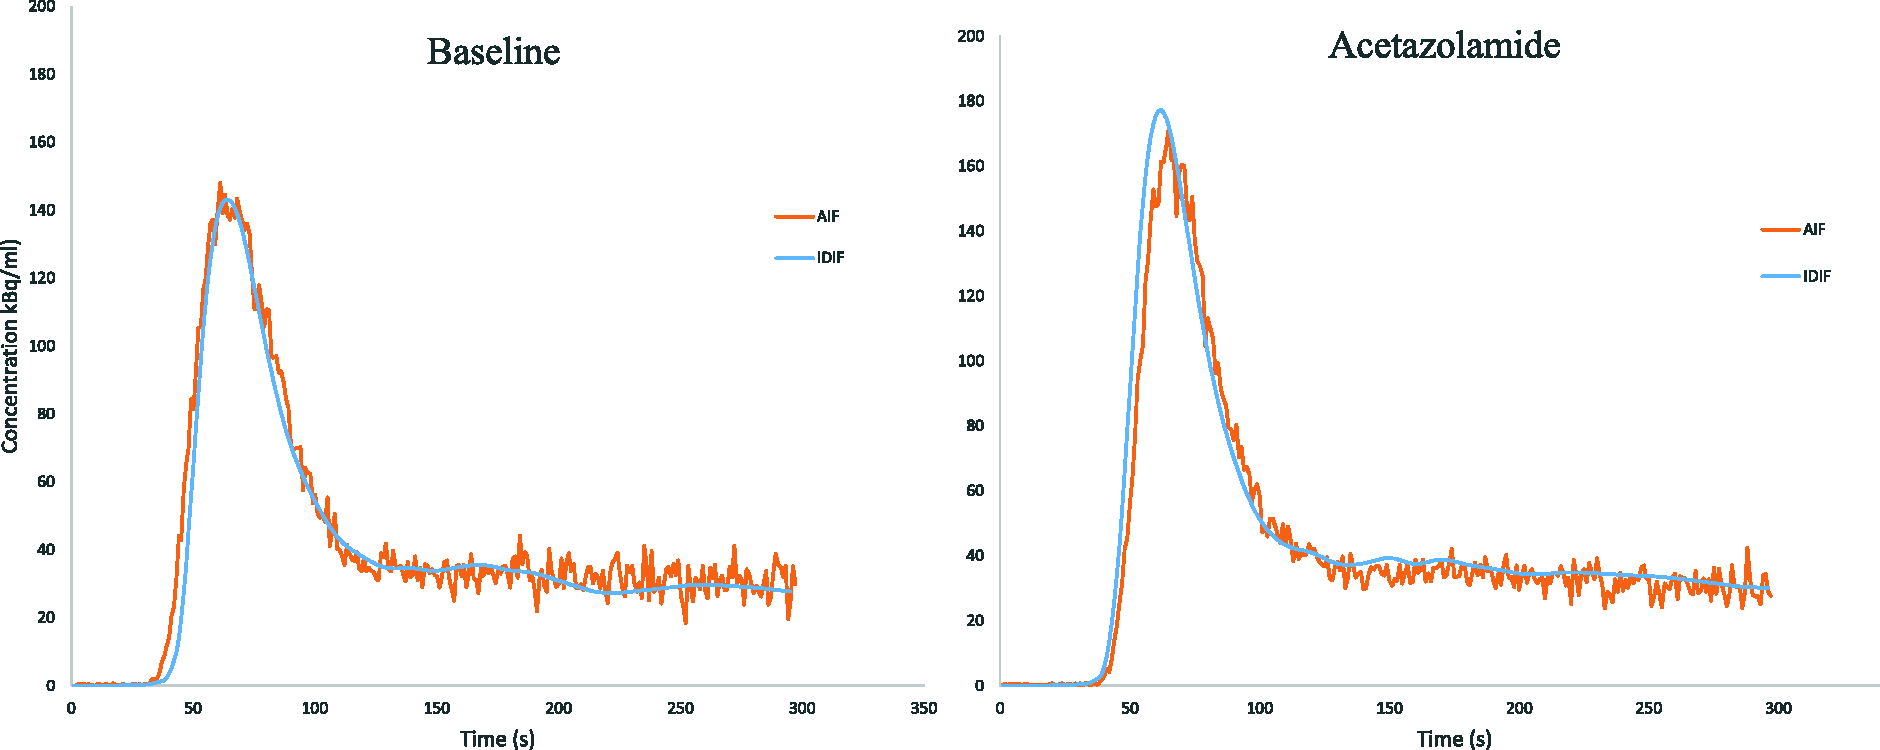
Dose-corrected AIF’s and IDIF’s for two representative subjects. The ‘noisy’ orange curves are the AIFs and the smooth blue are the IDIF’s dispersed to match the AIF.
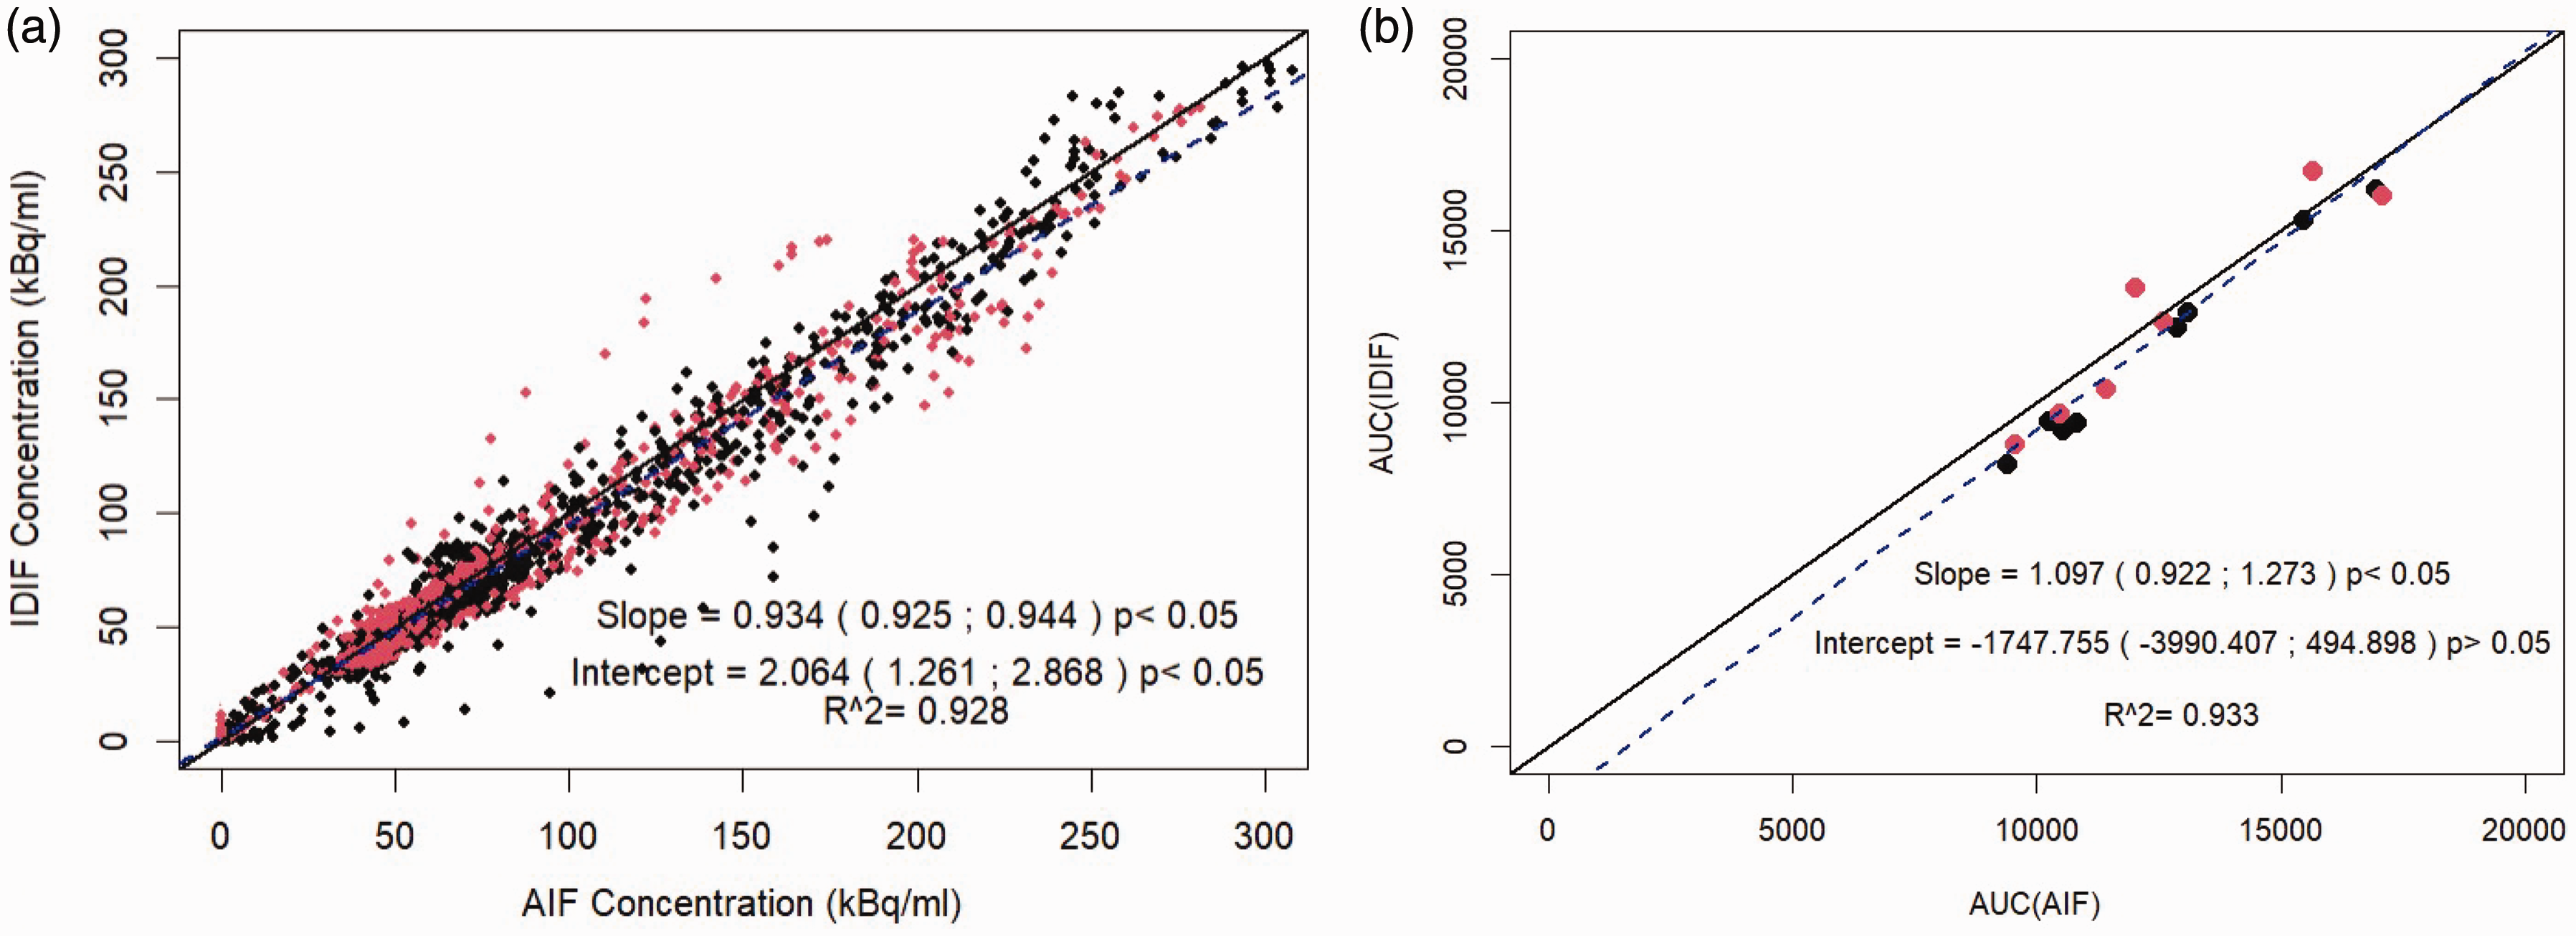
Comparison of AIF and IDIF. (a) concentration measurements and (b) AUC for AIF and IDIF. Baseline scans are black point and acetazolamide in red. Solid black is line of identity and blue dashed is regression line for baseline and acetazolamide combined.
Comparison of brain perfusion using AIF and IDIF
Linear regressions showed strong correlation for both baseline rCBF (R2 = 0.87, slope = 0.81 CI: [0.72; 0.91], p < 0.0001, intercept: 0.036, p > 0.05) and acetazolamide rCBF (R2 = 0.90, slope = 0.79, CI: [0.71;0.86], p < 0.0001, intercept: 0.08, p < 0.05) between AIF and IDIF (Figure 3). Pearson correlations were r = 0.93 (p < 0.05) for baseline and r = 0.95 (p < 0.05) for acetazolamide. The Bland-Altman plot (Figure 3) indicated mean difference systematic bias of 0.047 [95% Limits of agreement: −0.025; 0.119] mL/(g·min) towards IDIFs for baseline and for acetazolamide a bias of 0.024 [95% Limits of agreement: −1.04; 0.153] mL/(g·min).
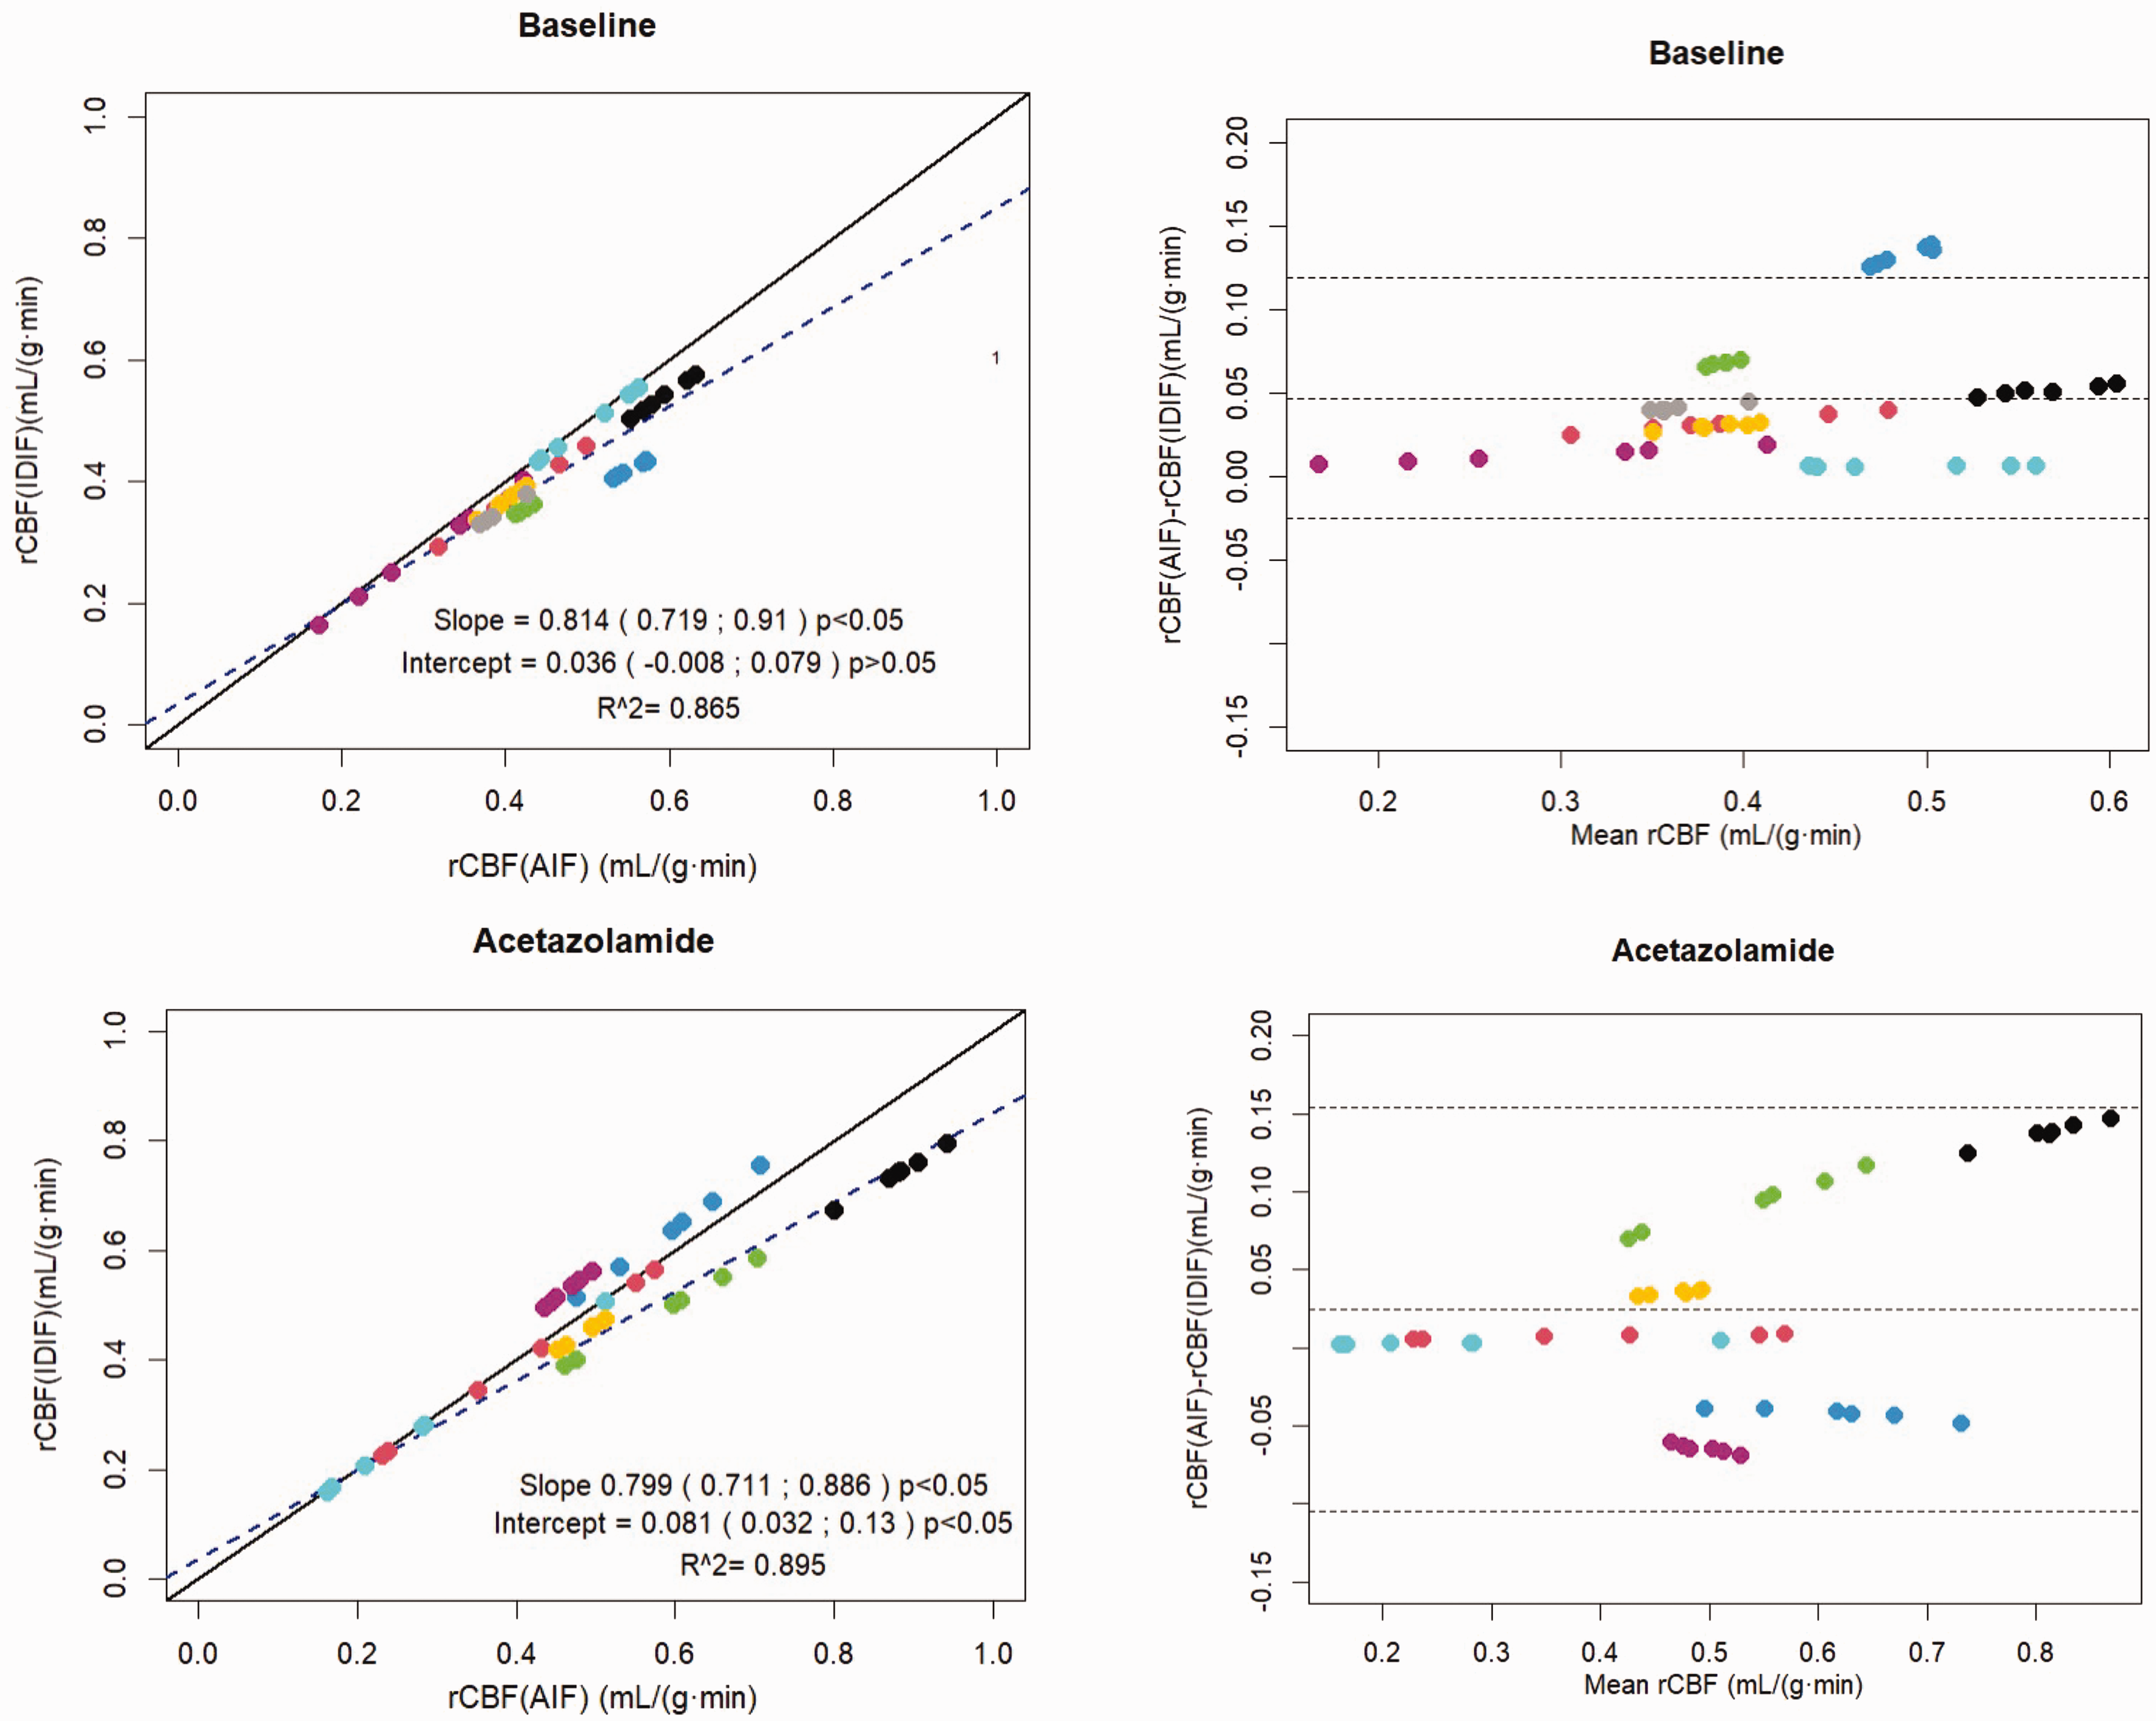
Regional cerebral perfusion estimated from AIF (rCBFAIF) versus IDIF (rCBFIDIF). Each color represents one subject. Scatter plots: The solid black line is the line of identity and the dashed blue is the regression line. Bland-Altman plots: The dashed lines are mean difference and limits of agreement (LoA).
Can the second heart scan be omitted?
One of the patients had surprisingly large difference between first and second heart scan with higher raw peak values of the stress scan (345 kBq/cm3 compared to 236 kBq/cm3) and 40% higher AUC although injected dose was only 6.5% higher (429 MBq vs. 457 MBq). As no AIF from the stress scan was available for comparison due to clotted line and redrawing the heart VOI did not change the results, we deemed the second heart scan from this subject erroneous and it was excluded from the analysis. The remaining seven subjects were included in the analysis of whether the second heart scan during acetazolamide could be omitted. In comparing brain perfusion during acetazolamide using both baseline heart and acetazolamide heart scans a mean absolute difference in rCBF of −0.020 mL/(g·min) [95% CI: −0.029; −0.012] was found corresponding to a relative difference of −3.8% [−2.5%; −5.2%]. The impact of the measured CVR was on average 0.040 (range: −0.04; 0.10). In a total of three brain regions of two of the subjects, CVR increased 0.02 or 0.04 from CVR < 0.2 to CVR > 0.2 thereby changing category from reduced CVR to normal CVR.
AIF reproducibility
Comparing the two baseline AIFs, strong correlation was found for each measurements (R2 = 0.97, slope: 1.02, CI:[1.01;1.03], p < 0.0001, intercept: −0.71, p > 0.05) and for acetazolamide AIFs (R2 = 0.98, slope: 0.99, CI:[0.98;1.00], p < 0.0001, intercept: 1.62, p < 0.05). Pearson correlations for each measurement were r = 0.98 (p < 0.05) for baseline and r = 0.99 (p < 0.05) for acetazolamide. Further, linear regressions for AUC showed strong agreement for baseline was (R2 = 0.99, slope: 1.13, CI:[0.79;1.47], p < 0.0001, intercept: −1.68, p > 0.05) and for acetazolamide (R2 = 0.98, slope: 1.06, CI:[0.82;1.28], p < 0.0001, intercept: −468.04, p > 0.05). Thus, individual AIFs after subsequent injections were consistently replicated both for baseline and acetazolamide (Figure 4).
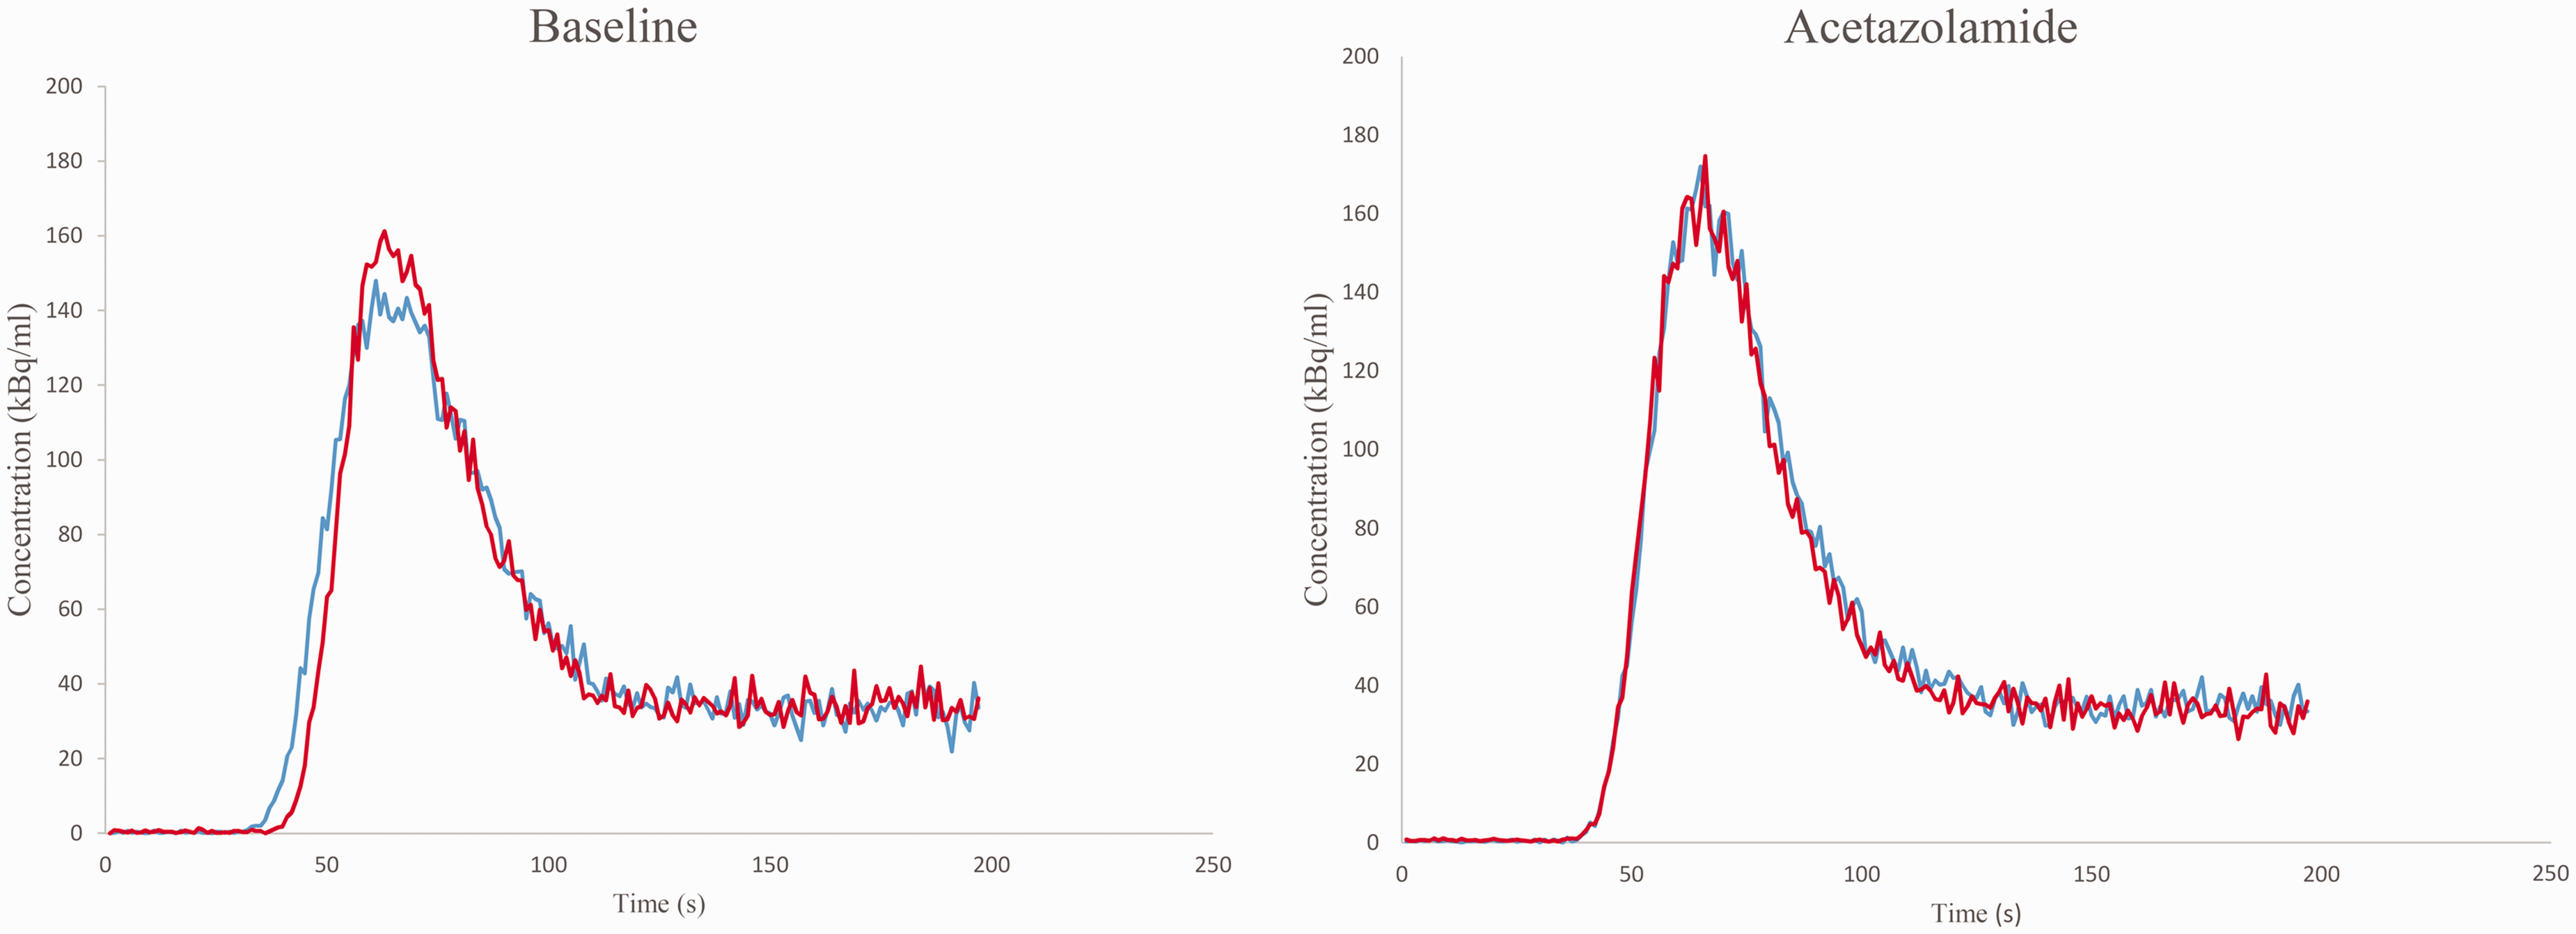
Arterial input functions (AIF) shown for a representative subject. The AIF’s are dose-corrected (scaled) to 400 MBq and the peaks synchronized. Blue and red color represents AIF’s after subsequent injections (during heart and brain scan).
Simulations
Simulations of dispersion of the input functions showed increasing bias towards underestimation up to 25% with 10 s dispersion of the time-activity-curves. (Figure 5). The bias was considerably smaller if delay correction was applied thereby seeming to compensate for the dispersion.
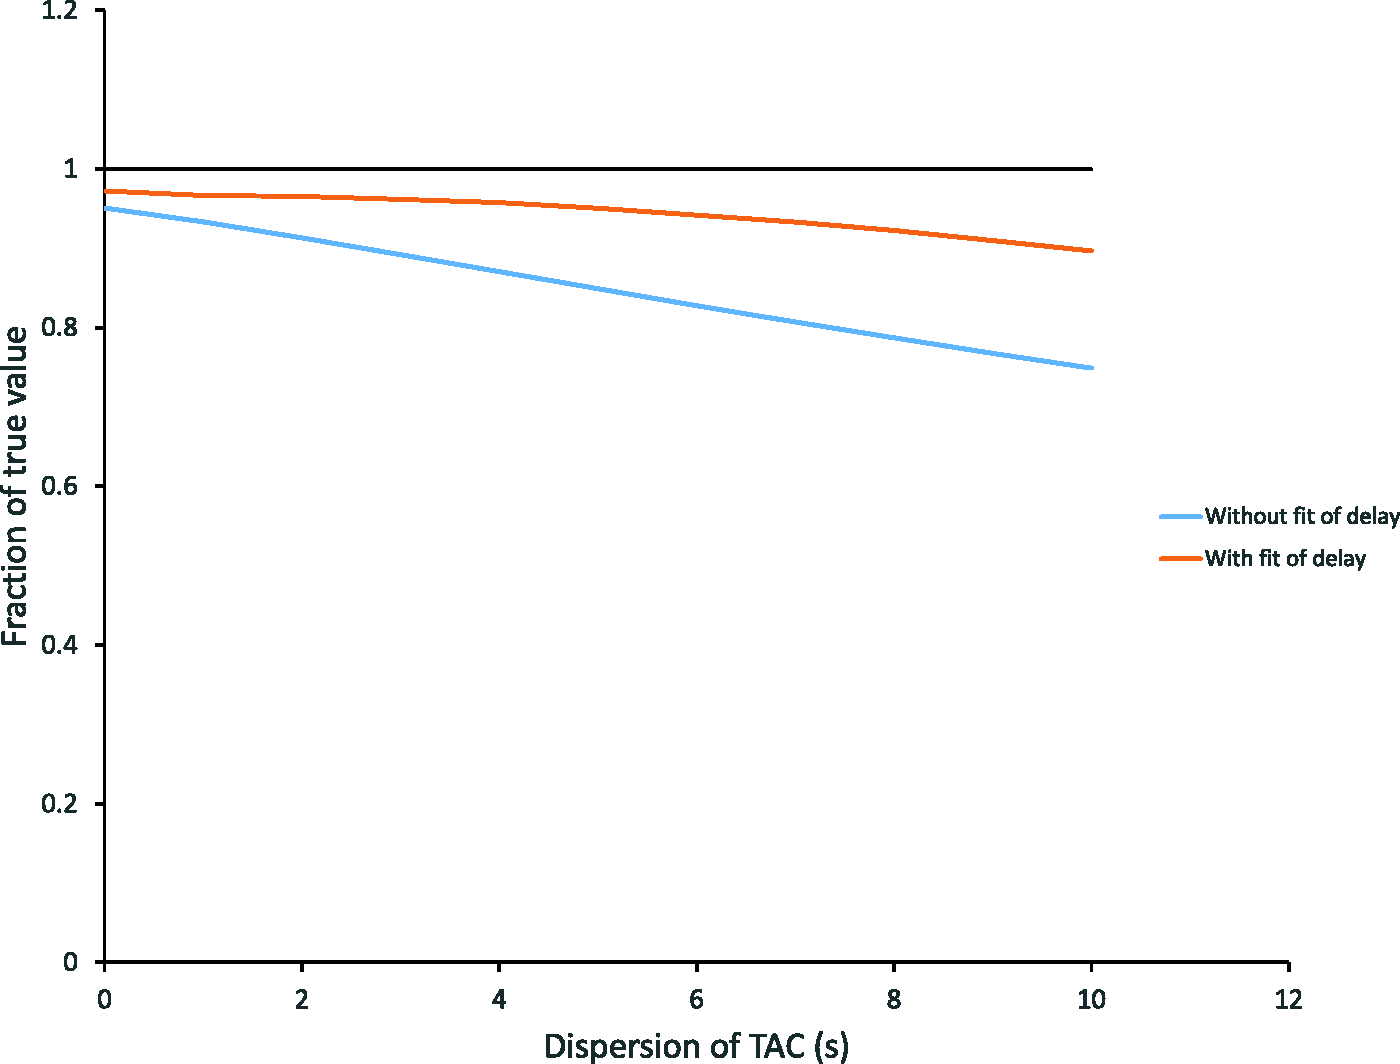
Simulation of time activity curves (TAC). Simulated TAC’s with increasing dispersion of input data and no delay. Blue and red lines are the fitted parameter K1 relative to the true K1 with and without fit of delay using a one-tissue compartment model without blood volume component. The input function is without dispersion. Note the increasing negative bias with increasing dispersion of the simulated TAC’s. In the physiological range (dispersion <4 s), the bias is <5% when fitting delay. The black line corresponds to the true value.
Discussion
We report a new and feasible dual-scan technique for non-invasive rCBF measurements using [15O]H2O PET and an additional heart scan without the need of arterial cannulation alleviating the associated risks and complications. Only a slight bias was found between the traditional AIF-based method with our novel IDIF method indicating our new technique provides a robust, practical and safer alternative. We found that IDIFs and AIFs correlated well when comparing each measurement (R2 = 0.93) and AUC (R2 = 0.93, p < 0.00001). Likewise, we found excellent correlation in the corresponding rCBF estimates comparing all scans between the two methods (R2 = 0.87) for baseline and (R2 = 0.90) for acetazolamide but with a systematic bias of 0.047 and 0.024 mL/(g·min) towards the IDIF’s for respectively baseline and acetazolamide. For further simplification of the method, our analysis shows that the second heart scan can be omitted by reusing the baseline IDIF for the brain scan during vasodilation. The simplified protocol results in a minor bias of −0.020 mL/(g·min).
The study is the first to evaluate this method for rCBF measurements, while a previous study has found the method useful for perfusion measurements of prostate. 14 IDIF’s acquired from the heart have previously been found successful in quantifying the cerebral perfusion, 10 but require special dual PET-systems, while our method can be used across all scanner systems. We have previously shown that input from the heart can be used in dynamic brain [18F]FDG PET for estimating the metabolic rate of glucose consumption using a Gjedde-Patlak plot. 12
Several other studies have proposed using IDIF to overcome challenges with AIF focusing on extraction from the intracranial blood vessels directly from the PET image. These methods suffer particularly from the internal carotid artery being at the size (4–5 mm) of the spatial resolution of most PET scanners (about 5 mm) leading to partial volume effects and image noise.8,15 This is especially true for [15O]H2O PET as 15O has a positron range of 4.14 mm, which is high compared to e.g. 18F that has a positron range of 1.03 mm. Others have suggested to use the additional anatomical information from PET/MRI to improve the partial volume correction, but they are susceptible to even minor registration errors.15 –17 In comparison, our method can be used on all PET systems. Others use models based on standardized population based AIFs15,18 but compared to our method this involves at minimum one blood sample and ignores idiosyncratic variations in scanner systems and not the least subject physiology that may be changed in patients with cardiovascular diseases. Other studies use estimation methods based on input variables from electronic health records or machine learning approaches,15,19 while our method in comparison does not require large sets of data to be collected and complex computations. Other studies have proposed simultaneous estimation of metabolite corrected AIF and kinetic parameters,7,15,20,21 which may be advantageous for tracers that need metabolite correction but has not systematically been shown to substitute AIF.7,15
As no standard way of comparing the fit of input functions exists, difficulties arise in directly comparing our method to existing ones in a quantitative way. However, we find a strong correlation of input functions (R2 > 0.9) and a small average rCBF biases of 0.046 and 0.024 mL/(g·min) (9%) which is comparable to other studies using different methods reporting R2 values in the range of 0.70–0.95 and rCBF bias of 3–18%.8,10,15 –17,22 –26
Limitations
The sample size of eight subjects was small and recruited from a single institution. The two healthy subjects were elderly (more than 80 years of age), which limits comparison to methods using only younger healthy subjects. However, the use of patients and elderly may allow for transfer to clinical use. The IDIF’s showed a small but systematically smaller AUC resulting in a systematic overestimation in the calculated rCBF. This systematic bias should be taken into account for future use. The slight bias is likely due to the use of a VOI in the lumen of the left ventricle with high levels of noise and partial volume effect. This could underestimate the peaks of the IDIF curves resulting in smaller AUC and thus larger rCBF. A caveat of using IDIF from the heart is the difference in dispersion and delay between heart and brain. However, our simulations suggests that non-dispersed IDIF may be used directly without fitting dispersion since a fit of the delay may partly compensate for dispersion of the input function during the passage to the brain. Omitting fit of dispersion results in less noise at the cost of an additional minor bias. Another caveat is the time between the heart and the brain scans, which during acetazolamide infusion may display physiological differences. However, no significant differences between AIFs during the brain and heart scans after the acetazolamide infusion was found. Our method does not use invasive arterial cannulation, but the need for an extra scan of the heart adds extra radiation exposure. However, in general [15O]H2O has a very low radiation burden 3 and as we have shown one of the additional scans of the heart can be omitted.
In conclusion, we demonstrated an alternative non-invasive approach to the traditional arterial input function (AIF) methods for assessing cerebral blood flow (rCBF) using an additional scan of the heart that can be used across all scanner platforms. At the cost of a small increase in radiation dose, our method has the advantages of being simple, precise, independent of advanced partial volume correction methods, and without the need of large amounts of additional data, complex computations, or special scanner systems e.g. LAFOV scanners.
Compliance with ethical guidelines
Ethical approval for patients was waived by the Regional Committee of Health Research Ethics for the Capital Region of Denmark (Journal no: 21069067) as the project was deemed a quality assurance project and all the procedures being performed were part of the routine care. Examination of the healthy subjects was approved by the Regional Ethics Committee of The Capital Region of Denmark (ID: H-21076058).
The study was performed according to the Helsinki declaration and written consent to participate and publication was obtained from all individuals after receiving oral and written information.
Supplemental Material
sj-pdf-1-jcb-10.1177_0271678X251313743 - Supplemental material for Non-invasive [15O]H2O PET measurements of cerebral perfusion and cerebrovascular reactivity using an additional heart scan
Supplemental material, sj-pdf-1-jcb-10.1177_0271678X251313743 for Non-invasive [15O]H2O PET measurements of cerebral perfusion and cerebrovascular reactivity using an additional heart scan by Mathias Jacobsen Bach, Mia E Larsen, Amanda O Kellberg, Alexander C Henriksen, Stefan Fuglsang, Inge Lise Rasmussen, Markus Nowak Lonsdale, Mark Lubberink and Lisbeth Marner in Journal of Cerebral Blood Flow & Metabolism
Footnotes
Funding
The Dagmar Marshall Foundation funded the study.
Data availability
The data of the present study is available from the corresponding author at reasonable request.
Acknowledgements
The Dagmar Marshall Foundation is sincerely thanked for their support. We are highly thankful to radiographer Daniel Ask Riisberg and Kathrine Marie Erenskjold for operating the GENTrace cyclotron and the scanner.
Declaration of conflicting interests
The author(s) declared no potential conflicts of interest with respect to the research, authorship, and/or publication of this article.
Authors’ contributions
MJB: Contributed to the statistical analysis and drafted the article.
MEL: Contributed to data acquisition and drafted the article.
AOK: Contributed to data acquisition.
ACH: Contributed to concept and design, data acquisition and critically revising the article.
SF: Contributed to concept and design, interpretation of data as well as data analysis.
ILR: Contributed to data acquisition and data analysis.
MNL: Contributed to concept and design, data analysis, interpretation of data and critically revising the article.
ML: Contributed to interpretation of data and critically revising the article.
LM: Concept and design, data acquisition, data analysis, interpretation of data and critically revising the article.
All authors approved the final version of the article.
Supplementary material
Supplemental material for this article is available online.
References
Supplementary Material
Please find the following supplemental material available below.
For Open Access articles published under a Creative Commons License, all supplemental material carries the same license as the article it is associated with.
For non-Open Access articles published, all supplemental material carries a non-exclusive license, and permission requests for re-use of supplemental material or any part of supplemental material shall be sent directly to the copyright owner as specified in the copyright notice associated with the article.