
Abstract
Positron emission tomography (PET) with 15O tracers provides essential information in patients with cerebral vascular disorders, such as cerebral blood flow (CBF), oxygen extraction fraction (OEF), and metabolic rate of oxygen (CMRO2). However, most of techniques require an additional C15O scan for compensating cerebral blood volume (CBV). We aimed to establish a technique to calculate all functional images only from a single dynamic PET scan, without losing accuracy or statistical certainties. The technique was an extension of previous dual-tracer autoradiography (DARG) approach, but based on the basis function method (DBFM), thus estimating all functional parametric images from a single session of dynamic scan acquired during the sequential administration of H215O and 15O2. Validity was tested on six monkeys by comparing global OEF by PET with those by arteriovenous blood sampling, and tested feasibility on young healthy subjects. The mean DBFM-derived global OEF was 0.57 ± 0.06 in monkeys, in an agreement with that by the arteriovenous method (0.54 ± 0.06). Image quality was similar and no significant differences were seen from DARG; 3.57% ± 6.44% and 3.84% ± 3.42% for CBF, and −2.79% ± 11.2% and −6.68% ± 10.5% for CMRO2. A simulation study demonstrated similar error propagation between DBFM and DARG. The DBFM method enables accurate assessment of CBF and CMRO2 without additional CBV scan within significantly shortened examination period, in clinical settings.
INTRODUCTION
Quantitative cerebral blood flow (CBF), oxygen extraction fraction (OEF), and metabolic rate of oxygen (CMRO2) images can be assessed using positron emission tomography (PET) and 15 O-labeled radiotracers. These parametric images are essential for understanding the pathophysiological status of cerebral vascular disorders, and this technique has been promoted as a clinical diagnostic tool in some countries. Parametric images have been measured via PET by administering multiple 15 O-labeled tracers,1,2 such as in the steady-state method3,4 or the three-step autoradiography method.2,5,6 The validity of the technique has been demonstrated with three-step autoradiography on healthy volunteers at rest. 7 An order of 1-hour period, however, is typically required to complete the whole study, because three independent scans are required in addition to >10-minute intervals between scans to allow for decay of the residual radioactivity of the preceding tracer. Thus, applicability is limited in clinical settings, particularly for patients with acute stroke. 8
We recently developed a novel PET method of dual-tracer autoradiography (DARG) 9 for quantitative assessment of CBF, CMRO2, OEF, and cerebral blood volume (CBV), based on sequential administration of dual tracers during a single PET scan, with additional CBV data obtained from a C 15 O scan to compensate for radioactivity from the vascular space. The method allows for shortened examination time compared with previous three-step approaches, 9 and was shown to provide quantitative OEF values that were in good agreement with those assessed by the arteriovenous oxygen difference in normal monkeys over a wide physiological range, suggesting the validity of quantitative functional values obtained by this method. Of the importance is that the noise property in the calculated functional images by this method is same as that by the three-step autoradiography. A limitation of this method is however attributed to the need for additional C 15 O scan. An assumption of the fixed fractionations of arterial and venous vasculature components, as has been done in most of other methods could also cause systematic errors in pathological conditions such as the ischemia, which most likely cause dilatation of vasculature and/or the arteriovenous malformation.
In the present study, we developed a formula that eliminates the need for the CBV information, which has been required in the previous DARG approach. This computational refinement for the dual-tracer approach has been done using the basis function method (DBFM). Attention was made so as to minimize the systematic errors attributed to the assumption of fixing the arterial- and venous-fractionations. The technique would also be advantageous for significantly shortening the duration of the total clinical examination. The validity of the present method, in terms of quantitative accuracy and quality of generated images, was tested using the data obtained from anesthetized monkeys and young normal volunteers.
THEORY
The present formula was developed to compute CBF, CMRO2, and CBV simultaneously, thus eliminating the need for additional scan for CBV assessment. The distributions of tracer in the vascular space (VAW (mL/g) for water and V0O (mL/g) for oxygen components) were estimated from dynamic image data acquired during sequential administration of H2
15
O and
15
O2. The kinetics for both
15
O2 and H2
15
O are expressed using the single-tissue compartment model
2
as:
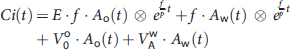
The first two terms on the right side in equation (1) have nonlinear relationship with f, and we formulated two basis functions
11
to calculate parametric images from the dynamic data. The corresponding basis functions were as follows:

For the physiologically reasonable range of f, that is, 0 < f < 2.0 mL per minute per gram, 200 discrete values for f were given. For a given value of f, three values of E, V0O, and VAW were obtained using the standard linear least squares optimization technique. The oprimized f value was determined from the 200 discrete values, so that the residual sum of squares between left- and right-hand terms in equation (3) became minimum, thus a unique set of optimized parameters for f, E, V0O, and VAW could be obtained. Metabolic rate of oxygen is then calculated from the obtained f, E, and the arterial oxygen concentration. The present formula can be applied to either of the two procedures: H2 15 O injection (or C 15 O2 inhalation) followed by 15 O2 inhalation (the H2 15 O– 15 O2 protocol), or 15 O2 inhalation followed by H2 15 O injection (or C 15 O2 inhalation) (the 15 O2–H2 15 O protocol).
MATERIALS AND METHODS
The validity of the present method was first evaluated using the data obtained from a series of PET scanning on anesthetized monkeys, in which the global OEF values obtained using this approach were compared with those derived using the catheter-based method for measuring the arteriovenous difference (A–V difference) of oxygen contents. Second, image consistency was evaluated by comparing the quantitative values of regional CBF and CMRO2 for young normal volunteers derived by the present DBFM and those by the previously proposed DARG methods. Third, the error sensitivity of the present method was evaluated by a simulation study, and was referred to the results for the DARG technique.
SUBJECTS
The subjects consisted of two groups, namely, six normal monkeys of macaca fascicularris under anesthesia and seven young normal volunteers. All monkeys were males with a mean body weight of 5.2 ± 0.8 kg and ages ranging from 3 to 4 years. Animals were maintained and handled in accordance with the Human Care and Use of Laboratory Animals guidelines (Rockville, National Institute of Health/Office for Protection from Research Risks, 1996). The study was approved by the local Committee for Laboratory Animal Welfare, National Cardiovascular Center, Osaka, Japan. The protocol also followed the Guidelines for Animal Experimentation of the National Cerebral and Cardiovascular Center, Osaka, Japan.
All normal human subjects were males with a mean age of 25.3 ± 2.4 years and mean body weight of 64.2 ± 6.8 kg. None had symptoms at the time of PET examination, or histories of cerebral or other relevant diseases. All subjects gave written informed consent, approved by the ethics committee of the National Cerebral and Cardiovascular Center, Osaka, Japan.
Positron Emission Tomography Experiments (Animal)
Details regarding the primate animal study have been previously reported. 9 Briefly, anesthesia was induced with ketamine (10 mg/kg, intramuscularly) and maintained during the experiment using intravenous propofol (4 mg/kg h) and vecuronium (0.05/mg kg h). Animals were intubated and their respiration was controlled by an anesthetic ventilator (Cato, Drager, Germany). The PET scanner used was the ECAT HR (Siemens-CTI, Knoxville, TN, USA), installed in the animal PET laboratory of the National Cerebral and Cardiovascular Research Center. Positron emission tomography scanning was performed in 2D mode. After a 900-second transmission scan, a dynamic scan was started following the inhalation of C 15 O. After 10 minutes, a 6-minute dynamic PET scan was performed during sequential administration of 15 O2 (2,200 MBq) and H2 15 O (370 MBq) for 3 minutes each. After 10 minutes, another order of scan, namely, H2 15 O followed by 15 O2 administration scan was performed. The administration order, either H2 15 O– 15 O2 or 15 O2–H2 15 O, was randomized across subjects. Arterial blood was withdrawn continuously from the femoral artery through a catheter (0.6-mm inner diameter) using a syringe pump (Harvard Apparatus, Holliston, MA, USA, model 55-2309) with a withdraw speed of 0.45 mL/min (2.7 mL in total) and the blood radioactivity concentration was measured with a continuous input function monitor system made of GSO scintillation crystals. 12 Arterial and sinus blood samples of 0.2 mL each were drawn simultaneously during each scan. The sinus blood was sampled through a 3-F catheter, which was introduced via the femoral vein to the cerebral sinus using a high-resolution digital X-ray imaging system (GE Medical System, Waukesha, WI, USA). To avoid mixing with venous blood draining from extracranial tissues, the tip of the catheter was carefully placed at the angle of the cerebral sigmoid and transverse sinuses, and its position was confirmed at the conclusion of each PET protocol. Their oxygen contents were measured to obtain the global OEF (gOEFA–V).9,13
In three of the six animals, A–V sampling was performed during the PET scan with the 15 O2–H2 15 O protocol at normocapnia (PaCO2 ≅ 40 mm Hg) and also while the respiratory rate was sequentially adjusted to achieve hypocapnia (PaCO2 < 33 mm Hg), mild hypercapnia (45 < PaCO2 < 50 mm Hg), and deep hypercapnia (PaCO2 > 50 mm Hg). At least 30 minutes were allotted to reach a steady-state PaCO2, after which the 15 O2–H2 15 O PET scan was initiated.
Positron Emission Tomography Experiments (Young Normal Volunteer)
Young normal volunteers were studied at the Radiology Department of the National Cerebral and Cardiovascular Research Center. Young, healthy volunteer subjects were scanned with an ECAT 47 scanner (Siemens-CTI). The scanning was carried out in 2D mode. After a transmission scan, a static scan was started at 2 minutes after the end of 4-minute inhalation of 3,000 MBq of C 15 O. After a pause of 10 minutes to permit radioactive decay, two sets of dynamic scans of 540 and 510 seconds were carried out, first during sequential inhalation of C 15 O2 (3,000 MBq) and 15 O2 (4,500 MBq), and second an inhalation of 15 O2 (4,500 MBq) followed by intravenous H2 15 O (1,100 MBq), respectively. Since the 15 O label in C 15 O2 is rapidly transferred to the water pool in the lung capillary bed, 14 the C 15 O2 inhalation is considered essentially identical to the intravenous administration of H2 15 O. Thus, C 15 O2– 15 O2 procedure is noted as H2 15 O (C 15 O2)– 15 O2 protocol in this article.
Arterial blood was continuously drawn from the brachial artery using a catheter (0.5-mm inner diameter) and syringe pump (Harvard Apparatus, model 901) at a speed of 2.0 mL/min during the PET scan. The total blood withdrawn was ~30 mL. The blood radioactivity concentration was measured using the GSO input function monitor system. 12
Data Processing
Dynamic sinogram data were corrected for dead time in each frame and for detector normalization. Tomographic images were reconstructed using the filtered back projection method with 4- and 7-mm Gaussian filtering for monkeys and human subjects, respectively. Attenuation correction was applied using transmission data. Scatter correction was also applied by means of the deconvolution scatter function technique. 15 Reconstructed images, with a matrix size of 128 × 128 × 47 and a voxel size of 1.1 mm × 1.1 mm × 3.4 mm for monkeys and 1.8 mm × 1.8 mm × 3.4 mm for normal human subjects, were transferred to a LINUX computer for further analysis using in-house programs.
Measured arterial blood time–activity curves (TACs) were normalized to become consistent to PET images, and were also corrected for dispersion (τ = 3 and 14 seconds for monkeys and humans, respectively). 16 After correcting for delay,9,17 the blood curves were separated into 15 O2 (AO) and H2 15 O (AW) contents as described previously,18,19 in which the recirculation water, that is, the arterial H2 15 O concentration was estimated using manually sampled at nine points and plasma separated activity concentration in the monkey data (details are presented in 18 ) and for human data according to a physiological model validated previously with fixing rate constant values as: k = 0.13 per minute (production rate of recirculating water), Δt = 20 seconds (delayed appearance time of recirculating water), kw = 0.38 per minute (forward diffusion rate of recirculating water to body interstitial space) and pw = 1.38 (kw/k2, where is k2 a backward diffusion rate of recirculating water). 18
Cerebral blood flow, OEF, and CMRO2 images as well as those for V0O and V0W were calculated according to the DBFM formula described above, using reconstructed images and the obtained input functions, and the hemoglobin concentration and saturation of oxygen in the arterial blood. Additionally applying CBV data from C 15 O scan data, CBF, OEF, and CMRO2 images were also generated using the DARG formula. 9 With DBFM, blood volume was estimated as V0O, and the obtained images were converted to CBV images as: CBV = RHct (1–E · Fv)/V0O 2, where RHct (= 0.85) 20 is the peripheral-to-central hematocrit ratio and Fv (= 0.835) 2 is the effective venous fraction. Images without applying physical decay correction were applied to both DBFM and DARG calculations.
Data Analysis
Regions of interest (ROIs) were drawn on CBF images obtained from experiment on monkeys to cover the whole brain. These ROIs were then transferred to the OEF and CMRO2 functional images obtained using the DBFM and DARG methods. Quantitative CBF, OEF, and CMRO2 values generated from DBFM were then compared with those from DARG. Also, OEF values obtained from DBFM were compared with those using the A–V sampling technique (OEFA–V) using Bland–Altman plots.
In young normal volunteers, circular ROIs of 6-mm diameter were placed bilaterally on the temporal, frontal, parietal, occipital, and cerebellar, brain stem, caudate, lentiform, thalamus, and central semioval regions, in which attention was made to avoid the region with large CBV such as the sinus region. Values for CBF, and CMRO2 in the same ROIs were summarized for the cortical gray matter, deep gray matter, cerebellum, and white matter regions, and were compared between DBFM and DARG using Bland–Altman plots.
The N-index, which denotes the noise level of parametric images, 21 was obtained from the standard deviation of an image's spatial values, which was derived by subtracting two statistically independent and physiologically equivalent images. This calculation was carried out for CBF, OEF, and CMRO2 from young normal volunteers using even- and odd-numbered frames, and the obtained N-index values were compared between the DARG and DBFM formulae.
All data are presented as mean values ± 1 s.d. Pearson's correlation analysis and linear regression analysis were used to evaluate relationships between the two CBF values. P < 0.05 was considered statistically significant.
Simulation
Error propagation was evaluated for three error sources, namely: effects of the imperfect delay adjustment, 17 by shifting time in an input function from −4 to 4 seconds, where a positive error represents an overcorrection of delay time; errors in dispersion correction in the input function, 16 by shifting the time constant from −4 to 4 seconds, where a negative error represents undercorrection, as described previously;9,22 and errors in the assumed blood/tissue partition coefficient (p),9,10 by varying p from 0.7 to 0.9 mL/g. 10
The input function for this simulation study was defined based on typical arterial TACs obtained from a human study with water (Aw) and also with oxygen (Ao), 23 and by adding the Aw and Ao with a time lag of 3 minutes between the administrations of H2 15 O– 15 O2 and 15 O2–H2 15 O. Applying the kinetic formulation of equation (1), tissue TACs were generated for a ‘normal’ (CBF = 0.50 mL per gram per minute, OEF = 0.4, and CBV = 0.04 mL/g), ‘ischemic’ (CBF = 0.30 mL per gram per minute, OEF = 0.6, and CBV = 0.06 mL/g), ‘hyperperfusion’ (CBF = 0.70 mL per gram per minute, OEF = 0.3, and CBV = 0.04 mL/g), and ‘diaschisis’ (CBF = 0.20 mL per gram per minute, OEF = 0.4, and CBV = 0.04 mL/g) conditions. 9 Values of CBF, OEF, and CMRO2 were then calculated using the true input function and these TACs, by assuming p = 0.8 mL/g. Errors in calculated functional values were then plotted as a function of the percentage differences of the assumed values for delay, dispersion, and the partition coefficient.
Additional simulation was carried out to evaluate errors in the estimation of recirculating H2 15 O in the arterial blood. Arterial input functions were generated by changing the rate constant (k) that corresponds to the whole body oxygen metabolism, and the delay (Δt) by ± 10%, from the fixed value (i.e., k = 0.13 per minute and Δt = 20 seconds), and regional tissue TACs were calculated according to the equation (1), by assuming a ‘normal’ condition. Cerebral blood flow and CMRO2 values were calculated according to the procedure mentioned above, and the %errors were estimated.
RESULTS
The present DBFM as well as DARG programs successfully calculated functional images of CBF, OEF, CMRO2, and CBV for PET data on both monkeys and young normal volunteers. The computation time for parametric images was ~30 seconds using a standard PC installed with GNU/Linux (fc16.x86_64 64 bit, CUP:Intel Core i7 3.07 GHz, Memory: 16 GB).
Quantitative values for whole brain in monkeys were 0.32 ± 0.11 and 0.27 ± 0.09 mL per gram per minute in CBF for DARG and DBFM, respectively, 0.56 ± 0.06 and 0.57 ± 0.06 in OEF for DARG and DBFM, respectively, and 0.029 ± 0.004 and 0.026 ± 0.004 ml per gram per minute in CMRO2 for DARG and DBFM, respectively. The OEF value by the A–V method was 0.54 ± 0.06. The paired t-test did not show any significant differences in these values between DARG and DBFM for either order, that is, H2 15 O– 15 O2 and 15 O2–H2 15 O (P > 0.05, n = 6). Also, there were no significant differences in OEF between the PET and the A–V methods, for either order (P > 0.05, n = 6). During normocapnia, the PaCO2, PaO2, SaO2, and hemoglobin values were 38.9 ± 1.4, 119 ± 12 mm Hg, 97.3% ± 1.2%, and 13.6 ± 1.0 g/dL, respectively. All these values were considered within the normal range.
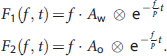
Figure 1 shows the Bland–Altman plot of OEF as estimated by the DBFM and the A–V method obtained during PaCO2 variation. The regression line obtained was: OEF = 0.99 OEFA–V–0.01 (r = 0.96, P < 0.001, n = 12). The intercept was not significantly different from zero (P > 0.05), and the slope of the line was close to unity.
Bland–Altman plots of oxygen extraction fraction (OEF) comparing arteriovenous difference (gOEF(A–V)) and dual-tracer basis function method (DBFM) (gOEF(PET)). Solid and broken lines show mean difference and its respective 2 s.d., respectively. Mean ± s.d. values are −0.014 ± 0.038. The regression analysis exhibited a significant positive correlation with a slope close to unity (y = 0.99 x + 0.01, r = 0.96, number of plots = 12). DBFM was performed with an administration order of O2–H2O. PET, positron emission tomography.
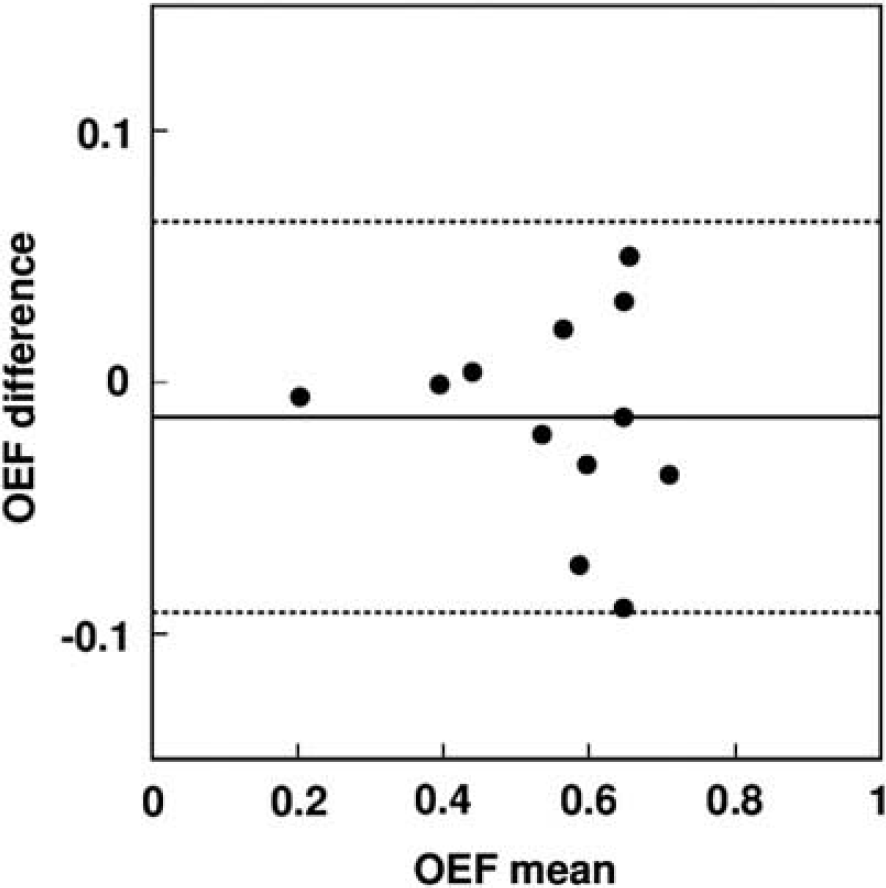
Figure 2 shows the Bland–Altman plots of regional CBF and CMRO2 values as estimated by DARG and DBFM for young normal volunteers. The plots did not show significant differences between DBFM and DARG. Cerebral blood flow or CMRO2-dependent changes have not been seen in the plot. Differences in CBF were 3.57% ± 6.44% and 3.84% ± 3.42% for the H2 15 O (C 15 O2)– 15 O2 and 15 O2–H2 15 O protocols, respectively, and those in CMRO2 were −2.79% ± 11.2% and −6.68% ± 10.5% in the H2 15 O (C 15 O2)– 15 O2 and 15 O2–H2 15 O protocols, respectively. Results of the Pearson's regression analysis for CBF were: CBFBFM = 1.07 CBFDARG–0.015 mL per minute per gram (r = 0.99, P < 0.001) and CBFBFM = 1.04 CBFDARG–0.003 mL per minute per gram (r = 0.99, P < 0.001), and those for CMRO2 were: CMRO2 BFM = 0.93 CMRO2 DARG–0.0022 mL per minute per gram (r = 0.93, P < 0.001) and CMRO2 BFM = 0.92 CMRO2 DARG–0.0007 mL per minute per gram (r = 0.95, P < 0.001) corresponding to the H2 15 O (C 15 O2)– 15 O2 and 15 O2–H2 15 O protocols, respectively. The mean and s.d. values for CBF, OEF, CMRO2, and CBV values are summarized in Table 1. The paired t-test showed no significant difference in CBF between the DBFM and DARG methods for either order. Significant difference was seen in CMRO2 and showed smaller values in DBFM with the 15 O2–H2 15 O protocol but not for the H2 15 O (C 15 O2)– 15 O2 protocol. The CBV values by DBFM were essentially within the same order of those obtained by the conventional C 15 O blood volume scan (noted as DARG in Table 1), but showed significant differences in some regions. No significant difference was seen in V0O-derived CBV values between the H2 15 O (C 15 O2)– 15 O2 and 15 O2–H2 15 O protocols.
CBF, OEF, and CMRO2 values in normal human subjects (n=7) in cortical gray matter, deep gray matter, cerebellum, and white matter regions calculated using DARG and DBFM
CBF, cerebral blood flow; CBV, cerebral blood volume; CMRO2, metabolic rate of oxygen; DARG, dual-tracer autoradiography; DBFM, dual-tracer basis function method; OEF, oxygen extraction fraction.
n=7; values are presented as mean±s.d.; ∗significant difference (P<0.05) between DARG and DBFM; CBF by the DBFM method was calculated from V0O images as CBV=RHct (1−E·Fv)/V0O.
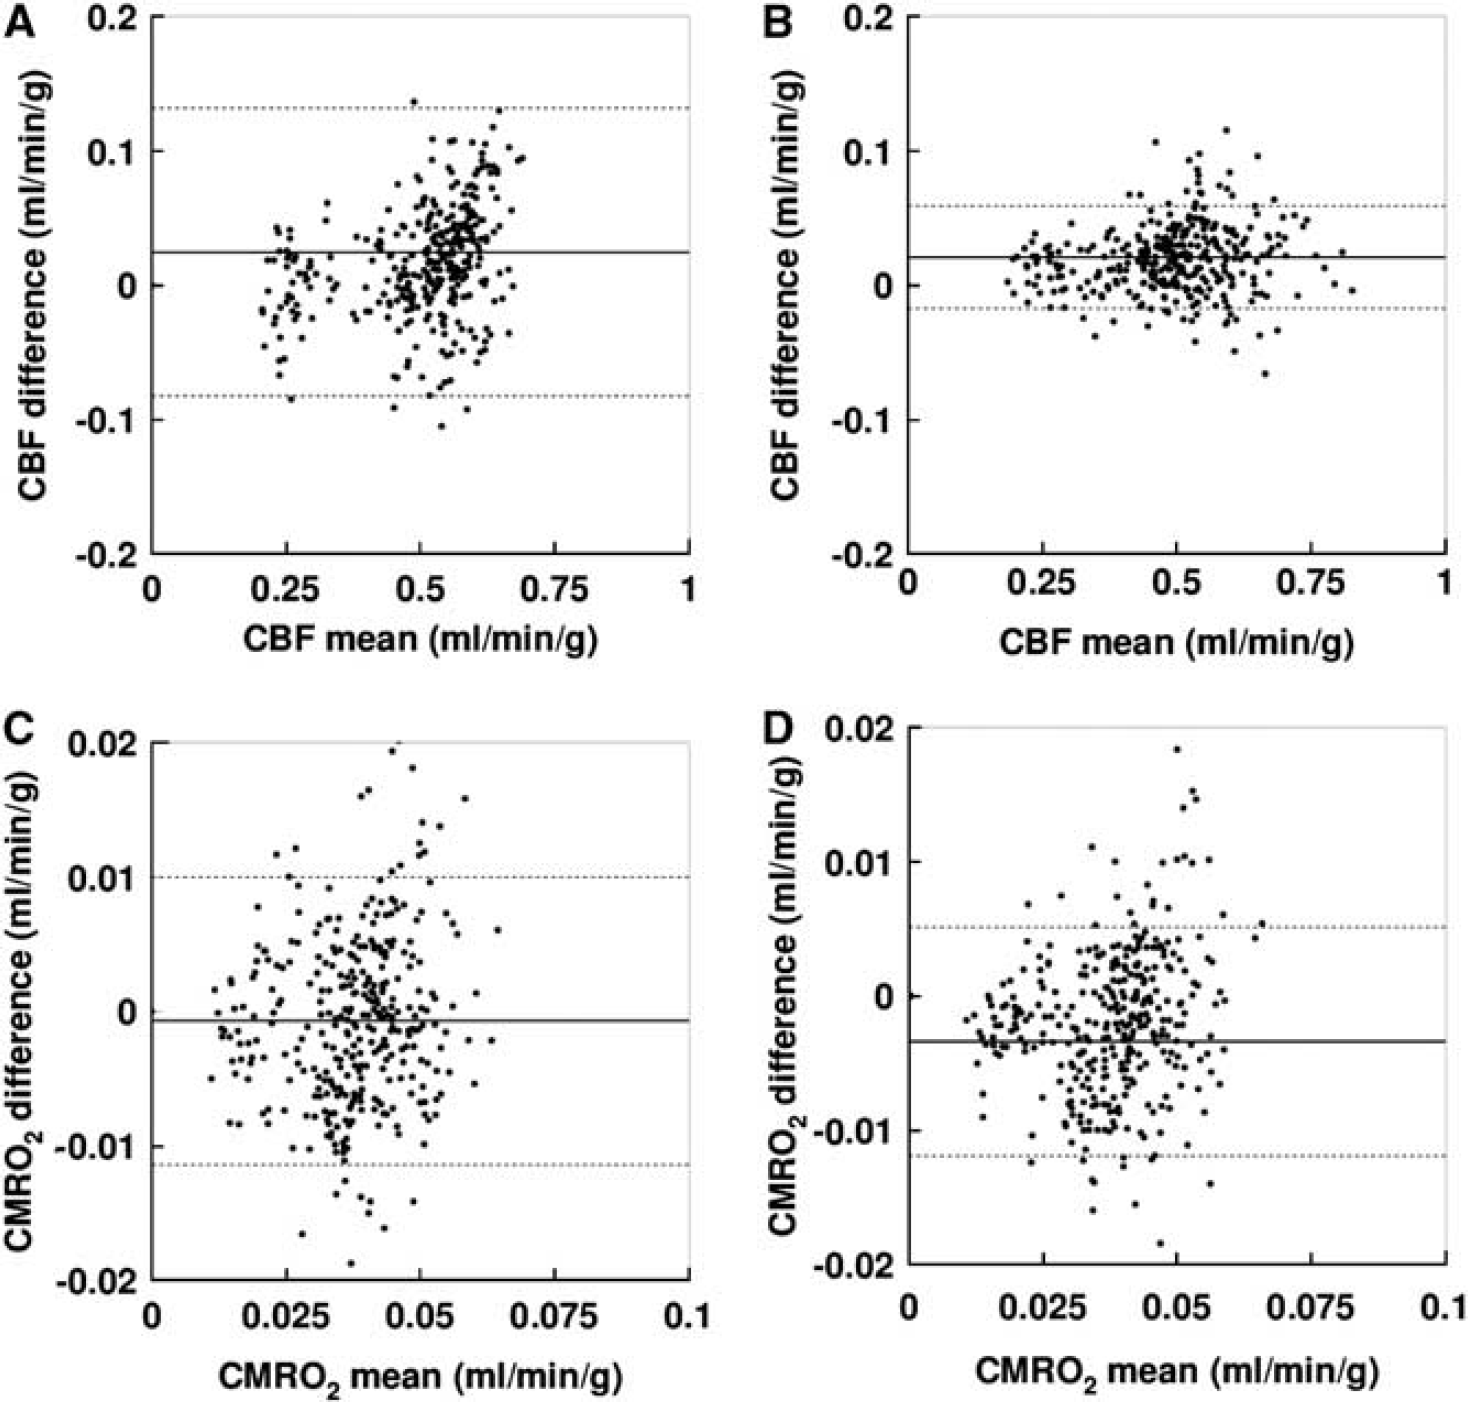
Bland–Altman plots of cerebral blood flow (CBF) (upper:
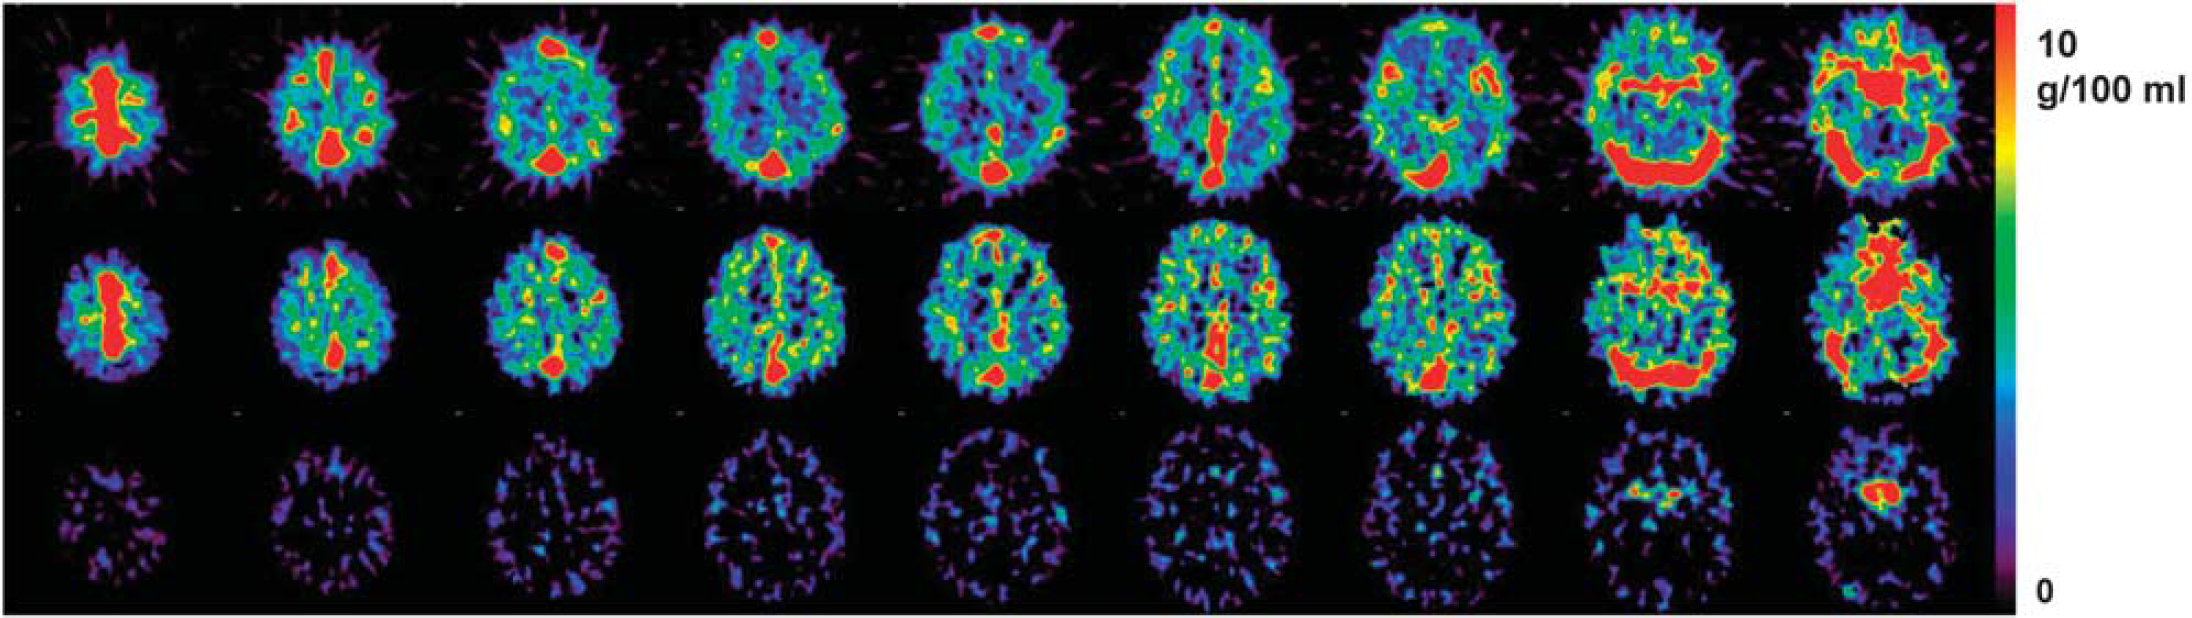
Figure 3 shows a representative comparison of CBF, OEF, and CMRO2 images generated by DBFM and DARG from a young normal volunteer. The parametric images generated by DBFM were of comparable quality to those obtained using DARG. The CBV images obtained by C 15 O scanning as well as those calculated from V0O and V0W for a 15 O2–H2 15 O protocol on a typical young healthy volunteer are compared in Figure 4. CBV images from V0O showed similar distribution to those produced using the C 15 O scan, thought the images were noisier. Cerebral blood volume images calculated from VAW, on the other hand clearly demonstrate the structure only the internal carotid and middle cerebral arteries, but values are small and in a noise level in other areas.
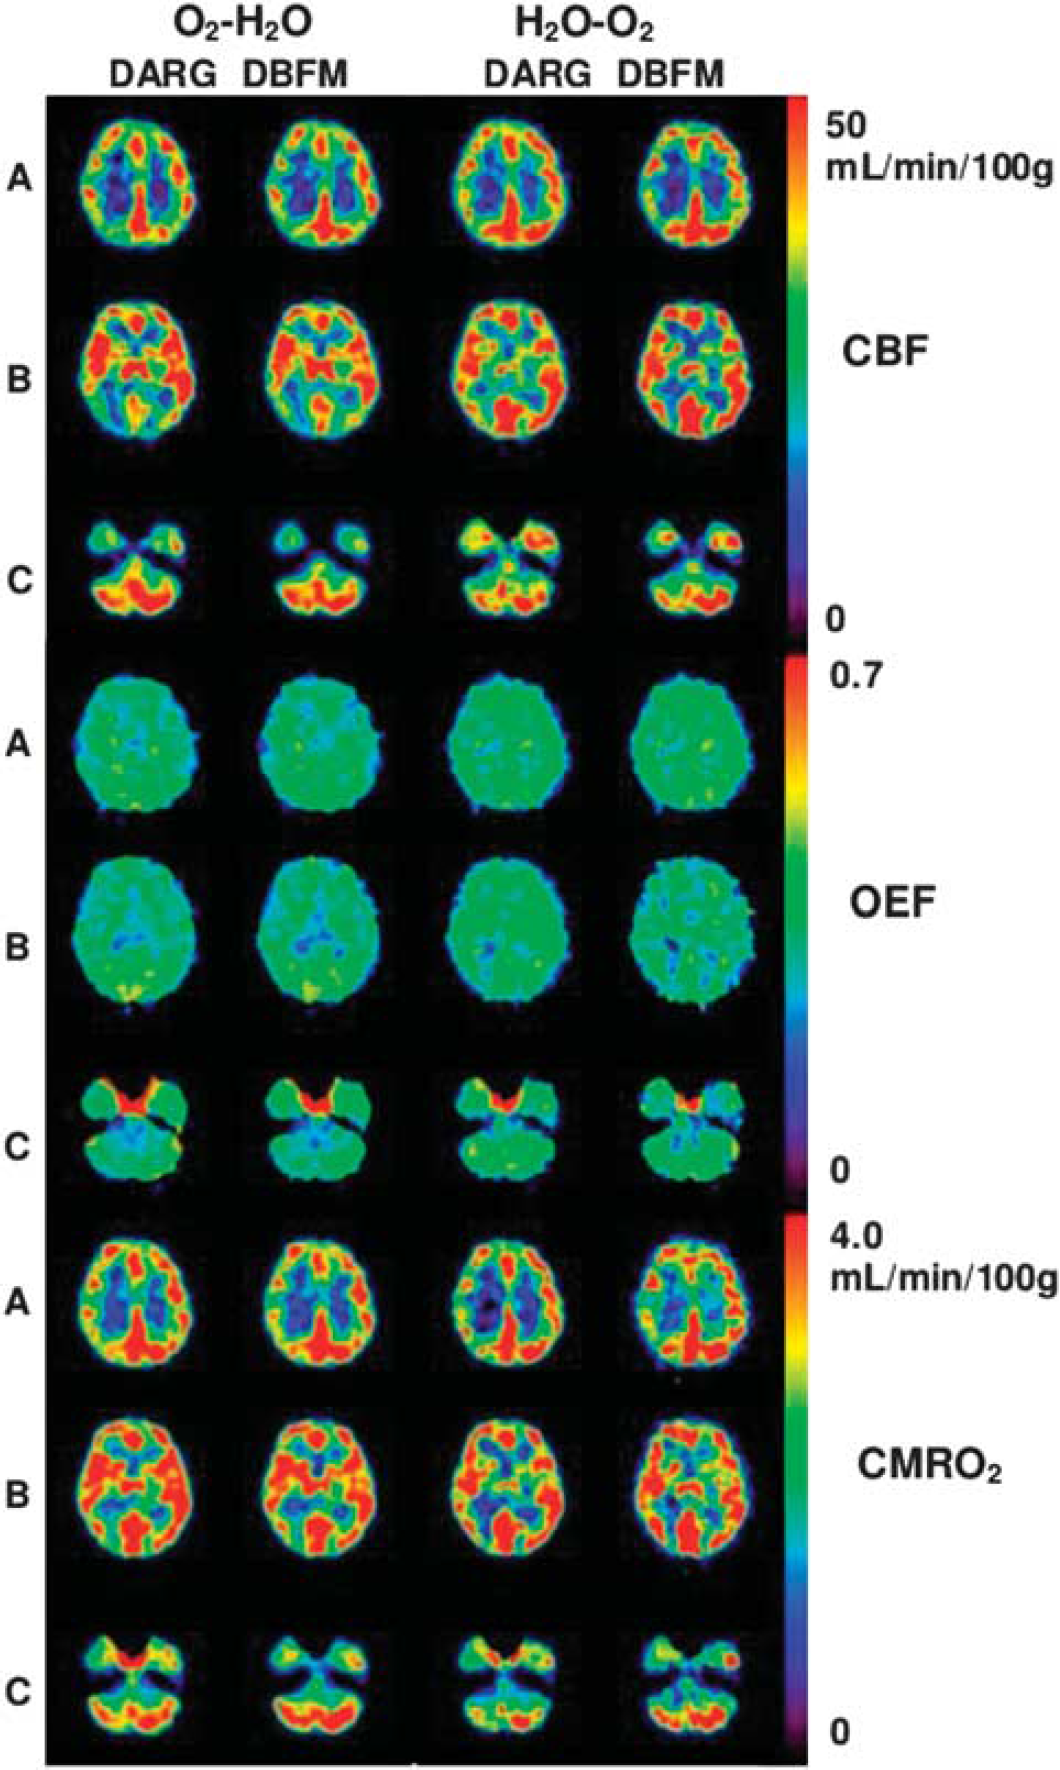
Representative view of cerebral blood flow (CBF), oxygen extraction fraction (OEF), and metabolic rate of oxygen (CMRO2) images for a normal subject using dual-tracer autoradiography (DARG) and dual-tracer basis function (DBFM) techniques with H2O–O2 and O2–H2O modes. Axial images are sectioned at (A) parietal level, (B) basal ganglia level, and (C) cerebellar level.
Representative view of cerebral blood volume (CBV) (upper and middle) and VAW lower) images in a normal subject, derived by CO scan (upper) and dual-tracer basis function (DBFM) (O2–H2O) (middle and lower) methods.
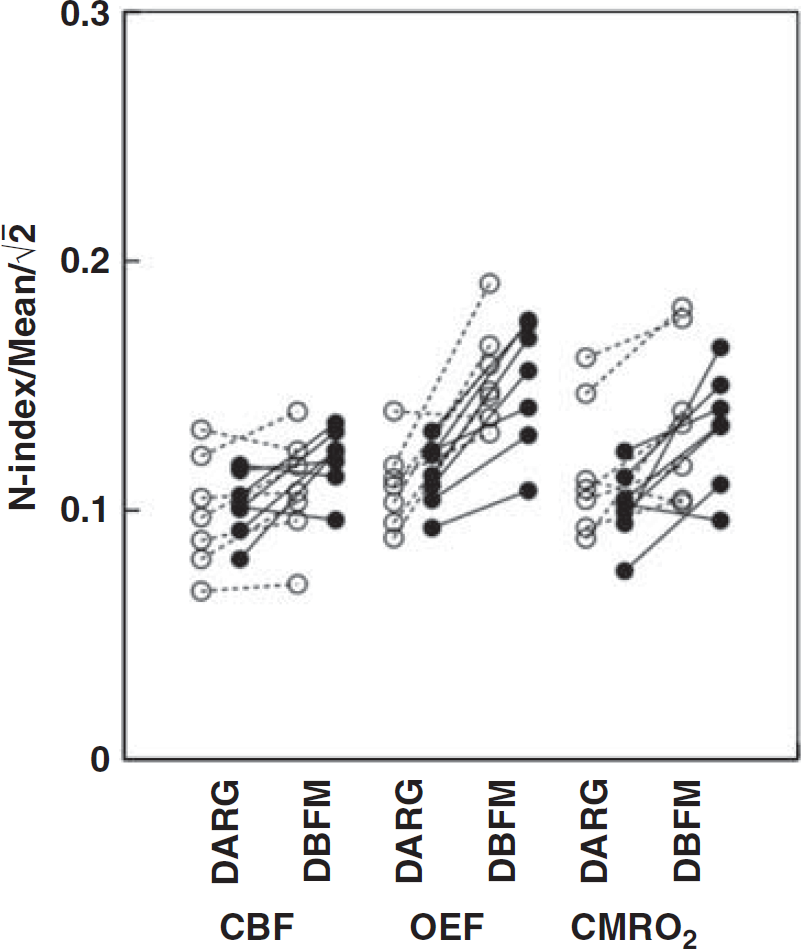
A comparison of image quality, as defined as the N-index divided by the mean value of each of CBF, OEF, and CMRO2 is given in Figure 5. Values were slightly but significantly greater with DBFM compared with DARG, except CBF assessed by the 15 O2–H2 15 O protocol, which did not show significant difference between DBFM and DARG.
Comparison of noise levels between dual-tracer autoradiography (DARG) and dual-tracer basis function (DBFM) for cerebral blood flow (CBF), oxygen extraction fraction (OEF), and metabolic rate of oxygen (CMRO2) images by means of N-index. White and black circles correspond to values from the H2 15 O (C 15 O2)–O2 and 15 O2–H2 15 O protocols, respectively. The paired t-test shows significant differences in all functional parameters for both protocols between DARG and DBFM except CBF by the 15 O2–H2 15 O protocol.
Results of the simulation study for the ‘normal’ condition are shown in Figure 6. Error sensitivity to errors in delay time, the dispersion time constant, and the partition coefficient value were different, but showed the same tendency between the H2 15 O(C 15 O2)– 15 O2 and 15 O2–H2 15 O protocols for both DARG and DBFM. The magnitude of errors in the calculated functional parameters are within a range of <5% for ± 2 seconds errors in the delay, for ± 2 seconds errors in the dispersion, and for 0.75 to 0.85 mL/g errors in the partition coefficient. The error propergation from each error source to the functional parameters are almost the same in the ‘hyperperfusion’ condition, but significant magnification was seen in the ‘ischemic’ condition, and was 1.1 to 1.2 times for CBF, 1.6 to 2.0 for OEF, and 1.4 to 1.6 for CMRO2. For the ‘diaschisis’ condition, the magnification factors were only 0.1 to 0.5 times for all CBF, OEF, and CMRO2 parameters. Regarding the errors in the recirculating H2 15 O estimation, a change in the oxygen production rate (k) by ± 10% resulted in errors of ± 2.5% and 2.1% in CBF and CMRO2. A change of the delay by ± 10% resulted in errors of 3.0% and 1.2%, respectively.
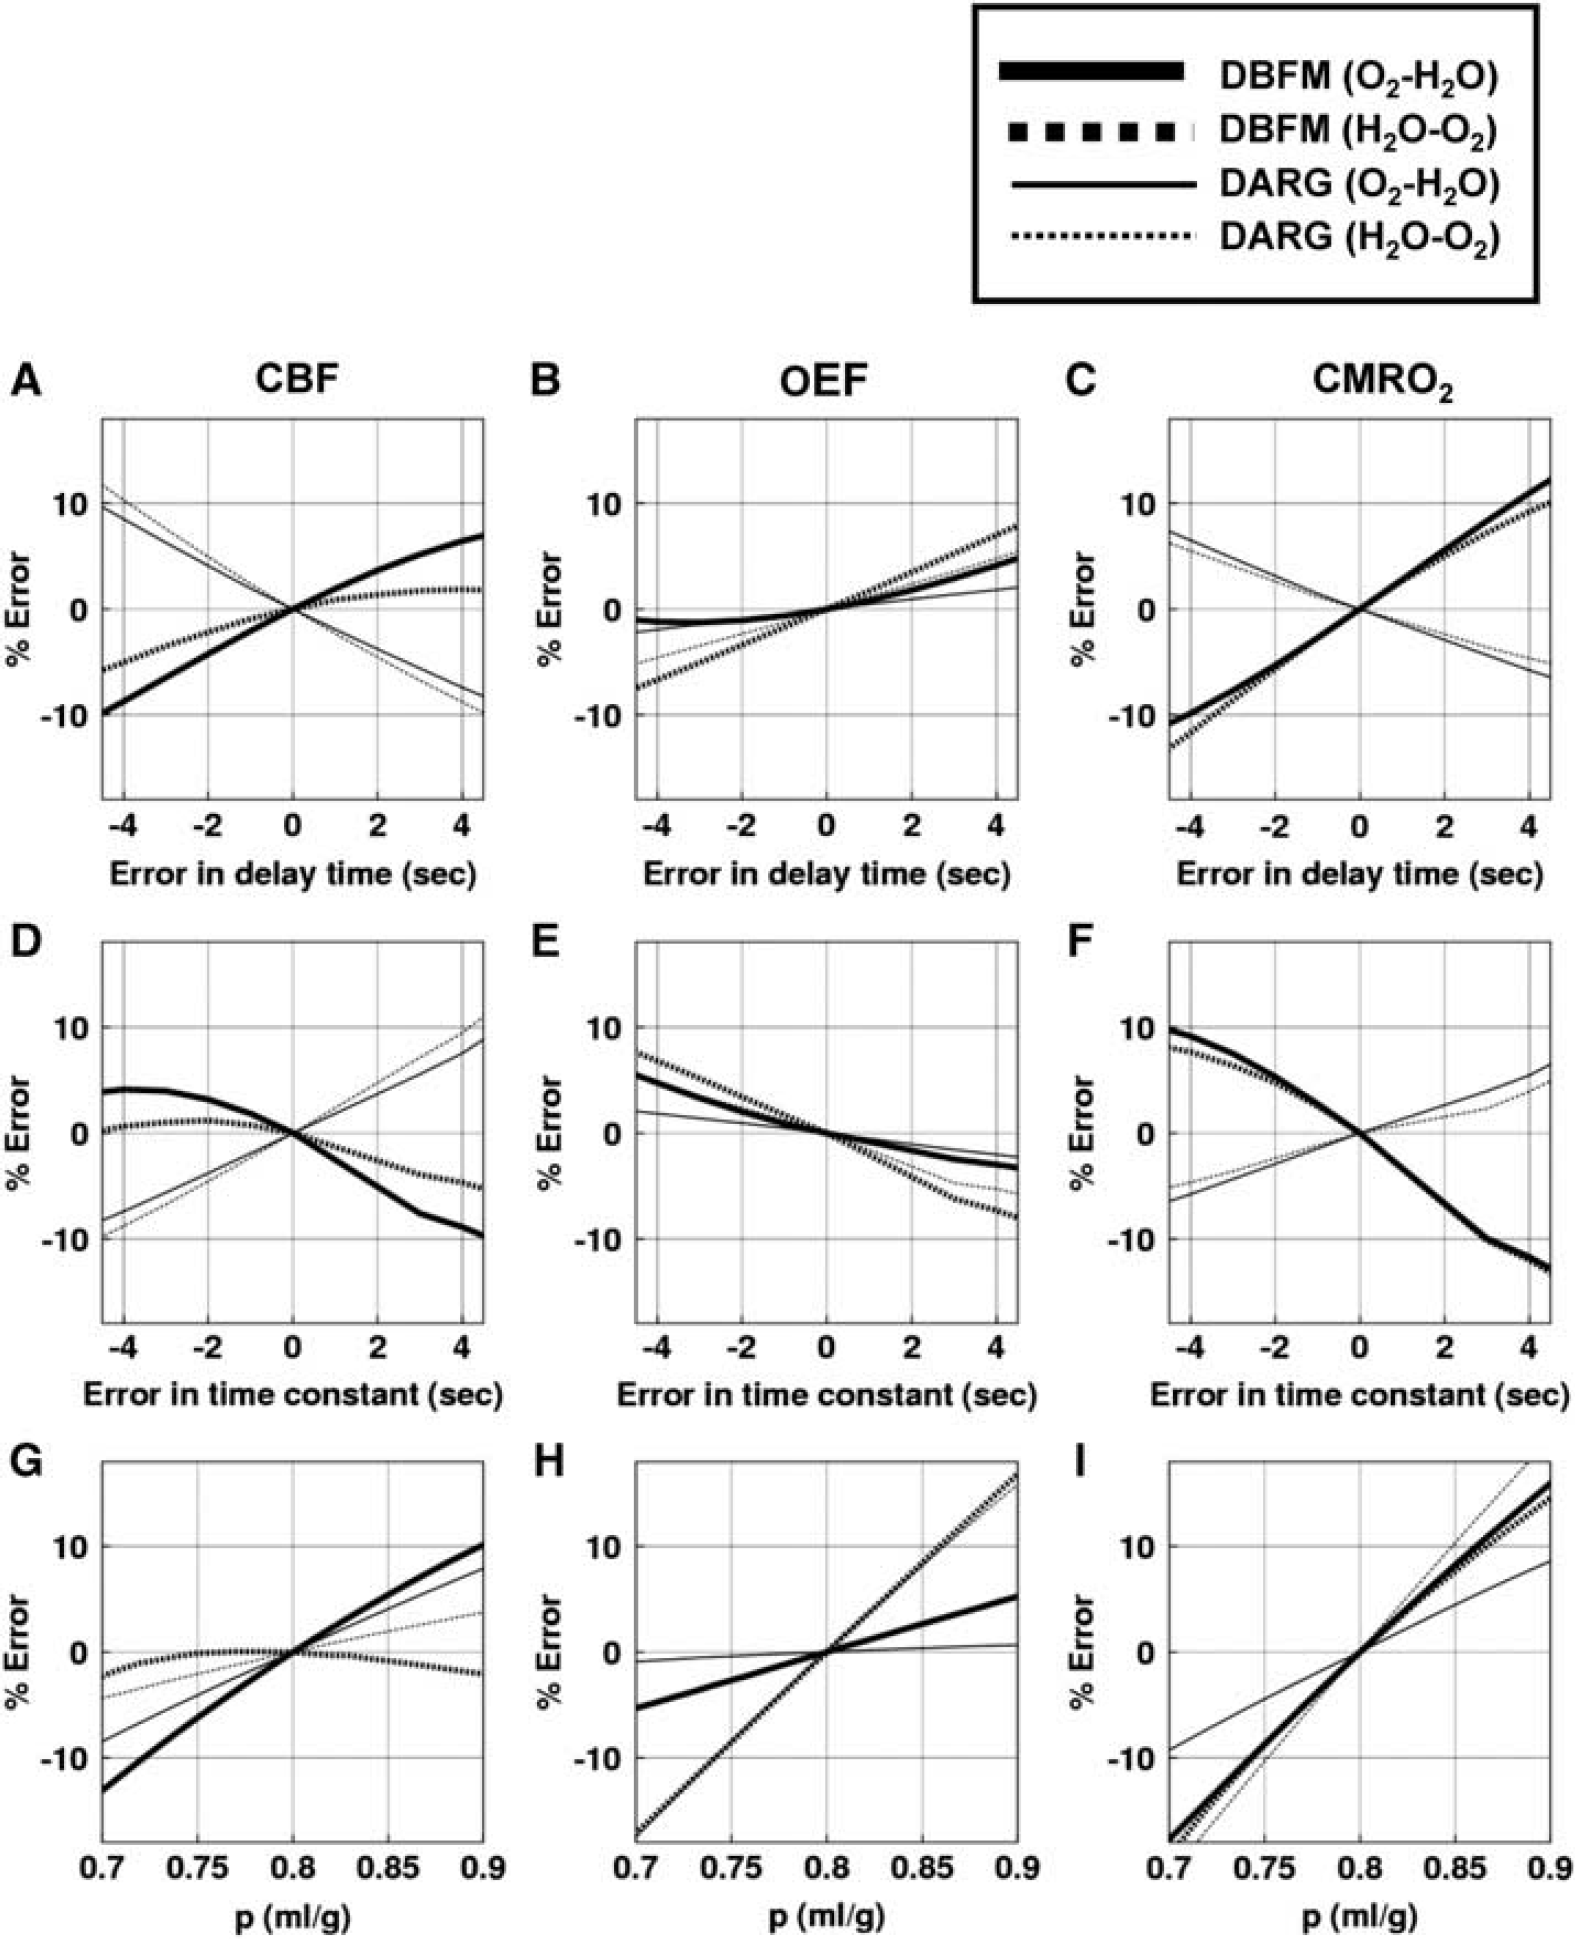
Results of the simulation study demonstrating the effects of errors in the delay of the arterial input function (upper:
DISCUSSION
This study demonstrated that the DBFM method developed in this study provided quantitative functional images of CBF, CMRO2, and OEF from a single, short-duration dynamic PET scan with sequential administration protocols of H2 15 O (C 15 O2) and 15 O2, and 15 O2 and H2 15 O within a short-time interval. Oxygen extraction fraction values obtained by the DBFM method agreed well with those derived by the A–V oxygen difference in the experiment utilizing six normal monkeys (Figure 1). Cerebral blood flow and CMRO2 calculated by DBFM also agreed with those by the previously proposed DARG method in young normal volunteers (Figure 2). No significant difference was seen between the DBFM and DARG methods in all functional parameters, except for CMRO2 values assessed with the 15 O2–H2 15 O protocol, indicating significantly smaller values with DBFM than DARG. The magnitude of the difference was −6.68% ± 10.5% in average, which is within an acceptable range for practical use. The simulation also demonstrated that the DBFM and DARG methods were similar in terms of the sensitivity to three known error sources of the delay and dispersion, and the uncertainty in the assumed partition coefficient. A previous study 9 demonstrated that calculated functional values were identical between DARG and the three-step autoradiography of Mintun et al 2 when the administration interval was longer than 3 minutes in DARG. Dual-tracer basis function method should therefore be able to provide functional values comparable to those of the three-step autoradiography. It should however be noted that the image quality (or the statistical noise) of CBF, OEF, and CMRO2 images was degraded in DBFM than in DARG as quantitatively evaluated by N-Index (Figure 5). This is attributed that four parameters have to be determined in DBFM while only two in DARG. However, difference of N-index values was only 10% to 20% in average, and not visible in the calculated parametric images shown in Figure 3.
An important advantage of DBFM over DARG is that the former does not require independent scan of CBV using C 15 O inhalation. This allows shortening the entire scan period. A single dynamic scan for 6 minutes on animal experiments and 9 minutes on young volunteers presented in the present study are significantly shorter than previous protocols. Although additional time is needed for transmission scan and other technical procedures, the entire study period of <15 minutes is probably practically possible and feasible. The DBFM technique is similar to Ohta et al24–27 in terms of estimating three parameters of CBF, CMRO2, and CBV from a single session of the scan. The essential difference is that the DBFM stands for the sequential administration of two tracers of 15 O2 and H2 15 O (or C 15 O2) within a short interval, which contributes to improve the accuracy and statistical stability. Such shortened PET scan makes the simultaneous assessment of CBF and CMRO2 applicable to a number of physiological and/or pharmacological stimulation studies in clinical settings. Two radioactive compounds, however, need to be synthesized within a short interval, with a high level of purity. An automated system, desirably combined with a dedicated cyclotron, would be the need to improve the logistics of the examination, under the concurrent operation of the radioactivity supply and the PET scanning.28,29 Noninvasive determination of the arterial input function without the arterial blood sampling is also a key issue for practical use of this technique. 30 Further evaluations are warranted.
The present DBFM methods avoids the need for assumption of fixed fractionation of arterial- and venous-parts of the blood volume, as well as the fixed peripheral-to-central hematocrit value, which has commonly been made in the previous DARG and other three-step approaches. 31 Systematic errors could have been caused by these assumptions in pathologic tissues, such as ischemia and/or the AVM (arteriovenous malformation). The ischemia could cause vasodilatation, with a possible change in relative fractionation of arterial-to-venous volumes. The AVM is often characterized by increased arterial blood volume, which likely cause changes in the arterial-to-venous volume fractionations and also in the peripheral-to-central hematocrit ratios. Cerebral blood volume-equivalent information of V0O and VAW, has been determined in DBFM, thus likely avoiding the systematic errors attributed to the possible alterations in those assumptions. Similar values of CBF and CMRO2 between the C 15 O-based CBV correction in DARG and by DBFM methods in young healthy volunteers, on the other hand, empirically supports the validity of such assumptions in normal controls.
By definition, V0O and VAW estimated from the DBFM are different from CBV, and also different from each other. The former contains both the arterial and venous volume, but more weighted with the arterial part. The latter contains only the arterial blood volume. Further studies should be carried out to evaluate the significance of V0O and VAW parameters, particularly in patient populations.
Interval of the two administration for the two tracers of H2 15 O (C 15 O2)– 15 O2 and 15 O2–H2 15 O in DBFM was 3 minutes in animal study, and 6 minutes in young normal volunteer studies. The longer interval in the volunteer study was due to the limitation in radio-synthesis procedures. Use of C 15 O2 rather than H2 15 O would have an advantage in clinical studies, because the venous cannulation for H2 15 O saline infusion can be avoided, thus making the safety control easier. An alternative protocol of inhaling two radioactive gases, namely 15 O2–C 15 O2 could be method of choice. The inhalation protocol, however, requires a sophisticated system that enables the stable administration.
One limiting factor of eliminating the additional C 15 O scan in DBFM is that the calculated CBF, OEF, and CMRO2 images have enhanced statistical noise. Systematic errors could also be enhanced, if errors in the delay and dispersion of the arterial input function occurring in the catheter tube and connectors etc are not adequately compensated. It should also be noted that the blood volume-equivalent images (V0O) indicated a large level of statistical noise (Figure 4). Optimization of image reconstruction procedures is required to minimize the enhancement of the statistical noise. Improvement of electronics in the PET device for shorter coincidence time window and smaller dead-time count losses are also essential for better quality of images.
Another limitation of the technique is the need for the accurate determination of the arterial input function, as is for other techniques using 15 O-labeled compounds. Recent improvements in the spatial resolution and counting rate performance allows the noninvasive determination of the arterial whole-blood input function from the carotid-artery TAC, 30 from which contribution of metabolized H2 15 O TAC may be compensated by means of the physiological model. 18 However, an essential technique is needed to ensure the correction for the partial volume effect. Reconstruction of the input function from tissue TACs would also be an alternative. Mathematical formulation with minimal number of parameters that describe the shape of the input function could contribute to provide better accuracy as has been demonstrated in a recent work. 32 Further systematic studies are to be carried out.
The present study was carried out in 2D mode, although the PET scanner has ability of 3D acquisition. The reason for this was because we intended to minimize the amount of scatter and the random coincidence rates, attributed to the radioactive gas in the face mask system. The recent PET scanner can provide only 3D acquisition. Thus, extensive works are needed to improve the accuracy of the scatter correction method. It is also important to reduce the coincidence time window for reducing the random coincidence counting rate, and to minimize the dead-time count losses. These should be achieved not only by the improvement of the PET device, but also by the geometrical optimization of the face mask system including the radioactivity gas transportation.
The OEF values of 0.57 ± 0.06 observed in monkeys are higher than those in human. The anesthetic agent of propofol was shown to reduce both CBF and CMRO2 with similar magnitude, thus resulting in unchanged OEF in young adults. 33 Altman et al 34 obtained OEF values of 0.53 ± 0.13 using the arterio-sinus blood sampling technique, which is close to the values obtained in this study. It was also shown that OEFs measured using the steady-state PET technique ranged from 0.42 to 0.58 in normal tissues of anesthetized monkeys,34–39 which are within the agreement with this study. Cerebral blood flow values ranged from 27 to 37 mL 100 per gram per minute, and CMRO2 from 2.4 to 3.4 mL 100 per gram per minute,34–39 are also consistent with the results from the present study.
Two administration orders of the two tracers are fixed in healthy young volunteer studies, at first H2 15 O (C 15 O2)– 15 O2 and then 15 O2–H2 15 O, because of the need for a dose calibration each time before C 15 O2 or 15 O2 gas supply, after H2 15 O saline is produced. This is a source of errors attributed to systemic physiological effect like fatigue or habituation in patients. However, no essential difference was observed between the two protocols in the DBFM method.
A range of CBF and the step of basis functions should be carefully selected for the accurate and precise estimation of functional parameters, as has been discussed for neuroreceptor studies.40,41 The range for CBF was set from 0 to 2 mL per minute per gram, with the step value of 0.1 mL per minute per gram in the present computation, which have been confirmed to interpret the human data presented in this work. For the set of solutions in the present formula, we found no other local minimums in the residual sum of squares, for the physiologically acceptable range for CBF (0 to 2 mL per minute per gram), OEF (0 to 1) and CBV (0 to 1 mL/g).
Optimization of administration doses and their ratios of two tracers of 15 O2 and H2 15 O (C 15 O2) would be a subject of further investigation. Several factors should be taken into account, including the contribution of the residual tracer from the first administration into the second tracer contribution, random counting rate, and dead-time count losses. These are likely dependent on the physical performance of a PET device, and therefore need to be investigated for PET device-specific manner. The present study, however, demonstrated that the almost equal administration dose could yield stable results.
In conclusion, quantitative CBF, OEF, and CMRO2 could be calculated using the DBFM method from a single PET scan acquired during sequential administration of dual tracers with H2 15 O (C 15 O2)– 15 O2 and 15 O2–H2 15 O protocols. Although further studies are needed, ability of eliminating additional C 15 O scan for CBV assessment may contribute to improve the accuracy and applicability of the CBF, OEF, and CMRO 2 assessment in clinical settings.
DISCLOSURE/CONFLICT OF INTEREST
The authors declare no conflict of interest.
Footnotes
ACKNOWLEDGEMENTS
The authors thank the staff of the Department of Radiology, National Cerebral and Cardiovascular Center, and Department of Investigative Radiology, National Cerebral and Cardiovascular Center-Research Institute.