
Abstract
This paper describes the preclinical validation of the radioligand [11C]ORM-13070 and its tritiated analog for addressing selectivity and occupancy of the selective alpha-2C adrenergic receptor (α2CR) antagonist BAY 292 in the cynomolgus brain. BAY 292 is a novel drug candidate being developed for the treatment of obstructive sleep apnea (OSA) via binding to central α2CR. In vitro autoradiography studies with sections from non-diseased post-mortem human caudate revealed an excellent specific binding window (>80%) using [3H]ORM-13070. BAY 292 bound to the same binding site as [3H]ORM-13070 and generated a good specific binding signal, with greater selectivity for α2CR. In non-human primates in vivo, [11C]ORM-13070 demonstrated a reversible behavior, with uptake at baseline highest in striatum (putamen, caudate, ventral striatum, and pallidum) and low in the cerebellar cortex, consistent with the known distribution of the α2CR. A dose dependent increase in receptor occupancy after BAY 292 administration was observed, confirming BBB penetration and target engagement. The estimated EC50 for BAY 292 is 33.39 ± 11.91 ng/mL. This study aimed to demonstrate the suitability of [11C]ORM-13070 as a PET-radioligand for the study of α2CR in the non-human primate brain, and to pave the way for future clinical PET tracer studies with BAY 292.
Keywords
Introduction
α2C adrenergic receptors (α2CR) belong to the family of G-protein coupled receptors. Besides the different α1-adrenergic receptors, α2-adrenergic receptors can be divided into three homologous subtypes (α2A, α2B and α2C). They play an important physiological role, mainly in the cardiovascular system and in the central nervous system. α2A- and α2CR are the main auto receptors involved in presynaptic feedback inhibition of noradrenaline in the central nervous system, regulating the release of noradrenaline from central noradrenergic neurons. 1 Disturbed noradrenaline function has been implicated in many neuropsychiatric and neurodegenerative disorders; in fact, many of the currently used treatments for depression and attention deficit/hyperactivity disorder (ADHD) are based on modulating the synaptic availability of noradrenaline. 2 Thus, the modulation of noradrenaline release via the adjustment of α2CR activity is considered a potential therapeutic target for a number of CNS disorders including depression, psychosis and neurodegeneration. 3
Several radioligands have been described for the characterization of α2R, e.g. [11C]-MBF and [11C]-JP-1302, but brain penetration is limited. 4 In contrast, the radiolabeled PET tracer [11C]ORM-13070 has been designed for the imaging of α2CR in the brain. Its preclinical evaluation showed promising results in atipamezole pretreated rats and α2CR knockout mice. 5 ORM-13070 has also been successfully used to investigate amphetamine-induced changes in rat brain sections and in monkey brains. 6 Key human studies have explored its radiometabolism, plasma pharmacokinetics and distribution 7 and its suitability as a PET tracer in the clinical setting.8 –10 Further research has expanded the potential uses of ORM-13070. One study investigated the tracers’ ability to assess receptor occupancy by the α2CR-antagonist ORM-12741, providing translational validation of target engagement in both animal models and human subjects. 11 Another application of ORM-13070 is in monitoring noradrenaline release in the brain, a critical aspect in the study of mood disorders and stress responses. 12 Overall, ORM-13070 is a promising PET tracer that has shown good brain penetration and selectivity for the α2CR,5,13 however, it has not been fully characterized via kinetic modeling.
As BAY 292 is a selective α2CR antagonist currently in clinical development for the treatment of obstructive sleep apnea (OSA), it served as a suitable tool compound for further optimization towards an improved application of the PET ligand [11C]ORM-13070 in vivo. In this manuscript, we describe a series of in vitro autoradiography experiments conducted to confirm that BAY 292 binds to the same binding site as the PET ligand, as well as in vivo target occupancy studies using [11C]ORM-13070 in non-human primates, aiming to further de-risk the development of the drug candidate and human translatability.
Materials and methods
Radiochemistry of [3H]ORM-13070
[3H]ORM-13070 (1-{[(2S)-2,3-dihydro-1,4-benzodioxin-2-yl]methyl}-4-[3-(methoxymethyl)pyridin-2-yl](3H4)piperazine) was synthesized at Bayer AG by an iridium-catalyzed hydrogen-tritium exchange using Tamm’s catalyst ((1,5-cyclooctadiene){N-[2-(di-tert-butylphosphino)phenyl]-1,3,4,5-tetramethyl-1,3-dihydro-2H-imidazol-2-imine}iridium(I) tetrakis[3,5-bis(trifluoromethyl)phenyl]borate) (Supplemental Fig. 1).14 –16
The tritiation was performed at ambient temperature and a tritium gas pressure of about 198 mbar. Purification of the tritiated material was performed by reversed phase (RP) chromatography. A total radioactivity amount of 9593 MBq was obtained, with a specific radioactivity of 7335 MBq/mg (2643 GBq/mmol). The identity was confirmed by 1H-NMR, mass spectrometry and liquid chromatography (co-injection with reference material) (see Supplementary Material for details).
Radiochemistry of [11C]ORM-13070
The reference compound ORM-13070 and its O-desmethyl precursor were synthesized by WuXi Apptech (Hubei, China) with chemical purities ≥99.3% (HPLC-UV) and assays for use ≥97.9%. All other chemicals were obtained from commercial sources.
In analogy to a literature procedure, 5 [11C]ORM-13070 was prepared at Invicro LLC by O-methylation of the O-desmethyl precursor with [11C]-methyl triflate using a Siemens RDS Eclipse 111 cyclotron, TRACERlab™ FX2 MeI (GE Healthcare, Chalfont St Giles, UK) and Modular Lab (Eckert & Ziegler, Berlin, Germany) synthesis modules (Supplemental Fig. 2). In brief, [11C]-methyl iodide, produced under standard conditions (reduction of [11C]CO2 using a Ni-Shimalite catalyst under hydrogen atmosphere at 350°C), was passed through a column containing silver trifluoromethanesulfonate. The generated [11C]-methyl triflate was bubbled into the reactor vessel pre-charged with a solution of 0.9–1.1 mg desmethyl ORM-13070 precursor, anhydrous acetonitrile and tetrabutylammonium hydroxide (1 M in anhydrous MeOH) held at −5°C. The resulting mixture was heated for 3 min at 80°C, cooled to 40°C and purified by semi-preparative RP-HPLC. The PET tracer was isolated by solid phase extraction, formulated into 10% ethanolic saline, and finally passed through a 0.2 μm membrane filter for final sterilization. Decay-corrected radiochemical yields was, on average 17.3 ± 5% and the radioactivity of [11C]ORM-13070 was 1494 ± 538 MBq at end of synthesis. Radiochemical purity exceeded 99% in all syntheses (n = 11). The average injected dose was 191 ± 22 MBq with an average injected mass of 1.15 ± 0.42 μg.
In vitro receptor autoradiography
Tissue preparation
Fresh-frozen tissue blocks containing the caudate brain region from three control human subjects were sourced from the Netherlands Brain Bank (subject demographics: 85 years female, 5:20 h post-mortem time; 95 years male, 7:15 h post-mortem time; 88 years male, 7:00 h post-mortem time). Tissue blocks were sectioned (20 μm thickness) using a cryostat (Bright Instruments Ltd., Huntingdon, UK) and mounted onto 1% gelatine subbed superfrost slides for autoradiography assays. Excess water was removed from the tissue sections by incubation with CaSO4 for 1 hour at 4°C prior to storage at −80°C until used.
Autoradiography assay
Anatomically adjacent human caudate tissue sections (from n = 3 subjects) were brought to room temperature and pre-incubated in assay buffer (50 mM Tris, 140 mM NaCl, 1.5 mM MgCl2, 5 mM KCl, 1.5 mM CaCl2, pH 7.4, 23°C) for 15 minutes to remove any endogenous ligand. Sections were then incubated for 120 minutes at room temperature in assay buffer containing 0.5, 1, 5, 10 or 25 nM [3H]ORM-13070. The specific binding component was determined by incubating adjacent sections at room temperature with the radioligand in the presence of a saturating concentration of either unlabeled homologous blocking agent, 10 μM ORM-13070, or heterologous blocking agent, 10 μM BAY 292, to yield a measure of non-specific binding. Following incubation, the sections were washed twice in ice-cold buffer (50 mM Tris, 1.4 mM MgCl2, pH 7.4, 4°C) and briefly submerged in water (reverse-osmosis filtered) to remove excess salts.
Autoradiography analysis
After drying, sections were apposed to a tritium-sensitive phosphor-imager plate for 7 days and analyzed using OptiQuant software (Perkin Elmer, USA, version 5.0.0.2). Regions of interest were manually drawn on each section to determine the binding expressed as digital light units (DLU)/mm2. The specific binding signal was determined by subtracting the non-specific binding signal from the total binding signal. A tritiated tissue-equivalent microscale was apposed alongside the sections to allow for expression of binding as fmol/mg tissue. The specific binding window (expressed as percentage specific binding) was determined as the amount of specific binding as a percentage of the total binding signal. All graphs were produced using GraphPad Prism (v.6.07).
PET imaging in non-human primates
Study population
All animal experiments were conducted at Charles River Laboratories (Matawan, MI, USA), in full compliance with the Institutional Animal Care and Use Committee (IACUC) policies and procedures, which follow the recommendations of The Guide for the Care and Use of Laboratory Animals (“The Guide,” Institute of Laboratory Animal Resources, National Academy Press, Washington, D.C., 8th Edition, 2011). Experiments were largely conducted under ARRIVE guidelines 2.0 17 with the exception of subject randomization and blinding. Randomization was not employed as various drug doses and PET measures were compared to vehicle dose in the same subject, as PET signal under vehicle condition can vary across subjects. Blinding was not employed in study design and analysis as the study followed an adaptive design, with subsequent drug doses chosen dependent on previous results. Analysis methods for PET outcomes employed semi-automated methods to reduce analyst subjectivity. All in vivo experimentation was completed under an approved Charles River Laboratories IACUC animal use protocol (AUP). Two cynomolgus monkeys (Macaca fascicularis), one male (M1, 4.1 ± 0.3 kg) and one female (M2, 4.1 ± 0.2 kg), were scanned at baseline (n = 2) and at competition with BAY 292 (n = 8). One additional male subject (M3, 3.4 kg) received a baseline scan but was withdrawn from the study as placement of temporary venous access catheters for drug and tracer infusion proved to be unreliable, thus competition investigations were only conducted in the other two subjects. The primates ranged in age from two to five years old.
Study design
Initial scans were aimed at a high predicted receptor occupancy, with following target dose decisions being informed by previous scan results and adapted to target various occupancies to build the plasma exposure – receptor occupancy relationship. Constant plasma exposure of BAY 292 was maintained during the dynamic PET scans. As each monkey was scanned four to six times during the study, the study days for each monkey were scheduled at least two weeks apart to allow for recovery from anesthesia, blood volume recovery and drug clearance.
At baseline, the scans were performed in the presence of formulation vehicle, which was delivered to mimic the dose volume and infusion rate for the first competition experiment with BAY 292. For competition scans, formulated BAY 292 was administered via intravenous catheter starting at 30 min prior to tracer injection as a 2 min short infusion followed by a constant rate infusion (CRI) to the end of the scan (approx. 88 min) to ensure steady state plasma exposure during the PET scans (Figure 1). An exception was one experiment for which BAY 292 was administered via single rate CRI for 90 min starting at 30 min prior to tracer injection.
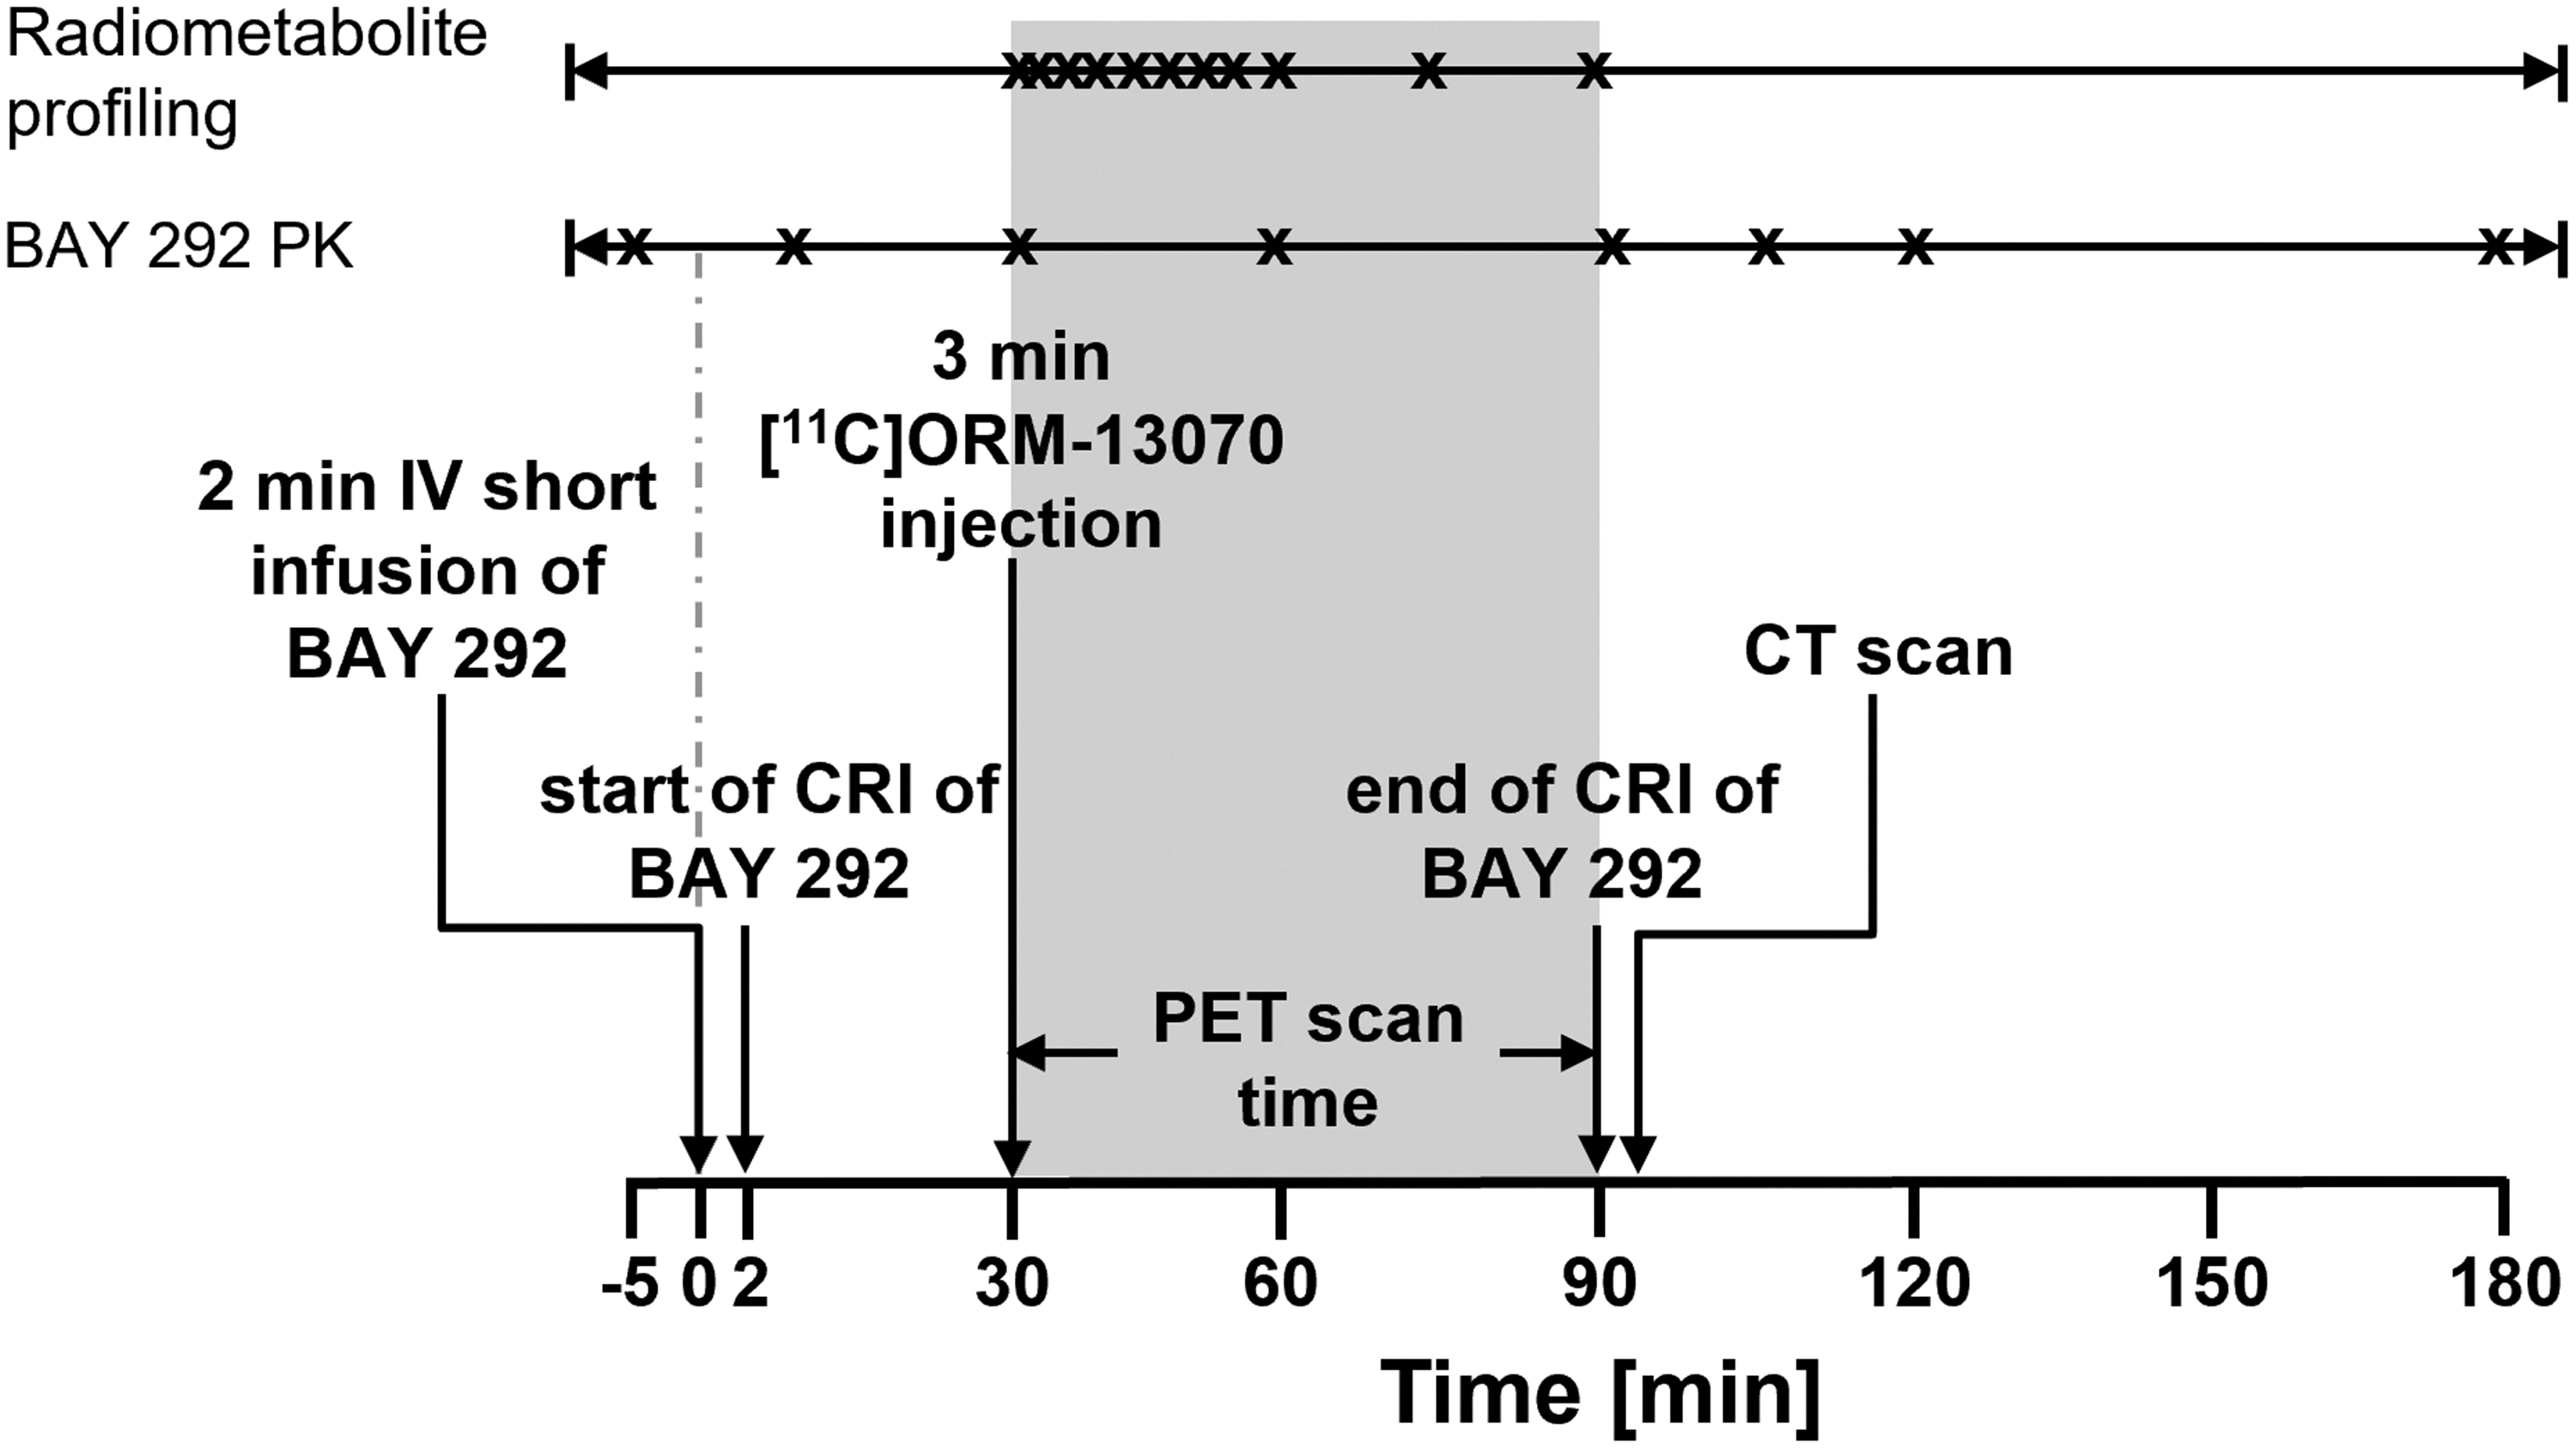
Study Design of PET imaging study in cynomolgus monkeys. CRI: constant rate infusion; IV: intravenous
The study was designed to ensure that BAY 292 plasma concentrations were at steady state during [11C]ORM-13070 scans. PET image acquisition began upon the start of 3 min (to allow for manual blood sampling) IV administration of [11C]ORM-13070 and continued for 60 min.
Total doses administered and infusion rates for all BAY 292 competition scans are presented in Supplemental Tab. 1.
PET imaging
Animals were initially anesthetized with ketamine (5–10 mg/kg, IM) and atropine sulfate (0.025–0.05 mg/kg SC or IM). Once intubated, the animals were maintained on isoflurane/oxygen (1–3%) anesthesia for the duration of the scans. All brain imaging scans were acquired with the microPET Focus 220 scanner (Siemens Medical Systems, Knoxville, TN, USA). Following the intravenous injection of radiotracer dynamic emission data were collected continuously in list-mode for 60 min, and subsequently rebinned in a series of 21 dynamic 3D PET image volumes (6 × 0.5 min, 3 × 1 min, 2 × 2 min, 10 × 5 min). An x-ray CT transmission scan was performed using a CereTom® OTOscan (NeuroLogica, Danvers, MA, USA) to provide correction coefficients for photon attenuation in matter. The dynamic scan data series were subsequently reconstructed using standard filtered back projection with standard corrections for detector normalization, deadtime, randoms, scatter, attenuation, and radioactive decay provided by the camera manufacturer. A single 1.5T T1 MRI of the brain was acquired for each monkey using an Intera 1.5TTM (Philips Medical Systems, Best, Netherlands) prior to the PET study for anatomical reference and image analysis.
Plasma radioactivity, metabolite analysis and protein binding
Starting at [11C]ORM-13070 injection, arterial blood samples were drawn during the PET scan at 0.25, 0.75, 1.25, 2.25, 2.75, 3.25, 4, 5, 10, 15, 30, 45, and 60 min. Selected samples at 5, 15, 30, 45, and 60 min had a volume of 1.5 mL and were used for metabolite analysis to measure the fraction of unchanged [11C]ORM-13070 in plasma (i.e., parent fraction) by HPLC. All samples were aliquoted (0.2 mL) and whole-blood and plasma separated by centrifugation (1300 g for 6 min at 4°C) were counted in a Wizard 2 gamma counter (PerkinElmer, Shelton, Connecticut, USA).
Plasma metabolite analysis was performed using an Agilent 1100 (Agilent Technologies, Santa Clara, CA, USA) equipped with a coincidence detector for radioactive detection and UV detection using a diode array detector set to 315 nm. Plasma (600 µL) was diluted with a solution of diluent (600 µL of 10 µg/mL unlabeled ORM-13070 standard in acetonitrile) to precipitate proteins, then centrifuged at 14,100 g for 3 min. The supernatant was removed, and both supernatant and pellet were analyzed in a Wizard 2 10-well gamma counter (PerkinElmer, Shelton, Connecticut, USA). An appropriate volume to give approximately 60000 cpm per injection was injected onto a Phenomenex Luna 10 × 250 mm, 10 µm C18 column fitted with a 10 × 10 mm guard cartridge. Samples were analyzed using a 4.0 mL/min flow of 80:20:0.2 (v:v) ratio of methanol:water:triethylamine.
An ultrafiltration-based method was used for measuring the unbound portion (free fraction, fp) of [11C]ORM-13070 in plasma. A sample of [11C]ORM-13070 (200 μCi) from the formulated dose, in a volume no greater than 0.25 mL, was spiked into 1–1.5 mL of a plasma sample taken shortly before injection and separated as described above. After 10 minutes of incubation at room temperature, the spiked plasma (0.25 mL) was loaded onto the reservoir of the Millipore Centrifree® Micropartition device (Millipore, Billerica, MA, USA) in duplicate and centrifuged at 1500 g for 20 minutes. The uncorrected fp was determined as the ratio of the mean radioactivity concentration of the pass-through unbound [11C]ORM-13070 in the filtrate to the mean total activity in plasma.
Determination of BAY 292 concentrations in plasma
In addition to the samples used to determine [11C]ORM-13070 radioactivity concentration in plasma, blood samples (1.0 mL) were collected at −5 (pre-dose), 10, 30 (just before tracer administration), 60, 90 (end of scan), 120, and 180 min relative to start of BAY 292 administration. An additional sample was collected between 90 and 120 min immediately after the CT scan. Samples were collected with K2-EDTA as anticoagulant and stored on ice during plasma processing. All PK samples and residual test article dosing formulation were stored frozen (−70 to −90°C). BAY 292 concentrations in plasma were quantified with bioanalytical HPLC-MS/MS methods (NorthEast BioAnalytical Laboratories LLC, Hamden, CT, USA).
Image analysis
Dynamic brain PET images were transferred and analyzed using the image processing PMOD software package v3.802 (PMOD Technologies, Zurich, Switzerland). The PET images were checked for motion, rigidly aligned to the MR image of the monkey’s brain and then spatially normalized to a common cynomolgus MRI template 18 using a normalized mutual information algorithm. 19 Regions of interest (ROIs) defined in the template space by an associated brain atlas 18 were applied to the spatially normalized PET images to compute time-activity curves (TACs, in kBq/cm3) which included caudate nucleus (0.96 cm3), putamen (1.34 cm3), ventral striatum (0.24 cm3), pallidum (0.35 cm3), and cerebellar cortex (3.81 cm3). ROIs used for analysis are illustrated in Supplemental Fig. 3. Brain TACs and the arterial input function (AIF) were used for quantification with compartmental modeling. Images and TACs were presented in SUV units (g/mL) by normalizing to the body weight and the injected activity.
Kinetic analyses and occupancy determination
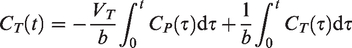
Regional brain TACs of [11C]ORM-13070 were modeled with multilinear analysis (MA1) model for reversible tracers
20
implemented in PMOD kinetic toolbox (PKIN), to estimate the total volume of distribution, VT (mL/cm3) in each brain region using AIF. MA1 model is described by the following equation:
VT estimated with MA1 was compared at baseline with VT estimated using a 1-tissue and 2-tissue compartmental models (1TC and 2TC).
22
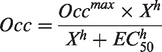
Goodness-of-fit by 1TC and 2TC was evaluated using the Akaike information criterion (AIC; a smaller AIC indicates a more appropriate model). The global α2C occupancy by BAY 292 was estimated using a modified Lassen plot, a.k.a. occupancy plot with
As alternative, non-invasive approach, not requiring arterial sampling, binding potentials (BPND) in α2C-rich regions were estimated using a simplified reference tissue method (SRTM), 24 by assuming cerebellar cortex was devoid of α2C receptors and could be used as a reference region. To estimate occupancy a modified occupancy plot approach was used, in which VT was replaced by BPND and x-intercept was constrained to zero.
Results
In vitro receptor autoradiography
In vitro autoradiography experiments revealed a specific binding signal in the human caudate with 0.5–25 nM [3H]ORM-13070 using the homologous blocking agent (ORM-13070) to determine the non-specific binding (Figure 2, Table 1). The chemotype distinctive heterologous blocking agent, BAY 292, showed similar specific binding signal when used to measure non-specific binding, indicating that it shares the same binding site as ORM-13070 and supporting selectivity of the compound to α2C receptors.
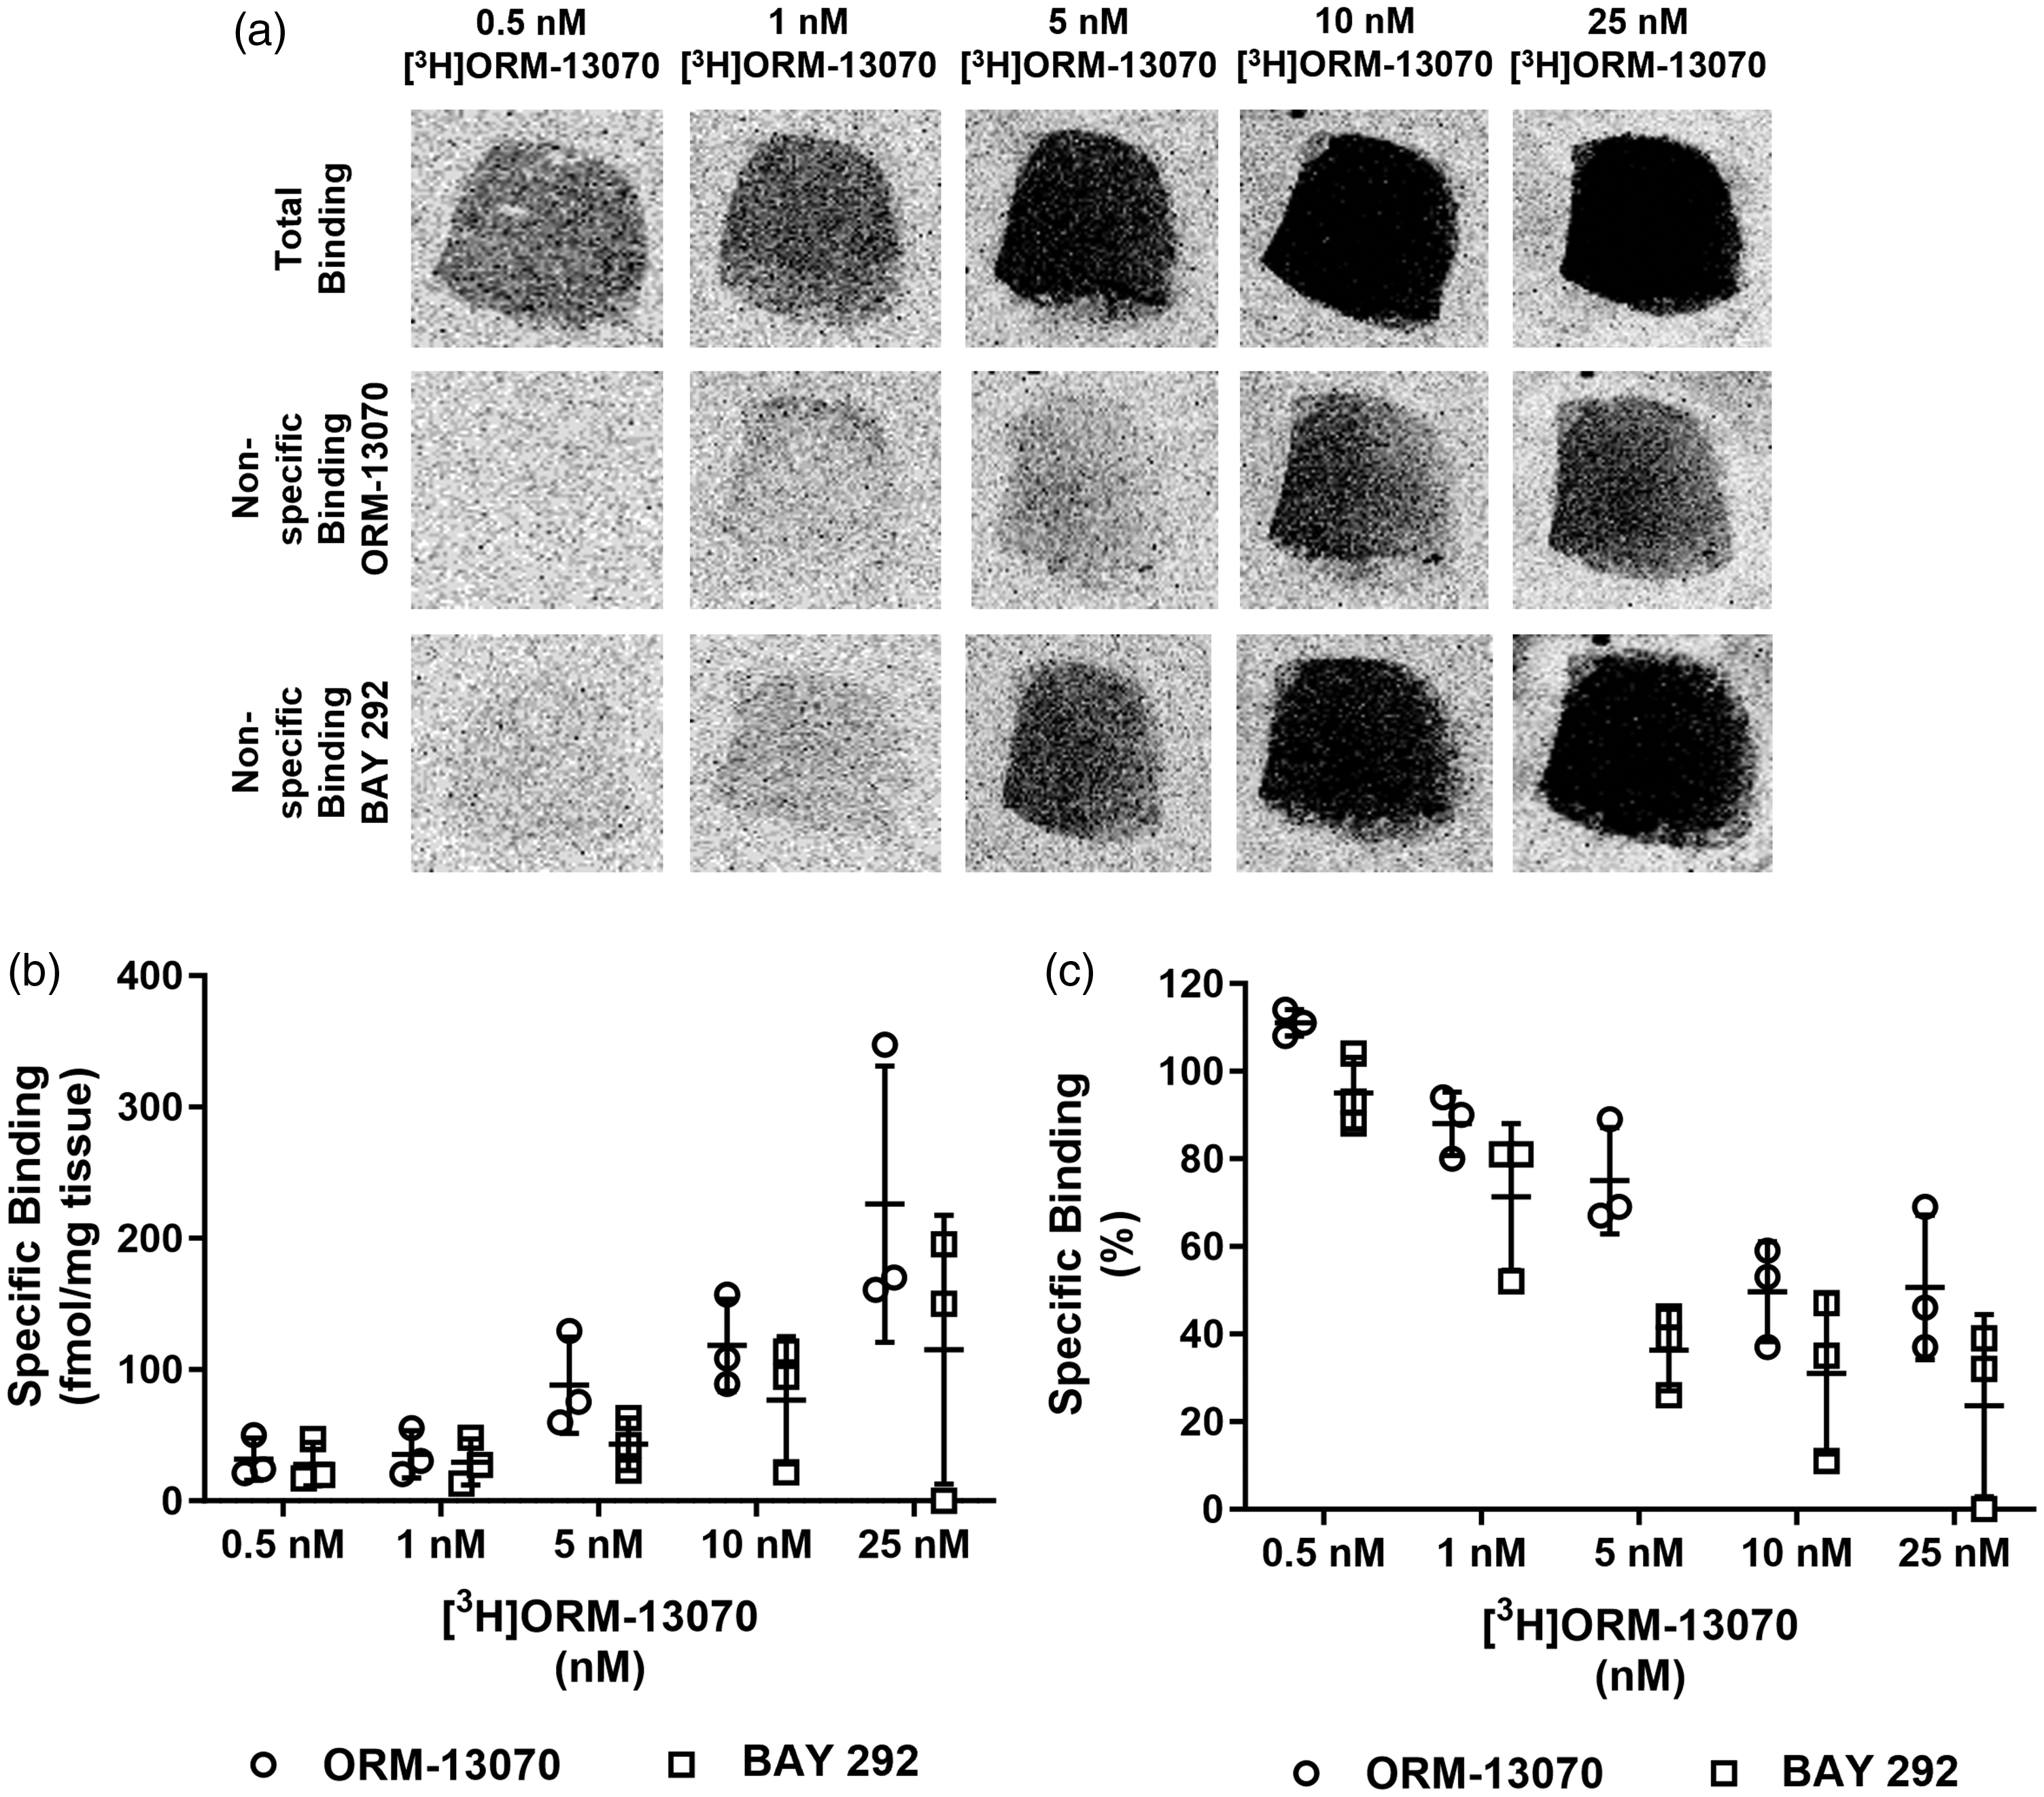
In vitro autoradiography of [3H]ORM-13070 binding in human caudate. (a) Representative autoradiograms of [3H]ORM-13070 binding in human caudate tissue under TOP: total binding conditions, MIDDLE: non-specific binding as determined with 10 µM unlabeled ORM-13070, BOTTOM: non-specific binding as determined with 10 µM BAY 292. Specific binding of [3H]ORM-13070 in control human caudate (n = 3, mean ± SD) expressed as (b) fmol/mg tissue and (c) percentage of total binding. Normal distribution was confirmed by the Shapiro-Wilk test.
Specific binding of [3H]ORM-13070 in control human caudate sections using homologous ORM-13070 and heterologous BAY 292 as blocking agents to determine non-specific binding.
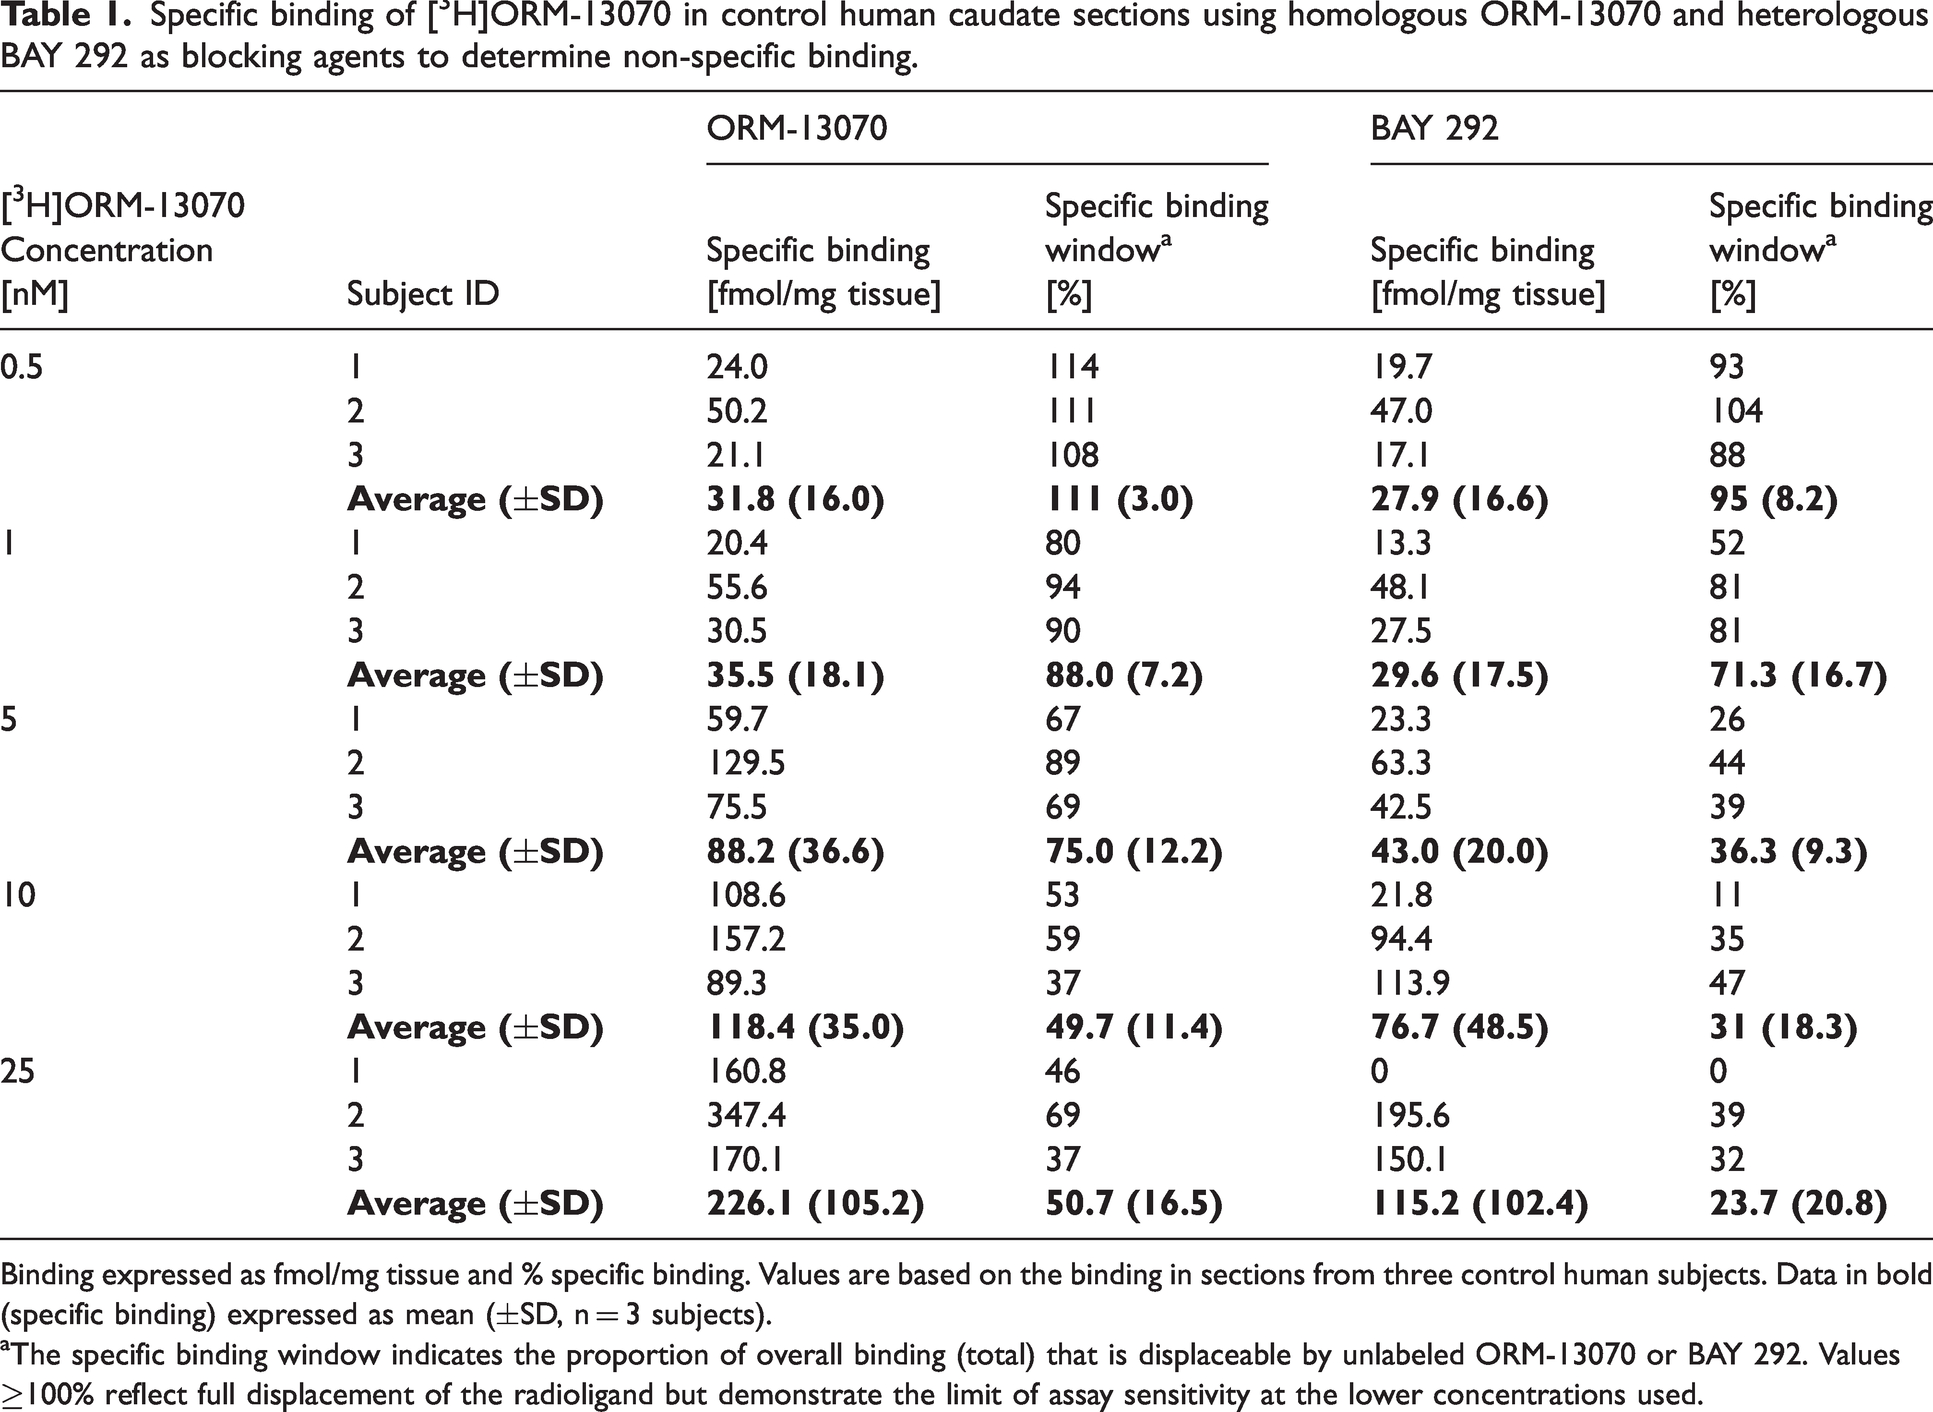
Binding expressed as fmol/mg tissue and % specific binding. Values are based on the binding in sections from three control human subjects. Data in bold (specific binding) expressed as mean (±SD, n = 3 subjects).
The specific binding window indicates the proportion of overall binding (total) that is displaceable by unlabeled ORM-13070 or BAY 292. Values ≥100% reflect full displacement of the radioligand but demonstrate the limit of assay sensitivity at the lower concentrations used.
PET imaging in non-human primates
[11C]ORM-13070 arterial blood measurements
The plasma to whole blood radioactivity concentration ratio (10–60 min post tracer injection) was 1.2 ± 0.1 (mean ± SD, n = 10, see also Supplemental Fig. 4 C). [11C]ORM-13070 metabolized with 39 ± 6% and 19 ± 4% intact tracer remaining at 15 and 60 min post-injection, respectively (Supplemental Fig. 4A). BAY 292 administration did not majorly impact tracer metabolism. For AIF generation parent fraction values were fitted to a 2-exponential function. Plasma free fraction, fP was 6.5 ± 1.0% with no effect attributed to BAY 292 or major difference between the subjects observed (Supplemental Fig. 4B).
[11C]ORM-13070 brain distribution and kinetics
[11C]ORM-13070 SUV images averaged over 20–60 min post tracer injection acquired at baseline and competition with different doses of BAY 292 are presented in Figure 3. Images showed [11C]ORM-13070 highest, in order, brain uptake values in the putamen, caudate nucleus, ventral striatum, and pallidum, low levels in other brain regions, and lowest uptake in cerebellar cortex. A dose-dependent reduction in the image intensity could be observed in all brain regions for images acquired in competition with BAY 292. An exception was the competition experiment at highest infusion rate (6.45 mg/kg total dose) with animal M1 (Figure 3(a), bottom row) for which the SUV 20-60 min was elevated compared to competition with BAY 292 infused at the lower rates, which can be explained by an elevation of the corresponding arterial blood concentrations of the tracer (data from this dose was not excluded when deriving the EC50).
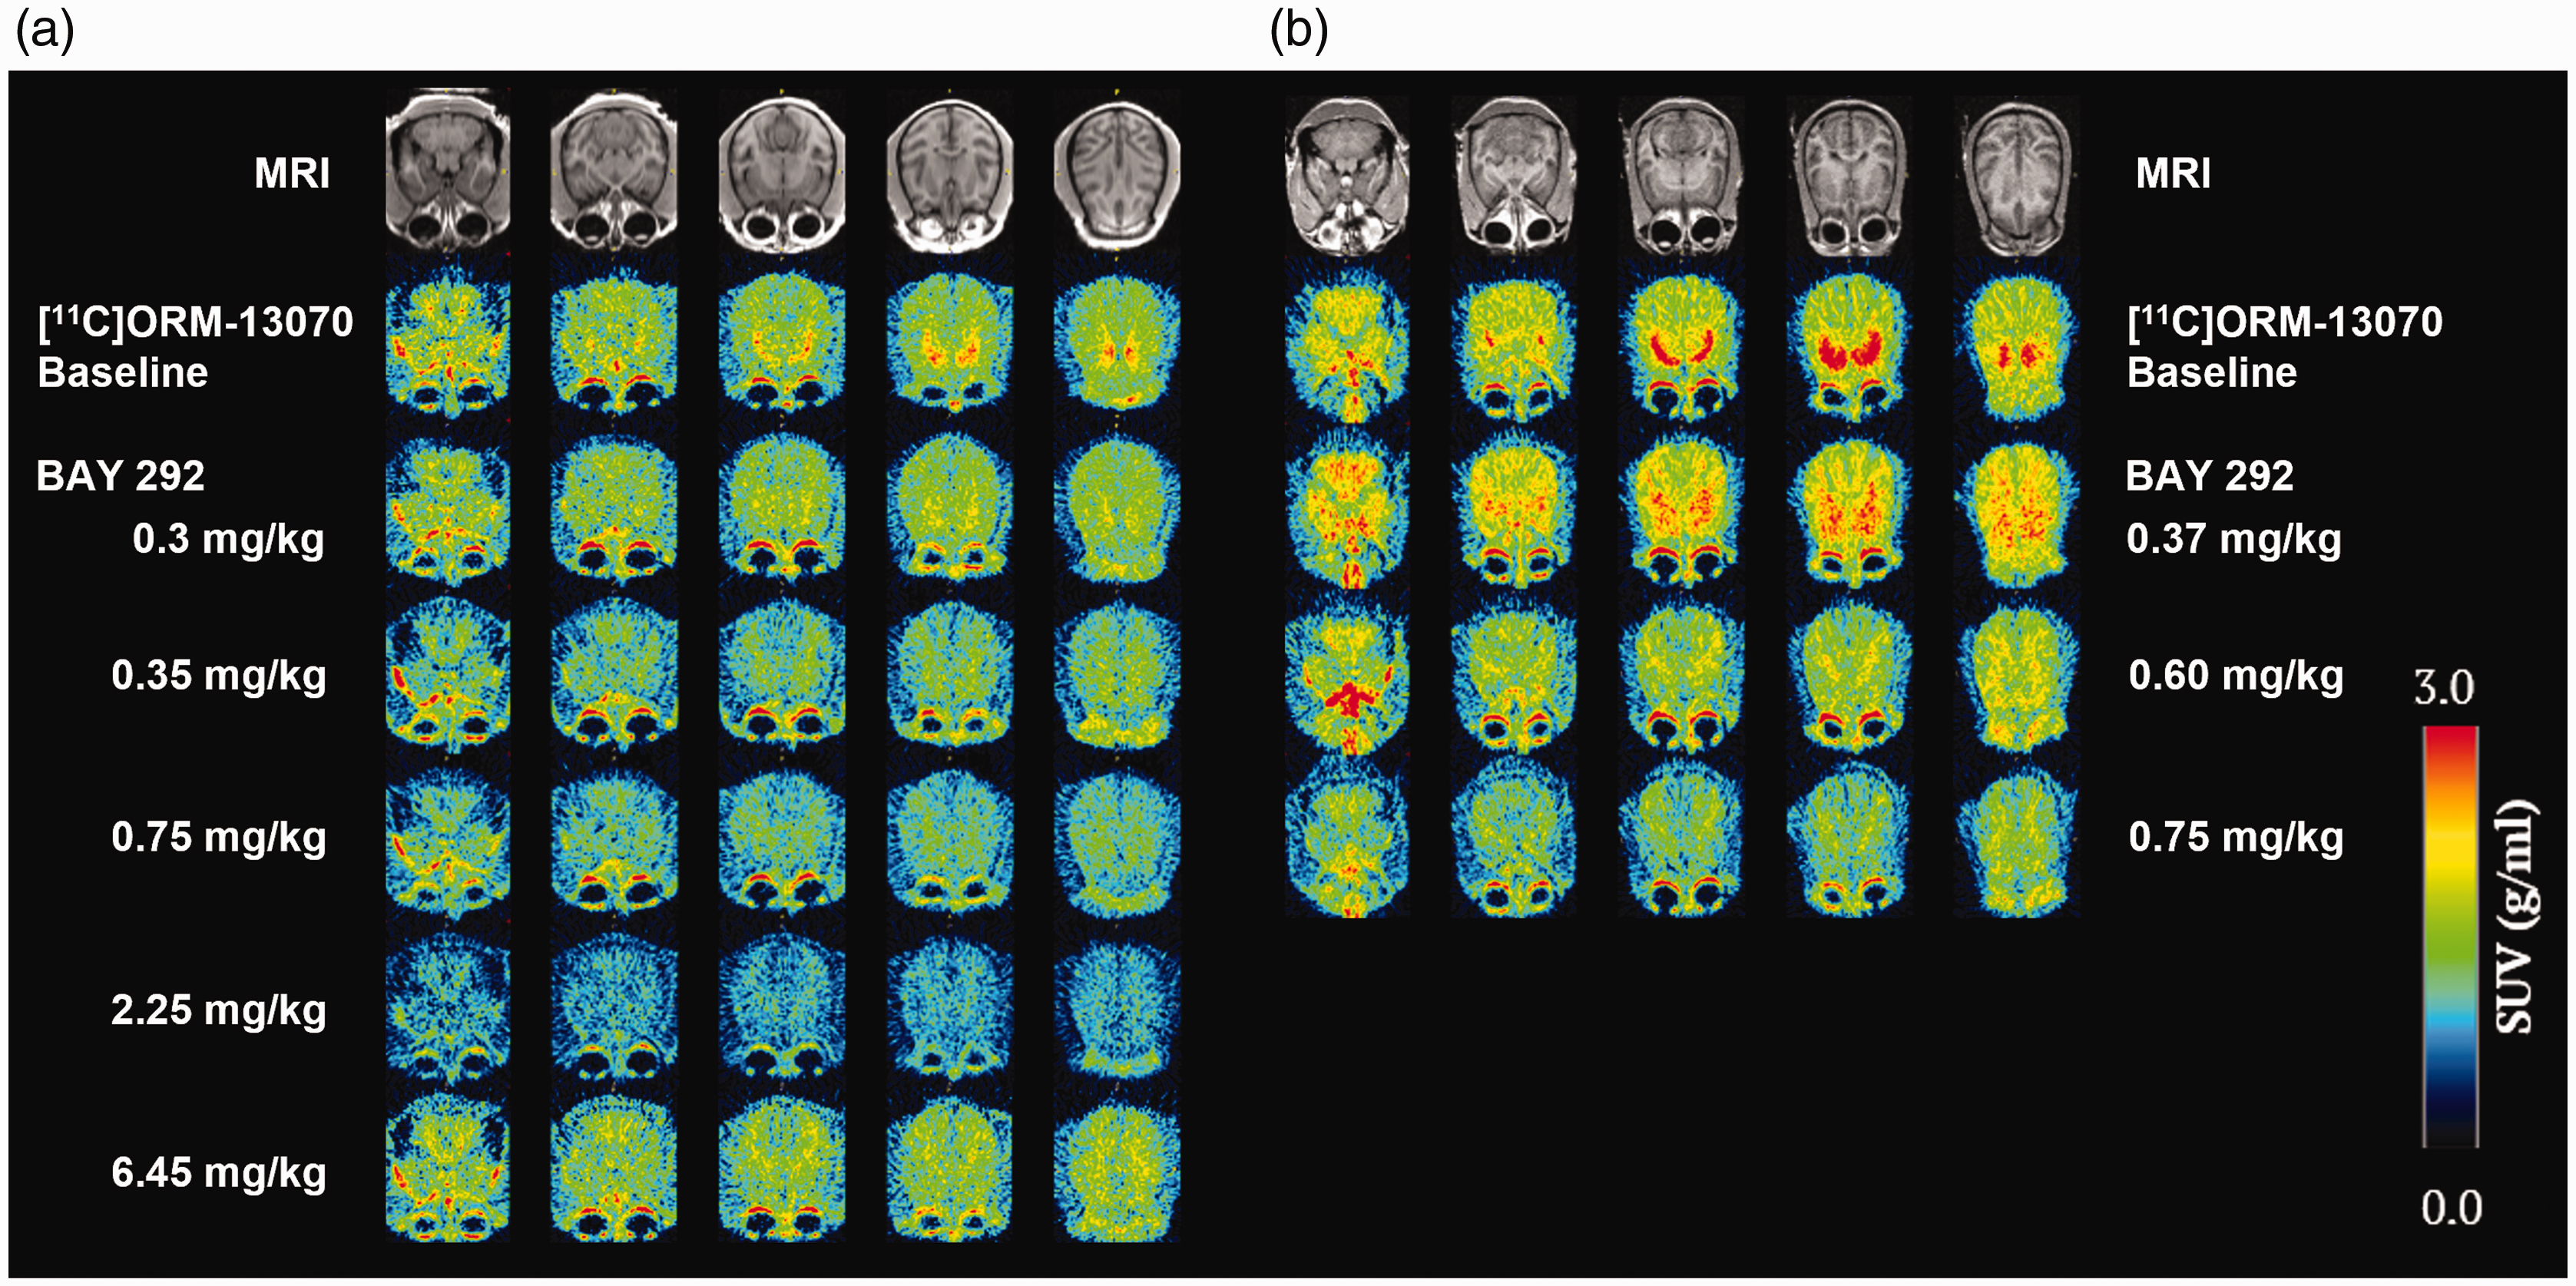
[11C]ORM-13070 images of the two monkey subjects (a) M1, and (b) M2 acquired at baseline and competition with BAY 292 administered as IV infusion at total doses of 0.3, 0.35, 0.37, 0.6, 0.75 (n = 2), 2.25, and 6.45 mg/kg. PET images (SUV) were averaged from 20 to 60 min post tracer injection. All images were normalized to a common cynomolgus MRI brain template. Each monkey’s normalized MRI is shown in the top row.
An example of [11C]ORM-13070 TACs obtained in one monkey (M2) from relevant brain regions (caudate nucleus, putamen, ventral striatum, pallidum, and cerebellar cortex), acquired at baseline and competition with BAY 292 is shown in Figure 4.
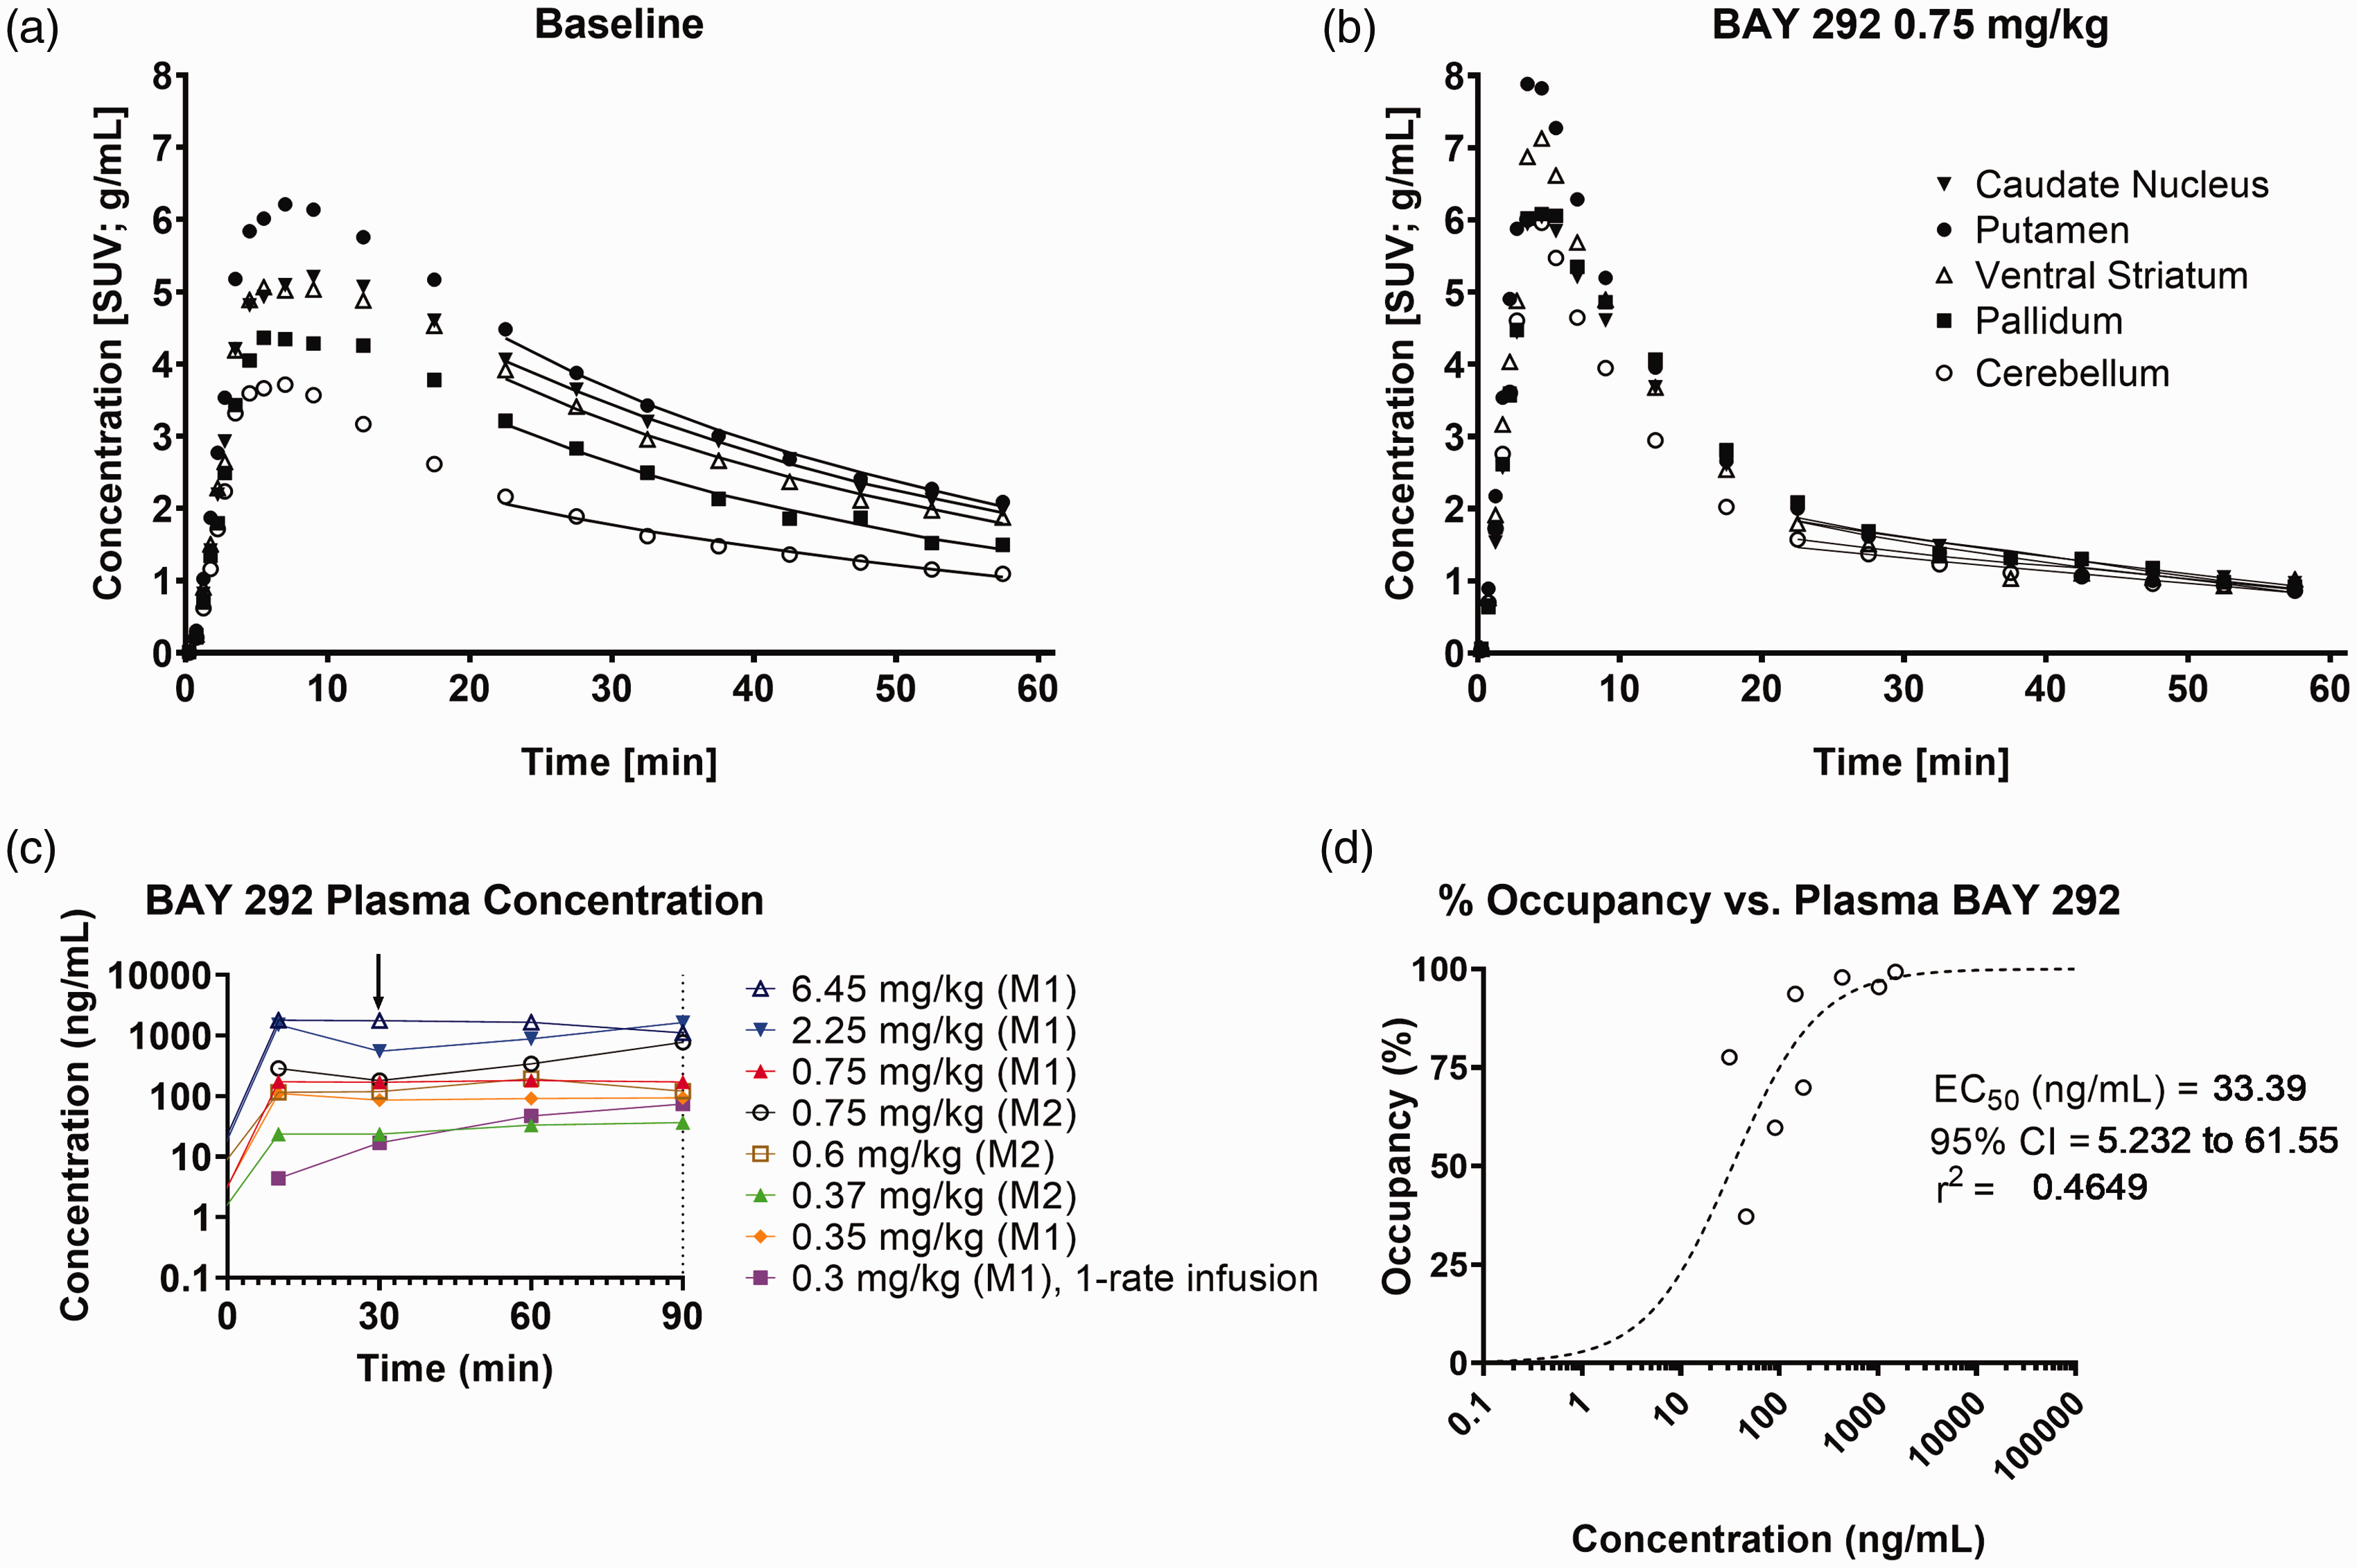
(a, b) Examples of regional time activity curves from one monkey (M2) during the PET scan, (c) BAY 292 plasma concentration profiles, and (d) α2CR occupancy vs. BAY 292 plasma concentration. (a) baseline and (b) competition with BAY 292 0.75 mg/kg in the caudate nucleus (solid triangles), putamen (solid circles), ventral striatum (open triangles), pallidum (solid squares) and cerebellar cortex (open circles). Solid lines correspond to the MA1 fits.The arrow in subplot C indicates start of PET tracer injection.
[11C]ORM-13070 presented a peak whole brain uptake up to ∼4.5 SUV (up to ∼7 SUV in putamen) at 5 min post injection accompanied by a clear washout consistent with reversible kinetics. Examination of TACs acquired at different doses of BAY 292 indicated a dose dependent increase in the washout of [11C]ORM-13070 due to competition with BAY 292, with nearly complete blockade of displaceable binding of [11C]ORM-13070 being achieved at the highest infusion rates. These observations are consistent with the notion that BAY 292 bound to the α2CR in a dose dependent manner.
[11C]ORM-13070 quantitation and estimation of BAY 292 EC50
Initial evaluation of 1TC and 2TC models revealed that none of them was optimal. Based on the AIC, the 2TC model was overall better suited than the 1TC model to describe the data (see also Supplemental Fig. 5A). However, 2TC occasionally did not provide reliable VT values, with some estimates having large standard errors (>25%). MA1 model produced good fits, with VT values in good agreement with both the 1TC model (y = 1.01x–0.46, r = 0.97) and 2TC model (y = 1.05x–0.14, r = 0.96) (Supplemental Fig. 5B), as shown by data at baseline. Overall, the MA1 model was well suited to describe the [11C]ORM-13070 brain data and was more robust in parameter estimates than 2TC, thus was preferred to estimate VT. Regional VT estimated with MA1 at baseline and during administration of BAY 292 are listed in Table 2. A complete list of VT values, which includes extra-striatal cortical regions and white matter is provided in Supplemental Tab. 3.
Regional distribution volume, VT (mL/cm3), of [11C]ORM-13070 at baseline and competition with BAY 292.
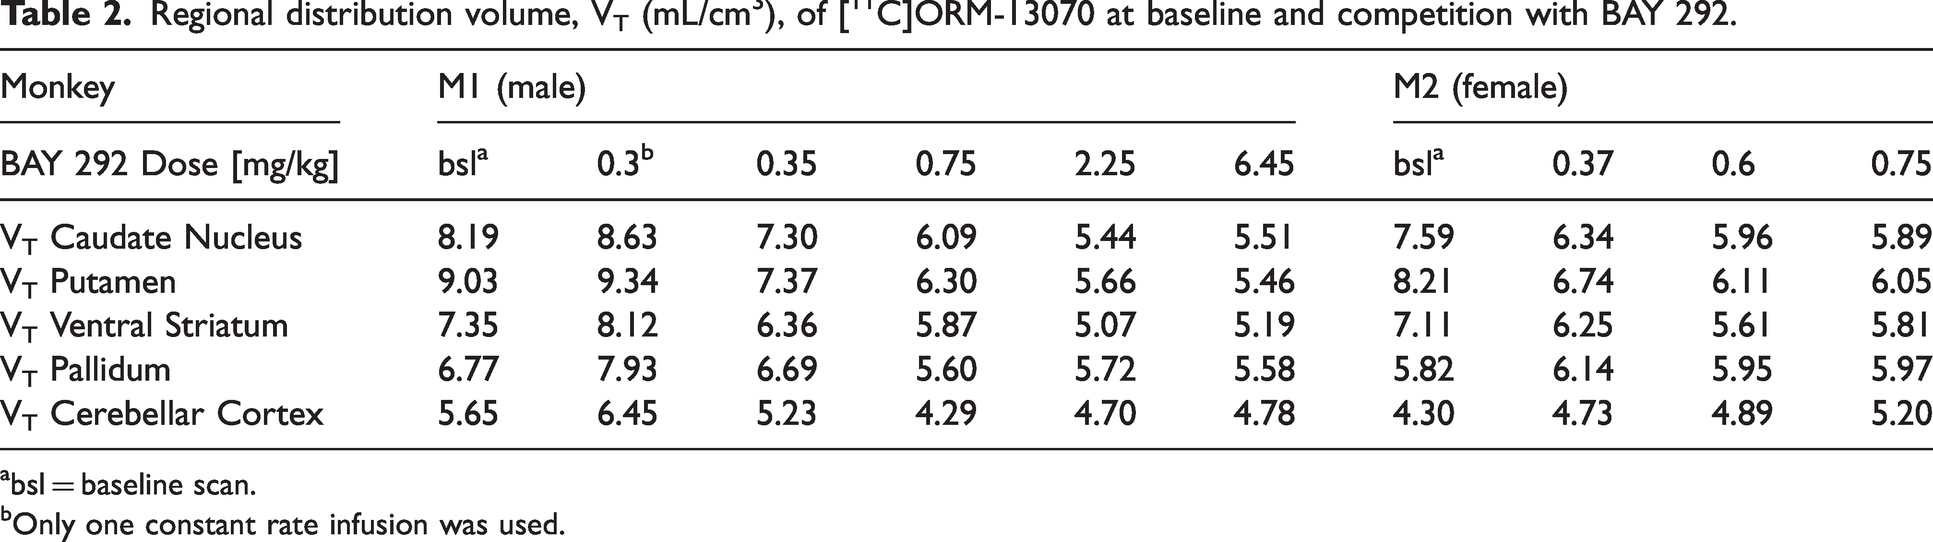
bsl = baseline scan.
Only one constant rate infusion was used.
Baseline regional VT ranged from 8–9 mL/cm3 in putamen to ∼4.5–5.5 mL/cm3 in cerebellar cortex and were generally consistent with the literature describing adrenergic-α2CR density in the primate brain.
6
[11C]ORM-13070 presented relatively low signal-to-noise properties at baseline (
Occupancy plots used to estimate the α2C occupancy from the slope of linear regression as well as the fractional α2C RO values are shown in Figure 5. The α2C-rich regions and the cerebellar cortex were initially included in the analysis. Cerebellar cortex VT appeared to be consistently an outlier with respect to linear regression, so it was excluded from analysis. BAY 292 occupancy estimates ranged between 37.2% and 99.3% for monkey M1, and between 77.6% and 97.9% for monkey M2 (Figure 5(a) and (b)).
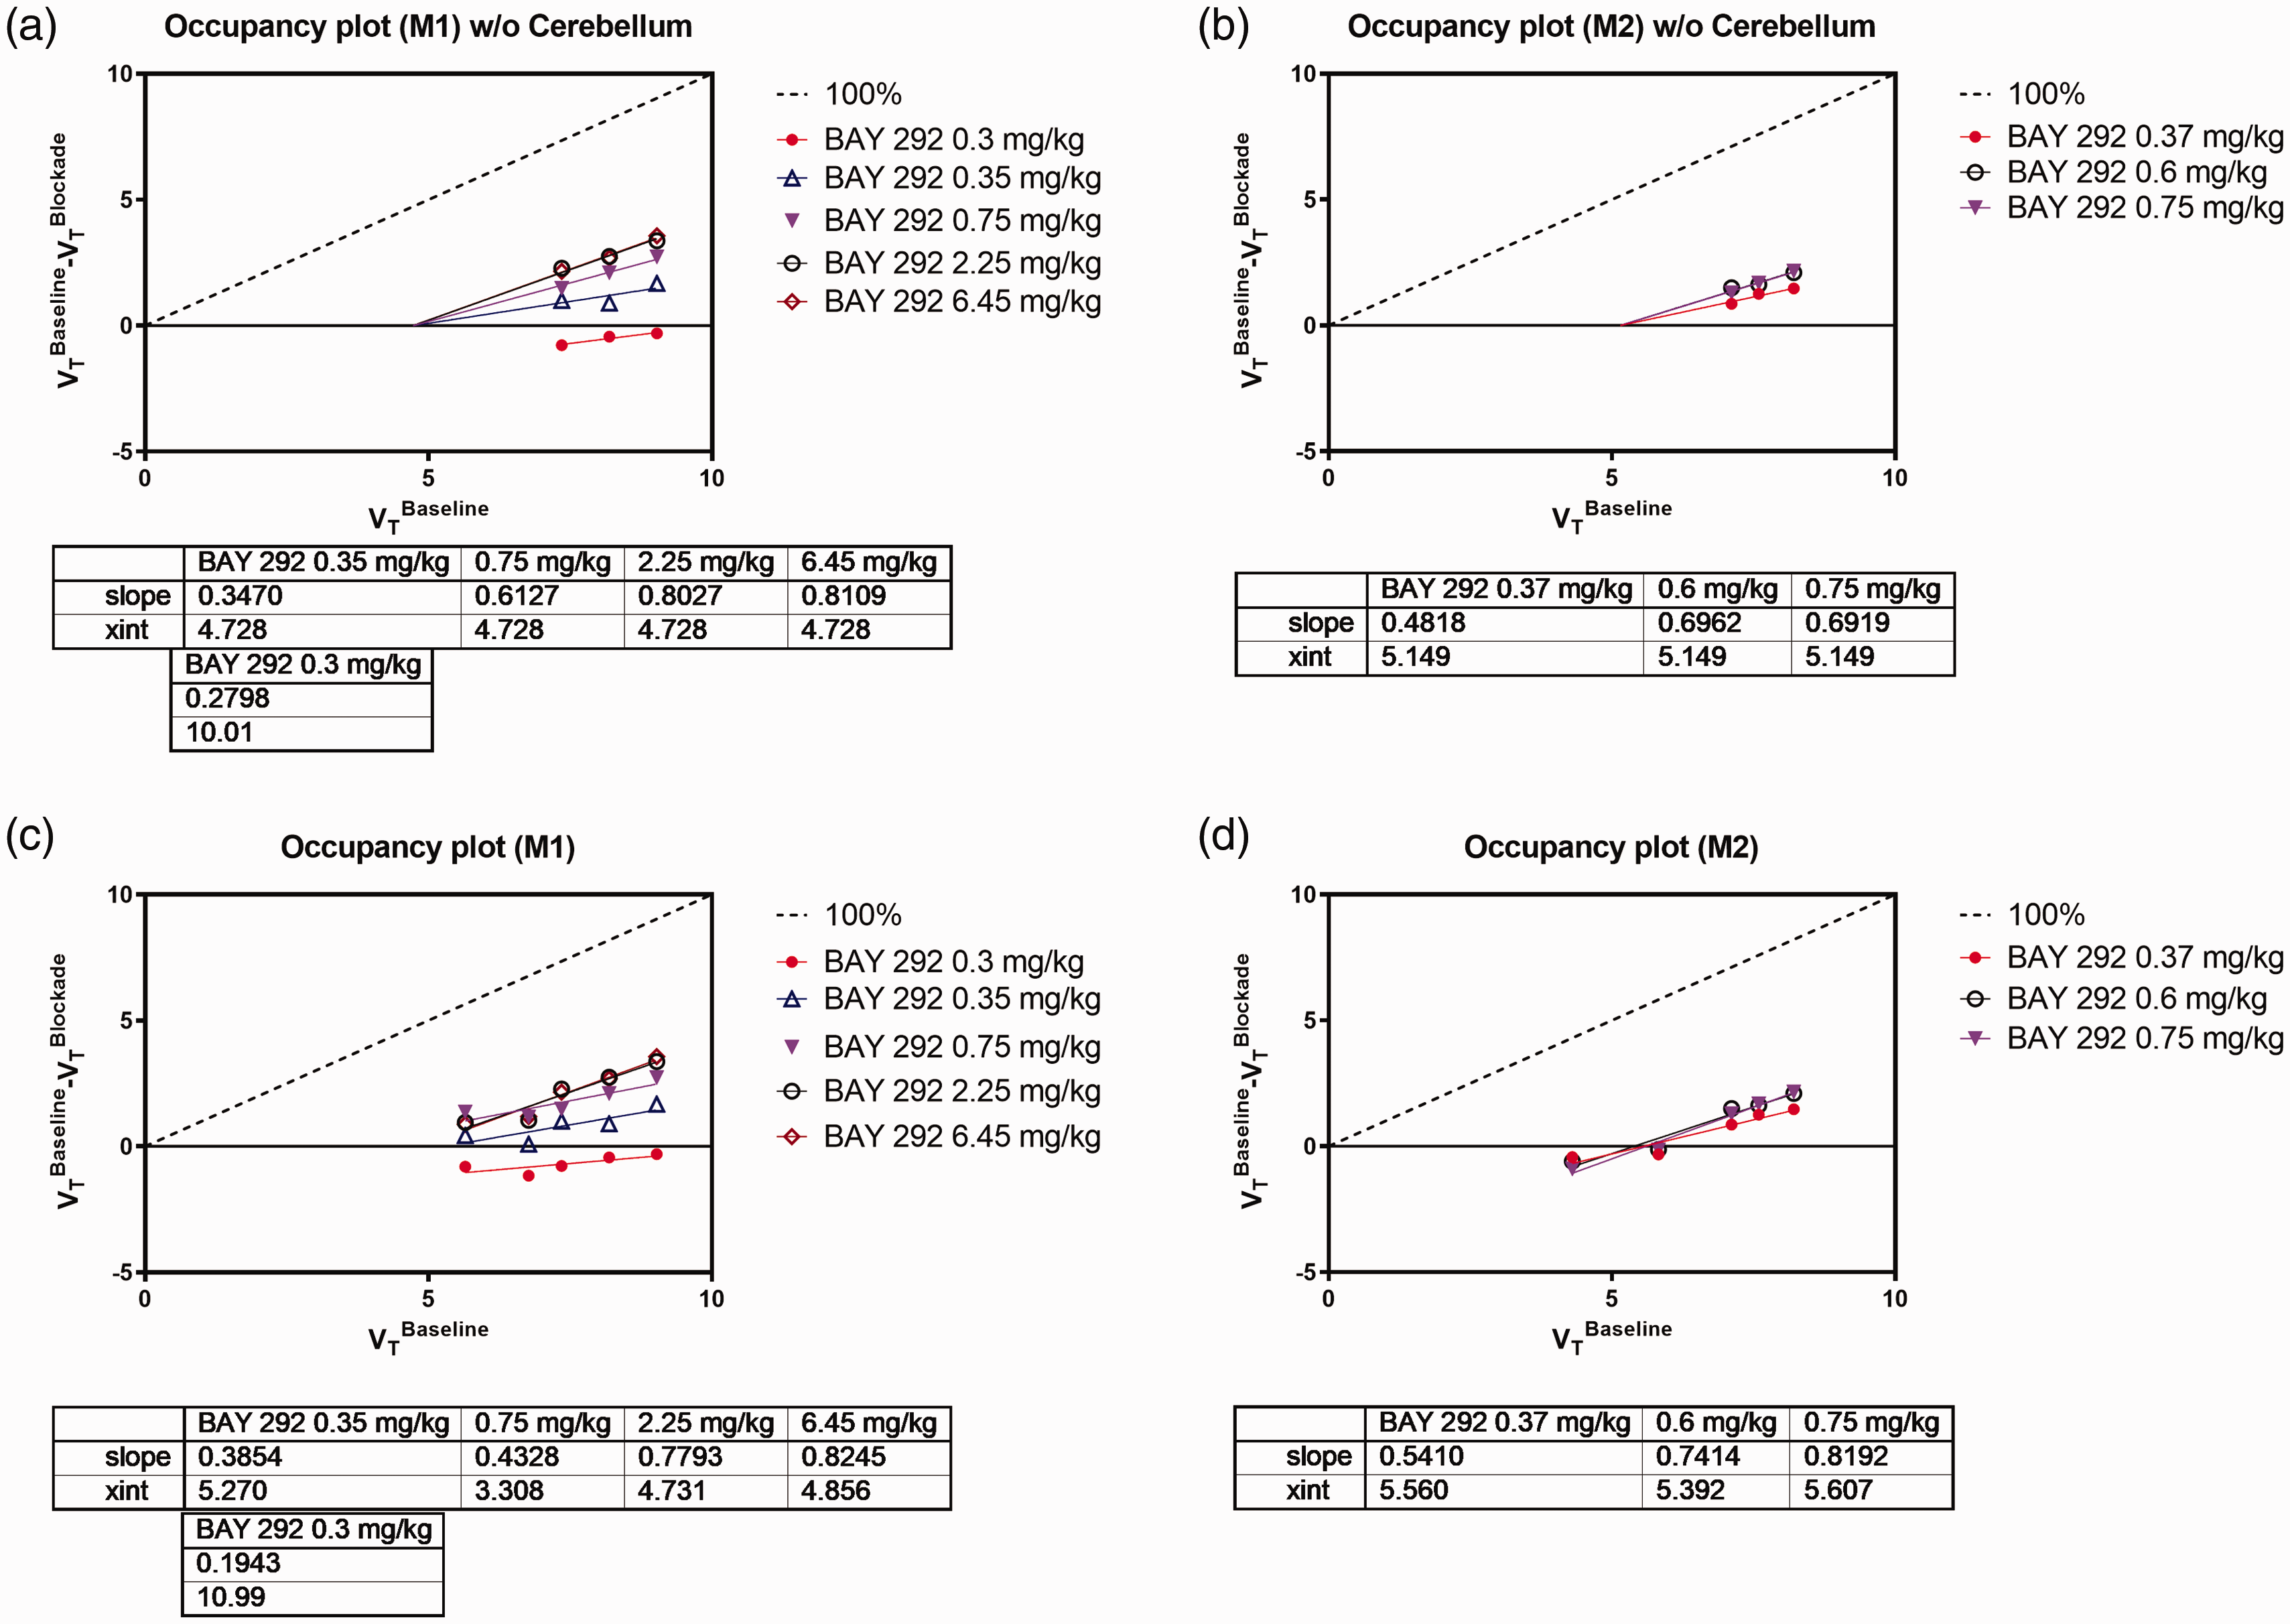
Occupancy plots of the two monkey subjects M1 (a, c), and M2 (b, d) at eight doses of BAY 292 using only VT data from α2C-rich regions (a, b), or using VT data from α2C-rich regions + cerebellar cortex (c, d). Fractional occupancy values (slope), and VND (x-int) are displayed in the inset tables.
Plasma concentration profiles of BAY 292 shown in Figure 4(c) indicate that a steady state in drug concentration was achieved over the duration of all competition PET scans except at 0.3 mg/kg dose administered to monkey M1, for which a single rate BAY 292 infusion was used. Plasma levels were largely in agreement with ranking dose levels except at 0.37 mg/kg dose given to monkey M2, which appears lower than expected when compared to plasma levels at other doses. The α2C occupancy estimates were generally consistent with the average plasma levels during imaging. The relationship between occupancy and BAY 292 plasma concentration is illustrated in Figure 4(d). Despite the limited number of data points at low occupancy levels due to increasing noise at the lower end of the curve, based on the Emax model fit (r2 = 0.47) the effective concentration, EC50, of BAY 292 for α2C was estimated to be 33.39 ± 11.91 ng/mL (95% CI = 5.23–61.55), n = 8.
Evaluation of cerebellar cortex as a reference region
To potentially avoid invasive arterial blood sampling and possibly reduce the uncertainty in drug EC50 estimates, the use of cerebellar cortex as reference region was investigated. At competition scans with BAY 292 changes in VT of −21% to 24% relative to baseline were also observed in the cerebellar cortex, expected to be devoid of α2C receptors and candidate reference region. Cerebellar cortex VT was not correlated with the plasma free fraction fP. By including cerebellar cortex VT in the analysis BAY 292 occupancy estimates were biased by ∼−20%, ranging between 19.4% and 82.5% for monkey M1, and between 54.1% and 81.9% for monkey M2 (Figure 5(c) and (d)). Furthermore, EC50 estimates were 108.4 ng/mL, ∼3-fold larger than EC50 based on VT of α2C-rich regions (data not shown).
[11C]ORM binding potentials, BPND, were also estimated without arterial blood directly from SRTM and the cerebellar cortex as a reference region. Regional BPND values at baseline and competition with BAY 292 can be found in Supplemental Tab. 2. The available specific signal was low, with BPND in α2C-rich regions from 0.3 to 0.8 (M1), and 0.4 to 1.0 (M2). Occupancy values (Supplemental Tab. 2) were biased by −20%, with maximum of 80.8% at the highest dose, similarly to VT based results. The Emax model applied to plasma-occupancy data with occupancy estimated using BPND resulted in EC50 estimates that were ∼6-fold larger than EC50 based on VT of α2C-rich regions (data not shown).
As an exercise, the Emax model was applied without constraining Occmax to 100%. As a result, the EC50 from using VT of α2C-rich regions suffered little change and was estimated to be 30.8 ng/mL, while the EC50 from using either VT of α2C-rich regions + cerebellar cortex, or BPND were estimated to be either ∼2-fold, or ∼3-fold larger, respectively.
Discussion
In this study we evaluated the utility of [11C]ORM-13070 PET to quantify brain α2CR density and evaluate its occupancy by a novel drug candidate. We used the α2CR selective antagonist BAY 292 as a pharmacological challenge to quantify the displaceable binding component of [11C]ORM-13070 and evaluated the relationship between the plasma concentration of BAY 292 and α2CR occupancy. BAY 292 has been shown to be selective for the α2CR (unpublished, internal data), and in vitro autoradiography confirmed that it bound to the same binding site as [3H]ORM-13070 in human caudate tissue.
Previous in vivo evaluation of [11C]ORM-13070 in non-human primates 6 demonstrated reversible kinetics, with highest binding in the striatum (putamen, caudate, ventral striatum, and pallidum) and low levels elsewhere, with the cerebellar cortex demonstrating lowest binding, consistent with the previously described distribution of the α2CR in rodents and humans.25 –27
Previous evaluations of [11C]ORM-13070 in the human brain9 –11 conducted full quantification (including metabolite corrected arterial plasma input function) under baseline conditions, however evaluation of the [11C]ORM-13070 binding following the administration of blocking compounds was conducted using models that utilized the cerebellar cortex as a reference tissue, making the explicit assumption that the cerebellar VT of [11C]ORM-13070 is an accurate representation of its non-displaceable binding (VND) in the α2C-rich regions. While the cerebellar cortex has minimal α2CR expression and should be a viable reference tissue for [11C]ORM-13070, this assumption has not been tested explicitly until now. Indeed, the findings of α2CR occupancies in these studies indicated that the maximal achievable occupancies were significantly lower than 100%. While several biologically plausible explanations are consistent with these findings, a violation of the assumptions inherent to the use of cerebellar cortex as a reference region is one that should be examined.
We found the regional binding of [11C]ORM-13070 to be consistent with previous reports.9 –11 The α2C-rich regions in basal ganglia were the only ones that provided suitable signal-to-noise ratios, and thus the analyses were confined to these regions and the cerebellar cortex. A dose dependent decrease in [11C]ORM-13070 binding was observed after BAY 292 administration, consistent with BAY 292 crossing the blood-brain barrier and binding to α2CR. We initially used the regional VT for α2C-rich regions and the cerebellar cortex to evaluate α2CR occupancy using the occupancy plot 23 and the resulting occupancy curves suggested a maximal occupancy significantly lower than 100%. This finding is consistent with previous studies examining the occupancy of atipamezole and ORM-12741.9,11 Visual inspection of the occupancy plots (Figure 5) indicated that the cerebellar cortex appeared to lie off the linear regression plot of the other regions, consistent with the notion that the cerebellar binding component that cannot be displaced by BAY 292 is significantly lower than that in the α2C-rich regions. If this were the case, it would violate one of the assumptions of the occupancy plot (that the non-displaceable binding be equal in all regions evaluated) and would lead to an underestimation of the maximal achievable occupancy and/or a bias in the estimation of the EC50. Removal of the cerebellar cortex from the list of regions used to evaluate occupancy via the occupancy plot provided better linear fits, higher levels of occupancy and higher estimates of non-displaceable binding (VND) in the α2C-rich regions. The use of these occupancy data in conjunction with the plasma concentration of BAY 292 provided a maximal occupancy of 100%. By comparison, the inclusion of cerebellar cortex, whether in the arterial blood-based analysis using VT or in the non-invasive analysis using BPND, provided a maximal occupancy of ∼80%, while the resulting EC50 was determined to be about 3- to 6-fold higher.
The reasons for the observed regional differences in non-displaceable binding cannot be conclusively established with the data from our study. While [11C]ORM-13070 binding to another target for which BAY 292 has no affinity could produce the results we are seeing, no evidence for such a target is indicated by the examination of the available data on ORM-13070 selectivity. The fact that similar features are seen with several different blocking compounds (BAY 292, atipamezole and ORM-12741) would make this possibility even more unlikely. A more likely scenario is a difference in the “non-specific” binding between the cerebellar cortex and α2C-rich regions, possibly attributed to different proportions of white and grey matter in the two structures. While the cerebellar cortex is often used as a reference region for PET ligands with targets absent from the cerebellar cortex, no systematic evaluation of the levels of non-specific binding between the cerebellar cortex and basal ganglia has been conducted. Past experience indicates that any differences in non-specific binding are likely to be small, and for ligands with a high BPND such differences are likely to be inconsequential. However, for ligands with low BPND, such as [11C]ORM-13070, even small differences in non-specific binding can produce substantial biases.
Some limitations of our study are discussed below. We observed an occupancy result in one of our scans (0.37 mg/kg data point) that appears to be out of pattern with other data points. We could not find an objective reason for such a divergence, and therefore have included it in the final analysis. Exclusion of this data point would cause a right shift of Emax fit resulting in an EC50 of 51.27 ± 12.03 ng/mL (95% CI = 21.83–80.71) and an improved goodness of fit (r2 = 0.81). The overall conclusions of the study would remain similar.
The use of anesthesia in preclinical brain PET studies can have an impact on receptor binding and thus also represents a main confounding factor for proper translational understanding of animal models, as clinical PET studies are typically performed without the use of anesthesia. 28 Despite the considerable research progress that has been made over the past years towards motion tracking with subsequent motion correction reconstruction, this technique is not yet readily available to most research centers so that anesthetized animals are still most commonly used in the majority of studies conducted. Although interactions between anesthesia and receptor binding cannot be ruled out completely, literature evidence does not provide hints on marked differences for noradrenergic transporters in primates.29,30 In addition, as a PET study usually provides relative measurements, the integrity of the study itself is not considered as biased by anesthetic effects.
Finally, the low plasma free fraction (fp) of ORM-13070 (∼6–7%, determined in this study for informative purposes only) may impact its application in PET studies not using a reference region, as accurate determination of individual scan fp may not be feasible. However, a number of tracers with an even lower free fraction are used successfully, with the understanding that either fp is assumed to be unaffected by experimental conditions, or it is assessed on a group rather than an individual level.31 –33
In summary, despite the limitations of this tracer (low specific binding signal, low free fraction, imperfect reference region), and in the absence of superior alternatives, this study demonstrated the utility of [11C]ORM-13070 as a PET-radioligand for the study of α2CR in the non-human primate brain, paving the way for its use in BAY 292 clinical studies. It was also observed that previously described models for RO calculation using the cerebellar cortex as a reference region for ORM-1307010,11 may lead to bias, and methods avoiding its use should be considered preferable, at least for datasets revealing low signal-to-noise-ratios or binding potentials, as observed in this study. Finally, a dose dependent increase in RO after BAY 292 administration was observed, confirming BBB penetration and target engagement of the drug candidate.
Supplemental Material
sj-pdf-1-jcb-10.1177_0271678X241291949 - Supplemental material for Preclinical in vitro and in vivo evaluation of [11C]ORM-13070 as PET ligand for alpha-2C adrenergic receptor occupancy using PET imaging in non-human primates
Supplemental material, sj-pdf-1-jcb-10.1177_0271678X241291949 for Preclinical in vitro and in vivo evaluation of [11C]ORM-13070 as PET ligand for alpha-2C adrenergic receptor occupancy using PET imaging in non-human primates by Isabel Piel, Cristian C Constantinescu, David de la Puente Bethencourt, David R Bonsall, Eugenii A Rabiner, Kenneth R Zasadny, Amy Llopis Amenta, Lisa A Wells, Thorsten Poethko, Wolfgang Prange and Martina Delbeck in Journal of Cerebral Blood Flow & Metabolism
Footnotes
Funding
The author(s) received no financial support for the research, authorship, and/or publication of this article.
Acknowledgements
The brain samples were obtained from The Netherlands Brain Bank, Netherlands Institute for Neuroscience, Amsterdam. All material has been collected from donors for or from whom a written informed consent for a brain autopsy and the use of the material and clinical information for research purposes had been obtained by the NBB. The authors thank all scientists from the different laboratories who contributed to this study: Shafina Khatun (Invicro LLC, London, UK) for tissue preparations and Giulia Boscutti (Invicro LLC, London, UK) for supporting the [11C]-radiochemistry, Wendy Marriner, Esteban Oyarzabal (Charles River Laboratories, Matawan, MI, USA) and Ron Mays (NorthEast BioAnalytical Laboratories LLC, Hamden, CT, USA). The following Bayer AG colleagues also receive special thanks: Simon Rataj and Leon Selent for synthesizing [3H]ORM-13070, Dieudonné Tshitenge for NMR analysis of [3H]ORM-13070, Christoph Thiel for supporting this study with PK predictions and Nicola Busch for editorial support during the preparation of this manuscript.
Declaration of conflicting interests
The author(s) declared the following potential conflicts of interest with respect to the research, authorship, and/or publication of this article: DPB, IP, TP and WP are employees of Bayer AG and may own shares or share options. MD was employee of Bayer AG at the time of conducting the study and data analysis. The study was funded by Bayer AG.
ALA, CCC, DRB, EAR, KRZ, LAW are full-time employees of Invicro LLC.
Authors’ contributions
Participated in research design: ALA, DPB, DRB, CCC, MD, IP, EAR, WP, LAW, KRZ
Conducted experiments: DRB, TP
Performed data analysis: DPB, DRB, CCC, MD, IP, TP, EAR, WP, LAW, KRZ
Wrote or contributed to the writing of the manuscript: ALA, DPB, DRB, CCC, MD, IP, TP, EAR, WP, LAW, KRZ
Supplementary material
Supplemental material for this article is available online.
References
Supplementary Material
Please find the following supplemental material available below.
For Open Access articles published under a Creative Commons License, all supplemental material carries the same license as the article it is associated with.
For non-Open Access articles published, all supplemental material carries a non-exclusive license, and permission requests for re-use of supplemental material or any part of supplemental material shall be sent directly to the copyright owner as specified in the copyright notice associated with the article.