
Abstract
Neurological symptoms are central to Myalgic Encephalomyelitis/Chronic Fatigue Syndrome (ME/CFS), yet its underlying neurophysiological mechanisms remain elusive. We examined a neglected aspect of task-based functional MRI, focusing on how blood oxygenation level-dependent (BOLD) signals alter during cognitive tasks in ME/CFS. This prospective observational study utilised MRI scans on ME/CFS participants and healthy controls (HCs) with sedentary lifestyles (ACTRN12622001095752). Participants completed two blocks of a Symbol Digit Modalities Test, with 30 trials per block split into two sets. The fMRI signal changes between blocks and sets were compared within and between groups. Thirty-four ME/CFS participants (38 years ± 10; 27 women) and 34 HCs (38 ± 10; 27 women), were evaluated. In the second task block, ME/CFS participants exhibited increased activation in the right postcentral gyrus, contrasting with decreased activation in multiple regions in HCs. These results were further confirmed by significantly higher bilateral dynamic changes (2nd vs 1st set) in the motor, sensory and cognitive cortex in ME/CFS compared to HCs and significant correlations between those changes in the left primary motor cortex with fatigue severities. BOLD adaptation, potentially improving energy economy, was absent in ME/CFS, which may provide an underlying neurophysiological process in ME/CFS.
Keywords
Introduction
Myalgic Encephalomyelitis/Chronic Fatigue Syndrome (ME/CFS) is a debilitating disease of unknown aetiology, affecting 0.4–1.0% of the population worldwide.1,2 The hallmark feature is severe and persistent fatigue that does not improve following rest.3,4 As the exhaustion is experienced not only physically but also mentally, the involvement of the brain in the pathophysiology of ME/CFS is plausible. 1 This notion is further strengthened by well-documented neurological symptoms, autonomic nervous system and sleep disorders, attention deficits, impaired cognition, reduced information processing speed, and altered sensory and pain perception. 2
To better understand brain function in patients with ME/CFS, multiple neuroimaging techniques and studies have been performed. Yet, few consistent findings have been observed in ME/CFS. 5 The most frequently reported observation from 11 studies using different neuroimaging techniques is the larger recruitment of brain regions during cognitive tasks in ME/CFS patients compared to healthy controls (HCs). 5 Patients with other neuropathologies resulting in diffuse damage, such as traumatic brain injury, have similarly shown augmented functional recruitment despite normal cognitive task performance. 6 Moreover, traumatic brain injury patients showed progressively increased blood oxygenation level-dependent (BOLD) signals over time, while HCs’ BOLD activities decreased after multiple trial repetitions, a phenomenon termed BOLD adaptation. 7 Although the mechanics of BOLD adaptation are unclear (resulting from the dynamics of neural processing, regional blood flow regulation, or both), it is believed to improve the energy efficiency of neural computations. 8
Here, we seek to investigate BOLD adaptation in ME/CFS with the hypothesis that sustained cognitive tasks induce BOLD adaptation in HCs but not in patients with ME/CFS. Additionally, we aim to confirm the hypothesis that the neural correlates of cognitive function in ME/CFS will show a larger recruitment of brain areas compared to HCs, employing a well-controlled study design. Improving reproducibility is imperative in neuroscience, 9 and it is particularly pressing in ME/CFS due to the controversies surrounding this ambiguously defined illness. Previous studies on ME/CFS were limited by small sample sizes, disease diagnosis criteria, and confounding factors such as deconditioning. 5 This study utilises data from a cross-sectional multimodal MRI study of ME/CFS, 10 supported by documented power analysis, confirmed diagnoses by two clinicians, and HCs with sedentary lifestyles.
Materials and methods
Standard protocol approvals, registrations, and patient consents
This prospective study used task functional MRI (tfMRI) data collected from August 2020 to December 2022 (Figure 1) for the ongoing cross-sectional multimodal MRI study of ME/CFS, 10 approved by the University of the Sunshine Coast Ethic committee (A191288) and registered with The Australian New Zealand Clinical Trials Registry (ACTRN12622001095752). The study was conducted in accordance with the Australian National Statement on Ethical Conduct in Human Research 2007 (updated 2018) and the Helsinki Declaration. Written informed consent was obtained for each participant. A detailed description of the study design, consecutive sample selection, and inclusion and exclusion criteria can be found in the recently published protocol paper. 10 The primary outcome measures were BOLD signal changes. Secondary outcome measures were the behavioural scores. Additional comparisons of primary outcome measures were also conducted, including all 54 patients with ME/CFS.
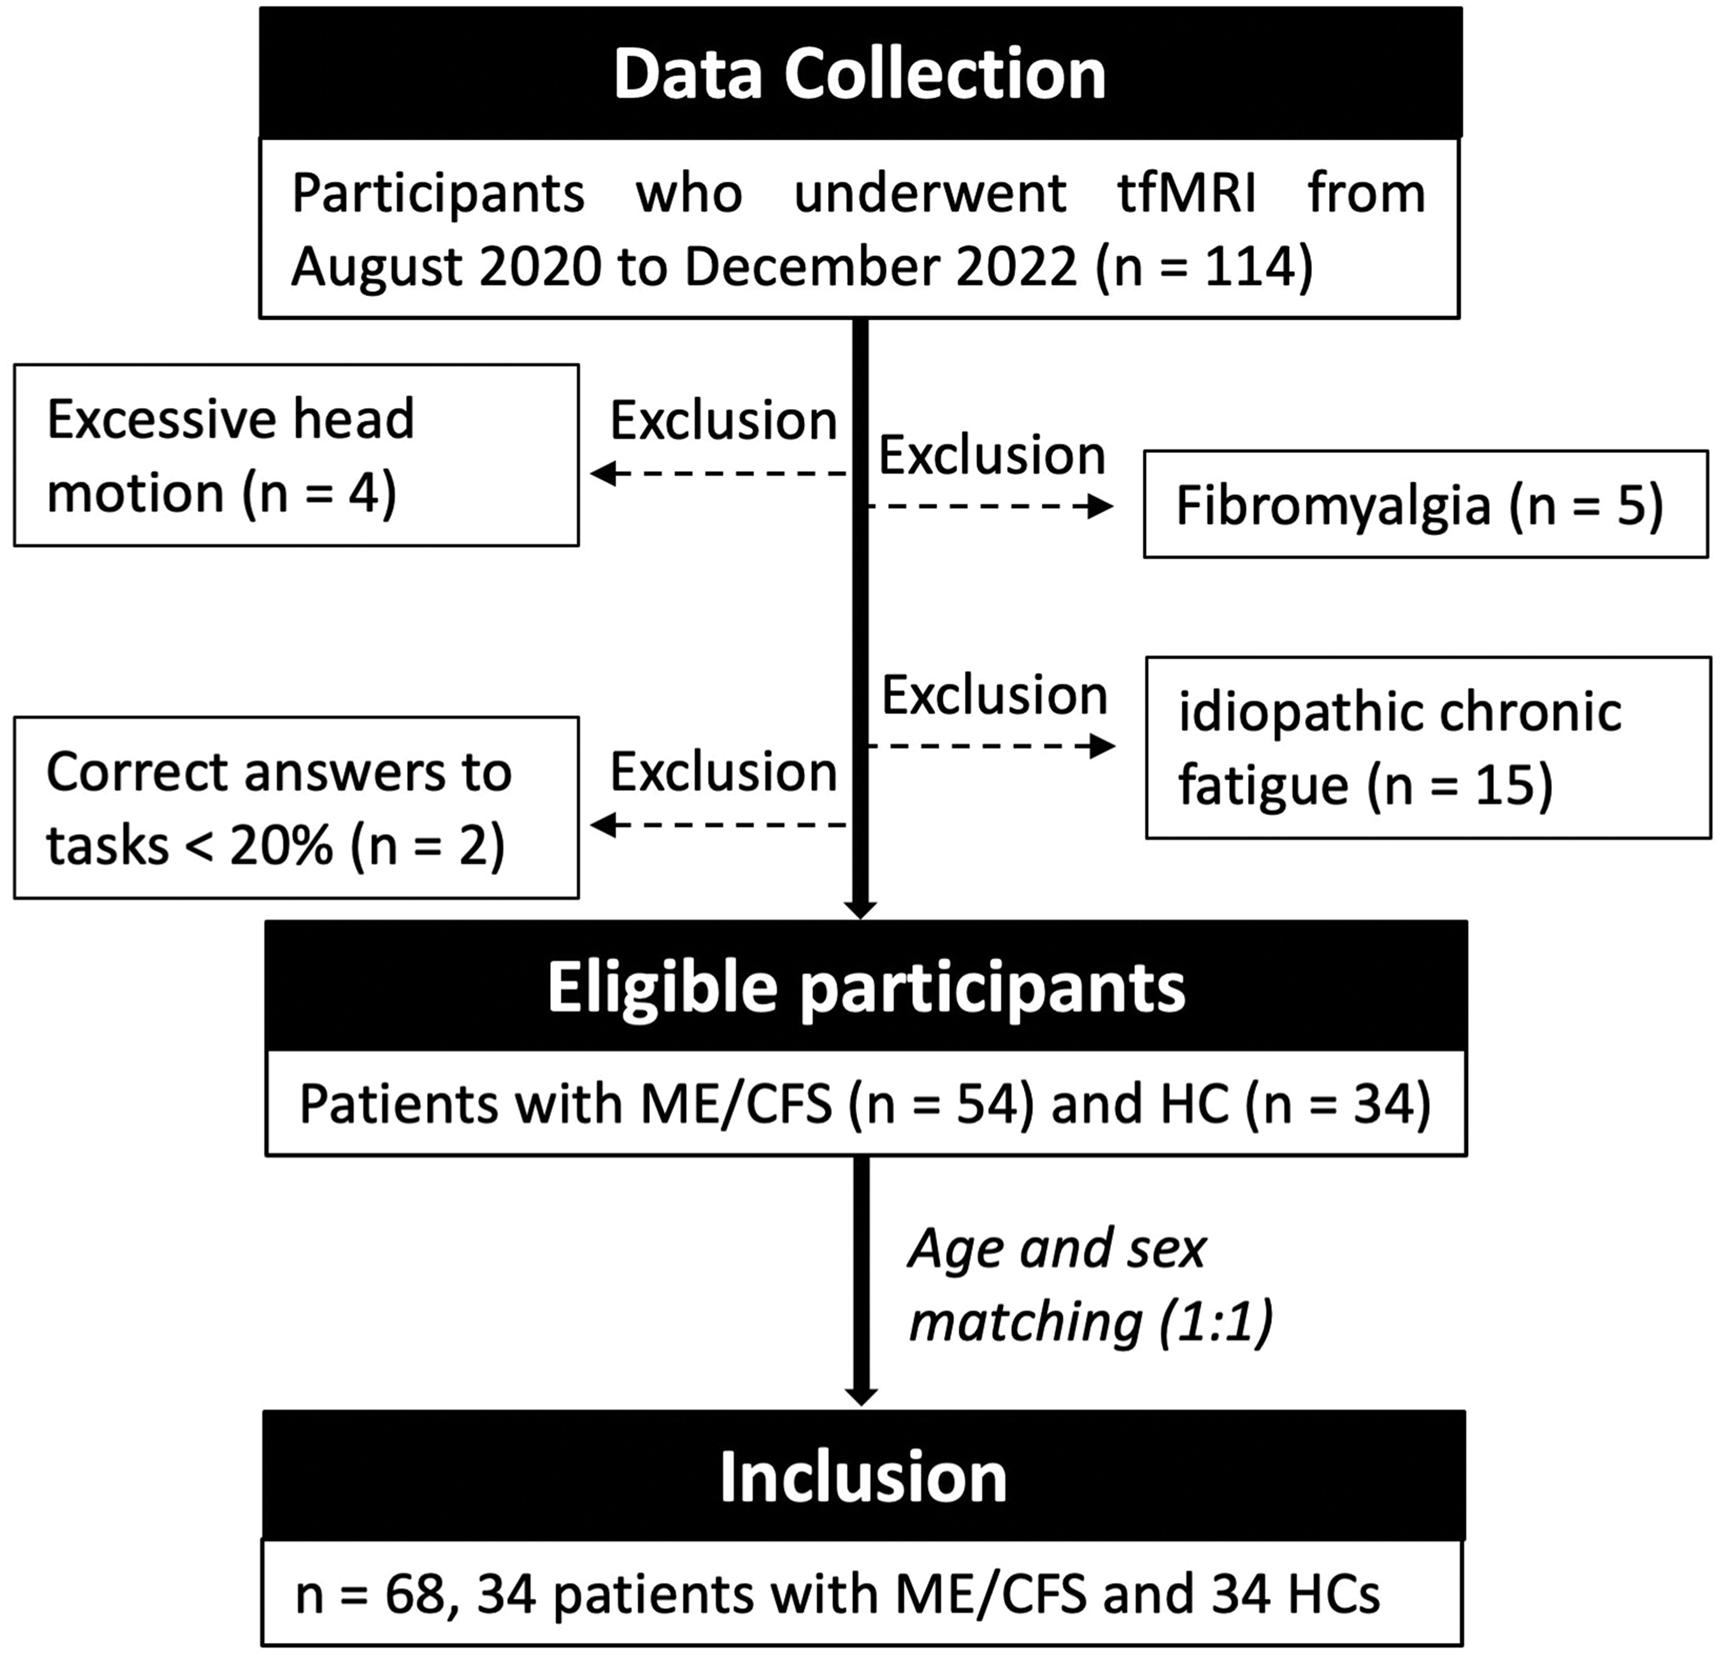
Flowchart of participants. A total of 68 who underwent task functional MRI (tfMRI) were included in the study.
Clinical, physical activity and neuropsychological assessment
A consensus diagnosis of ME/CFS was employed by two clinicians (R.A.K. and P.D.) using the Canadian Consensus Criteria 2003 (CCC) 11 to mitigate the risk of an ill-defined ME/CFS patient cohort.
The study recruited HCs with sedentary lifestyles (<120 min of moderate or high-intensity activity per week) to mitigate the risk of identifying brain structural or functional differences resulting from ME/CFS deconditioning, as a sedentary lifestyle itself may affect brain structure and function. Their activity levels were further monitored with an Actigraph GT3X-BT device (Actigraph LLC., United States) during seven days of pre- and post-multimodal MRI scans. Metabolic equivalent rates (MET) were calculated using ActiLife software. 12
Neuropsychological assessments in this study included long-term (the past 6 months) fatigue severity and frequency, the fatigue state questionnaire (FSQ), depression and anxiety scores, and in-scan Symbol Digit Modalities Test (SDMT) accuracy and response time. The long-term fatigue severity and frequency were extracted from the DePaul Symptom Questionnaire-2 (DSQ-2). 13 The FSQ was completed before and after the MRI, including 4 questions focusing on current fatigue levels. 14 Depression and anxiety were evaluated using the Hospital Anxiety and Depression Scale (HADS). 15
Imaging protocol
Brain images were acquired using a 3 T Skyra MRI scanner (Germany, Erlangen) with a 64-channel head coil. The structural MRI data were collected using a T1-weighted magnetization prepared rapid gradient-echo sequence (dimension 256 × 256 × 208, 1 mm3 isotropic voxels, TR/TE 2,200/1.71 ms, flip angle 7°). The tfMRI data (800 volumes) were collected using a multiband echo-planar imaging sequence (dimension 74 × 74 × 60, 3 mm3 isotropic voxels, multiband = 5, Parallel Reduction Factor In-plane = 2, TR/TE 800/33 ms, flip angle 65°). The fMRI paradigm consisted of two task blocks where participants performed an SDMT alternating with resting conditions. The SDMT requires participants to determine if the lower symbol digit pair agrees with upper symbol digit references (Figure 2). All participants were SDMT task naïve and did not practice the task before MRI scans. Each task block was 240 s long with 30 SDMT trials. Each trial has a duration of 5 s with an averaged 3 s inter-trial interval (ranged randomly from 1–5 s). The long task block used in this study was adapted from the previous study 7 to provoke BOLD adaptation. Participants kept their eyes open with a cross-fixation during the inter-trial intervals and the resting blocks. 10
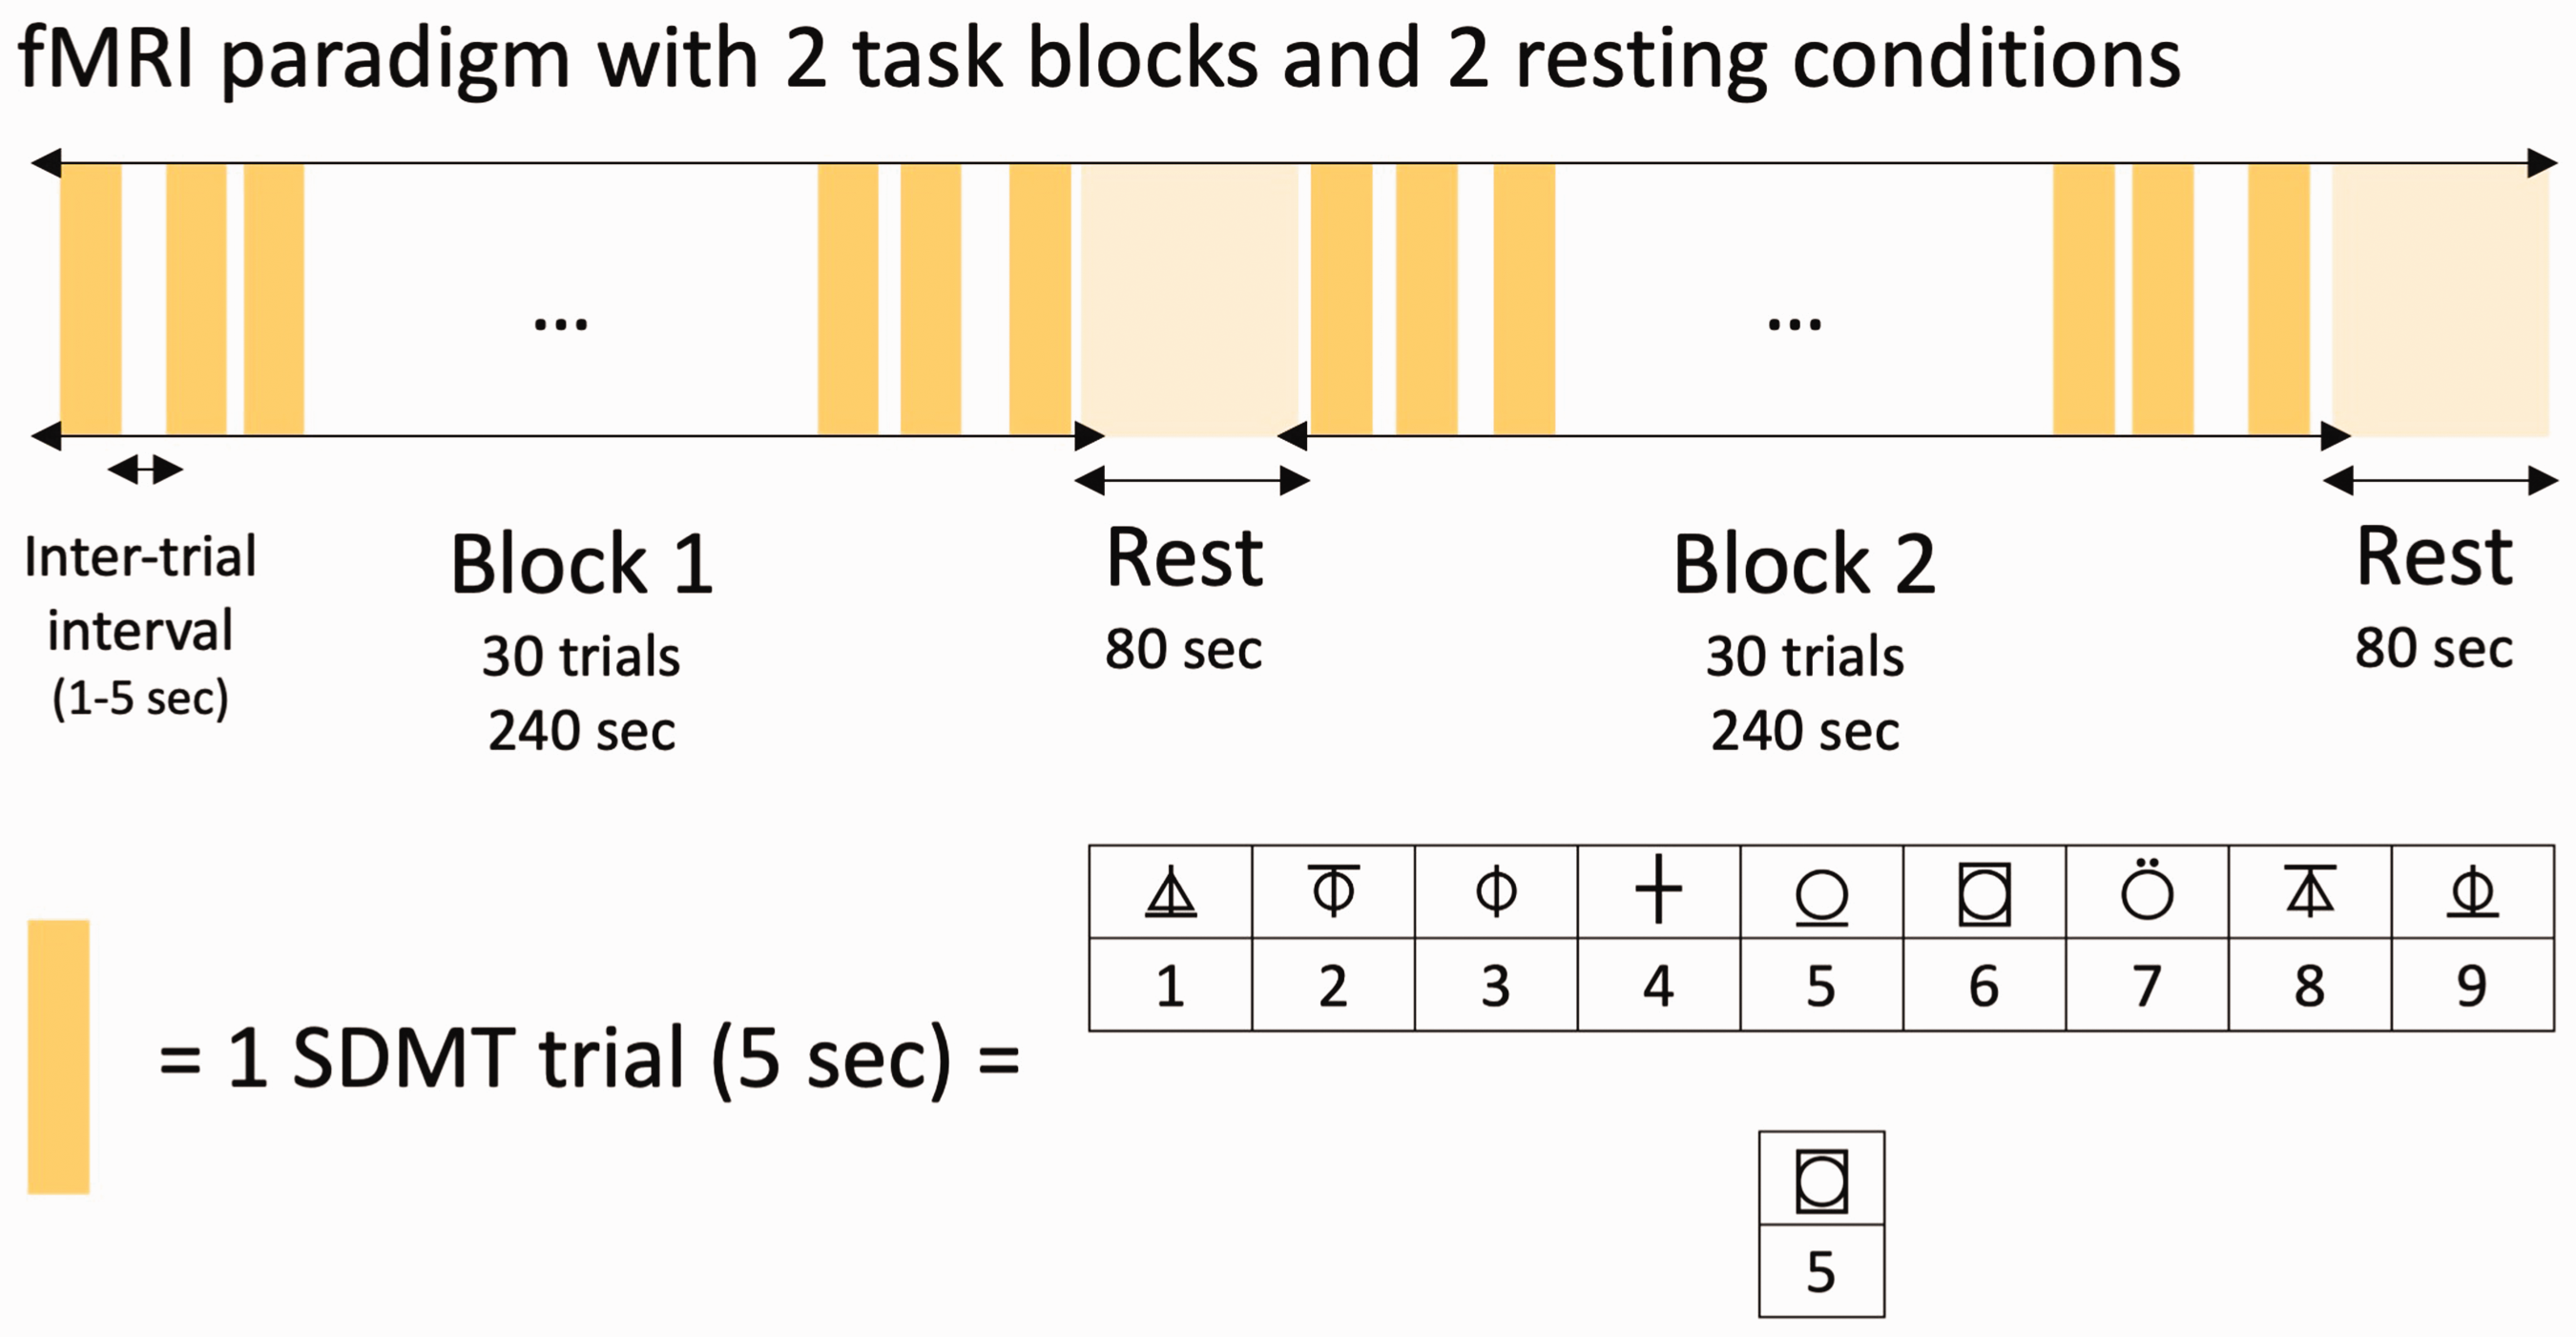
The fMRI paradigm. Symbol Digit Modalities Test (SDMT) trials were presented to participants in a semi-random block design paradigm. Each trial was presented for 5 seconds (s) with a randomized inter-trial interval ranging from 1 to 5 seconds.
Imaging preprocessing
Images were preprocessed using SPM12 (Statistical Parametric Mapping, Wellcome Trust Centre for Neuroimaging, London, United Kingdom), including: 1) motion correction; 2) coregistration of structural images to the canonical template; 3) coregistration of the motion-corrected fMRI volumes to the corresponding structural image; 4) unified segmentation 16 of the structural images with the optimised Markov Random Field value of 4; 17 5) DARTEL (diffeomorphic algorithm based on exponentiated lie algebra) 18 normalisation, warping the subjects’ tissue class images together to create one template; 6) normalisation of all images to Montreal Neurological Institute (MNI) space using the study-specific template and each subject’s deformation field; 7) smoothing with a 6 6 × 6 × 6 mm3 Gaussian kernel.
BOLD responses associated with tasks
The BOLD responses associated with tasks were analysed using the two-level general linear model approach of SPM12. At the subject level, an event-related analysis allowing time modulation was performed. Each neural event was defined by the stimulus onset time, and its duration was determined by the response time of each trial. BOLD responses associated with tasks were determined by fitting convolutions of neural events with a canonical hemodynamic response function with time and dispersion derivatives. Instead of averaging responses across trials or conditions, the event-related modelling examines how the amplitude or shape of the fMRI signal varies as a function of time within each trial or condition. The subject-specific activation maps were built using only correctly answered trials, with realignment parameters used as nuisance regressors. Four subject-level contrasts were determined for both task blocks (60 trials) vs rest, Block 1 (30 trials) vs Block 2 (30 trials), Block 1 – 1st set (15 trials) vs Block 1 – 2nd set, and Block 2 – 1st set vs Block 2 – 2nd set.
At the group level, first-level contrasts were entered into random-effects one-sample t-tests for within-group analyses and two-sample t-tests for between-group analyses. To determine if one set of tasks (15 trials) contains enough signals for activation estimation, one-sample t-tests of a set of tasks were visually compared with all tasks (Supplementary S1). Furthermore, multiple regression analyses were conducted to test for correlations between behavioural scores and BOLD signal activation. Sex, age, BMI, depression, and anxiety scores were included as nuisance covariates in all analyses. Significance was determined by family-wise error correction at the cluster level, with P values (PFWE) < 0.05 considered significant, using cluster-forming uncorrected P < 0.001 at the voxel level and a minimum cluster size of 25 voxels.
Statistical analysis of demographic and behavioural data
The Shapiro-Wilk test was used to assess the normality of individual measures, and equivalent non-parametric tests were conducted for variables that were not normally distributed. Demographic data and behavioural scores were compared between groups using MATLAB’s (The MathWorks, Inc., Natick, Massachusetts, United States) two-sample t-test for equal means without assuming equal variances. Within-group performance analyses were conducted using two-way repeated-measures ANOVA followed by Tukey’s multiple comparisons test, performed using GraphPad Prism version 9.5.1 for MacOS (GraphPad Software, San Diego, California, USA).
Results
Participant characteristics
Sixty-eight participants (mean age: 38 ± 10 [standard deviation, SD]; 54 women), including 34 ME/CFS participants (mean age: 38 ± 10 SD; 27 women) and 34 HCs (mean age: 38 ± 10 SD; 27 women), were included in this study (Figure 1). The demographic data and behavioural scores are reported in Table 1. ME/CFS participants achieved similar SDMT accuracy to HCs (P = 0.58) but required significantly more time to respond correctly (P = 0.006). In ME/CFS participants, SDMT accuracies were significantly increased (P < 0.05), while response times were significantly decreased (P < 0.001) during the second set of trials compared to the first set in the first block. In HCs, SDMT response times were significantly decreased (Block 1 2nd set vs Block 1 1st set, P < 0.001; Block 2 1st set vs Block 1 2nd set, P < 0.05). There were no other significant differences in accuracies and response times among different sets of trials (Supplementary S2).
Demographic and behavioural information of the participants.
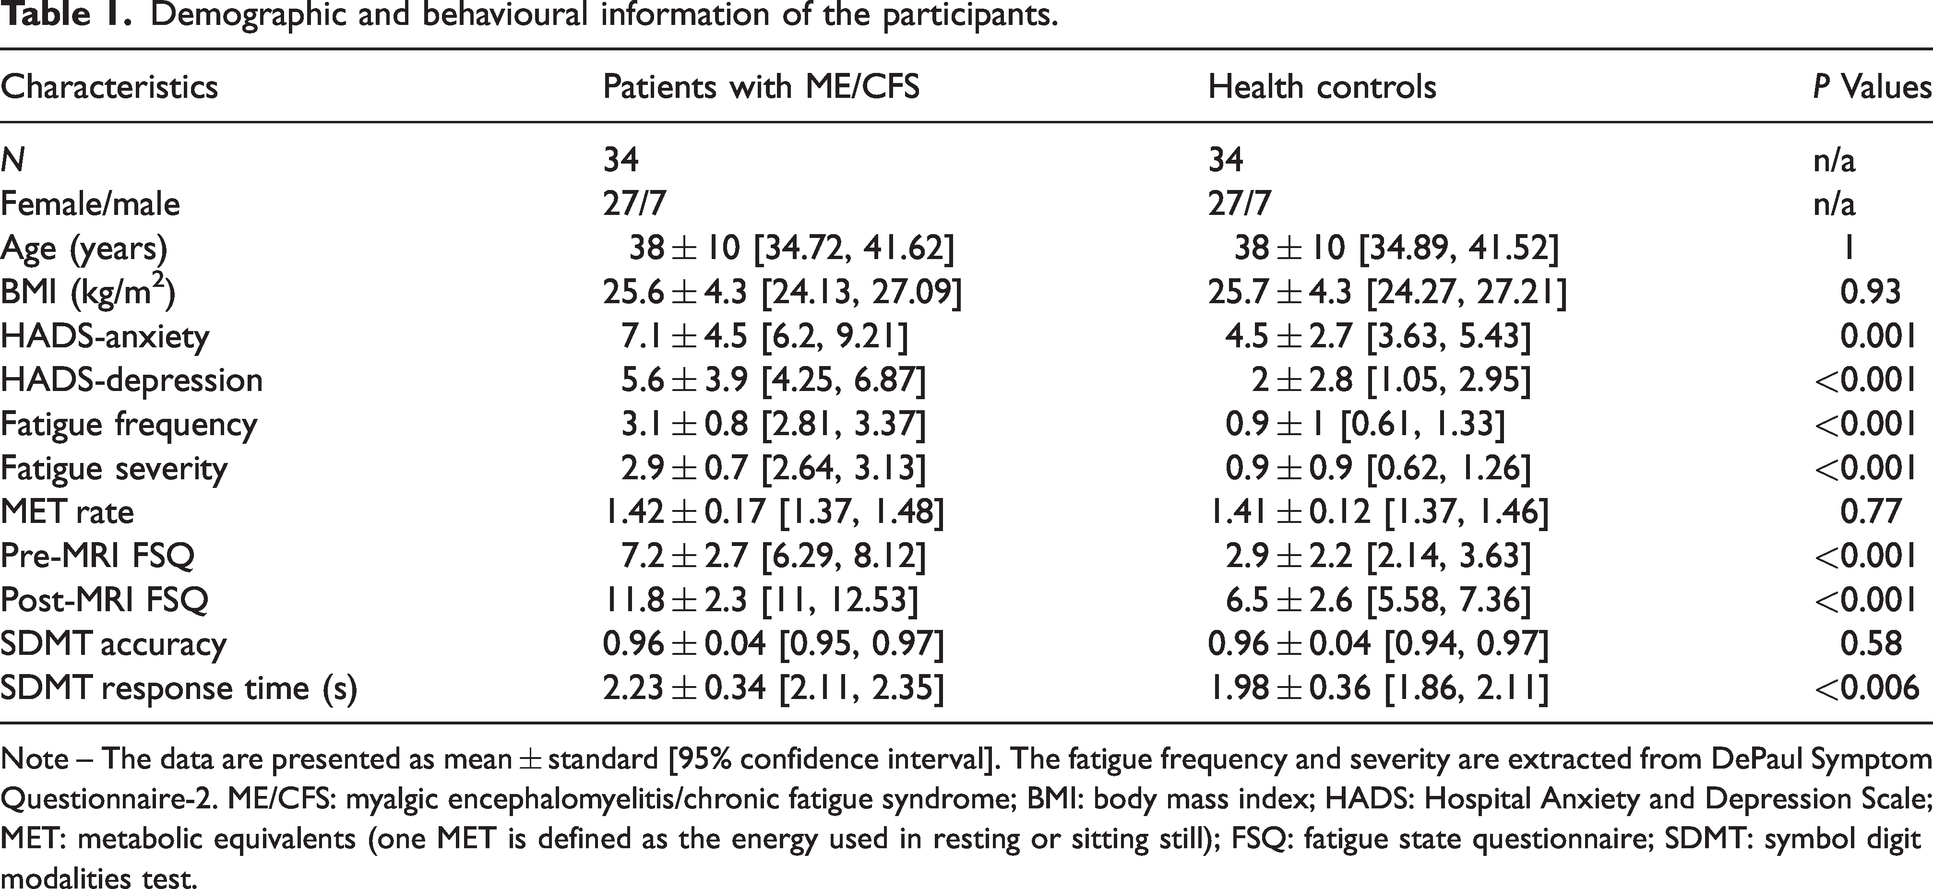
Note – The data are presented as mean ± standard [95% confidence interval]. The fatigue frequency and severity are extracted from DePaul Symptom Questionnaire-2. ME/CFS: myalgic encephalomyelitis/chronic fatigue syndrome; BMI: body mass index; HADS: Hospital Anxiety and Depression Scale; MET: metabolic equivalents (one MET is defined as the energy used in resting or sitting still); FSQ: fatigue state questionnaire; SDMT: symbol digit modalities test.
Neural correlates of sustained cognitive function
Within-group analyses (1-sample t-tests) of BOLD responses associated with the SDMT showed similar neural correlates for both groups, encompassing areas bilaterally in all cerebral lobes and the cerebellum. Patients with ME/CFS tended to recruit broader brain areas in the right dorsolateral prefrontal and left somatosensory cortex than HCs (Figure 3). However, between-group analysis (2-sample t-test) comparing ME/CFS and HCs found no significant difference. Multiple regression analysis did not reveal any significant correlations between SDMT-related BOLD changes and behavioural measures in either group.
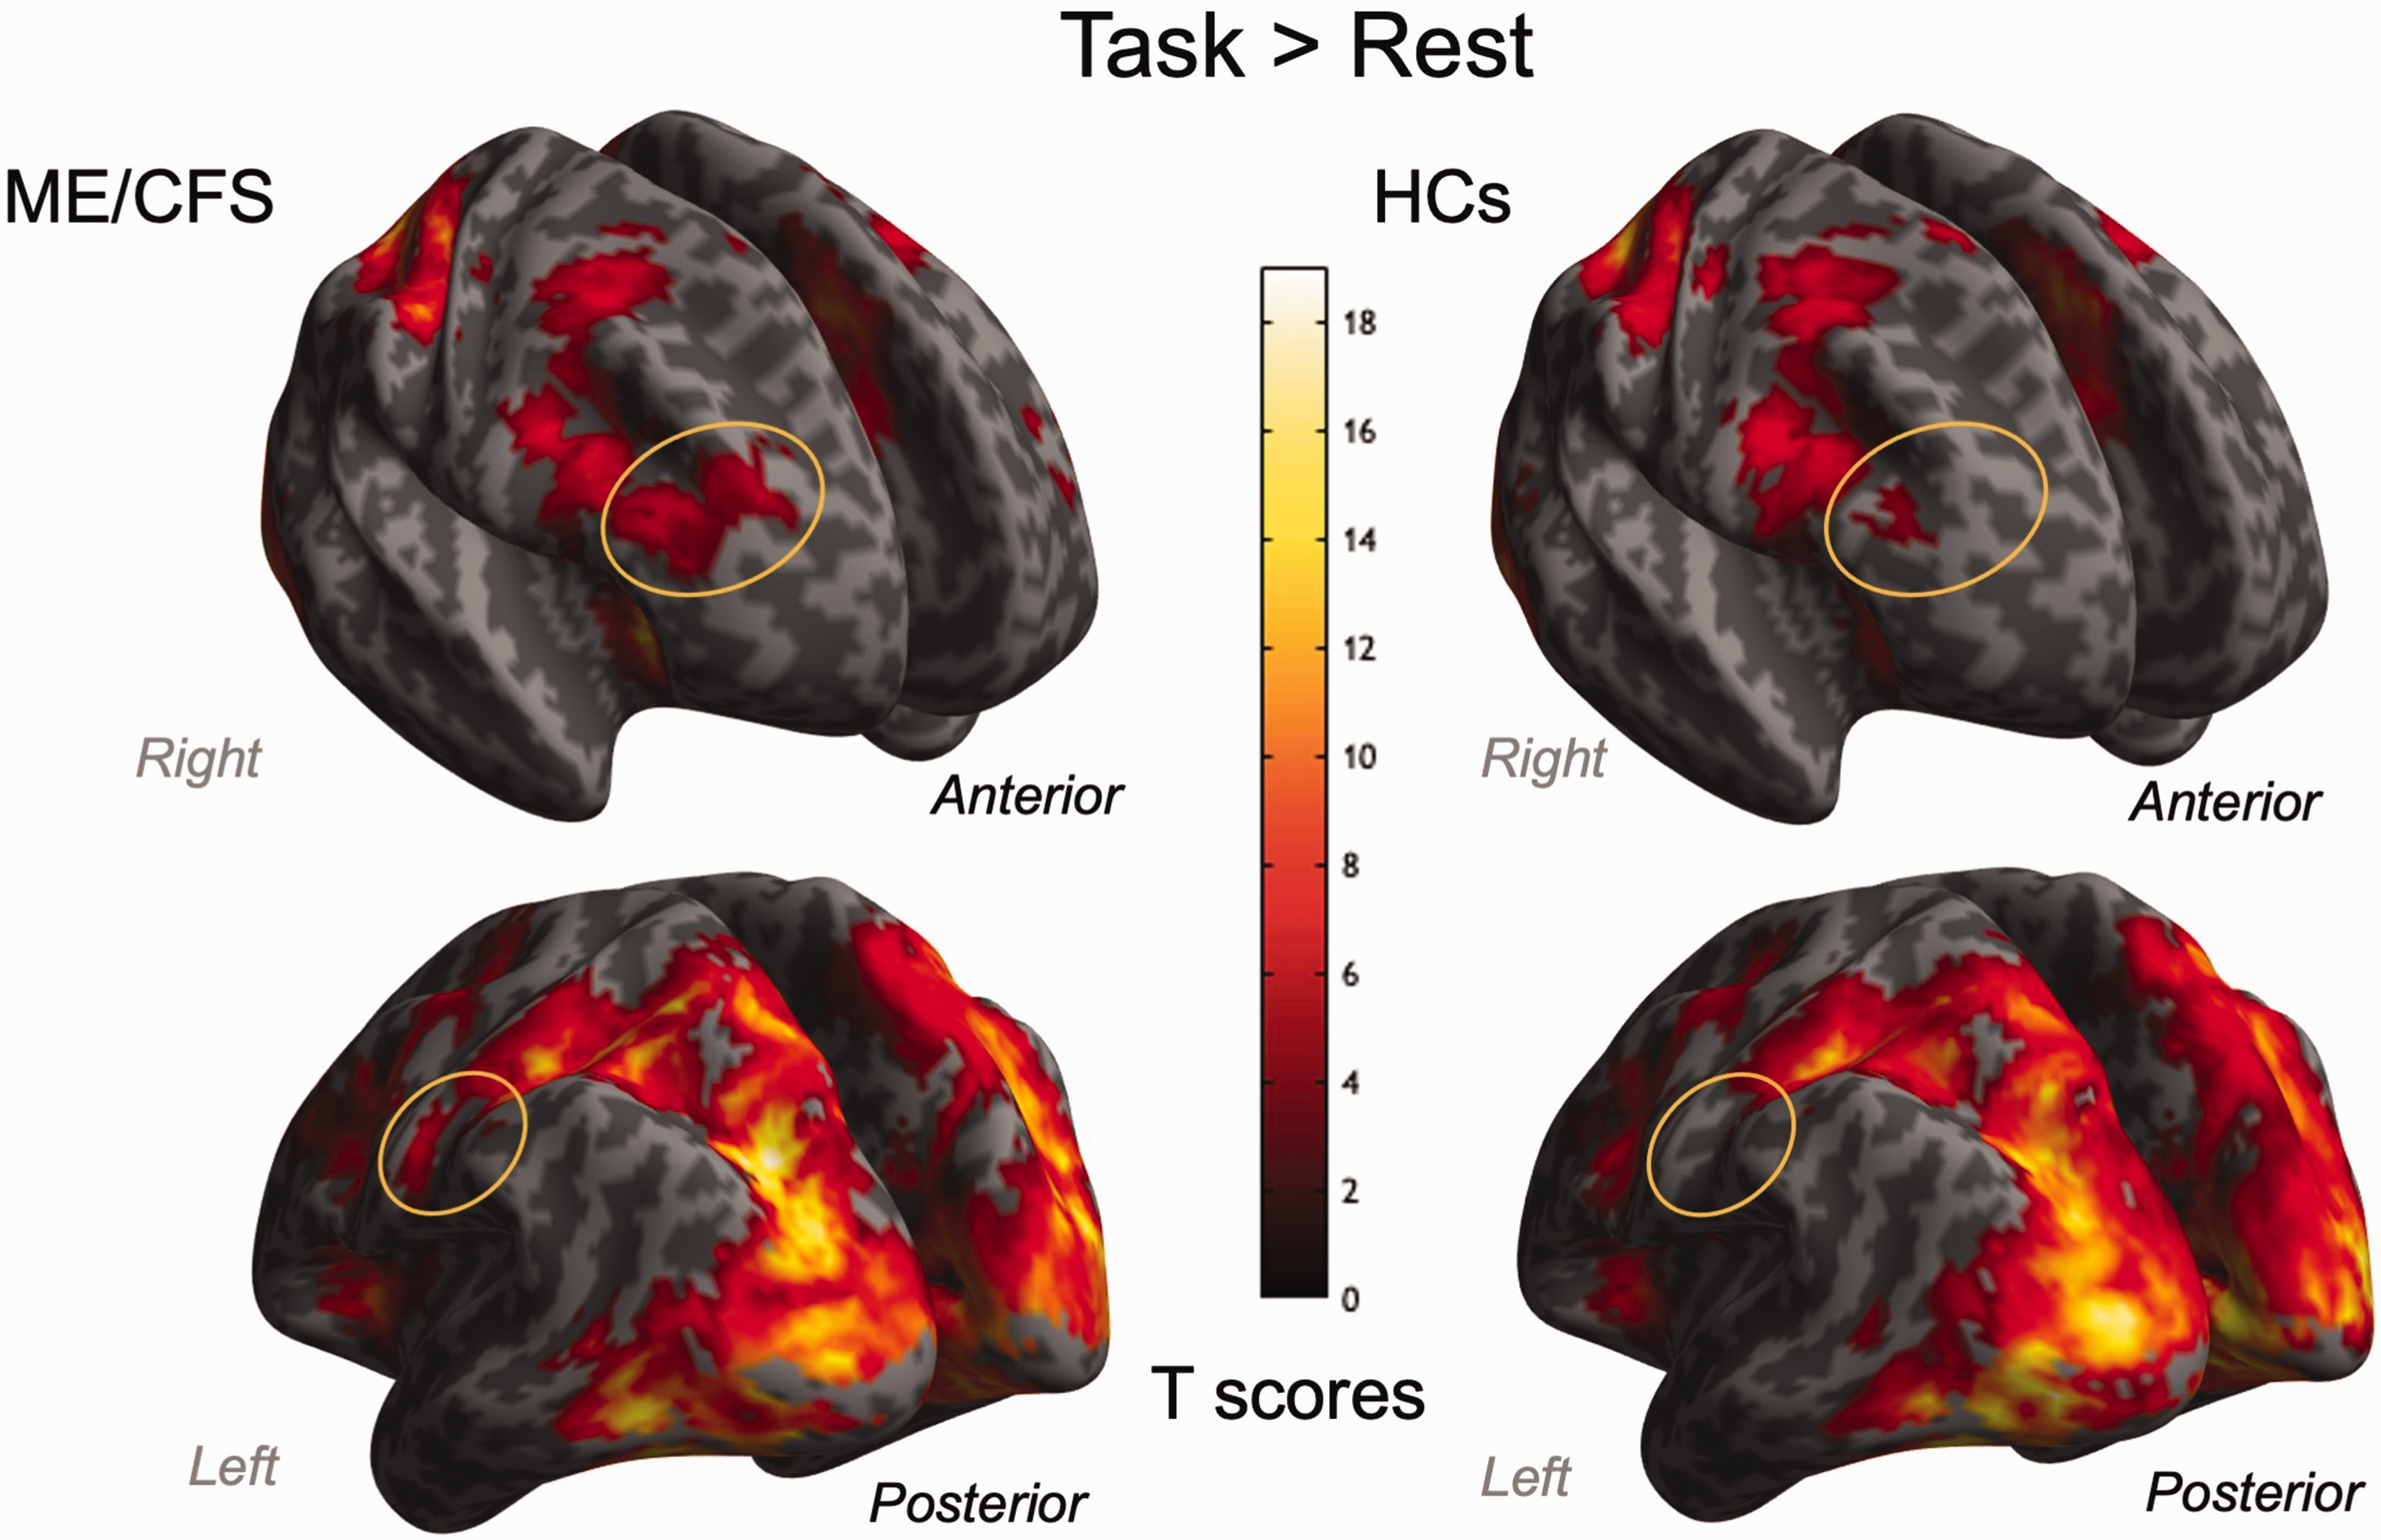
Neural correlates of Symbol Digit Modalities Test (SDMT) trials. The group-level activation maps show that patients with Myalgic Encephalomyelitis/Chronic Fatigue Syndrome (ME/CFS, left column) exhibited more extended positive blood oxygenation level-dependent signal changes (orange-circled areas) than the healthy controls (HCs, right column). Note that there is no significant difference in the between-group comparison between ME/CFS patients and HCs. Two clusters (cluster-level family-wise error-corrected PFWE < 0.001, cluster size kE = 14716, peak Montreal Neurological Institute coordinates, MNI [−27 −72 27], [36 −81 −12], [30 −87 18]; PFWE < 0.001, kE = 1656, peak MNI: [−3 12 45], [6 15 42], [−46 3 36]) were identified in patients with ME/CFS. One cluster (PFWE < 0.001, kE = 17612, peak MNI: [−6 −84 8], [−33 −87 −3], [33 −90 6]) was identified in HCs.
Between-block changes in brain function during prolonged cognitive task
Within-group analyses (1-sample t-tests) investigating changes between the first and the second task block (Supplementary Fig. S3) showed an increase in brain activity in both groups in the bilateral cuneus, lingual gyrus, and posterior cingulate (Brodmann areas [BA] 17, 18), and predominantly in right areas of the frontal and temporal gyrus (BA 6, 8–10, 21, 22). Furthermore, ME/CFS showed an increase in the right inferior parietal lobule (BA 40), whereas HCs showed an increase in the anterior lobe of the cerebellum and midbrain. Between-group analysis (2-sample t-test) comparing ME/CFS and HCs did not reveal any significant differences.
Between-set changes in brain function during prolonged cognitive task
In the first block, within-group analyses (1-sample t-tests) investigating the changes between its first and second sets (Figure 4(a) and (b)) showed an increase in brain activity bilaterally in the superior frontal and precentral gyrus (BA 1–6, 8), cuneus, and middle occipital gyrus (BA 17, 18) for both groups. Between-group analysis (2-sample t-test) comparing ME/CFS and HCs did not reveal any significant difference.
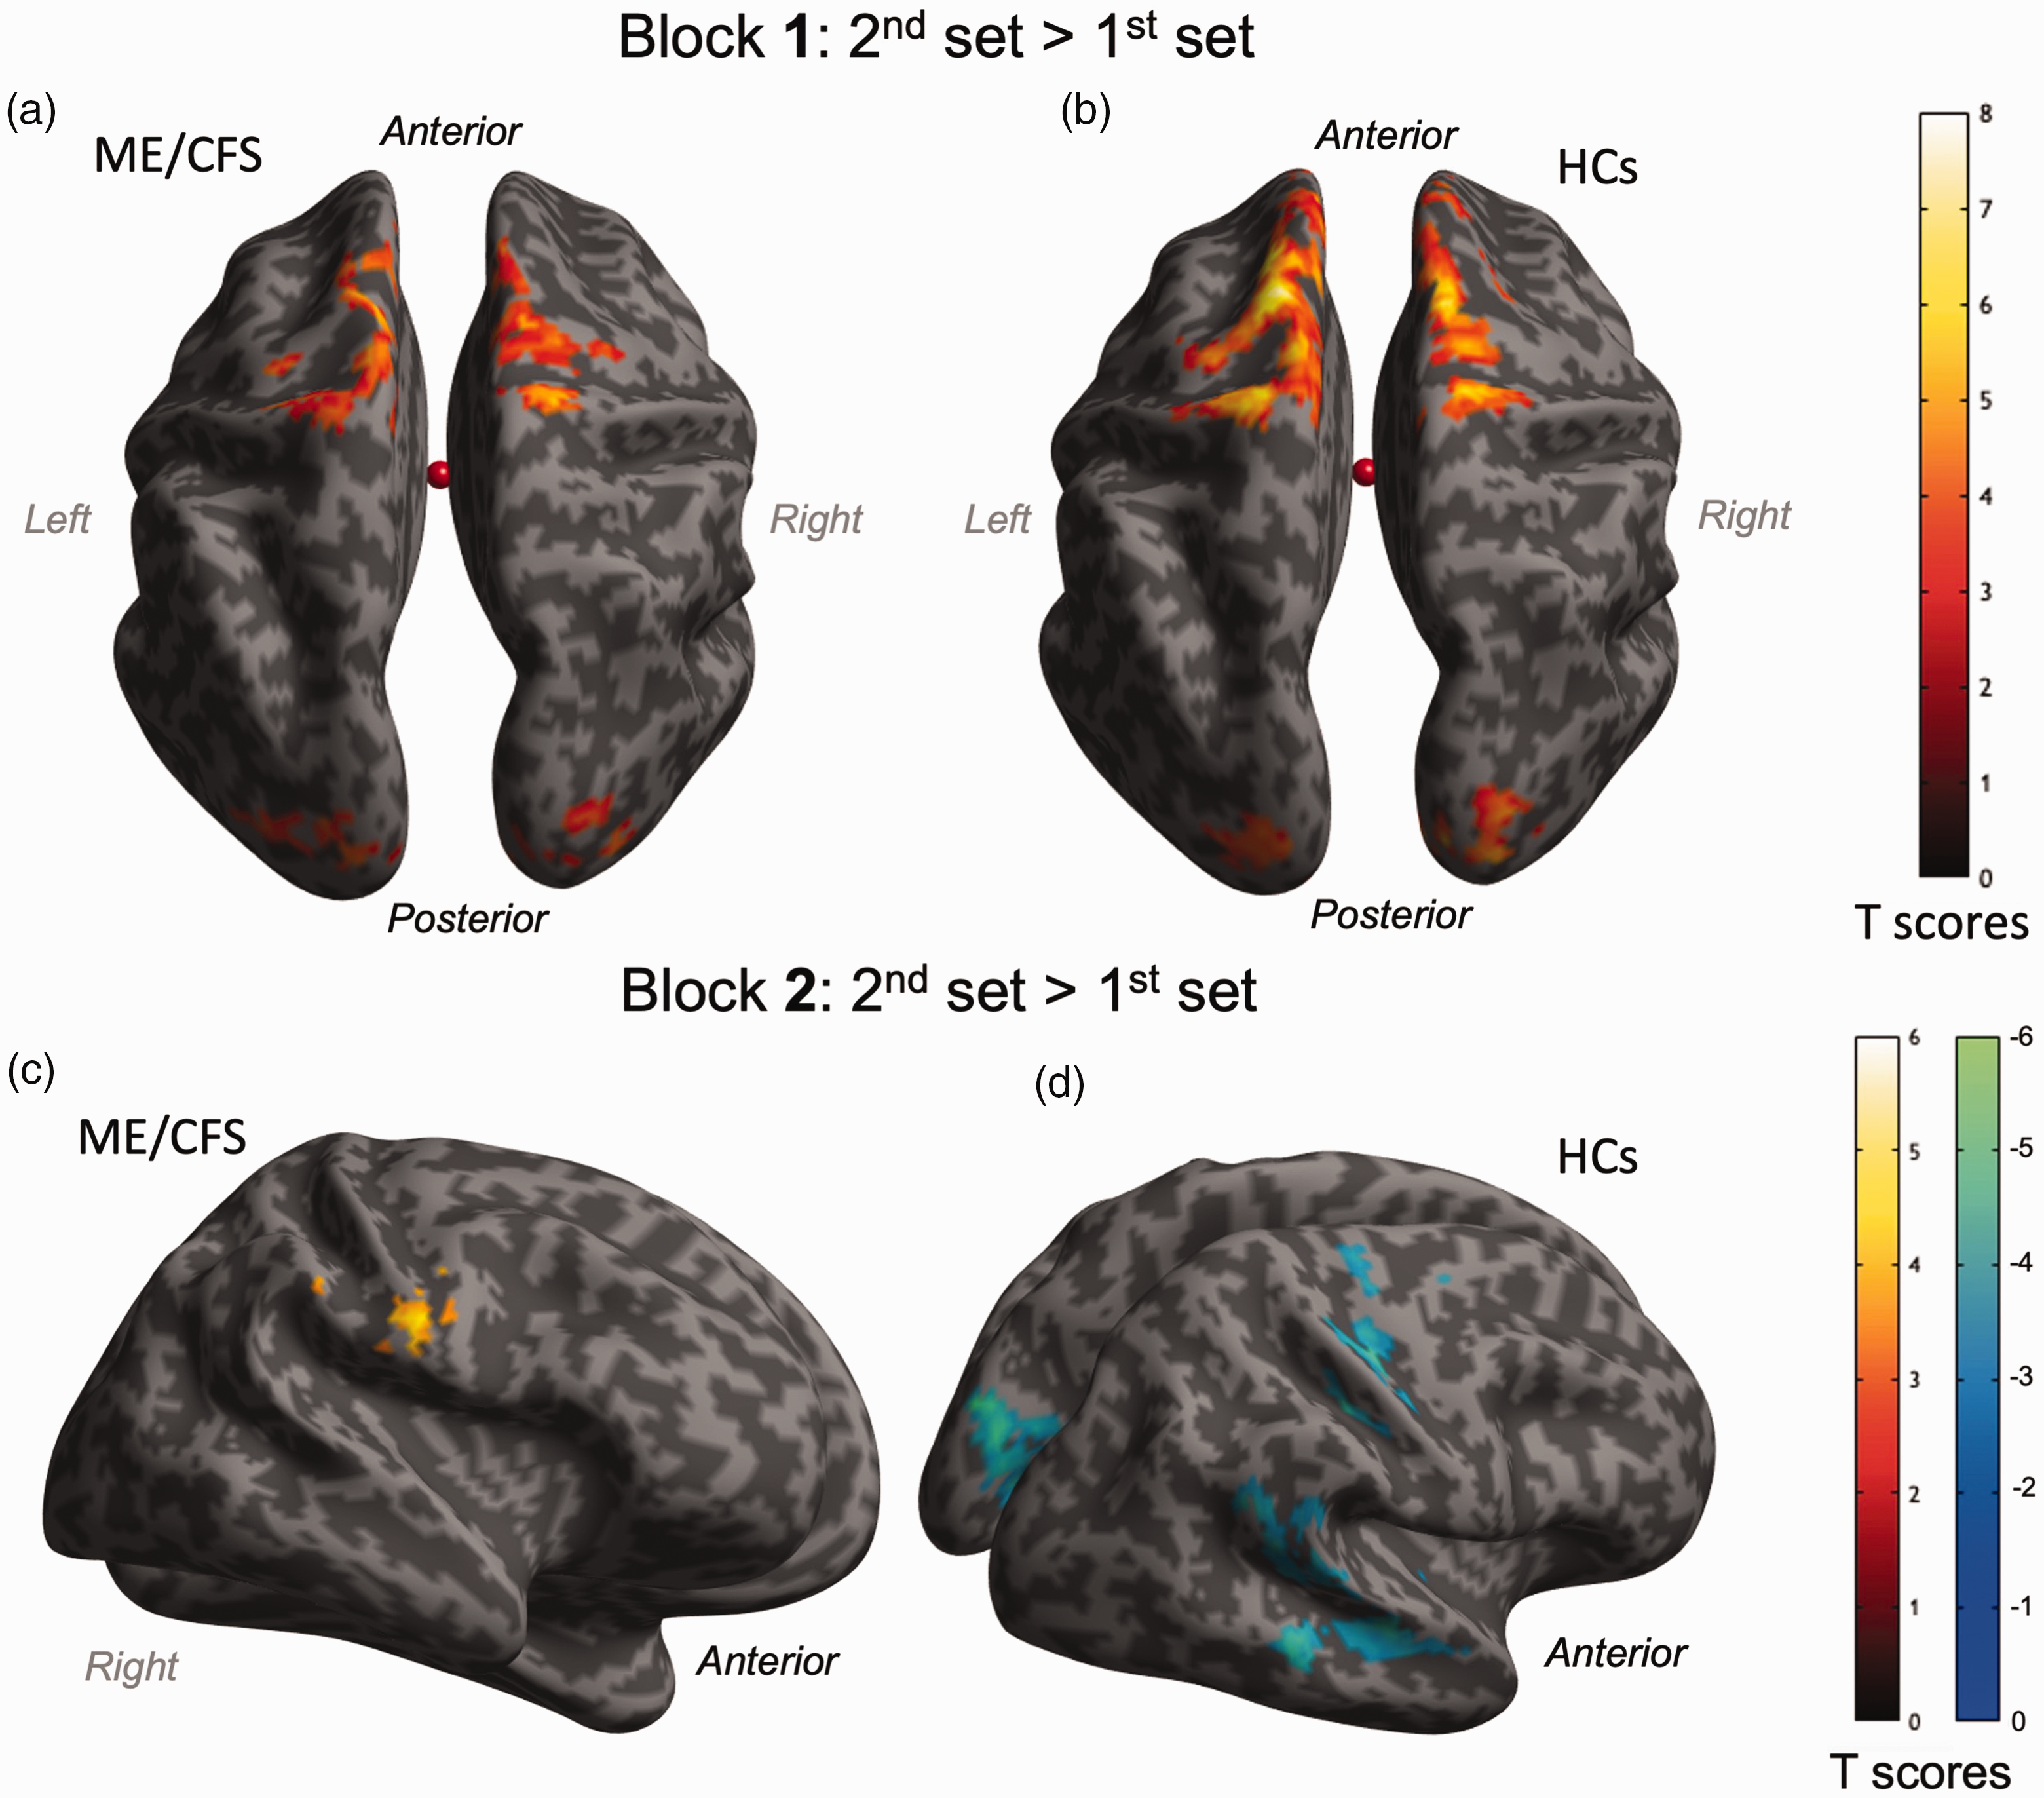
Comparison of fMRI signal changes associated with the Symbol Digit Modalities Test (SDMT) during the second half of trials with the first half within each block. In Block 1, fMRI signals increased during the second half of trials compared with the first half, similarly in patients with Myalgic Encephalomyelitis/Chronic Fatigue Syndrome (ME/CFS, a) and healthy controls (HCs, b). In Block 2, fMRI signal changes increased during the second set of trials in the second block in patients with ME/CFS (c), while fMRI signal changes decreased in HCs (d). Detailed locations and sizes of clusters are provided in the supplementary information (Supplementary Table S1).
In the second block, within-group analyses (1-sample t-tests) investigating the changes between its first and second sets showed an increase in brain activity in the right frontal lobe, specifically the right pre- and post-central gyrus (BA 1–4, 6) in the ME/CFS group (Figure 4(c)). However, HCs showed a decrease in brain activity bilaterally in the cuneus and precuneus (BA 17–19), posterior cingulate (BA 30, 31), and in the right pre- and post-central gyrus (BA 3, 4, 6), as well as the right superior and middle temporal gyrus (BA 21, 22, 40) (Figure 4(d)). Between-group analysis (2-sample t-test) showed significantly higher brain activity in the bilateral pre- and post-central gyrus (BA 1–4, 6), inferior parietal lobule (BA 40), and the right superior temporal gyrus (BA 41–43) in ME/CFS compared to HCs during the second set in comparison with the first set of the second task block (Figure 5). Moreover, these BOLD response adaptations in the left pre- and post-central gyrus were significantly correlated with long-term fatigue severity (Figure 6). No other significant correlations were observed between BOLD changes and behavioural measures.
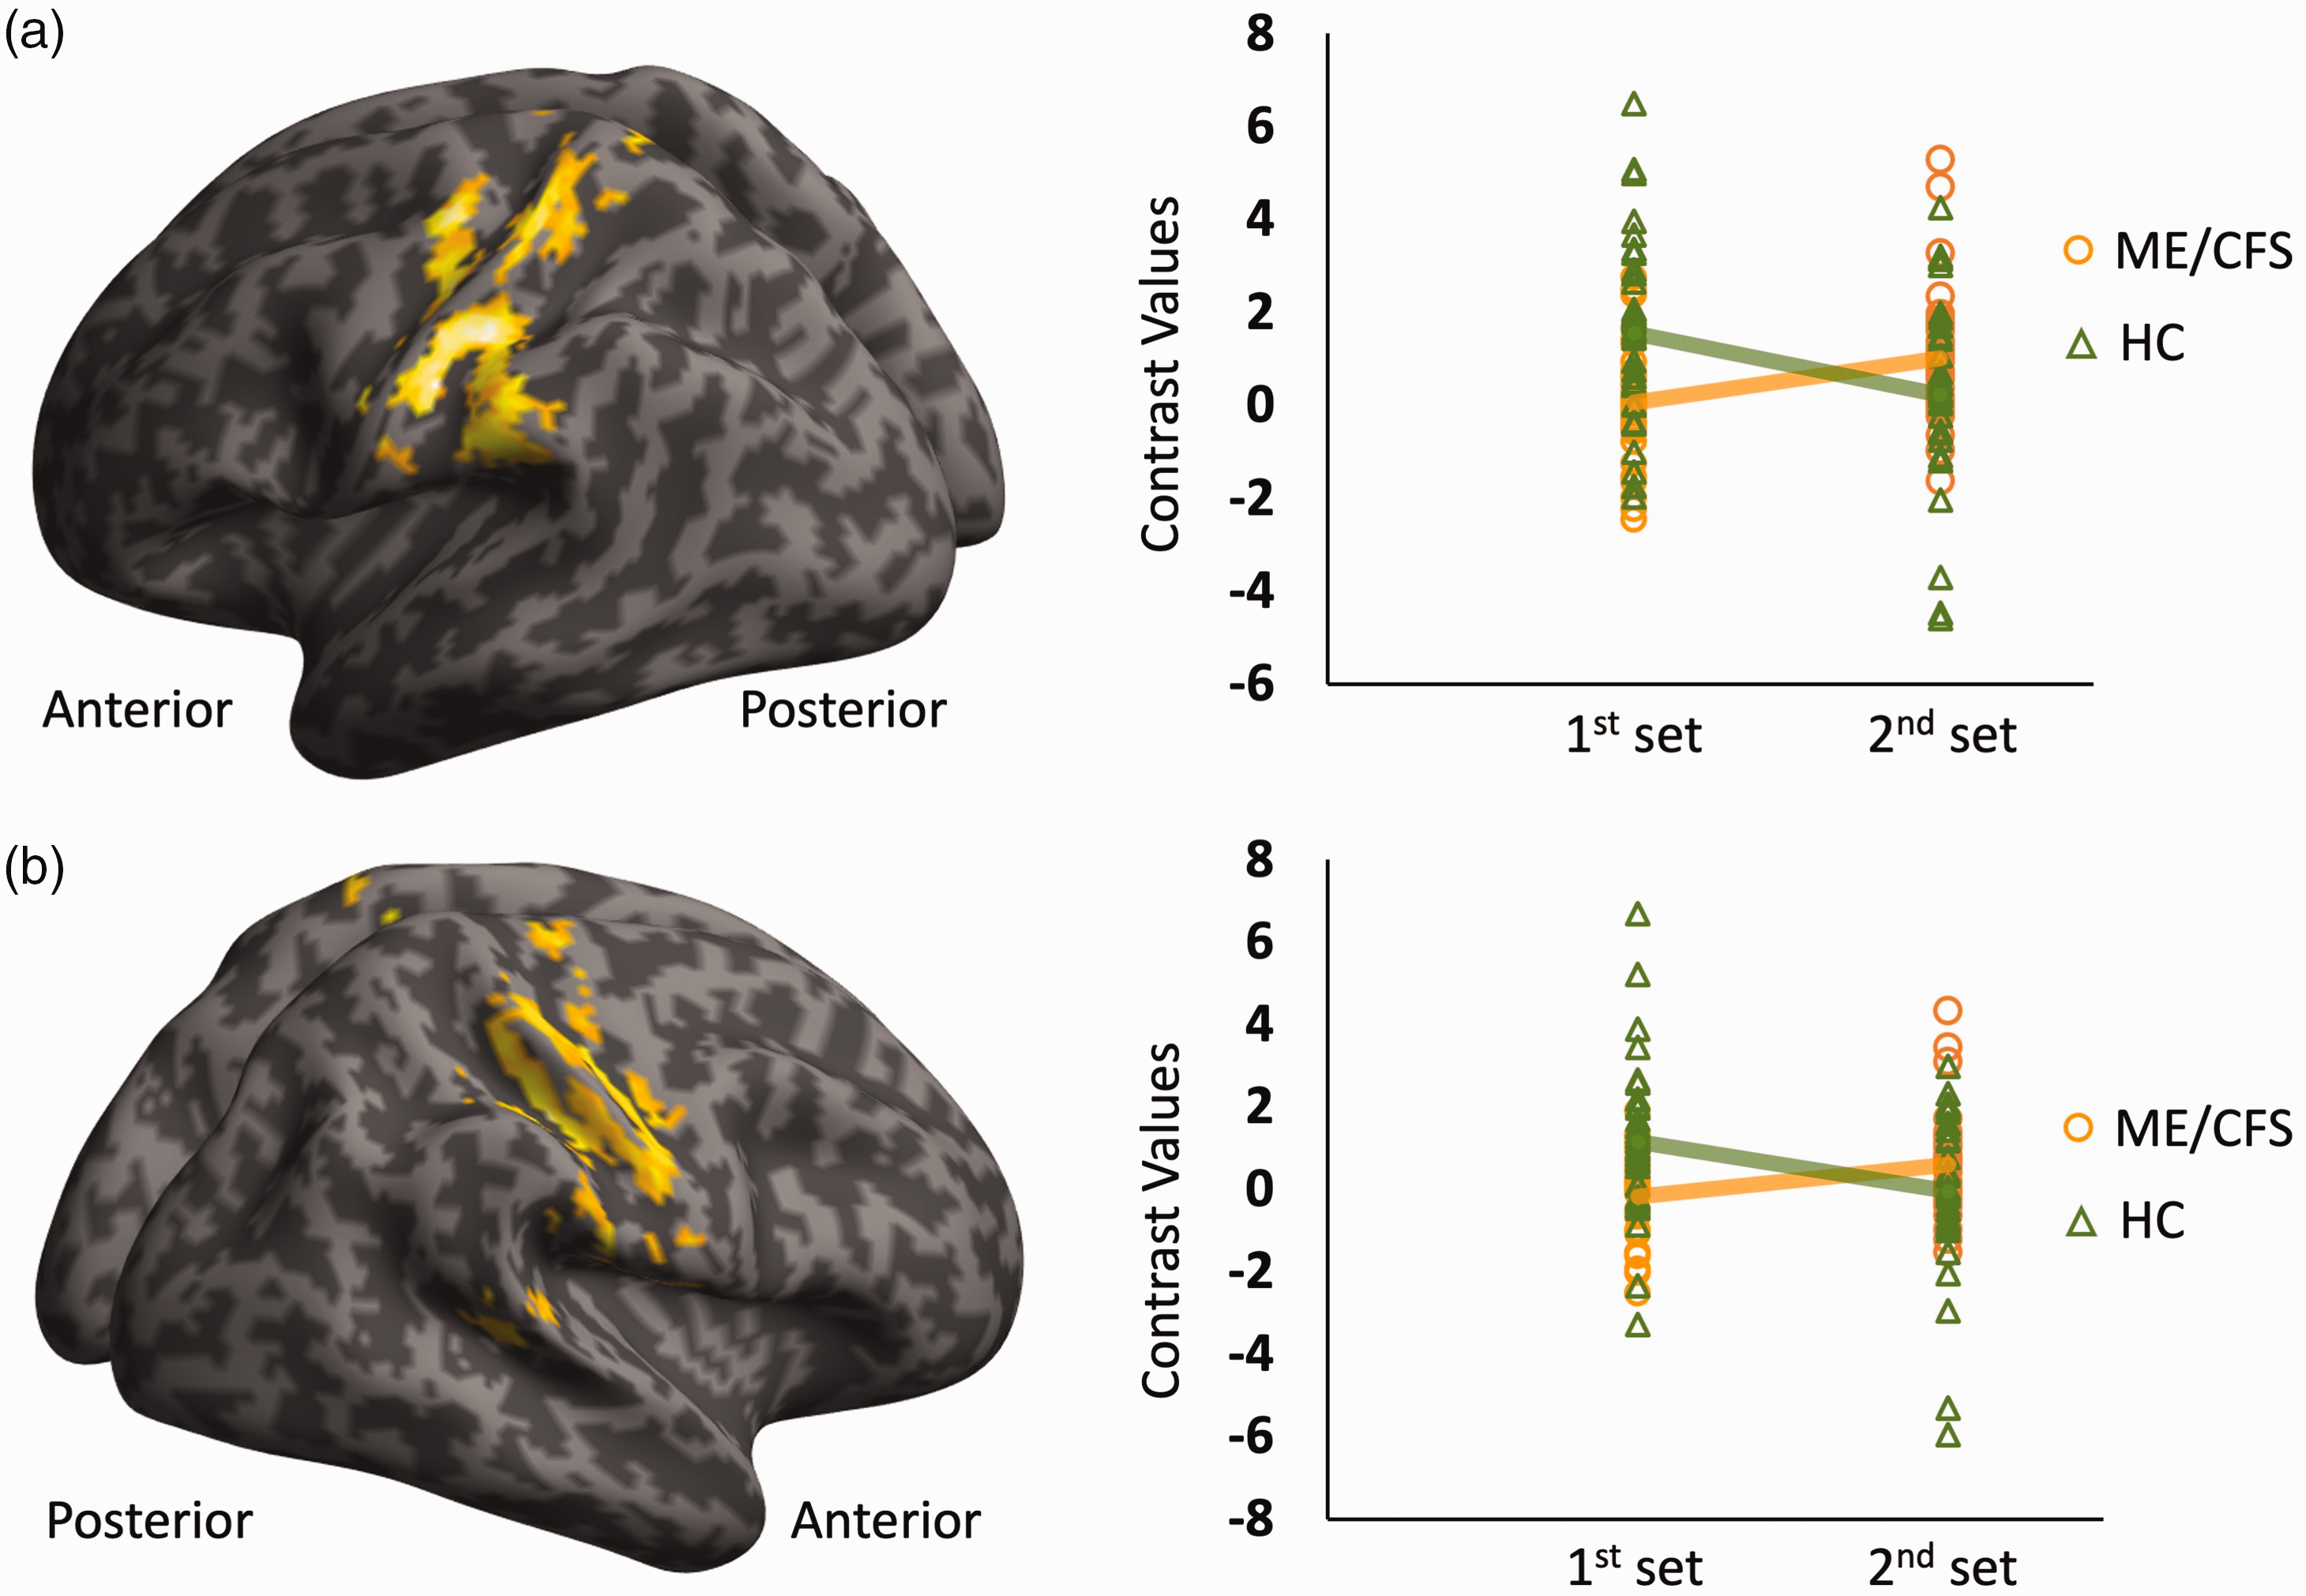
Differences in fMRI signal changes between the first and second half of trials in the second block for patients and healthy controls (HCs). HCs showed decreased fMRI signal changes in the second half of trials compared to the first half, known as fMRI signal adaptation. However, this fMRI signal adaptation was absent in patients with Myalgic Encephalomyelitis/Chronic Fatigue Syndrome (ME/CFS) in the second block (contrast values in right columns, panels a and b). Two-sample t-test comparisons (ME/CFS vs. HCs) revealed higher fMRI response changes in the second set compared to the first set of Block 2 in the left postcentral gyrus (a) (cluster-level family-wise error-corrected PFWE < 0.001, cluster size kE = 558, peak Montreal Neurological Institute coordinates, MNI [−51 −18 33]) and in the right frontal sub-gyral region (b) (PFWE < 0.001, kE = 509, peak MNI: [39 −21 36]).
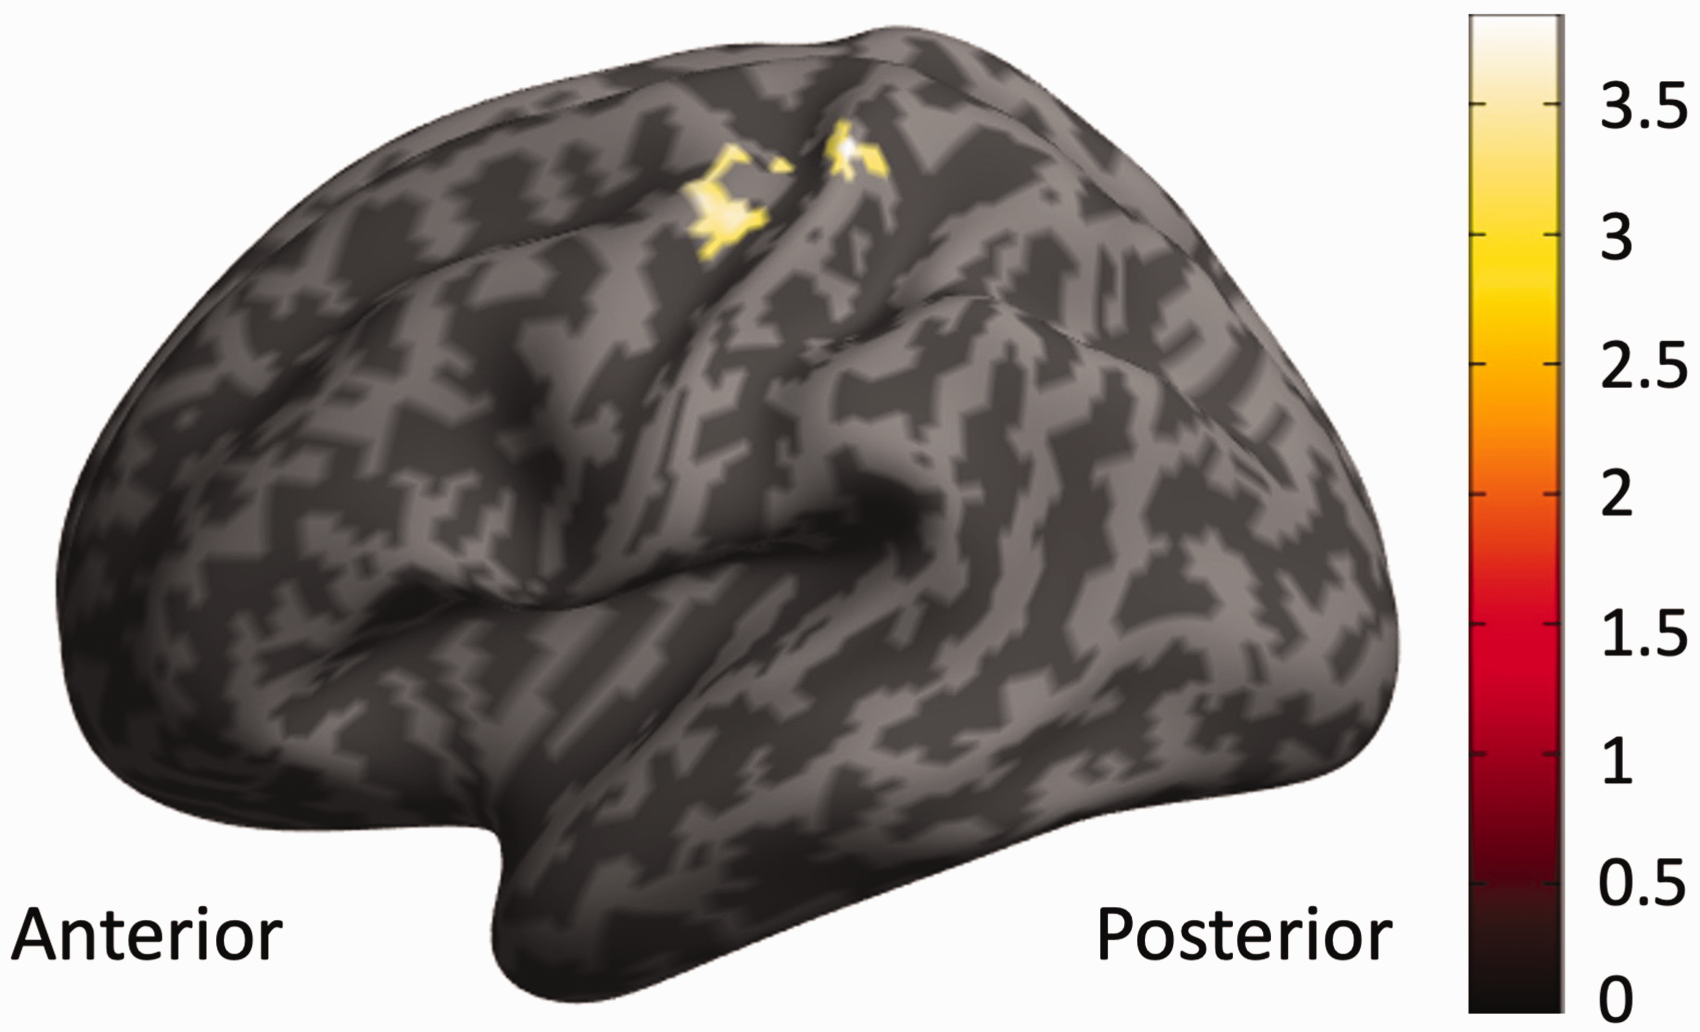
Correlations between fatigue severity and fMRI response changes in the second half trials of the second block. Multiple regressions demonstrated that BOLD response changes (Block 2, 2nd set vs. 1st set) in the pre-and post-central gyrus are significantly associated with fatigue severity, controlling for age, sex, BMI, depression, and anxiety scores. The identified cluster (cluster-level family-wise error-corrected PFWE = 0.02, cluster size kE = 80, peak Montreal Neurological Institute coordinates, MNI [−33 −33 66]) is situated within areas where BOLD adaptation was absent in patients with Myalgic Encephalomyelitis/Chronic Fatigue Syndrome.
Additional comparisons of 54 ME/CFS patients
Within-group comparisons of the 54 ME/CFS patients showed similar BOLD change patterns but slightly larger brain areas (Supplementary S3, S4, S5, and S6). The between-group comparisons of the 54 ME/CFS patients vs. the 34 HCs remained the same as the aforementioned comparisons (Supplementary S7).
Discussion
This study utilised tfMRI to explore brain functions in ME/CFS, particularly temporal BOLD signal changes. The BOLD signal increased in both ME/CFS participants and HCs during the first three quarters of trials. However, in the last quarter, BOLD responses in HCs exhibited a decrease, while those in the ME/CFS group remained similar with a slight increase. Between-group comparisons confirmed these patterns, revealing significant differences.
Our study's strengths include the rigorous diagnostic interviews conducted by two clinicians with CCC definition for ME/CFS group recruitment to minimise the risk of an ill-defined cohort. Compared to other ME/CFS imaging research studies,1,19 –23 we had a relatively large sample size. Furthermore, HCs with sedentary lifestyles (MET < 1.5) were selected in addition to sex-, age-, and BMI-matched to the ME/CFS group to minimise potential brain functional differences attributed to ME/CFS sequelae rather than the illness itself. To further improve the reliability of our results, we selected a 1:1 match of sample size, age and sex between ME/CFS patients and HCs. Although excluding additional eligible patients might seem counterproductive, this matching minimises sampling bias and helps make clear and unambiguous conclusions about the impact of ME/CFS on neuroimaging metrics, particularly on within-group activation patterns. Indeed, while between-group comparisons of all patients and selected patients vs. HCs remain the same (Supplementary S7), within-group analysis of all 54 ME/CFS patients showed similar activation patterns but slightly larger areas compared to the 34 patients (Supplementary S3, S6, S4, S5 and S6).
Patients with ME/CFS showed significantly higher BOLD response changes (2nd set Vs. 1st set) in the second task block than those from HCs. Within-group analyses indicated that these increases were mainly driven by a decline in BOLD signals in HCs, known as BOLD adaptation, potentially improving the energy economy. 8 The absence of BOLD adaptation in ME/CFS observed in our study is consistent with findings of previous studies in patients with multiple sclerosis and traumatic brain injury.7,24 This absent BOLD adaptation resulted in ME/CFS exhibiting significantly higher BOLD signals than HCs in various brain regions, including the bilateral inferior parietal lobule and right superior temporal gyrus. The finding was further strengthened by the significant correlations (Figure 6) between BOLD response changes and DSQ-2 fatigue severities, 13 reflecting fatigue levels over the past 6 months. Interestingly, we did not observe relationships between the absence of BOLD adaptation and fatigue levels measured by FSQ, 14 focusing on the current fatigue level. These relationships suggest that the absence of BOLD adaptation impacts neurophysiology in the long term rather than producing transient effects.
BOLD signals result from neural activities and regional dynamic regulation of blood flow, i.e., neurovascular coupling (NVC). Previous studies showed that the BOLD adaptation in HCs was a combination of learning effect and neural adaptation (increased neural computation efficiency), as well as NVC adaptation. 8 This study could not disentangle whether the absence of BOLD adaptation in ME/CFS originated from aberrant neural and/or NVC adaptation. However, no evidence of abnormal neural adaptation in ME/CFS leads to our postulation of impaired NVC. NVC involves an initial feedforward mechanism of glutamate activation in neurons and astrocytes of a Ca2+-dependent signalling pathway and secondary metabolism-driven feedback. 25 This releases vasoactive factors which increase local blood flow to ensure the needed energy supply of activated neurons. 25 Recent studies have observed impaired Ca2+-mobilisation in ME/CFS,26,27 suggesting the possible impairment of glutamate-Ca2+ NVC pathways in ME/CFS.
This study observed noticeable cognitive performance and BOLD signal progressive changes during SDMT tasks. Accuracy significantly improved and response times significantly decreased from the 1st to the 2nd set in Block 1 in patients (Supplementary S2), indicating a learning effect. However, no significant differences were observed in accuracy or response times after the 2nd set in Block 1, suggesting the completion of the learning effect. The learning effect was less prominent in HCs, with no significant accuracy differences across sets but significantly reduced response times, extending into the 1st set of Block 2. The learning effect in HCs aligned well with increased BOLD changes, showing continuous increases until the 1st set of Block 2. In contrast, learning effects in patients ceased after the 2nd set in Block 1, but the increase in BOLD changes continued. Therefore, the absence of BOLD adaptation in patients cannot be explained by the learning effect, supporting our postulation of impaired NVC in ME/CFS. The continued increase in BOLD changes until the 1st set of Block 2 in both patients and HCs also explains why between-group differences were observed only in the last quarter of the task and not in the comparison between Block 1 and Block 2.
The SDMT neural correlates results partially aligned with our hypothesis that ME/CFS patients recruited broader regions during cognitive tasks. The within-group analysis revealed broader recruitment in the right dorsolateral prefrontal cortex and the left somatosensory cortex. The dorsolateral prefrontal region is particularly interesting because it is predominantly involved in executive processing and cognitive control. 28 However, the between-group comparison did not show any significant differences. Potential reasons for the lack of between-group differences are high individual variances and/or that the SDMT itself was not cognitively challenging enough, which was reflected by the overall 96% accuracy achieved by both groups.
Our findings provided a potential underlying neurophysiological disease process of neurological symptoms of ME/CFS. We postulated that the lack of BOLD adaptation resulted in inefficient energy economics, which in turn led to the fatigue symptoms experienced by ME/CFS patients. This finding implicates that tfMRI could be used as an objective surrogate for evaluating fatigue when questionnaires and behavioural measures are not applicable or reliable, for example, in animal models assessing fatigue.
Due to our tfMRI paradigm being part of a multimodal MRI study which requires long scanning time for participants, it was rather short compared to other research looking into cognitive fatigue.7,20,24 Group differences manifested within the second task block; it would be interesting to observe further changes during a longer tfMRI paradigm. BOLD adaptation in HCs occurred in the 2nd set of Block 2 after the cessation of learning effects, as deduced from performance. The results suggest that BOLD adaptation in patients should occur in Block 2, following the cessation of learning effects based on performance. However, this study cannot rule out the possibility of BOLD adaptation in ME/CFS occurring with a longer paradigm. Another limitation was that the FSQ was completed prior to and after MRI scans. Therefore, the FSQ post-score might not reflect the fatigue levels, particularly during the tfMRI, which could be a reason for the lack of detection of significant correlations.
Supplemental Material
sj-pdf-1-jcb-10.1177_0271678X241270528 - Supplemental material for Absence of BOLD adaptation in chronic fatigue syndrome revealed by task functional MRI
Supplemental material, sj-pdf-1-jcb-10.1177_0271678X241270528 for Absence of BOLD adaptation in chronic fatigue syndrome revealed by task functional MRI by Laura Schönberg, Abdalla Z Mohamed, Qiang Yu, Richard A Kwiatek, Peter Del Fante, Vince D Calhoun and Zack Y Shan in Journal of Cerebral Blood Flow & Metabolism
Footnotes
Data availability
The demographics, symptom scores, and neural correlates (subject-level contrast maps) of each participant were available on Mendeley Data.
Funding
The author(s) disclosed receipt of the following financial support for the research, authorship, and/or publication of this article: This project is supported by the National Health and Medical Research Council of Australia (NHMRC) Ideas Grant Scheme (GNT1184219) and the Mason Foundation.
Acknowledgements
We gratefully acknowledge the individuals who participated in this study.
Declaration of conflicting interests
The author(s) declared no potential conflicts of interest with respect to the research, authorship, and/or publication of this article.
Authors’ contributions
PD, RAK, VDC, and ZYS conceived the project; LS and ZYS designed the study; AZM, LS, QY, and ZYS performed data analysis; PD, RAK, LS, VDC, and ZYS interpreted the results; LS drafted the manuscript, and all authors contributed to editing it.
Supplementary material
Supplemental material for this article is available online.
References
Supplementary Material
Please find the following supplemental material available below.
For Open Access articles published under a Creative Commons License, all supplemental material carries the same license as the article it is associated with.
For non-Open Access articles published, all supplemental material carries a non-exclusive license, and permission requests for re-use of supplemental material or any part of supplemental material shall be sent directly to the copyright owner as specified in the copyright notice associated with the article.