
Abstract
Overlapping symptoms between Alzheimer’s disease (AD), behavioral variant of frontotemporal dementia (bvFTD), and schizophrenia (SZ) can lead to misdiagnosis and delays in appropriate treatment, especially in cases of early-onset dementia. To determine the potential of brain signal variability as a diagnostic tool, we assessed the coefficient of variation of the BOLD signal (CVBOLD) in 234 participants spanning bvFTD (n = 53), AD (n = 17), SZ (n = 23), and controls (n = 141). All underwent functional and structural MRI scans. Data unveiled a notable increase in CVBOLD in bvFTD patients across both datasets (local and international, p < 0.05), revealing an association with clinical scores (CDR and MMSE, r = 0.46 and r = −0.48, p < 0.0001). While SZ and control group demonstrated no significant differences, a comparative analysis between AD and bvFTD patients spotlighted elevated CVBOLD in the frontopolar cortices for the latter (p < 0.05). Furthermore, CVBOLD not only presented excellent diagnostic accuracy for bvFTD (AUC 0.78–0.95) but also showcased longitudinal repeatability. During a one-year follow-up, the CVBOLD levels increased by an average of 35% in the bvFTD group, compared to a 2% increase in the control group (p < 0.05). Our findings suggest that CVBOLD holds promise as a biomarker for bvFTD, offering potential for monitoring disease progression and differentiating bvFTD from AD and SZ.
Keywords
Introduction
Alzheimer’s disease (AD) and the behavioral variant of frontotemporal dementia (bvFTD) are the leading causes of early-onset dementia.1,2 These are neurodegenerative diseases characterized by clinical, genetic, and pathological heterogeneity.2 –5 AD mostly manifests as amnestic syndrome, while bvFTD encompasses changes in personality and behavior, such as apathy, disinhibition, hyperorality, executive dysfunction, and compulsive behaviors. However, there are often significant overlapping similarities in the clinical presentation of these diseases and atypical variants have been recognized.6 –12 Additionally, bvFTD shows significant symptomatic overlap with non-degenerative primary psychiatric disorders, including schizophrenia (SZ).13 –16 Both SZ and bvFTD can be characterized by a profound alteration in personal and social conduct, and the clinical presentation of bvFTD can deviate from that of typical memory disorders.14,17,18
Differentiating among the various neurodegenerative causes of dementia enables affected individuals and their families to receive suitable treatment, support, and care. Despite extensive efforts to establish refined clinical guidelines for differential diagnosis, the diagnostic accuracy remains unsatisfactory.11,15,16,19 –26 The sensitivity of the criteria for possible bvFTD ranges from 75% to 95%, and for probable bvFTD from 64% to 85%.10,23,24,26,27 The specificity of the criteria for possible bvFTD ranges from 27% to 82%, and for probable bvFTD from 85% to 95%.10,23,24,26,27 Current practice highlights the importance of imaging in the distinguishing bvFTD from other neurodegenerative disorders. However, visual evaluation of magnetic resonance imaging (MRI) requires the expertise of an experienced neuroradiologist and provides only 59% sensitivity and 80% specificity in distinguishing from other common dementing diseases. 26 It is also susceptible to inter-rater differences. Delayed diagnosis is common, with half of bvFTD patients initially receiving a psychiatric diagnosis, and the average diagnostic delay being up to five years from symptom onset. Conversely, patients with primary psychiatric disorders are often misdiagnosed with bvFTD.13,15,16,25
Protein dyshomeostasis seems to be the common mechanism of these neurodegenerative diseases. Additionally, cerebrovascular dysfunction (CVD) has now been recognized as a potential contributor to the onset and progression of neuronal degeneration, strongly linked to neuroinflammation, neurodegeneration, and cognitive decline.28 –31 Age, cerebrovascular diseases, and hypertension are known risk factors for AD. 21 Recent studies have shown that the cardiovascular burden is also higher in sporadic FTD, especially among patients with the bvFTD phenotype. 32 Even though bvFTD and SZ have overlapping neuropsychological findings and neuropsychiatric symptoms, CVD, cardiovascular diseases, and hypertension are not considered risk factors for SZ.33,34
Blood oxygenation level dependent (BOLD) imaging using functional MRI has shown that these aforementioned risk factors are reflected in the variability of cerebrovascular pulsatility.35 –41 Although a BOLD signal has mainly been used to measure hemodynamic responses to neuronal activity, it also reflects underlying physiological factors such as cerebral blood flow, hemodynamics, respiration, and metabolism.36,42 –52 Recent studies have emphasized that the BOLD signal is not a static measure, showing intrinsic variability over time and between individuals.53 –57 Fast BOLD imaging reflects both coupled neurovascular activity as well as hydrodynamic physiological factors such as the glymphatic mechanism: its variability has been increasingly used as an indicator of neurovascular state in clinical investigations.35 –41 We previously studied brain signal variability using coefficient of variation of the BOLD signal (CVBOLD),38,40,41,58 where we detected a replicable and progressive increase in brain CVBOLD solely in the AD patients, constituting a robust biomarker for clearly differentiating AD cases from controls. 41 Based on these earlier reports and the findings on the risk factors mentioned previously, we hypothesized that the CVBOLD signal could also be differentially altered in bvFTD and SZ.
In this study, our objectives were to examine whether CVBOLD is altered in bvFTD and/or SZ, and if it could be used in differential diagnostics. We further investigated whether CVBOLD could be used as a non-invasive MR-based biomarker for distinguishing bvFTD and SZ from imaging setup matched healthy control data. We also verified our results by using two independent bvFTD datasets.
Methods
Participants
The study sample included 234 individuals from three independent datasets, including 53 patients with bvFTD, 23 patients with SZ, 17 patients with AD who had been studied previously, and 141 healthy controls. Participant datasets and baseline characteristics are shown in Table 1. Ethical approvals were granted by the relevant research ethics committees across the sites. For dataset 1, the NIFD study was approved by the University of California in San Francisco (UCSF) institutional review board. Our research uses publicly available, previously collected and fully anonymized data, thus no additional ethical approval was required. All research protocols for the local datasets (2 and 3) were approved by The Ethics Committee of the Northern Ostrobothnia Hospital District in Finland (92/2002, 11/2008, 94/2011). Written informed consent was obtained from all participants or their assigned legal guardians. Research was conducted in accordance with the Helsinki declaration.
Overview of study participants.
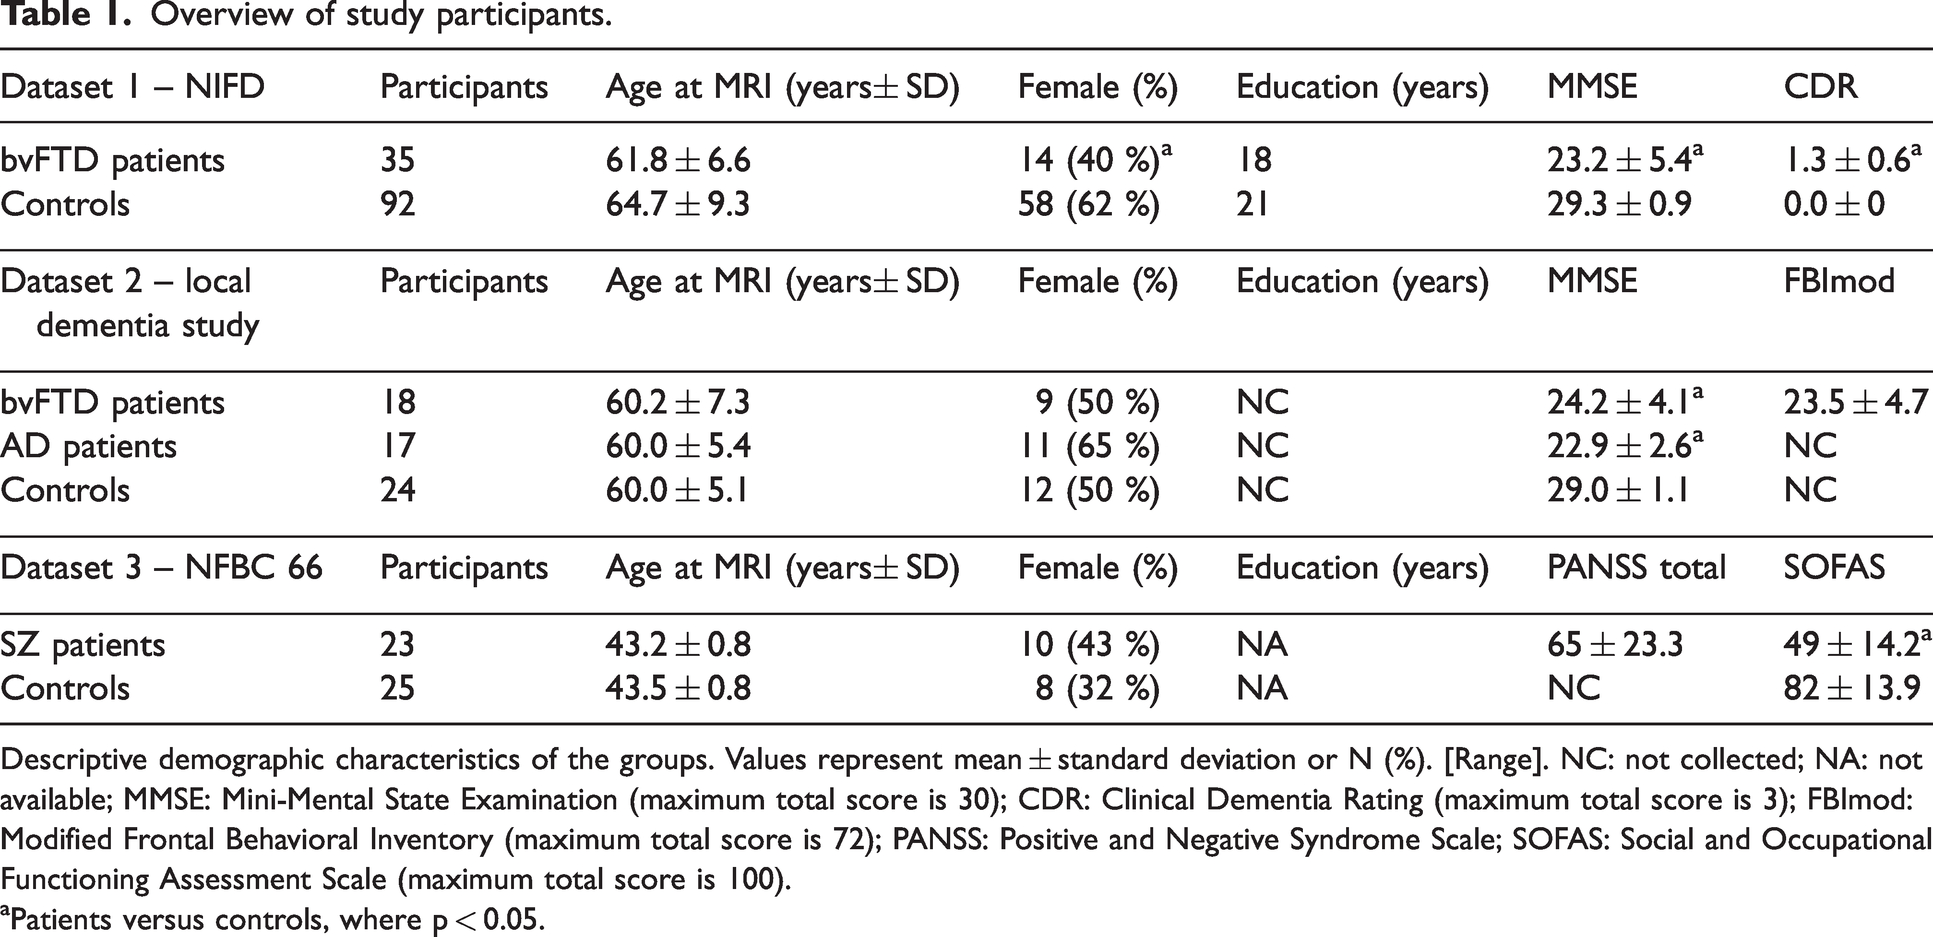
Descriptive demographic characteristics of the groups. Values represent mean ± standard deviation or N (%). [Range]. NC: not collected; NA: not available; MMSE: Mini-Mental State Examination (maximum total score is 30); CDR: Clinical Dementia Rating (maximum total score is 3); FBImod: Modified Frontal Behavioral Inventory (maximum total score is 72); PANSS: Positive and Negative Syndrome Scale; SOFAS: Social and Occupational Functioning Assessment Scale (maximum total score is 100).
Patients versus controls, where p < 0.05.
All bvFTD participants met the International Behavioral Variant FTD Criteria Consortium (FTDC) revised guidelines 2011 for the diagnosis of bvFTD. 10 All the patients of the AD group met the NINCDS-ADRDA (National Institute of Neurological and Communicative Disorders and Stroke and the Alzheimer’s Disease and Related Disorders Association) criteria for probable AD. 20 SZ patients met the diagnostic criteria using a Structured Clinical Interview for DSM-IV (SCID-I). 59
Image acquisition
Each subject was imaged using both functional and structural MRI. Details of the parameters for the MRI scans are shown in Table 2. For additional information on the MRI quality control, see. 58
Imaging parameters.
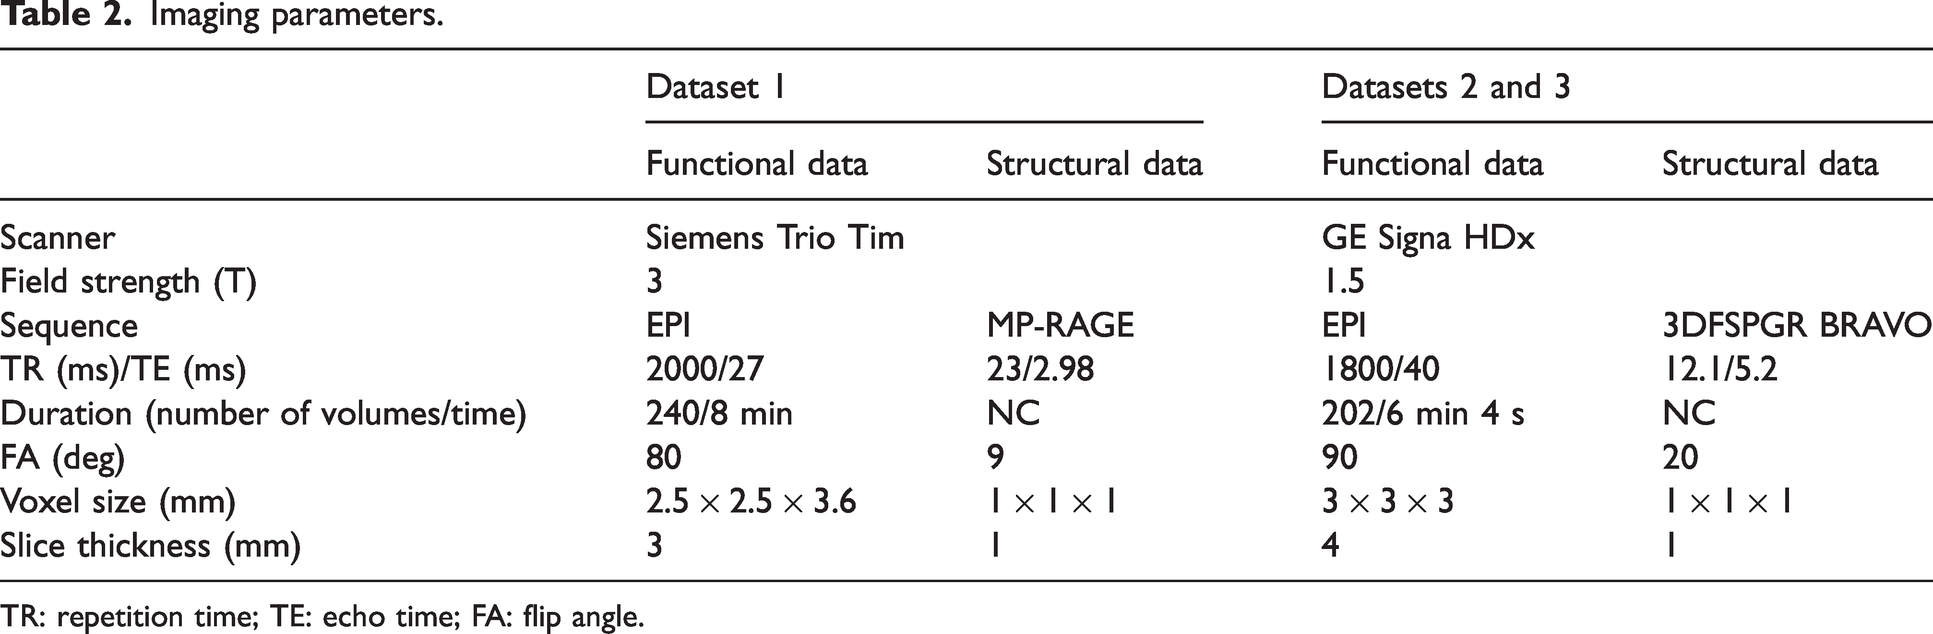
TR: repetition time; TE: echo time; FA: flip angle.
Neuroimaging processing
Preprocessing followed prior validated approaches, and identical preprocessing and quality control procedures were performed across all subjects, independent of the diagnosis. Preprocessing for all three datasets was conducted using the Oxford Centre for Functional MRI of the Brain Software Library 5.0 (FSL 5.0.11, http://www.fmrib.ox.ac.uk/fsl), exactly as described in. 41 For fMRI data, this included head motion correction, brain extraction, spatial smoothing, and high-pass temporal filtering.65 –67 Multi-resolution affine co-registration within the FSL FLIRT software was used to co-register the mean, non-smoothed fMRI, and structural maps of corresponding subjects, and to co-register these imaging data to the Montreal Neurological Institute’s (MNI152) standard space template. Motion analysis: From head motion correction parameters (MCFLIRT), we extracted subject-wise absolute displacement vectors (in mm), which describe the amount of movement in all directions over the entire scan as a marker of gross head motion. Also, relative displacement vectors were extracted as a marker of motion between each fMRI volume. Both vectors were also averaged across volumes to get the mean values. Structural data and gray matter atrophy (GM) maps: after the structural data underwent visual inspection by an experienced neuroradiologist, they were analyzed using FSL-VBM, an optimized voxel-based morphometry analysis (VBM) protocol executed with FSL tools.66,68 –70 First, structural images were brain-extracted and grey matter-segmented before being registered to the MNI 152 standard space using non-linear registration. The resulting images were averaged and flipped along the x-axis to create a left-right symmetric, study-specific grey matter template. Second, all native grey matter images were non-linearly registered to this study-specific template and “modulated” to correct for local expansion (or contraction) due to the non-linear component of the spatial transformation. The modulated grey matter images were then smoothed with an isotropic Gaussian kernel with a sigma of 3 mm. Finally, voxelwise GLM was applied using permutation-based non-parametric testing, correcting for multiple comparisons across space. For each subject, a total gray matter volume was calculated from the created gray matter maps.
Relative brain signal variability maps (CVBOLD)
We used the temporal coefficient of variation (CV) of the BOLD signal (CVBOLD) to measure brain signal variability, where a higher CV value equals greater variability of amplitude of the BOLD signal.38
–41 CV is also known as relative standard deviation. For each participant, a map of CVBOLD was computed as the relative standard deviation of the BOLD timeseries at each voxel from preprocessed fMRI data:

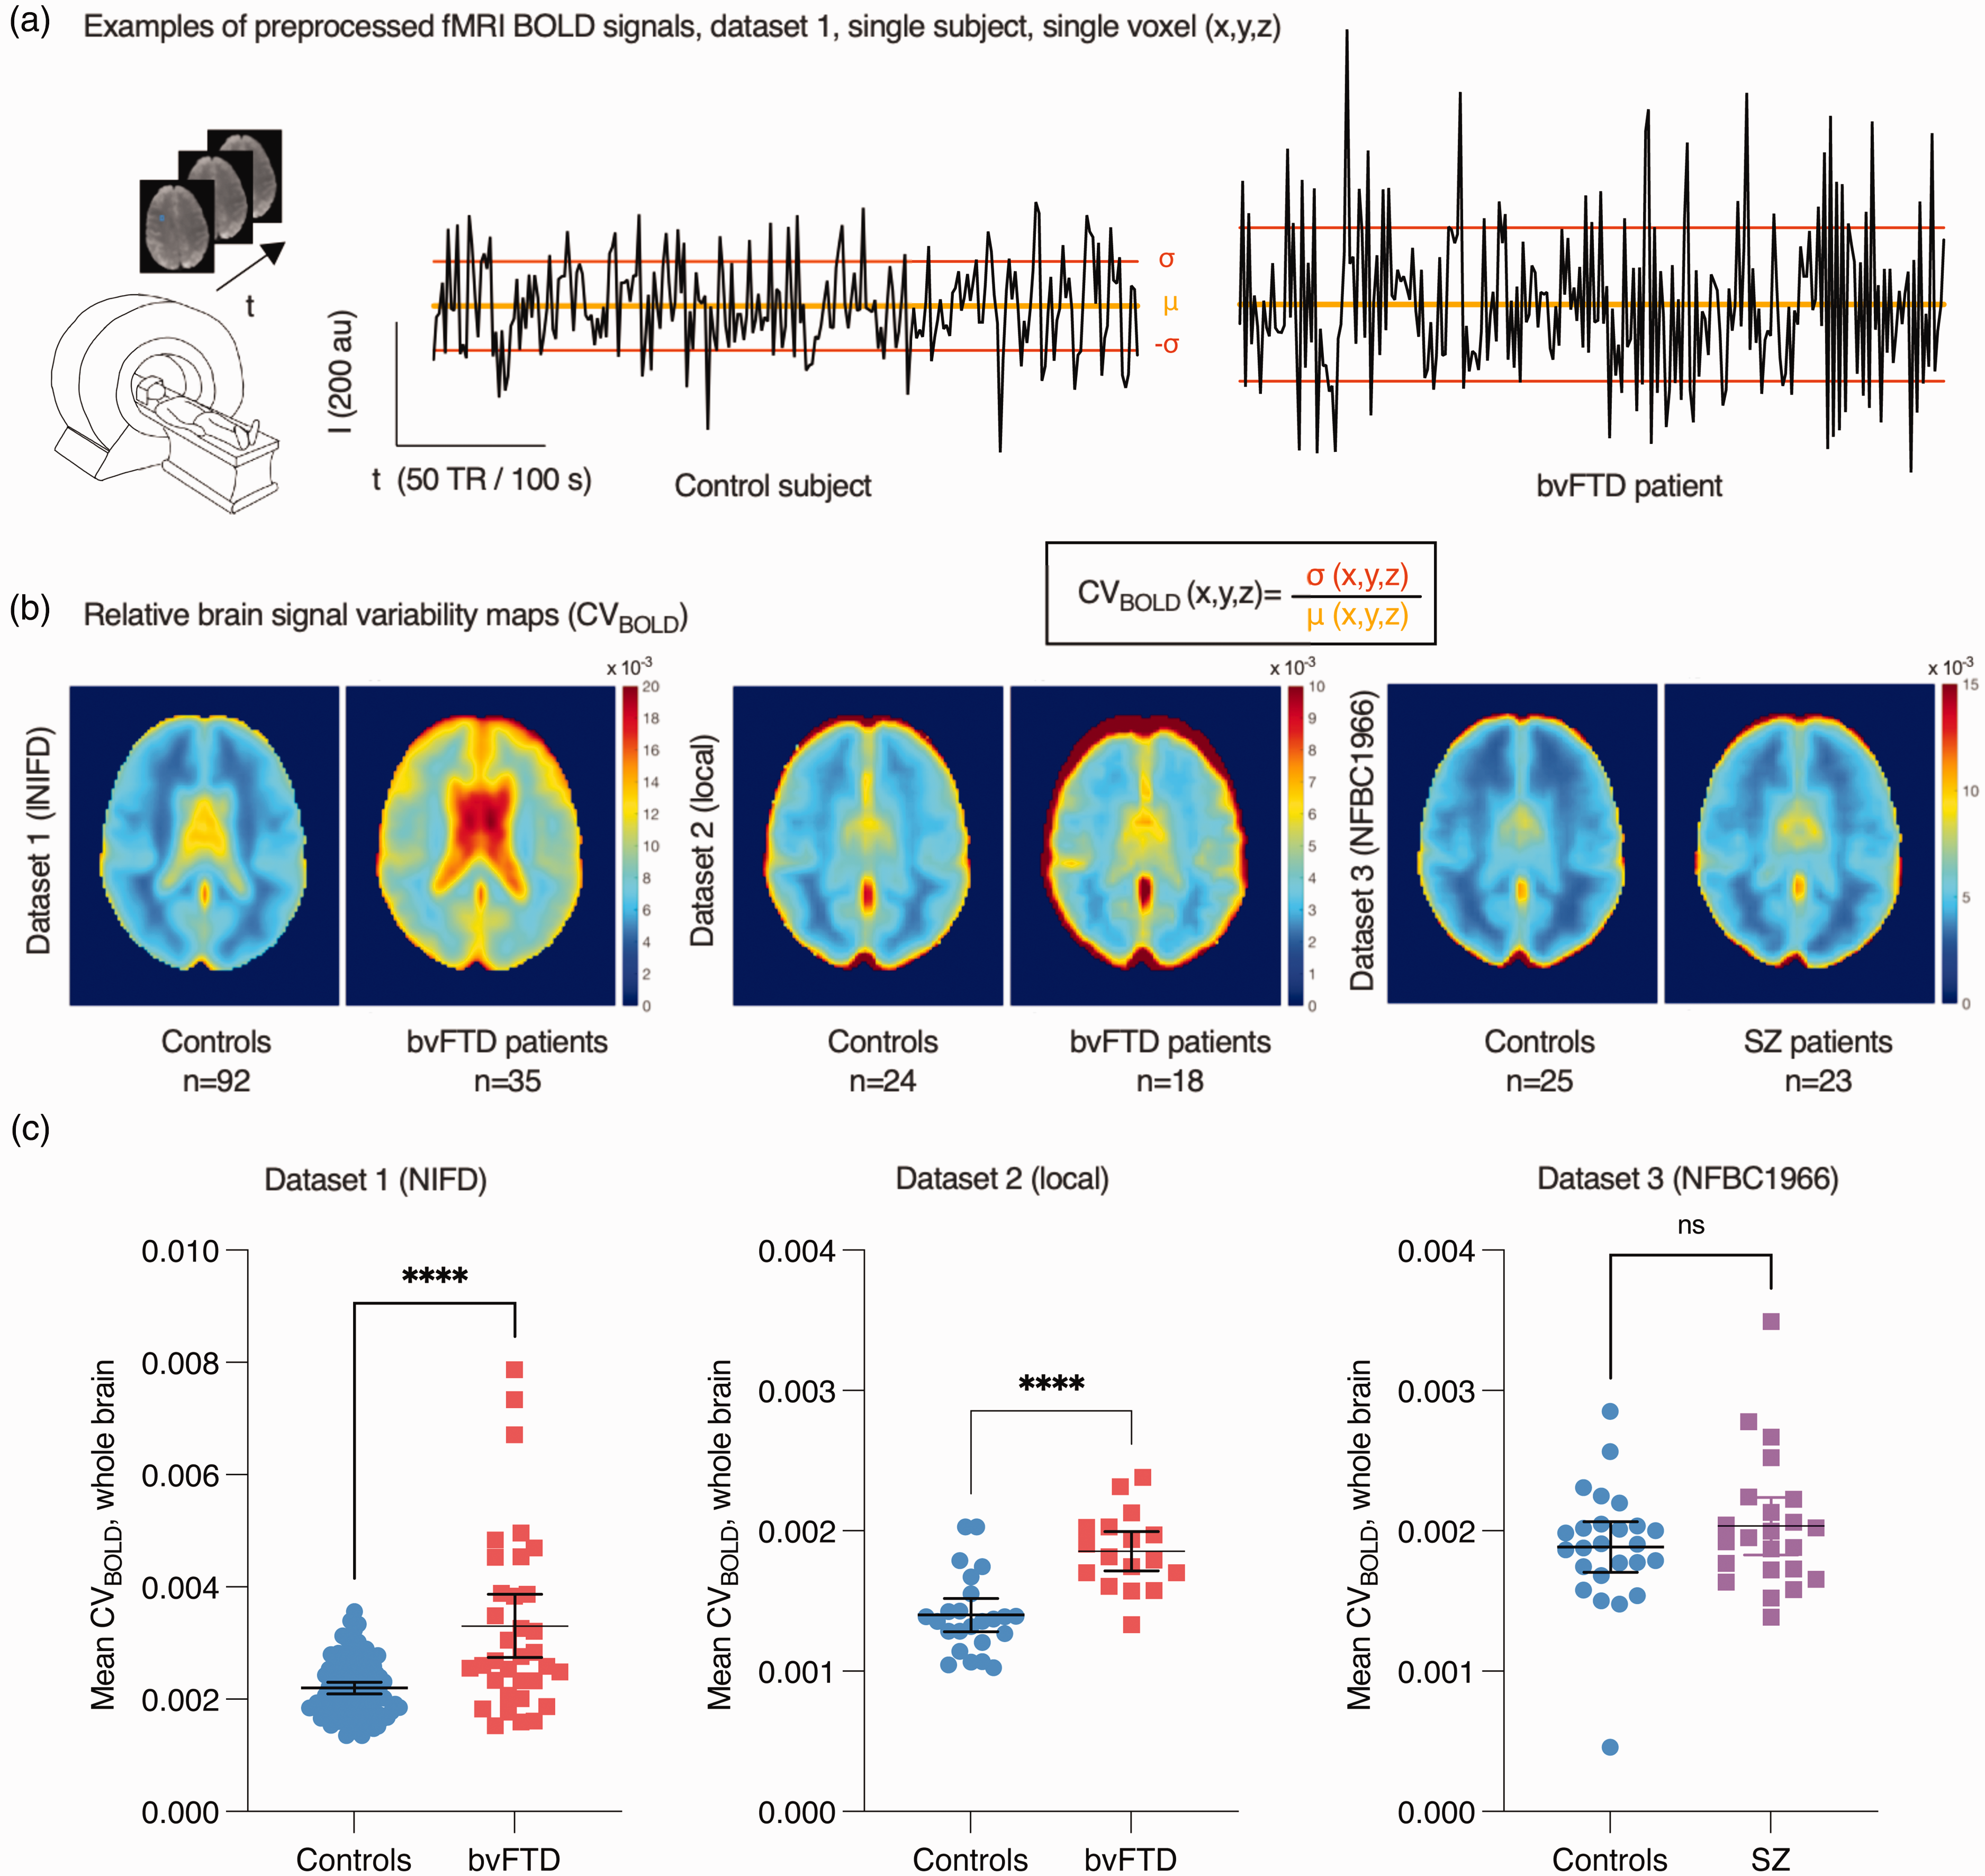
(a) Examples of random single voxel BOLD signal time series and formation of relative brain signal variability maps (CVBOLD) based on each voxel’s time series standard deviation (σ) and mean (μ). (b) Group mean CVBOLD maps on axial view and (c) whole-brain average CVBOLD values (mean ± 95% confidence interval). Note that CVBOLD values are dependent on imaging parameters. t-test values: ****p < 0.0001; ns not significant.
Statistical analyses
All statistical analyses were performed using the GraphPad Prism 9.5.1, GraphPad Software, San Diego, California, USA (www.graphpad.com), unless otherwise stated. Patients were compared to controls in the group-level analysis within each dataset. All results were examined at a p < 0.05 significance level, unless otherwise stated. The χ2 test was used to calculate p-values for categorical variables, and the t-test for continuous variables. Voxel-level statistical analysis of imaging data: To examine differences in patients versus controls, between-group contrast comparisons of the various parametric maps were statistically tested using permutation-based nonparametric testing incorporating threshold-free cluster enhancement (TFCE) and correction for multiple comparisons implemented in the FSL randomise tool with 10,000 random permutations. In functional data analysis (CVBOLD), relative motion parameters were used as regressors, as in our previous study. 41 Region-of-interests (ROIs): Statistically significant differences between groups in the voxel-level analysis were also used to define region-of-interest (ROI) segments for some of the further analysis. ROIAD is defined as the set of voxels with statistically significantly increased CVBOLD values in the AD group from dataset 2 and ROIFTD is defined as the set of common voxels with statistically significantly increased CVBOLD values in both dataset 1 and 2. ROIdataset1 is defined as voxels where there are group-level differences where CVBOLD is higher in bvFTD patients in dataset 1 in baseline imaging. The size of the ROIs in voxels and volume was also reported. The receiver operating characteristic (ROC) curve and the area under the ROC curve (AUC) were calculated to estimate the feasibility of using CVBOLD as a potential biomarker for bvFTD and AD. We plotted ROC curves to evaluate whether CVBOLD could separate healthy controls from patients in datasets 1 and 2. The mean CVBOLD for each subject was calculated using ROIFTD and ROIAD (Figure 2), and AUC was calculated as a measure of classification accuracy. The bootstrap approach was used to estimate the 95% confidence interval of AUC. Follow-up data in dataset 1 were used to estimate the repeatability and the effect of the bvFTD disease progression on CVBOLD. We calculated average CVBOLD within the brain for each subject in dataset 1, and plotted this as a function of time (Figure 3). We analyzed the follow-up CVBOLD data by fitting a mixed model as implemented in GraphPad Prism (Figure 3(a)). This mixed model uses a compound symmetry covariance matrix, and is fit using Restricted Maximum Likelihood (REML). In the absence of missing values, this method gives the same P values and multiple comparisons tests as repeated measures ANOVA. In the presence of missing values (missing completely at random as in here), the results can be interpreted like repeated measures ANOVA. The Pearson correlation coefficient was used as a statistical measure of the strength of a linear relationship between two variables (mean CVBOLD and MMSE/CDR; mean CVBOLD and gray matter volume; mean CVBOLD and education history). Visualization: Most of the data were plotted using GraphPad Prism 9. fMRI data were plotted using Matlab (Figure 1) or MRIcroGL (Figures 2 and 3, https://www.mccauslandcenter.sc.edu/mricrogl/).
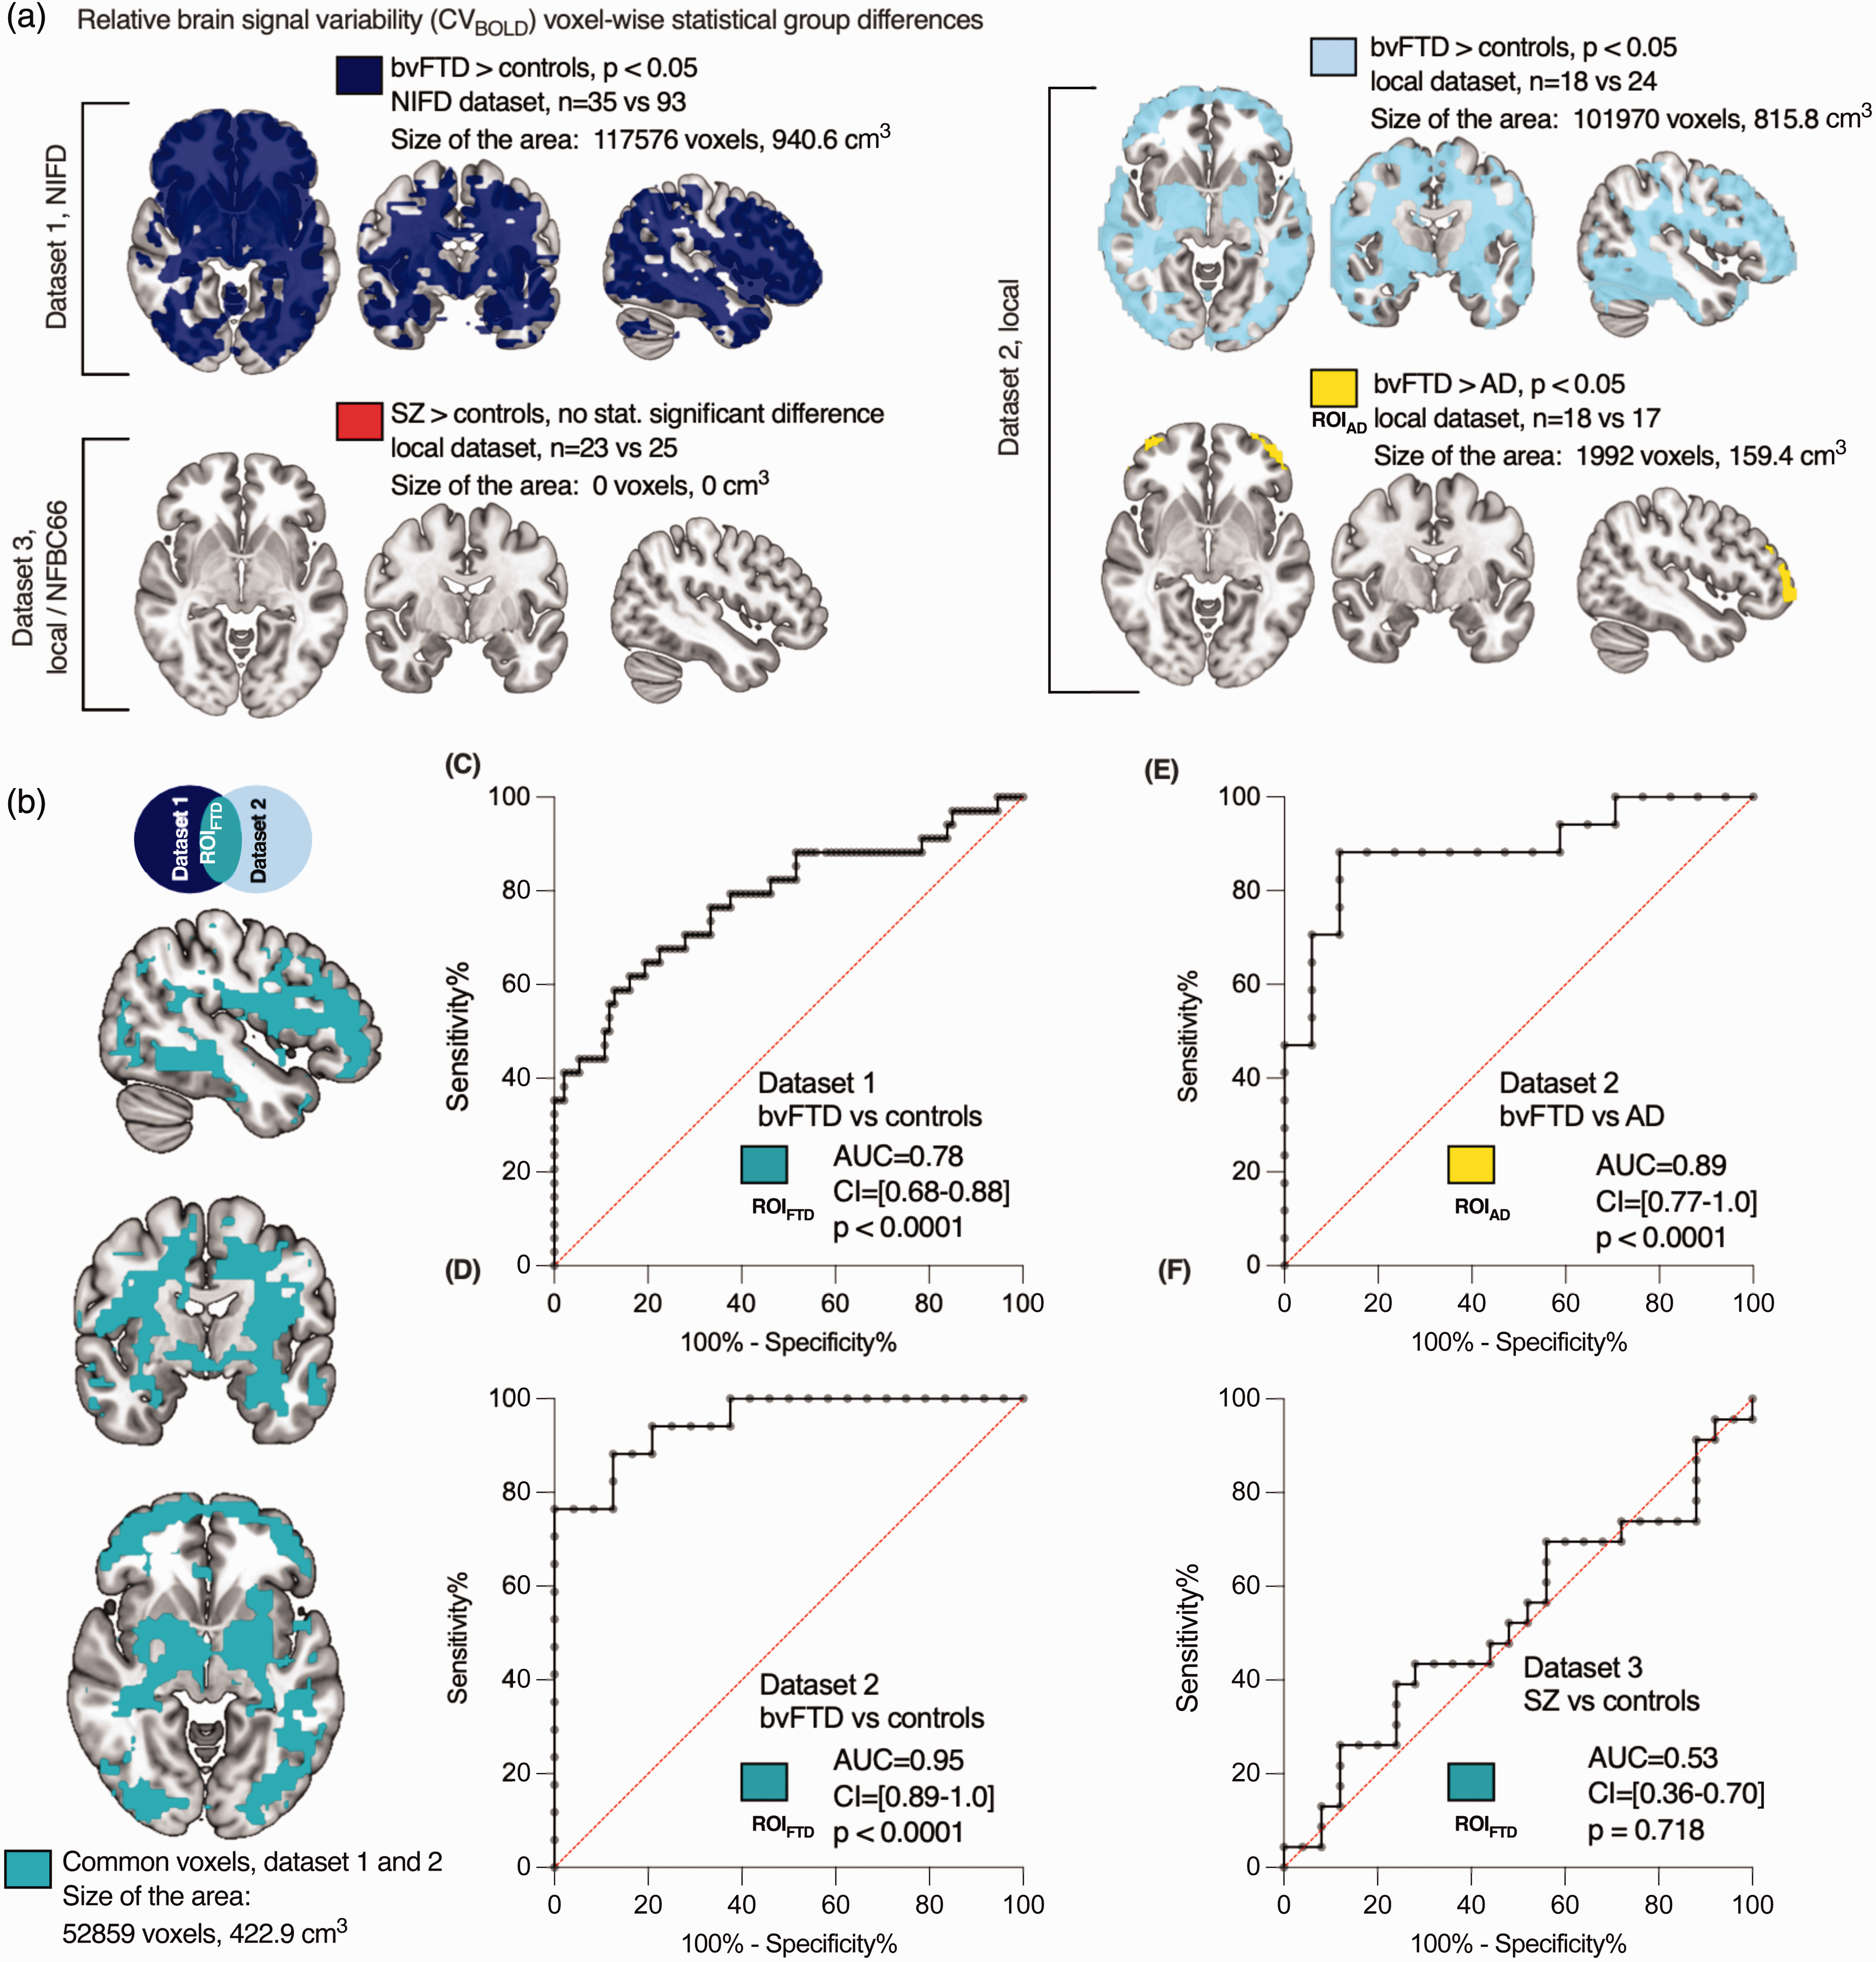
Relative brain signal variability (CVBOLD) in patients compared with controls. Differences in CVBOLD were examined using whole-brain voxel-wise analyses. (a) The maps depict group-level differences where CVBOLD is higher in bvFTD patients in both datasets 1 and 2, and where bvFTD patients exhibit higher CVBOLD levels in the frontal areas than AD patients (p < 0.05, family-wise error corrected). Importantly, there were no statistically significant differences observed between schizophrenia patients and controls. (b) Common voxels between datasets 1 and 2, used as the region-of-interest (ROIFTD) for further analysis. The sizes of these regions/ROIs were reported in both voxels and cubic centimeters. The 3 D map is available in NIFTI format as a supplementary file. (c–f) Area under the ROC curves (AUC) values were calculated. (c,d) AUC for bvFTD and controls using the ROIFTD. (e) AUC for bvFTD vs. AD and (f) AUC for SZ vs. controls. Higher AUC values indicate better discrimination. The 95% confidence intervals (CI) are presented in brackets.
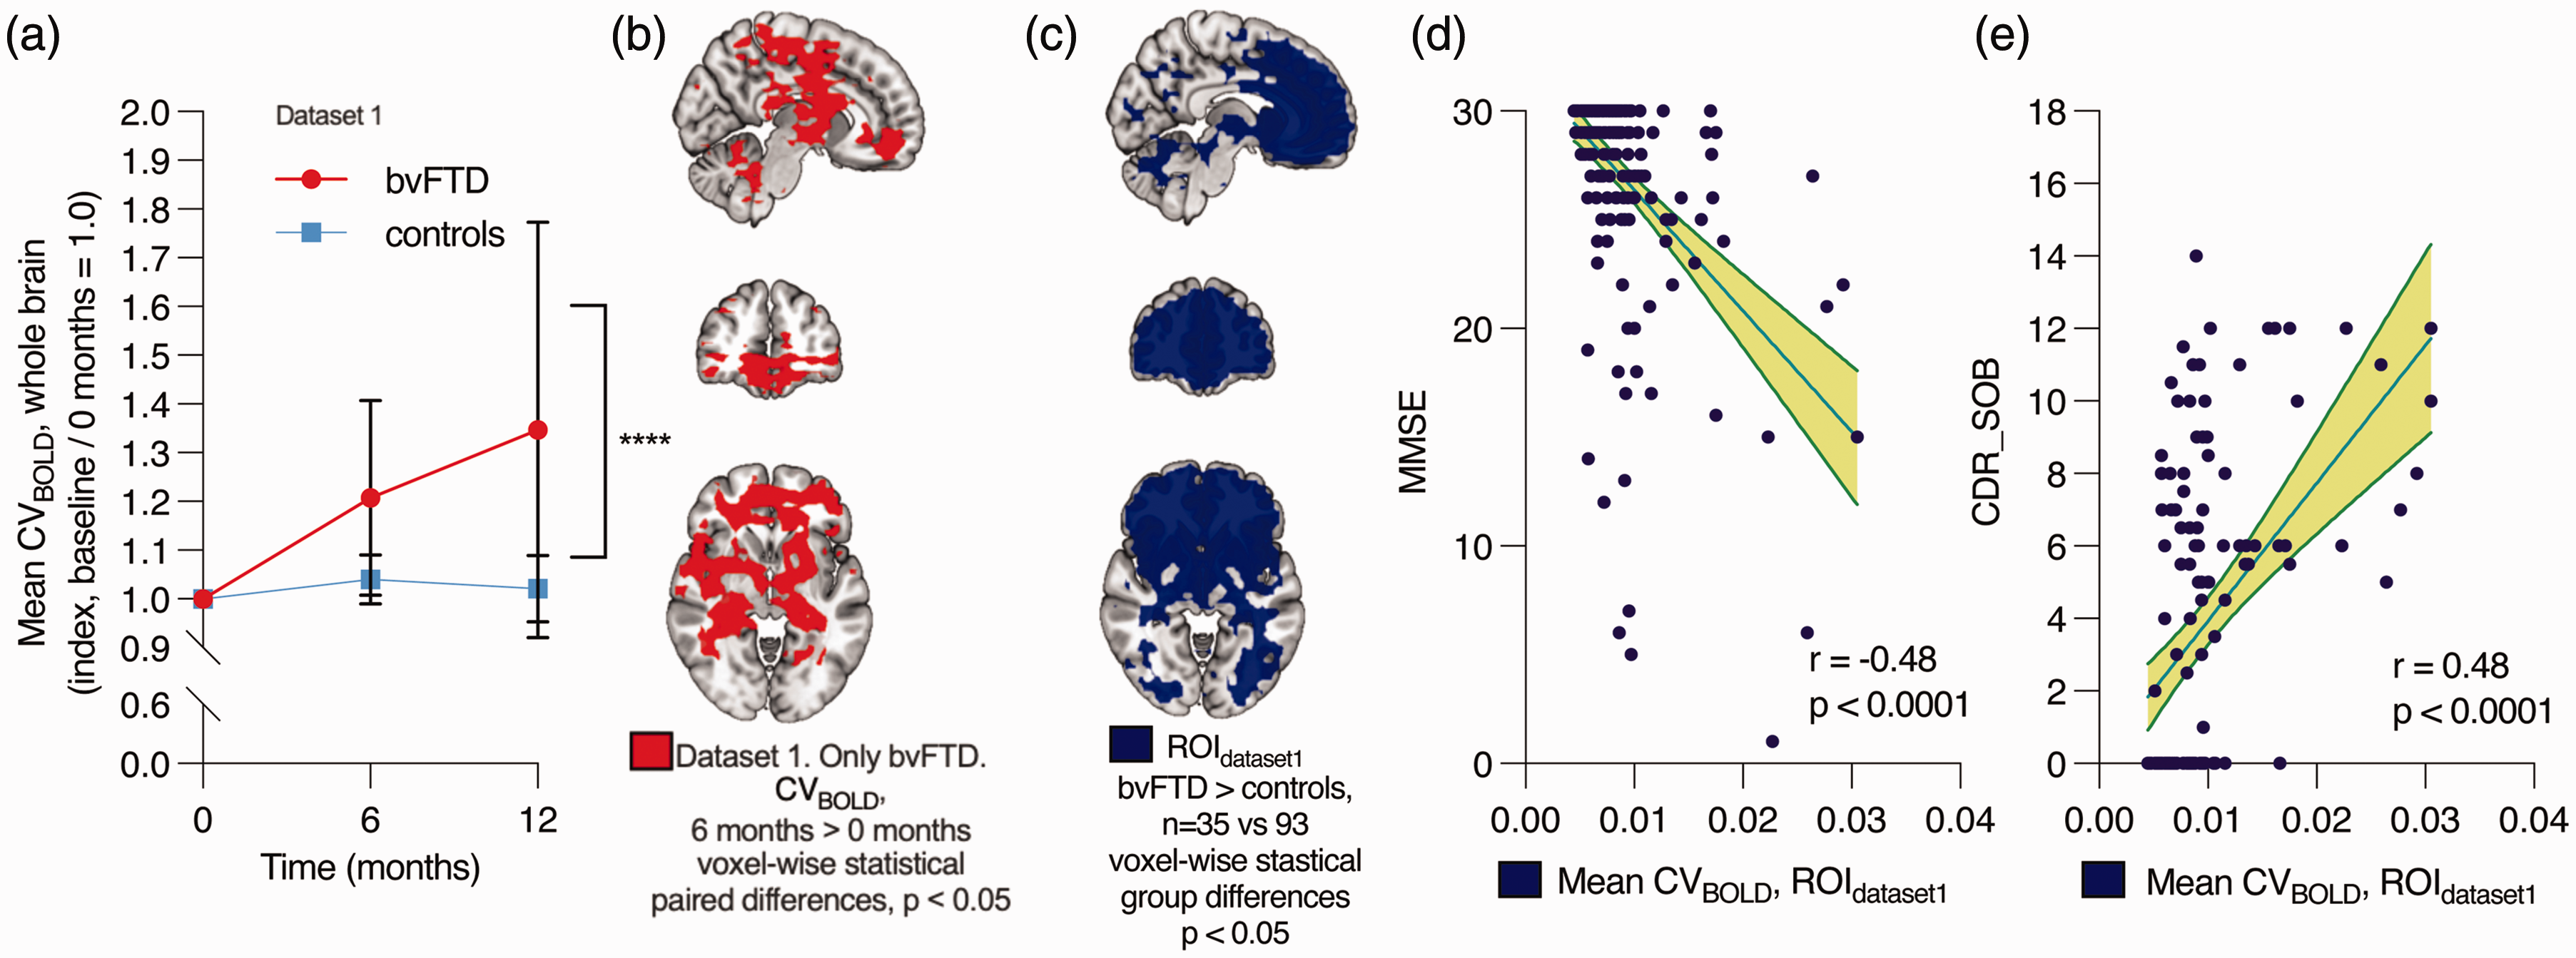
Accuracy, repeatability, and correlation with clinical parameters in dataset 1. (a) Within-individual changes in the average whole-brain CVBOLD over time after baseline imaging (0 months) in bvFTD patients and controls. The data represents the mean ± 95% confidence intervals. Mixed-effects analysis: **** p < 0.0001. (b) Voxel-wise statistically significant difference where CVBOLD increased over 6 months (paired t-test, TFCE-corrected). (c) Voxels displaying group-level differences where CVBOLD is higher in bvFTD patients at baseline (0 months) (same as in Figure 2(a)). This area was used as the region of interest (ROIdataset1) in (d–e). (d) Negative correlation between CVBOLD values in this area and Mini-Mental State Examination (MMSE). MMSE scores range from 0 to 30, with a score of 10 to 26 indicating moderate-to-mild cognitive impairment and (e) correlation between CVBOLD in this area and Clinical Dementia Rating (CDR). CDR Sum of boxes (CDR_SOB) scores range from 0 to 18, with a score above 0.5 indicating cognitive impairment, 4.5–9.0 mild dementia, 9.5–15.5 moderate dementia, and 16–18 severe dementia. 95
No power analysis was performed before the study. Nevertheless, the dataset sizes were in line with previous experiments using functional imaging in patients with a neurodegenerative disease. Data collection and further analyses were not performed blind to the conditions of the experiment. Preprocessing and analysis of neuroimaging data included standard automated analytic FSL pipelines, which were agnostic to the diagnostic and demographic characteristics of the data.
Results
Relative brain signal variability is increased in bvFTD but not in SZ
Physiological relative brain signal variability was estimated using CVBOLD (Figure 1). Compared to healthy controls scanned using the same scanner, the average CVBOLD calculated from whole brain was significantly increased in bvFTD in both datasets 1 (mean 3.3 × 10⁻³ vs. 2.2 × 10⁻³, p < 0.0001, t = 5.891, df = 12) and 2 (mean 1.9 × 10⁻³ vs. 1.4 × 10⁻³, p < 0.0001, t = 5.150, df = 39) (Figure 1(c)). There was no statistically significant difference between SZ and controls (mean 2.0 × 10⁻³ vs. 1.9 × 10⁻³, p = 0.26, t = 1.135, df = 46) (dataset 3, Figure 1(c)).
Patterns of increased relative brain signal variability in bvFTD and AD
To investigate the anatomical distribution of the altered brain signal variability, we did whole-brain voxel-wise analysis, where bvFTD patients showed an increased CVBOLD (p < 0.05, family-wise error corrected for multiple comparisons, and with head-motion parameter used as a regressor). This analysis revealed widespread clusters of voxels distributed around the basal ganglia, periventricular white matter, and frontal and occipital cortices in bvFTD patients in datasets 1 and 2 (Figure 2). Most parts of the frontal cortical grey matter, lateral temporal areas, and periventricular white matter were shown to have a significantly increased CVBOLD (Figure 2(b)). Symmetrically, both the putamina (except one third of the frontal tips), capsula externa, lateral thalami, and amygdalae and medial caudate nuclei were also involved in both datasets. Two thirds of both capsula interna were symmetrically spared in the middle of large changes in both datasets. The cerebellum was also involved symmetrically behind the IV ventricle.
Results from the AD patients have been published previously, where we showed increased brain signal variability in AD compared to controls. 41 In this study we compared CVBOLD maps of bvFTD and AD patients: bvFTD patients showed increased CVBOLD symmetric bilateral frontopolar cortices compared to AD patients, Figure 2(a).
Again, in the more spatially detailed analysis there were still no statistically significant differences between SZ and controls. Furthermore, there were also no regions with significantly higher CVBOLD in controls compared to bvFTD or SZ patients.
Replicability of increase in brain signal variability
To assess the potential for differential diagnosis of the diseases using CVBOLD, we assessed the anatomical concordance of the regions of increased CVBOLD in the two independent bvFTD datasets in this study (Figure 2(b)). The anatomical patterns of increased CVBOLD were markedly alike in both datasets 1 and 2, even though the imaging setups differed (Table 2). There were altogether 52,859 common 2 mm voxels (volume 423 cm3) that showed significantly increased CVBOLD in both bvFTD datasets. This 3 D map is available in NIFTI format as a supplementary file. Quantitatively, the spatial cross-correlation of significantly altered voxels was 0.65 measured using FSLCC software, part of FSL (FMRIB's Software Library70,71)
Accuracy of brain signal variability in discriminating between bvFTD patients, controls, and AD patients
To analyze diagnostic accuracy and repeatability of increased brain BOLD signal variability we used receiver operating characteristics (ROC) curves: the area under the curve (AUC) was calculated to estimate the viability of CVBOLD as a biomarker for bvFTD. Both datasets 1 (AUC = 0.78, 95%-CI 0.68–0.88, p < 0.0001, Figure 2(c)) and 2 (AUC = 0.95, 95%–CI 0.89–1.0, p < 0.0001, Figure 2(d)) demonstrated that CVBOLD was a good to excellent discriminator between bvFTD patients and controls. Additionally, CVBOLD clearly separated bvFTD and AD patients (AUC =0.89, 95%–CI 0.77–1.0, p < 0.0001, Figure 2(e)). ROC curve analysis showed that CVBOLD could not be used to discriminate between SZ and controls (Figure 2(f)).
The increase in brain signal variability is repeatable and associated with lower cognitive scores
We analyzed the repeatability and possible effect of disease progression of these findings using the follow-up data in dataset 1. In the control group, average CVBOLD values within the whole brain were relatively stable over a 12-month period (+2% on average) (Figure 3(a)), thus indicating good repeatability. Over the follow-up period, the CVBOLD increased only in the bvFTD group (+35% on average). The repeated measures were analyzed using the mixed effects model. The difference between bvFTD and controls was statistically significant, F(2, 106) = 12.91, p < 0.0001. The predicted mean of bvFTD was 1.180 and controls 1.021. In a pairwise voxel-based analysis, there was an increase in CVBOLD in the periventricular and frontal areas over 6 months (Figure 3(b)) and 12 months (not shown, similar to Figure 3(b)).
MMSE, global CDR, and CDR Sum of Boxes (CDR SOB) scales were used to test for cognitive impairment in the bvFTD participants (Table 1). There was a negative correlation between MMSE scores and average CVBOLD (r = −0.48, p < 0.0001) and positive correlation between CDR SOB scores and average CVBOLD (r = 0.48, p < 0.0001), meaning that increased BOLD signal variability was associated with lower cognitive function scores (Figure 3(d) and (e)). There was also a positive correlation with global CDR scores (r = 0.46, p < 0.0001).
The impact of gray matter atrophy, head motion, sex, and education on CVBOLD increase
The effect of GM atrophy on CVBOLD values was analyzed (Figure 4) in bvFTD datasets. Anatomically, the increase in CVBOLD in bvFTD was more widespread than atrophy (Figure 4(a) and (b)). There was no statistically significant correlation between the mean CVBOLD values and the volume of GM (Figure 4(c) and (d)). There was small, but statistically significant difference in the relative motion between SZ patients and their controls (0.08 vs 0.06), but not between bvFTD patients and their controls (Supplementary Table 1). In further analysis, relative motion parameters were used as regressors, as in our previous study. 41 In datasets 2 and 3, there were no statistically significant differences between the sexes of the participants. In dataset 1, the use of indicated sex as a regressor in voxel-level analysis using FSL randomise produced statistical maps that were 99% identical to those without a regressor, with an fslcc spatial correlation coefficient r = 0.99 (Supplementary Figure 1). Educational data was available only for dataset 1, where there were no statistically significant differences between bvFTD patients and controls (18 vs. 21 years). The correlation between the mean CVBOLD and education history was found to be weak (r = −0.12, not statistically significant, 95% CI −0.24 to 0.00).
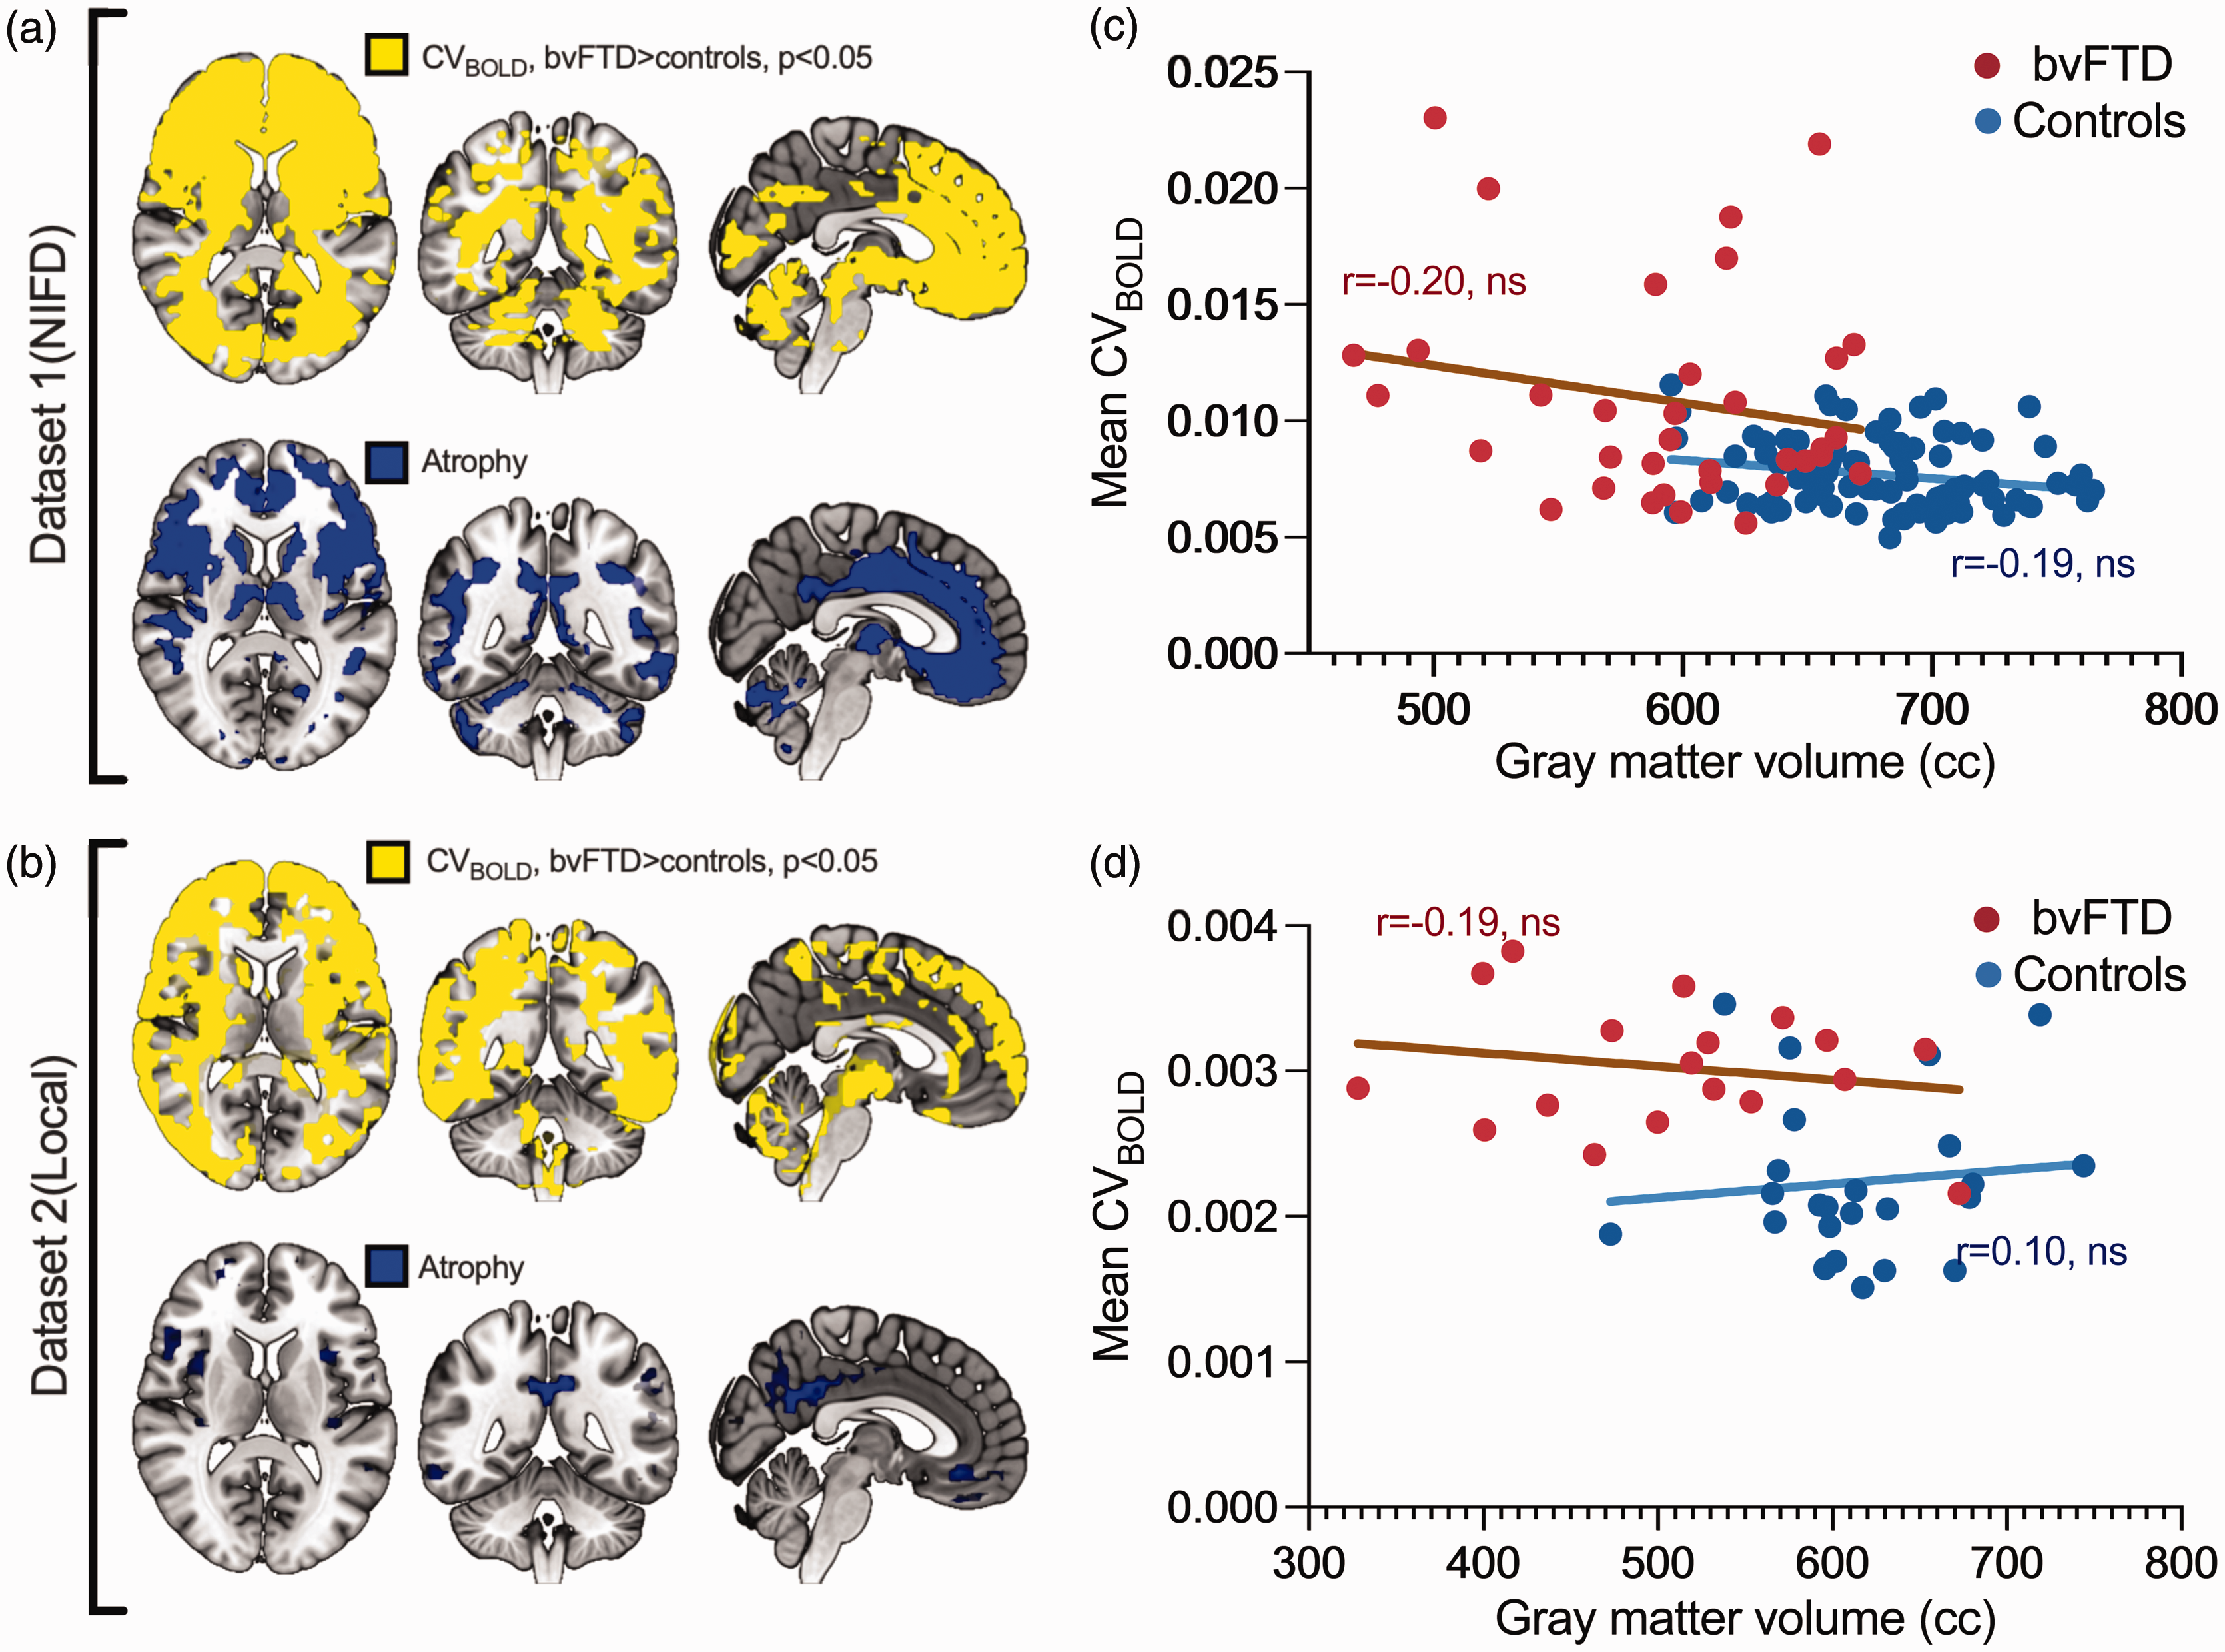
Group-level differences in CVBOLD and voxel-based morphometry results. a-b shows the area where CVBOLD is statistically significantly higher in bvFTD patients compared to controls (marked with yellow). Correspondingly, gray matter volume is lower in bvFTD patients compared to controls, indicated in blue. Panels a and b present p-value maps (family-wise error corrected, p < 0.05). Panels c and d depict the correlation between gray matter volume and whole-brain mean CVBOLD values.
Discussion
In this study, we investigated the relative brain signal variability of the BOLD signal (CVBOLD), measured using fMRI, in two different disorders: the behavioral variant of frontotemporal dementia (bvFTD) and schizophrenia (SZ). We also compared the results with our previous findings of increased CVBOLD in Alzheimer’s disease (AD). 41 We found that CVBOLD was increased in bvFTD patients, but not in SZ patients. We identified increased CVBOLD in an international longitudinal bvFTD dataset, and replicated these findings in an independent local dataset. The follow-up data from the longitudinal FTLDNI study showed that the CVBOLD measure is relatively stable in controls but increases with time in individual bvFTD patients scanned six months and one-year later: this indicates an association between elevated CVBOLD and disease progression. Furthermore, we found that the increase in CVBOLD was associated with lower cognitive function scores (MMSE and CDR). Additionally, we found that CVBOLD could accurately discriminate bvFTD patients from controls (ROC AUC = 0.78–0.95, p < 0.0001) and bvFTD patients from AD patients (ROC AUC = 0.89, p < 0.0001). The effect of brain atrophy on CVBOLD was investigated in this study as it may explain some of the observed results. However, the changes in CVBOLD are more widely localized than atrophy, and there was no correlation between mean CVBOLD values and GM volume. Given the extent of this change, the contribution of the partial volume effect is also presumed to be small. Atrophy GM atrophy patterns in bvFTD were in line with previous literature72 –75
Our initial idea to apply the CV to BOLD signals was inspired by laser speckle contrast imaging (LSCI), a wide-field optical imaging technique capable of visualizing blood flow used in imaging vascular structures and their associated hemodynamics.76 –78 We hypothesized that the CV in fMRI data analysis allows for the quantification of variability in BOLD signals across the whole brain where a higher CV value equals greater variability of amplitude of the BOLD signal, which is closely aligning with its use in LSCI contrast. Increased BOLD signal variability using similar methods has been detected in AD.79,80 Makedonov et al. have also shown that the BOLD signal variation reflects intracranial pulsatility effects in elderly patients with small vessel and chronic kidney disease. 81 A similar study showed a close association of increased intracranial pulsatility (rather than with low global CBF) with the small vessel disease features such as cerebral white matter lesions, cerebral microbleeds, perivascular spaces, brain atrophy, and lacunar infarcts. 82 Similarly, higher white matter hyperintensity burden has been shown to be associated with greater BOLD signal variability in right temporal regions, and lower scores on a measure of global executive functioning. 83
To the best of our knowledge, no previous studies have found increased CVBOLD in bvFTD patients, although increased CVBOLD in AD patients has been reported by us and other research groups.41,79,80 In this study, not only did we find increased CVBOLD in bvFTD patients, we also determined that the spatial localization of this increase differs between these diseases: this makes it possible to discriminate between bvFTD and AD patients. Our results extend this line of research by demonstrating the potential clinical usefulness of CVBOLD as a biomarker for bvFTD diagnosis and monitoring disease progression.
In AD, ultrafast fMRI has determined that the cardiovascular pulse propagation inside the brain parenchyma is more variable, and that the main driver for increased CVBOLD is intracranial cardiorespiratory pulsation: this is thought to link with glymphatic clearance.35,37 The impulse speeds were mostly increased in narrowed peripheral arteries but, importantly, a reversed impulse propagation was detected in (para)hippocampal areas known to present increases in the permeability of the blood brain barrier (BBB) irrespective of β-amyloid/tau depositions in early AD.29,37,41
Interestingly, a recent study has suggested that regional glymphatic dysfunction may also contribute to the bvFTD pathogenesis. 84 Glymphatic function, especially in the anterior and middle regions of brain, was found to be impaired in bvFTD. Moreover, regional glymphatic function showed a spatial correlation with the bvFTD-related metabolic pattern and clinical symptoms. Future studies should investigate the physiological basis of CVBOLD alterations in bvFTD and whether these changes relate to dysfunction of the glymphatic system, especially within the paravascular solute pathways in the BBB.
In addition to investigating physiological pulsations and the glymphatic system, another compelling avenue for future research is exploring the impact of our findings on aspects such as the hemodynamic response function (HRF)85,86 and functional connectivity. Variability of HRF (HRFv) could alter resting-state functional connectivity findings.87,88 However, most algorithms for HRF estimation are tailored for task-related fMRI data, and only a few are applicable to resting-state protocols. Furthermore, identifying the timing information of spontaneous events for HRF estimation is challenging without concurrent electrophysiological recordings. 89 It would be interesting in the future to explore the relationship between our results and such algorithms, especially by utilizing multimodal ultrafast fMRI sequences.
In contrast to bvFTD, we did not find any significant differences in brain signal variability between SZ patients and controls. This finding is somewhat unexpected, as a previous study showed increased variance of BOLD signal in SZ. 90 On the other hand, variance calculated as (standard deviation) 2 is not the same as coefficient of variation which takes also account the average intensity of the volumes (standard deviation/mean). 91 In our previous study, familial risk for psychosis or genetic risk for SZ did not appear to be related to CVBOLD in the brain. 92 Further research using more advanced techniques such as fast MRI may be needed to fully understand the relationship between brain signal variability and SZ.
Our results demonstrate that CVBOLD has an excellent accuracy and repeatability in discriminating bvFTD patients from controls and AD patients. This finding suggests that CVBOLD may be a useful diagnostic tool for distinguishing bvFTD from other neurodegenerative disorders that share similar clinical symptoms, such as AD. Additionally, the high repeatability of brain signal variability suggests that it may be a reliable marker for monitoring disease progression and treatment response in bvFTD patients.
Finally, we found that the increase in brain signal variability was associated with more severe clinical cognitive impairment scores (MMSE and CDR) in bvFTD patients. This finding suggests that increased brain signal variability may be a useful biomarker for tracking disease severity in bvFTD patients. However, further larger prospective longitudinal studies are needed to confirm this association and to determine the potential clinical usefulness of brain signal variability as a prognostic marker for bvFTD.
Our work features some limitations. First, AD and bvFTD diagnoses were based on clinical expertise but with no pathological confirmation. However, the diagnostic criteria for both AD and bvFTD fulfilled standard diagnostic guidelines. Secondly, there is a certain lack of standards in the existing literature with respect to methodology and terminology in brain signal variability research. Also, a common issue in fMRI scanning has been the dependence of the results on scanner and imaging parameters. However, the concordance of the present CVBOLD results in bvFTD from two independent datasets seems to indicate a consistent pattern of bvFTD-related changes, despite quite substantial differences in the different vendor scanners and scanning parameters. As people age, structural and functional changes in the brain occur that can alter the variability and complexity of brain signals. Previous studies have shown that variability in spontaneous brain activity can decrease with age.93,94 In this study we used age-matched controls to mitigate any potential confounding effects arising from the established influence of age on brain signal variability. One of the strengths of this study is the inclusion of the white matter signal in the analyses. However, a limitation is that we did not analyze the effect of white brain matter atrophy on the results to the same extent as the gray matter atrophy. Prospective studies of larger replication samples with longitudinal fMRI should serve to establish the diagnostic usefulness of the present methods.
In conclusion
Our study demonstrates that brain signal variability is increased in bvFTD but not in SZ patients, and that it has excellent accuracy and repeatability in discriminating bvFTD patients from both controls and AD patients. Furthermore, our results suggest that brain signal variability may be a useful biomarker for monitoring disease progression and treatment response in bvFTD patients. However, further research is needed to fully understand the potential clinical applications of this technique.
Supplemental Material
sj-zip-1-jcb-10.1177_0271678X241262583 - Supplemental material for The relative brain signal variability increases in the behavioral variant of frontotemporal dementia and Alzheimer’s disease but not in schizophrenia
Supplemental material, sj-zip-1-jcb-10.1177_0271678X241262583 for The relative brain signal variability increases in the behavioral variant of frontotemporal dementia and Alzheimer’s disease but not in schizophrenia by Timo Tuovinen, Jani Häkli, Riikka Rytty, Johanna Krüger, Vesa Korhonen, Matti Järvelä, Heta Helakari, Janne Kananen, Juha Nikkinen, Juha Veijola, Anne M Remes, Vesa Kiviniemi and on behalf of the Frontotemporal Lobar Degeneration Neuroimaging Initiative in Journal of Cerebral Blood Flow & Metabolism
Footnotes
Data and code availability statement
The individual data from this study cannot be shared because of privacy issues of clinical data. Data from the datasets are available for research only after ethical approval for a specific project. NIFD dataset is available from its own online repositories [Neuroimaging In Frontotemporal Dementia (NIFD/LONI)]. The code for the data analysis of this study is available from the corresponding author on reasonable request.
Funding
Data collection and sharing for this project was funded by the Frontotemporal Lobar Degeneration Neuroimaging Initiative (National Institutes of Health Grant R01 AG032306). The study is coordinated through the University of California, San Francisco, Memory and Aging Center. FTLDNI data are disseminated by the Laboratory for Neuro Imaging at the University of Southern California. We also acknowledge our local funders: University of Oulu Graduate School/Medical Research Center Oulu DP-grant (HH, JK), Emil Aaltonen Foundation (HH, MJ), Pohjois-Suomen Terveydenhuollon tukisäätiö (HH, VKo), The EU Joint Programme – Neurodegenerative Disease Research 2022-120 (VKi), Jane and Aatos Erkko Foundation grants I and 210043 (VKi), Academy of Finland TERVA grants I-II: 314497, 335720 (VKi), Academy of Finland Grant 275342, 338599 (VKi), Valtion tutkimusrahoitus grants from Oulu University hospital (VKi, VKo), Orion Research Foundation sr (JK, TT), Medical Research Center Oulu grant (JK), Maire Taponen Foundation sr (JK), Finnish Brain Foundation sr (JK, Vki), Instrumentarium Science Foundation sr (JK), The University of Oulu Scholarship Foundation (JK), The Finnish Medical Foundation (VKi, JK, TT).
Acknowledgements
With thanks to Sara Oakeley, Basel, Switzerland for constructive comments on the text. Data used in preparation of this article were obtained from the Frontotemporal Lobar Degeneration Neuroimaging Initiative (FTLDNI) database, whose nickname is NIFD. The investigators at NIFD/FTLDNI contributed to the design and implementation of FTLDNI and/or provided data, but did not participate in analysis or writing of this report. The FTLDNI investigators included the following individuals: Howard Rosen, University of California, San Francisco (PI); Bradford C. Dickerson, Harvard Medical School and Massachusetts General Hospital; Kimoko Domoto-Reilly, University of Washington School of Medicine; David Knopman, Mayo Clinic, Rochester; Bradley F. Boeve, Mayo Clinic Rochester; Adam L. Boxer, University of California, San Francisco; John Kornak, University of California, San Francisco; Bruce L. Miller, University of California, San Francisco; William W. Seeley, University of California, San Francisco; Maria Luisa Gorno Tempini, University of California, San Francisco; Scott McGinnis, University of California, San Francisco; Maria Luisa Mandelli, University of California, San Francisco.
Declaration of conflicting interests
The author(s) declared no potential conflicts of interest with respect to the research, authorship, and/or publication of this article.
Authors’ contributions
All authors participated in the interpretation of study results and in the drafting of the manuscript. TT, VKi contributed to the conception and design of the study. RR, AMR, JV, VKi recruited the participants. TT, JH, RR, VKi analyzed the neuroimaging data. TT, JH, RR, JK, VKo, MJ, HH, JKa, JN, JV, AMR, VKi interpreted the results and wrote the paper. All authors have read and approved the final version of the manuscript and agree to be accountable for all aspects of the work in ensuring that questions related to the accuracy or integrity of any part of the work are appropriately investigated and resolved. All persons designated as authors quality for authorship, and all those who qualify for authorship are listed.
References
Supplementary Material
Please find the following supplemental material available below.
For Open Access articles published under a Creative Commons License, all supplemental material carries the same license as the article it is associated with.
For non-Open Access articles published, all supplemental material carries a non-exclusive license, and permission requests for re-use of supplemental material or any part of supplemental material shall be sent directly to the copyright owner as specified in the copyright notice associated with the article.