
Abstract
We studied the regulation dynamics of cerebral blood velocity (CBv) at middle cerebral arteries (MCA) in response to spontaneous changes of arterial blood pressure (ABP), termed dynamic cerebral autoregulation (dCA), and end-tidal CO2 as proxy for blood CO2 tension, termed dynamic vasomotor reactivity (DVR), by analyzing time-series data collected at supine rest from 36 patients with Type-2 Diabetes Mellitus (T2DM) and 22 age/sex-matched non-diabetic controls without arterial hypertension. Our analysis employed a robust dynamic modeling methodology that utilizes Principal Dynamic Modes (PDM) to estimate subject-specific dynamic transformations of spontaneous changes in ABP and end-tidal CO2 (viewed as two “inputs”) into changes of CBv at MCA measured via Transcranial Doppler ultrasound (viewed as the “output”). The quantitative results of PDM analysis indicate significant alterations in T2DM of both DVR and dCA in terms of two specific PDM contributions that rise to significance (p < 0.05). Our results further suggest that the observed DVR and dCA alterations may be due to reduction of cholinergic activity (based on previously published results from cholinergic blockade data) that may disturb the sympatho-vagal balance in T2DM. Combination of these two model-based “physio-markers” differentiated T2DM patients from controls (p = 0.0007), indicating diabetes-related alteration of cerebrovascular regulation, with possible diagnostic implications.
Keywords
Introduction
Over 40 million people in the United States and 415 million worldwide are living with diabetes and 96 million have pre-diabetes, with many unaware that they have the disease. Type 2 diabetes mellitus (T2DM) accelerates brain aging, cognitive decline and atrophy by ∼ 5 years and increases the risk for dementia. 1 Altered regulation of glucose metabolism, insulin resistance and chronic inflammation are the common pathways underlying small-vessel disease and cardiovascular disease associated with diabetes and obesity. 2 Long-term health complications of T2DM include arterial hypertension, stroke, retinopathy, nephropathy, neuropathy and double the risk of cardiovascular morbidity. 3
The cardiovascular effects of T2DM have been studied through analysis of hemodynamic signals including blood pressure and flow, heart rate, respiratory rate, and end-tidal CO2, regarding autonomic system regulation and neurovascular coupling. Most relevant to this study, the association of T2DM with the regulation of cerebral blood flow through the physiological mechanisms of CO2 Dynamic Vasomotor Reactivity (DVR)4 –6 and Dynamic Cerebral Autoregulation (dCA)7 –12 have received considerable attention. Reduced DVR in T2DM was reported as a contributor to cerebral blood flow dysregulation, hypoperfusion and atrophy, with implications for cognitive performance, balance and slower walking in older adults.4 –6 The key role of the autonomic nervous system in regulating cerebral perfusion via the mechanism of dCA has emerged through many studies associating T2DM with cardiovascular autonomic dysfunction and neuropathy.13 –18 In particular, association of T2DM with sympathetic hyperactivity has been reported,19 –21 using specialized sympatho-stimulative tests or features of heart rate variability as measures of sympathetic activity or sympatho-vagal imbalance. We must note the distinction between cerebral and peripheral sympathetic nerve activity56,57 that should be considered in interpreting such results. Reduced baroreflex sensitivity has been reported in T2DM,22 –24 which contributes to autonomic cardiovascular dysregulation. A strong association between endothelial dysfunction and T2DM through various mechanisms has been established, 25 with the role of acetylcholine being recently highlighted in endothelial function. 26 Related to this are the effects of acute glucose elevation in impairing myogenic tone 27 and T2DM reducing myogenic responsiveness and endothelium-dependent vasodilation, 28 as well as the differential effects of insulin resistance on vasoconstrictive vs vasodilative endothelial mechanisms. 29 Finally, significant effects of T2DM have been reported on neurovascular coupling 30 and the blood brain barrier. 31
Studies of the regulation of perfusion dynamics in the entire brain have traditionally focused on the two key mechanisms of dCA and DVR. Since the majority of studies to date have focused on dCA, various methods and metrics have been proposed for its quantification, with none being universally accepted.58,59 In the present study, the dynamic effects of T2DM upon dCA and DVR are quantified via a
In the present study, we focus on the analysis of possible effects of T2DM on causal dynamic relationships between beat-to-beat spontaneous variations of measured arterial blood pressure (ABP) and end-tidal CO2 at supine rest, viewed as two concurrent input signals, and cerebral blood velocity (CBv), measured at the right or left middle cerebral artery (MCA) via Transcranial Doppler ultrasound (TCD), viewed as the corresponding output signal. These possible causal relationships are quantified by predictive input-output dynamic models using kernel functions and the method of Principal Dynamic Modes (PDMs) pioneered by our lab.32 –36 We present results from the application of this approach to time-series data collected in 36 participants with T2DM and 22 age-matched non-diabetic normotensive controls under supine resting conditions in order to examine the hypothesis that T2DM causes significant alterations of the dynamics of dCA and DVR, as quantified through predictive dynamic modeling. These findings may serve as “physio-markers” to assist the improved diagnosis and monitoring of the progression or treatment of T2DM.
Methods
The employed dynamic modeling approach is canonical (i.e. generally applicable) and has been shown to yield robust input-output linear dynamic models of certain aspects of cerebral blood flow regulation using spontaneous time-series data.33 –36 Key parameters of the estimated models and model-based indices of the regulation of cerebral hemodynamics (e.g. DVR and dCA) can be used as physio-markers to differentiate T2DM patients from non-diabetic controls.
Standard protocol approvals, registrations and patient consent
The analyzed data are from a subset cohort of a parent prospective study evaluating the effects of T2DM on cerebrovascular disease, which enrolled 69 participants with or without diabetes, aged 50–85 years, who completed cerebral blood flow and CO2 vasoreactivity monitoring using TCD and 3 T MRI. Protocol details and dataset information are available on Physionet37,38 and in previous publications using the data.4,9 The study was conducted in the Syncope and Falls in the Elderly Laboratory, at the Clinical Research Center at the Beth Israel Deaconess Medical Center. Participants were recruited consecutively and provided informed written consent, as approved by the Committee on Clinical Investigations of the Beth Israel Deaconess Medical Center that follows the ethical guidelines of the Declaration of Helsinki. Participants were admitted to the Clinical Research Center for an overnight stay, and completed medical history, physical and neurological examinations, and neuropsychological assessments. The hemodynamic data were collected next morning after an overnight rest. For the T2DM patients with controlled hypertension, antihypertensive medications were tapered and withdrawn on the morning of the study; glycemic control medications were administered as usual. Systolic, diastolic and mean BP were measured every 20 minutes for 24 hours using a wearable 24-hour ambulatory blood pressure monitoring device (Dynapulse, Inc., Vista, CA) before the study visits to ensure safety.
Participants
The cohort of this study consisted of 36 participants with T2DM aged 50–85 years (28 of them with controlled hypertension, receiving anti-hypertensive medications), and 22 non-diabetic, normotensive, age/sex–matched adults with normal fasting glucose and hemoglobin A1c (HbA1c). Recruitment was completed via community advertisement. T2DM participants were diagnosed and treated >5 years with oral agents and/or combinations with insulin, and were either normotensive (BP <140/90 mm Hg and no medical history of arterial hypertension) or hypertensive (BP >140/90 mm Hg and/or treated for arterial hypertension). Participants with diabetes were treated with oral glucose-control agents (sulfonylurea, second-generation agents) or their combinations and diet, and for arterial hypertension and hyperlipidemia (see Table 1).
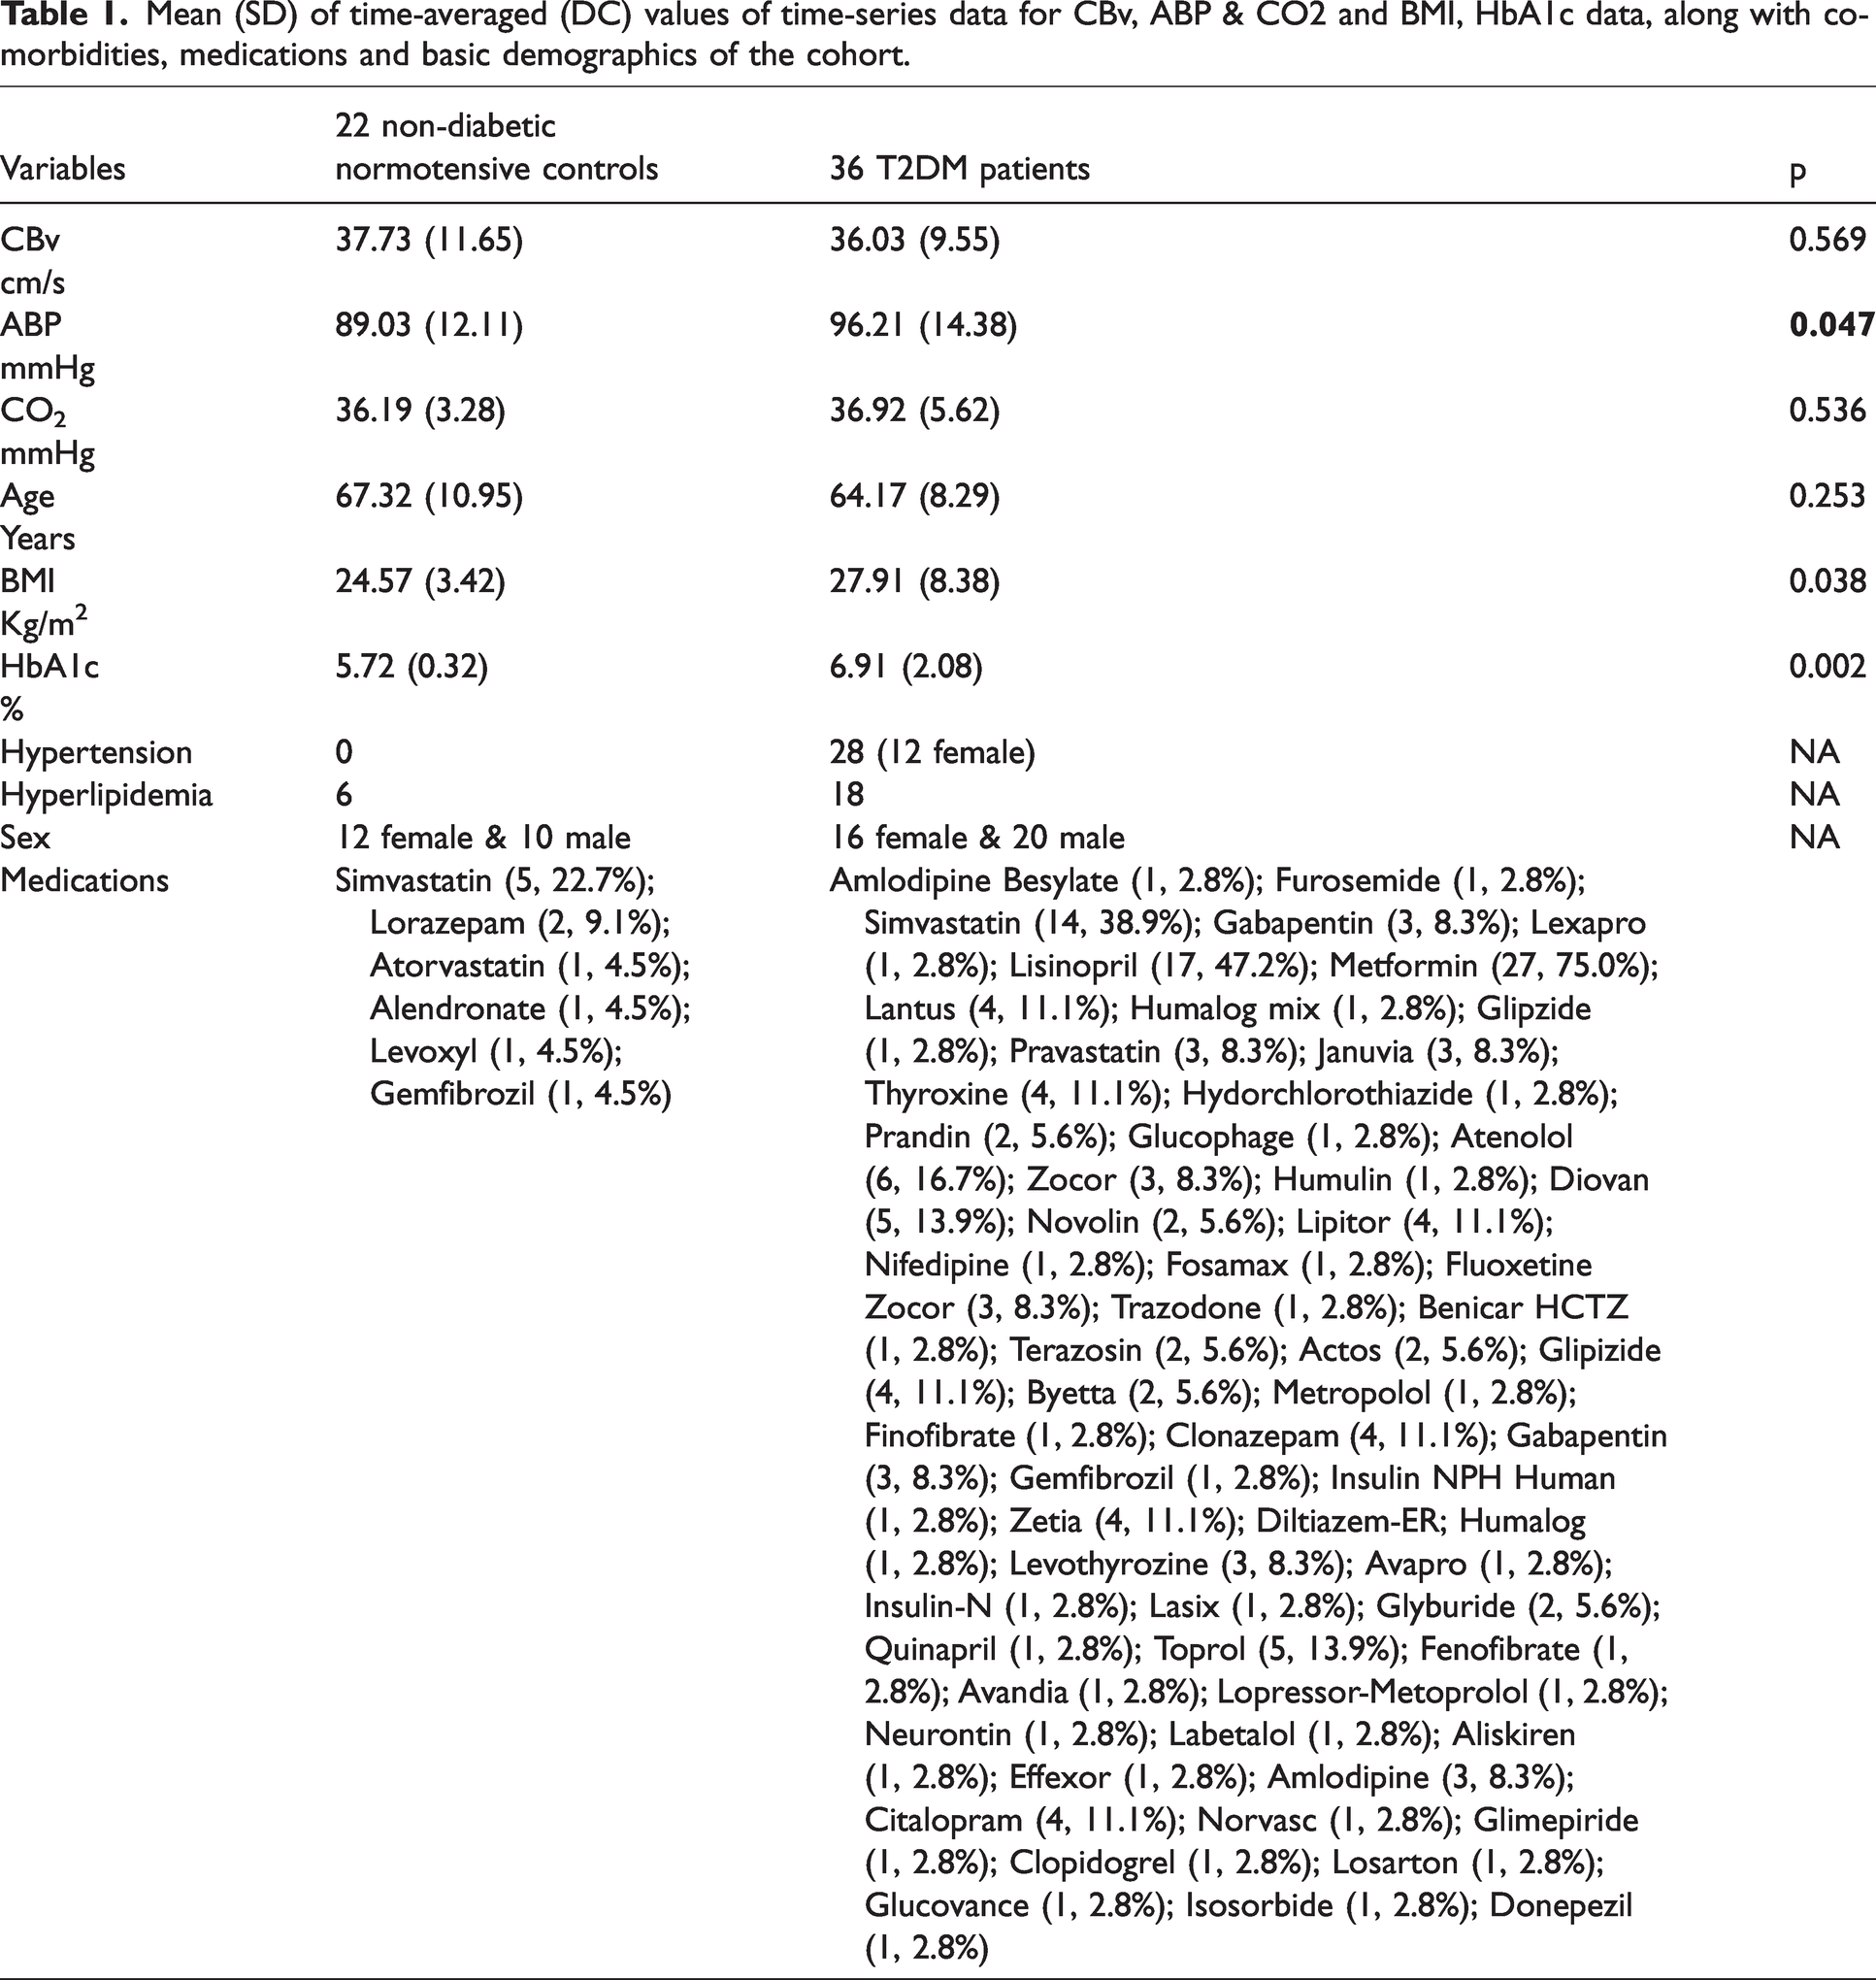
Mean (SD) of time-averaged (DC) values of time-series data for CBv, ABP & CO2 and BMI, HbA1c data, along with co-morbidities, medications and basic demographics of the cohort.
Exclusion criteria were: type 1 DM, history of stroke, subacute myocardial infarction, significant cardiac diseases, arrhythmias and nephropathy, kidney or liver transplant, congestive heart failure, carotid artery stenosis, neurological or other systemic disorders, dementia or sub-threshold Mini Mental Status Exam (MMSE) scores (≥3 points below the comparative normal value for the subject’s age group and education level, or ≤24), current recreational drug or alcohol abuse, severe obesity (body mass index (BMI) >40), claustrophobia, or 3 Tesla MRI-incompatible metal implants, pacemakers or arterial stents.
Data collection
The participants rested supine for ten minutes with continuous monitoring of cardiovascular, cerebrovascular, and respiratory signals in order to establish a baseline. All signals were recorded at 500 Hz using Labview NIDAQ (National Instruments Data Acquisition System 64 Channel/100 Ks/s, Labview 6i, Austin, TX). The right or left MCA was insonated from the temporal windows with 2-MHz probes using a TCD system (Multidop X4, DWL Neuroscan Inc, Sterling VA). The probe was positioned to record the maximal blood velocity and stabilized using a 3-dimesional positioning holder that was provided by DWL Medical Systems and was specific to their TCD probes, but it is no longer commercially available. TCD data were analyzed from the left MCA in 17 patients and 7 controls, and from the right MCA in 19 patients and 15 controls. The electrocardiogram was measured from a modified lead II or III using a Spacelab monitor (SpaceLab Medical, Issaquah, WA). Arterial blood pressure was recorded from a finger with a Finapres device (Ohmeda Monitoring Systems, Englewood, CO) that reliably tracks intra-arterial blood pressure when controlled for finger position and temperature and was verified by arterial tonometry. Respiration and end-tidal CO2 were measured from a mask using an infrared end-tidal volume monitor (Datex Ohmeda, Madison, WI). The data are available on PhysioNet for use by the biomedical peer community.37,38 Five-minute data segments, sampled at 500 Hz, were selected and were reduced to beat-to-beat mean arterial blood pressure (ABP) and concurrent mean cerebral blood velocity (CBv) using averages over the respective cardiac cycle (unevenly sampled), as well as breath-to-breath end-tidal CO2 measurements that were placed at the mid-point of each breath (unevenly sampled). These datasets were re-sampled every 0.5 s via cubic-spline interpolation to make them evenly sampled and contemporaneous for the dynamic modeling analysis. All time-series data were subsequently high-pass filtered at 0.005 Hz to remove the DC component (i.e. the time-average of the respective time-series data) and very low-frequency trends. Outliers in all datasets were clipped at ±2.5 standard deviations, as was done in previous studies.33 –36 The preprocessed end-tidal CO2 data will be termed “CO2” hereafter to distinguish it from the molecule.
Data analysis
Data analysis relies primarily on our dynamic modeling approach that utilizes the general two-input linear dynamic model representing the discrete-time output signal y(n) (the CBv time-series data) in terms of the following convolutional relation involving the two discrete-time inputs p(n) (ABP time-series data) and x(n) (CO2 time-series data):

Validation of the estimated models
A computational “boot-strapping” method to validate the statistical significance of the estimated model (i.e. the kernel estimates) is to generate “null” kernel estimates under the Null Hypothesis that there is no predictive relation between the inputs and the outputs by randomly shuffling the output time-series data, and then use these “null” kernel estimates (1000 of them in this study) to generate “null” model predictions and their respective Normalized Mean-Square Errors (NMSEs). Using the NMSEs from the 1000 null model predictions, we construct the histogram of the NMSE values for the Null Hypothesis – against which, the NMSE value of the actual estimated model prediction can be tested at 5% level of significance for each subject. For the two-input model of this study, this method is applied first for the ABP input against the shuffled CBv output, and subsequently for the CO2 input against the shuffled difference of the CBv output minus the prediction of the ABP-input kernel. The mean (SD) values of the %NMSE threshold, which was computed from the aforementioned bootstrapping histograms at 5% significance level, were 97.63 (0.33) for the ABP-input kernel and 97.99 (0.30) for the CO2-input kernel, while the maximum values of the actual %NMSEs were 90.02 and 96.63, respectively. Application of this method demonstrated the statistical significance of all estimated kernels and, consequently, validated the estimated predictive models.
Frequency-domain analysis
The DFT of the ABP-to-CBv kernel (a complex function of frequency) is the cerebrovascular “admittance function”. It is usually presented in terms of its magnitude (termed “Gain Function”) and phase (termed “Phase Function”). It provides a measure of the inverse of cerebrovascular impedance. The average Gain and Phase Functions result from DFT of the average ABP-to-CBv kernel. The value of the Gain Function at zero frequency is the cerebrovascular resistance. As the frequency increases, the values of the Gain Function are increasingly influenced by the compliant elements of the cerebral vasculature (including active regulatory mechanisms, vascular tones and vasoactive processes). Similar frequency-domain analysis can be applied to the CO2-to-CBv kernels.
Analysis with principal dynamic modes
In order to elucidate and refine further the difference in the dynamics of cerebral flow regulation between T2DM patients and age-matched non-diabetic controls, we employ the analysis tool of Principal Dynamic Modes (PDMs) that has been introduced by our lab.32 –36,39,40 The PDMs of each input-output pathway are obtained via Singular Value Decomposition (SVD) of a rectangular matrix composed of the kernel estimates from all available control subjects. Thus, the PDMs represent the kernel components that are most frequently found in the kernel estimates of the available controls cohort (their relative importance being quantified by the respective Singular Values obtained from SVD). The PDMs can be expressed as linear combinations of the employed Laguerre Functions with coefficients the elements of the respective Singular Vectors (obtained from SVD). The kernel decomposition/expansion in terms of the PDMs represents the fastest convergence in absolute size of expansion coefficients in the function space defined by the employed Laguerre Functions. Thus, the PDMs represent rank-ordered orthonormal dynamic components of the respective input-output causal pathway (kernel). When a kernel estimate is expanded on the orthonormal basis that is defined by the respective set of PDMs, the expansion coefficients (termed “PDM gains”) quantify the contribution of the respective PDM to the expanded kernel.
Statistical analysis
The statistical analysis in this study included the estimation of the Laguerre expansion coefficients of each kernel in equation (3) of the APPENDIX (supplementary material) via ordinary least-squares and the two-sided t-tests of significance for the mean difference of PDM expansion coefficients (gains) between patients and controls. All PDM gain distributions were tested for normality via the Anderson-Darling test. When the normality test is rejected, we use the Mann-Whitney U test that is independent of normality. The method of the Fisher Discriminant 41 was used for the construction of the Composite Diagnostic Index from the two PDM gains that were found to be significantly different between patients and controls.
Results
Table 1 shows the demographics, some key measurements and the mean (SD) values of the time-averages of the time-series data (termed DC values) for the 36 T2DM patients and 22 non-diabetic normotensive controls. Only the mean hemoglobin A1c (HbA1c), body-mass index (BMI) and ABP DC were significantly higher for the T2DM patients (p < 0.05), as expected.
Average kernels, gain & phase functions, and model-predicted step responses
The obtained average kernel estimates for the ABP-to-CBv and CO2-to-CBv dynamic relations are shown in Figure 1 for the 22 control subjects (blue line) and the 36 diabetic patients (red line). The ABP-to-CBv average kernels are similar in temporal pattern but slightly different in scale (left panel), while the CO2-to-CBv kernels have distinct differences in temporal pattern, especially for short lags (<5 s) where the patients exhibit much smaller values (right panel).
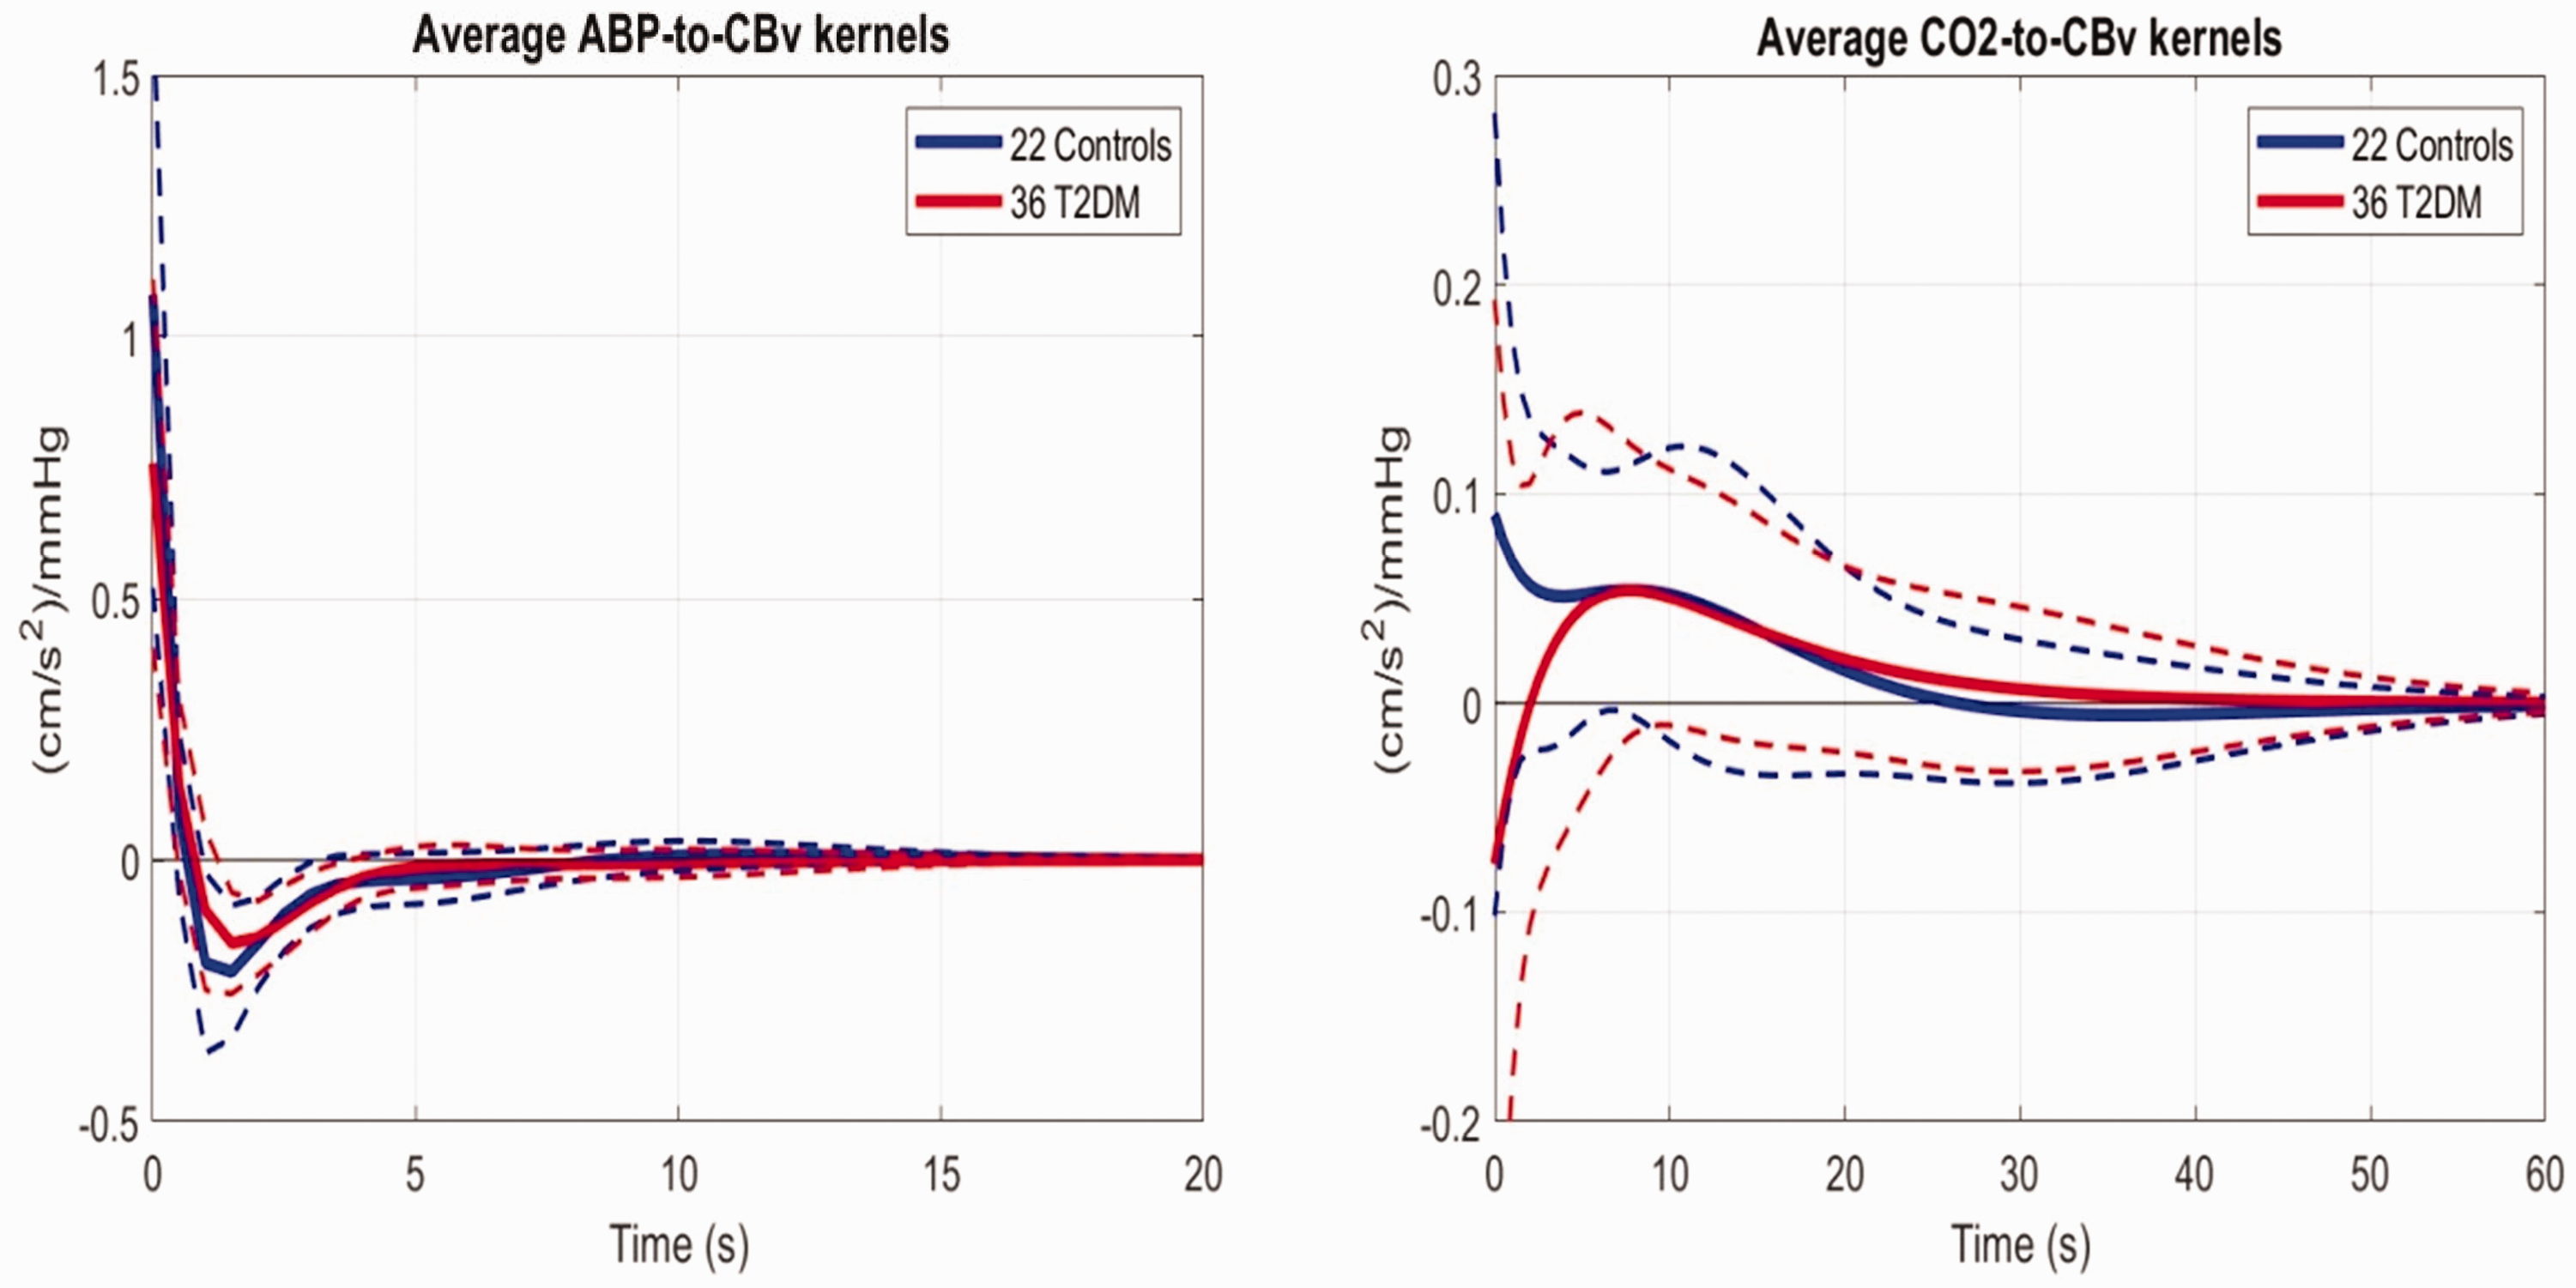
Average kernel estimates for the ABP-to-CBv (left) and CO2-to-CBv (right) relations for the 22 controls (blue) and 36 T2DM patients (red).
The average model-predicted CBv responses of patients and controls to a 1 mmHg step increase of the ABP input (while the CO2 input is kept at baseline zero) are shown in the left panel of Figure 2 and indicate lower maximum for patients and different time-course for patients vs controls (i.e. controls exhibit a trough at 8 s lag, rebounding afterwards, while the patients follow a monotonic decline until reaching steady-state). The average model-predicted CBv responses of patients and controls to a 1 mmHg step increase of the CO2 input (while the ABP input is kept at baseline zero) are shown in Figure 2 (right panel) and illustrate the impairment of DVR in the patients because of smaller values for all times.
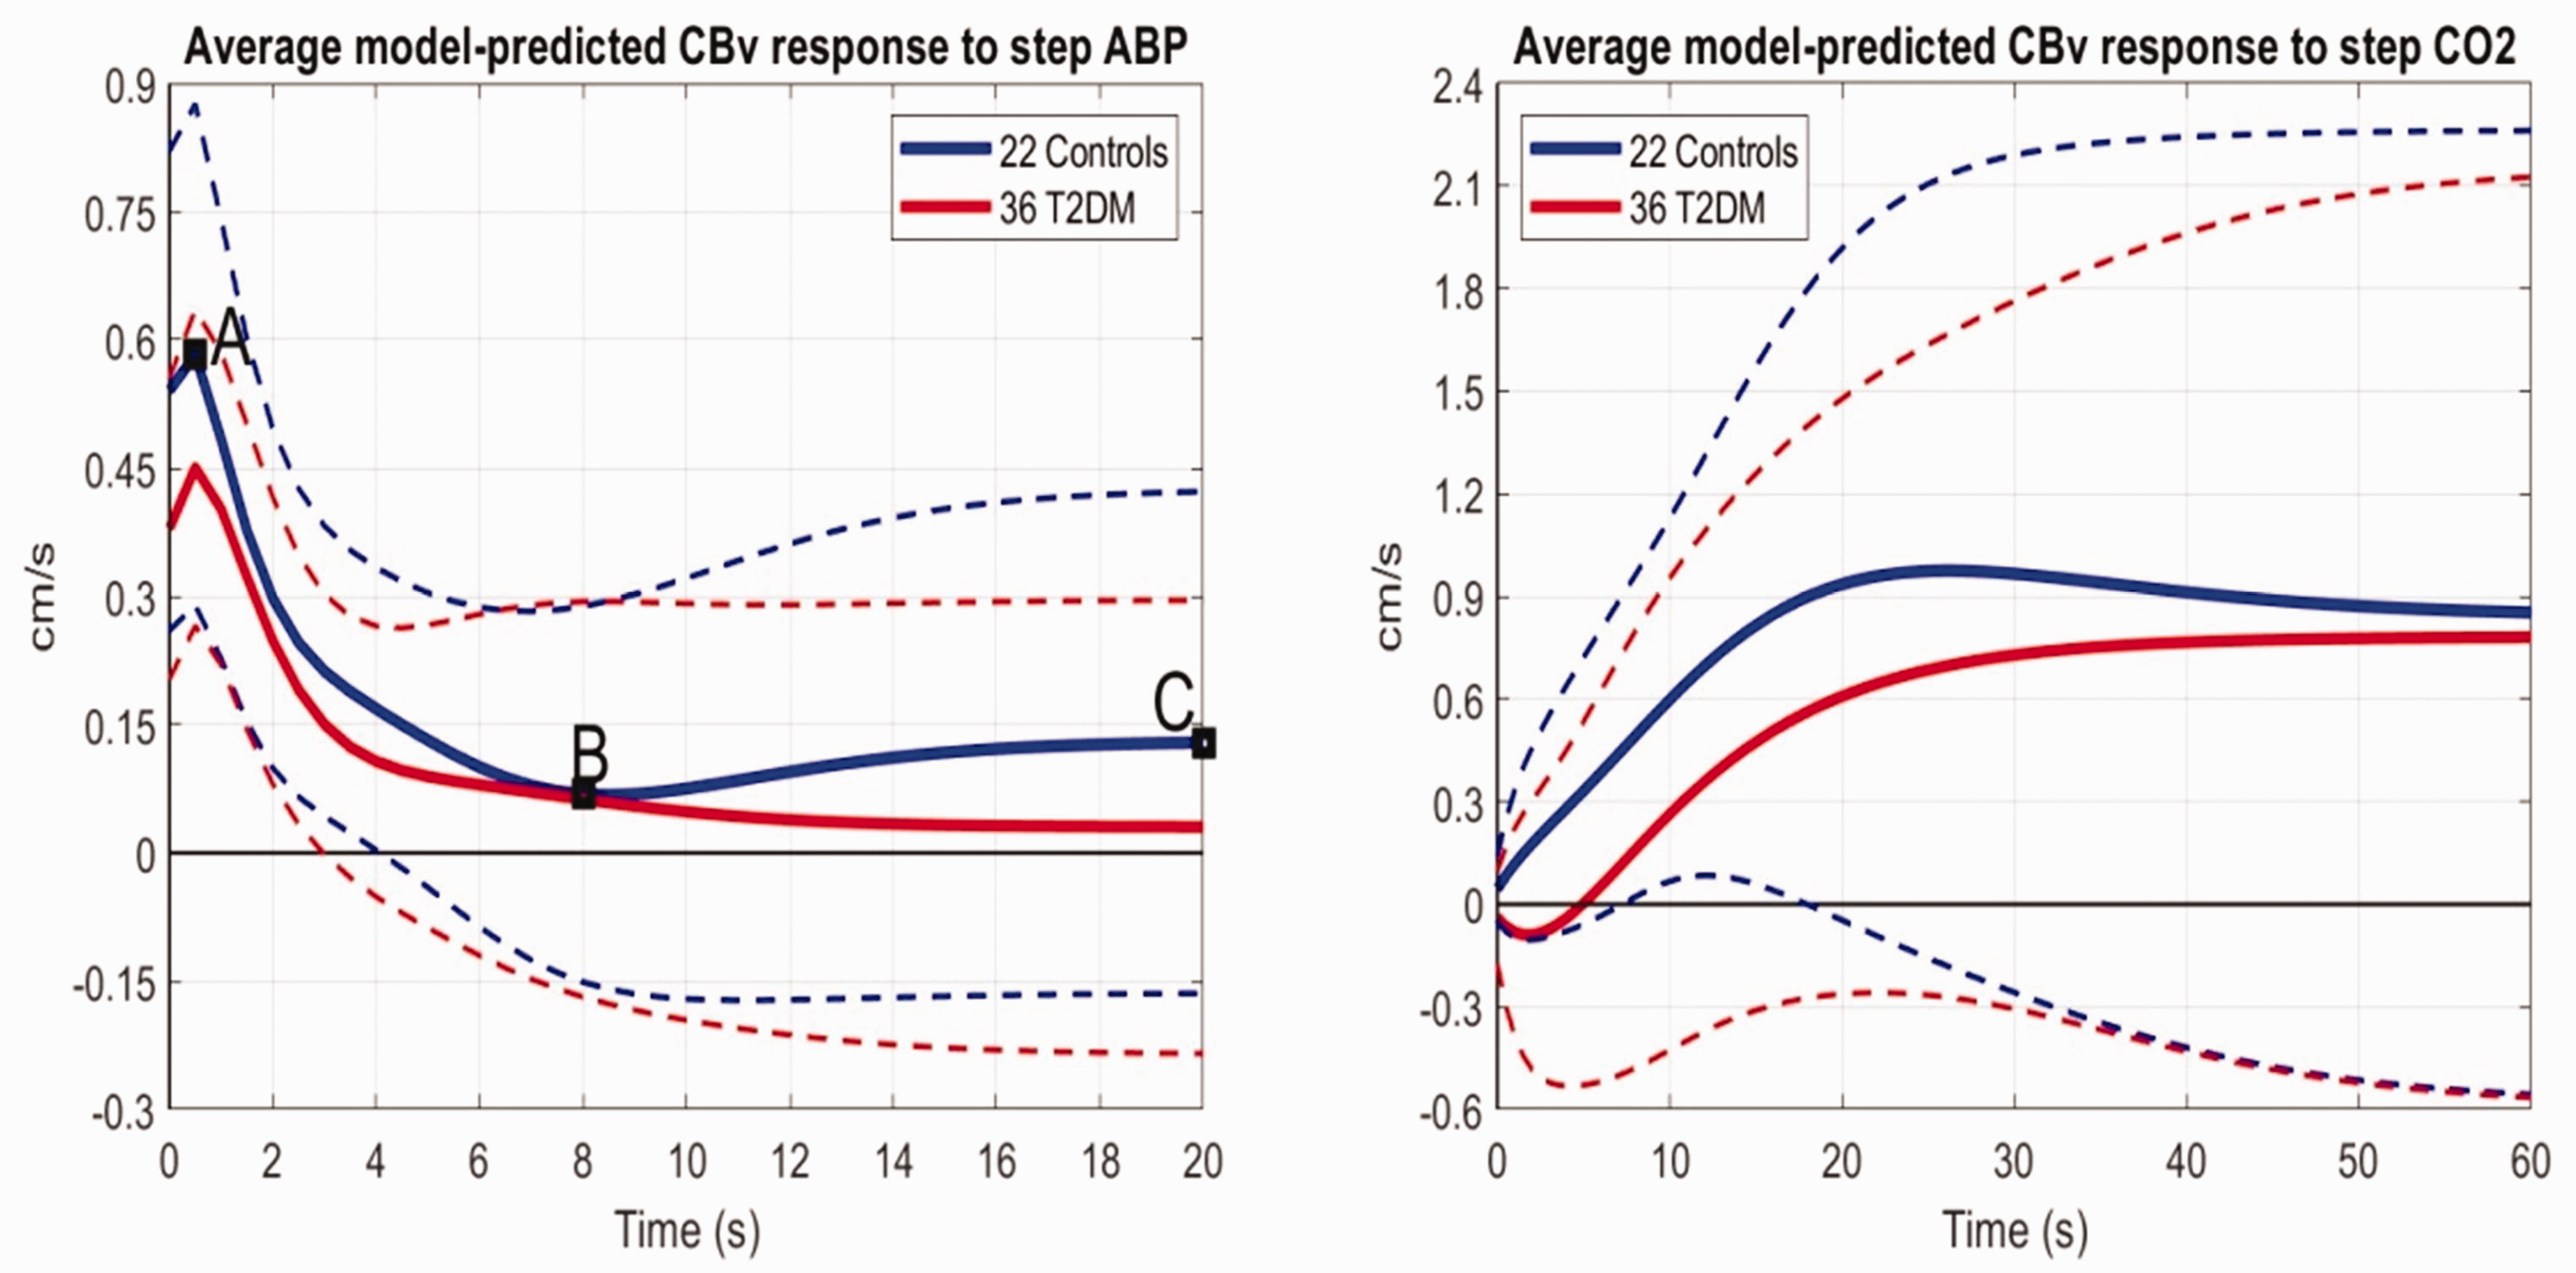
Figure 3 shows the average Gain Functions and Phase Functions of the estimated ABP-to-CBv Transfer Functions (computed via DFT of the respective average kernels) for the 22 controls (blue) and 36 patients. It is evident that the average Gain Function values for the patients are lower for frequencies higher than 0.04 Hz (i.e. higher vascular impedance), while a hump around 0.07 Hz is evident for the controls but not for the T2DM patients (see Discussion).
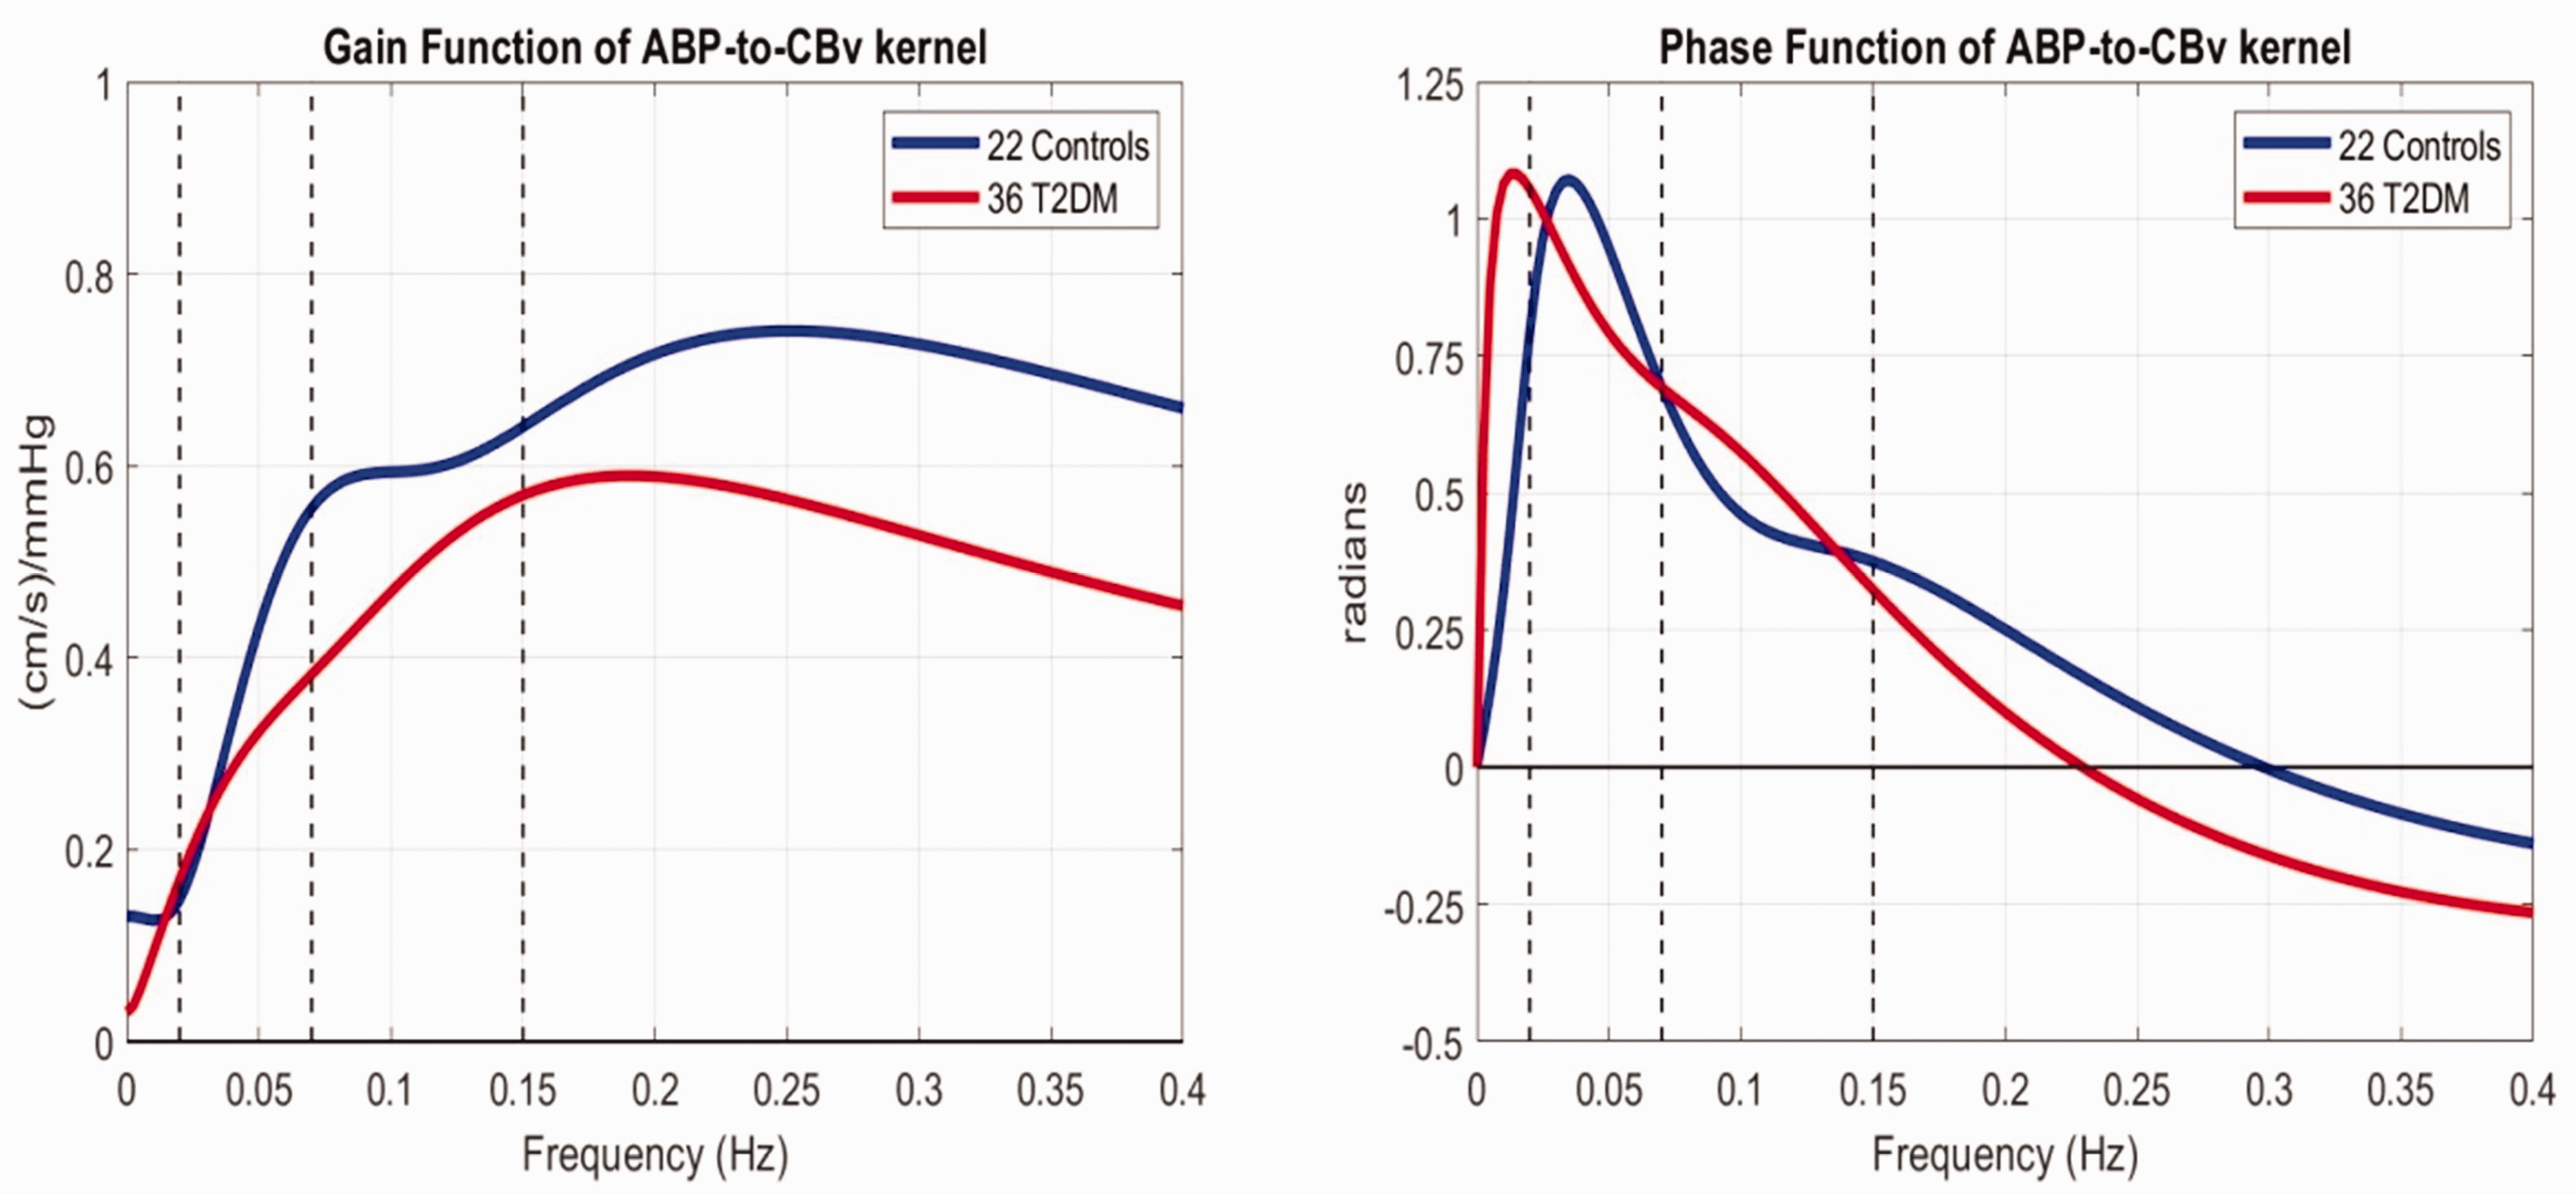
The average Gain Functions (left) and Phase Functions (right) of the ABP-to-CBv transfer relation for 22 controls (blue) and 36 T2DM patients (red line).
PDM estimates and resulting PDM gains for patients and controls
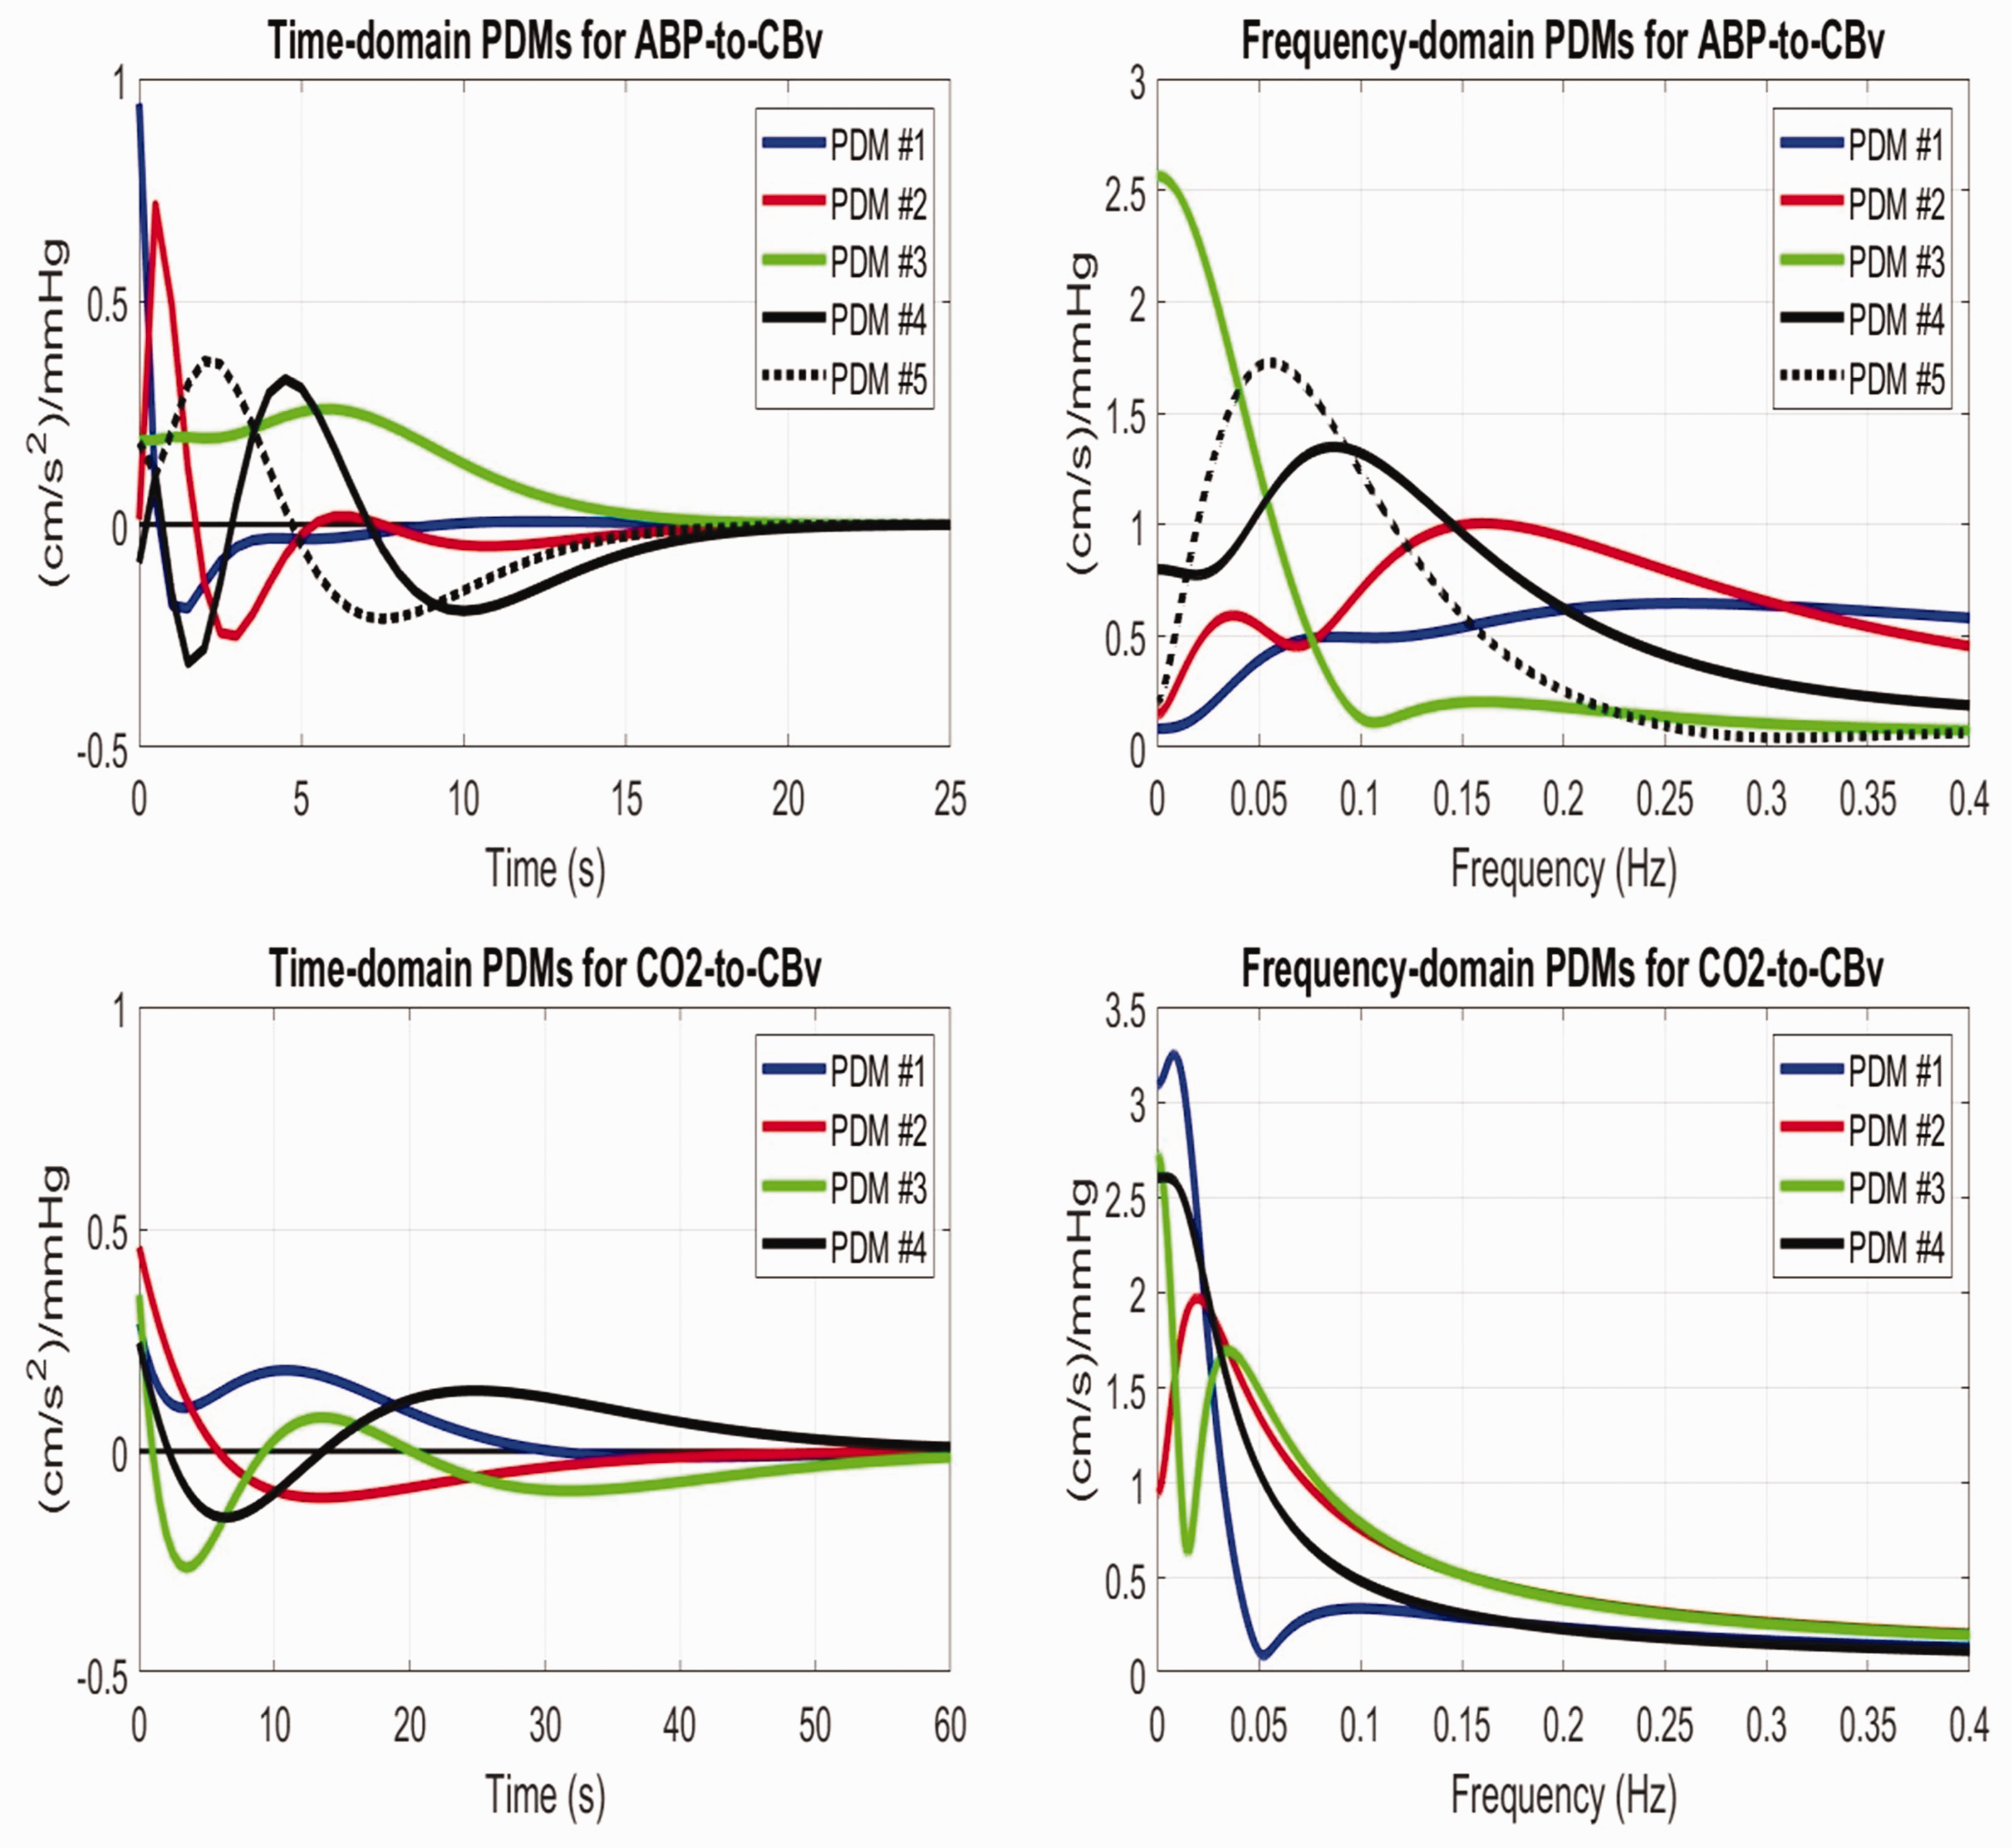
The obtained 5 PDMs from the kernels of the 22 controls (equal in number to the Laguerre Functions used for estimating the respective kernels) are shown in the time and frequency domains in Figure 4 (top panels) for the ABP-to-CBv kernels
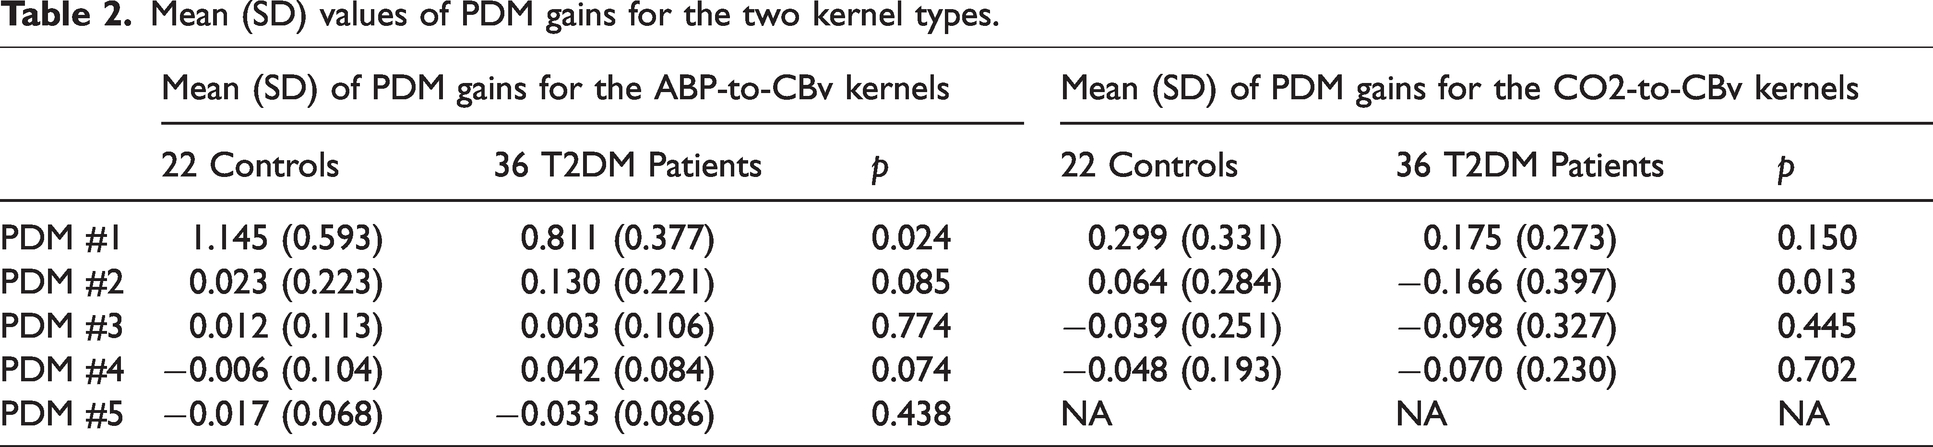
Mean (SD) values of PDM gains for the two kernel types.
Composite diagnostic index
Using the two PDM gains that show significant mean difference between T2DM patients and non-diabetic controls (1st for ABP and 2nd for CO2) as two attributes for their differentiation, we can construct a diagnostic physio-marker in the form a Composite Diagnostic Index (CDI) defined as their linear combination that corresponds to the Fisher Discriminant, which maximizes the ratio of “between-group variance” to “within-group variance” for the two groups under the Gaussian assumption.
41
The scatter-plot of these two PDM gains for the two groups and the Fisher Discriminant (black dashed line) are shown in the left panel of Figure 5. The resulting analytical expression for the CDI is:

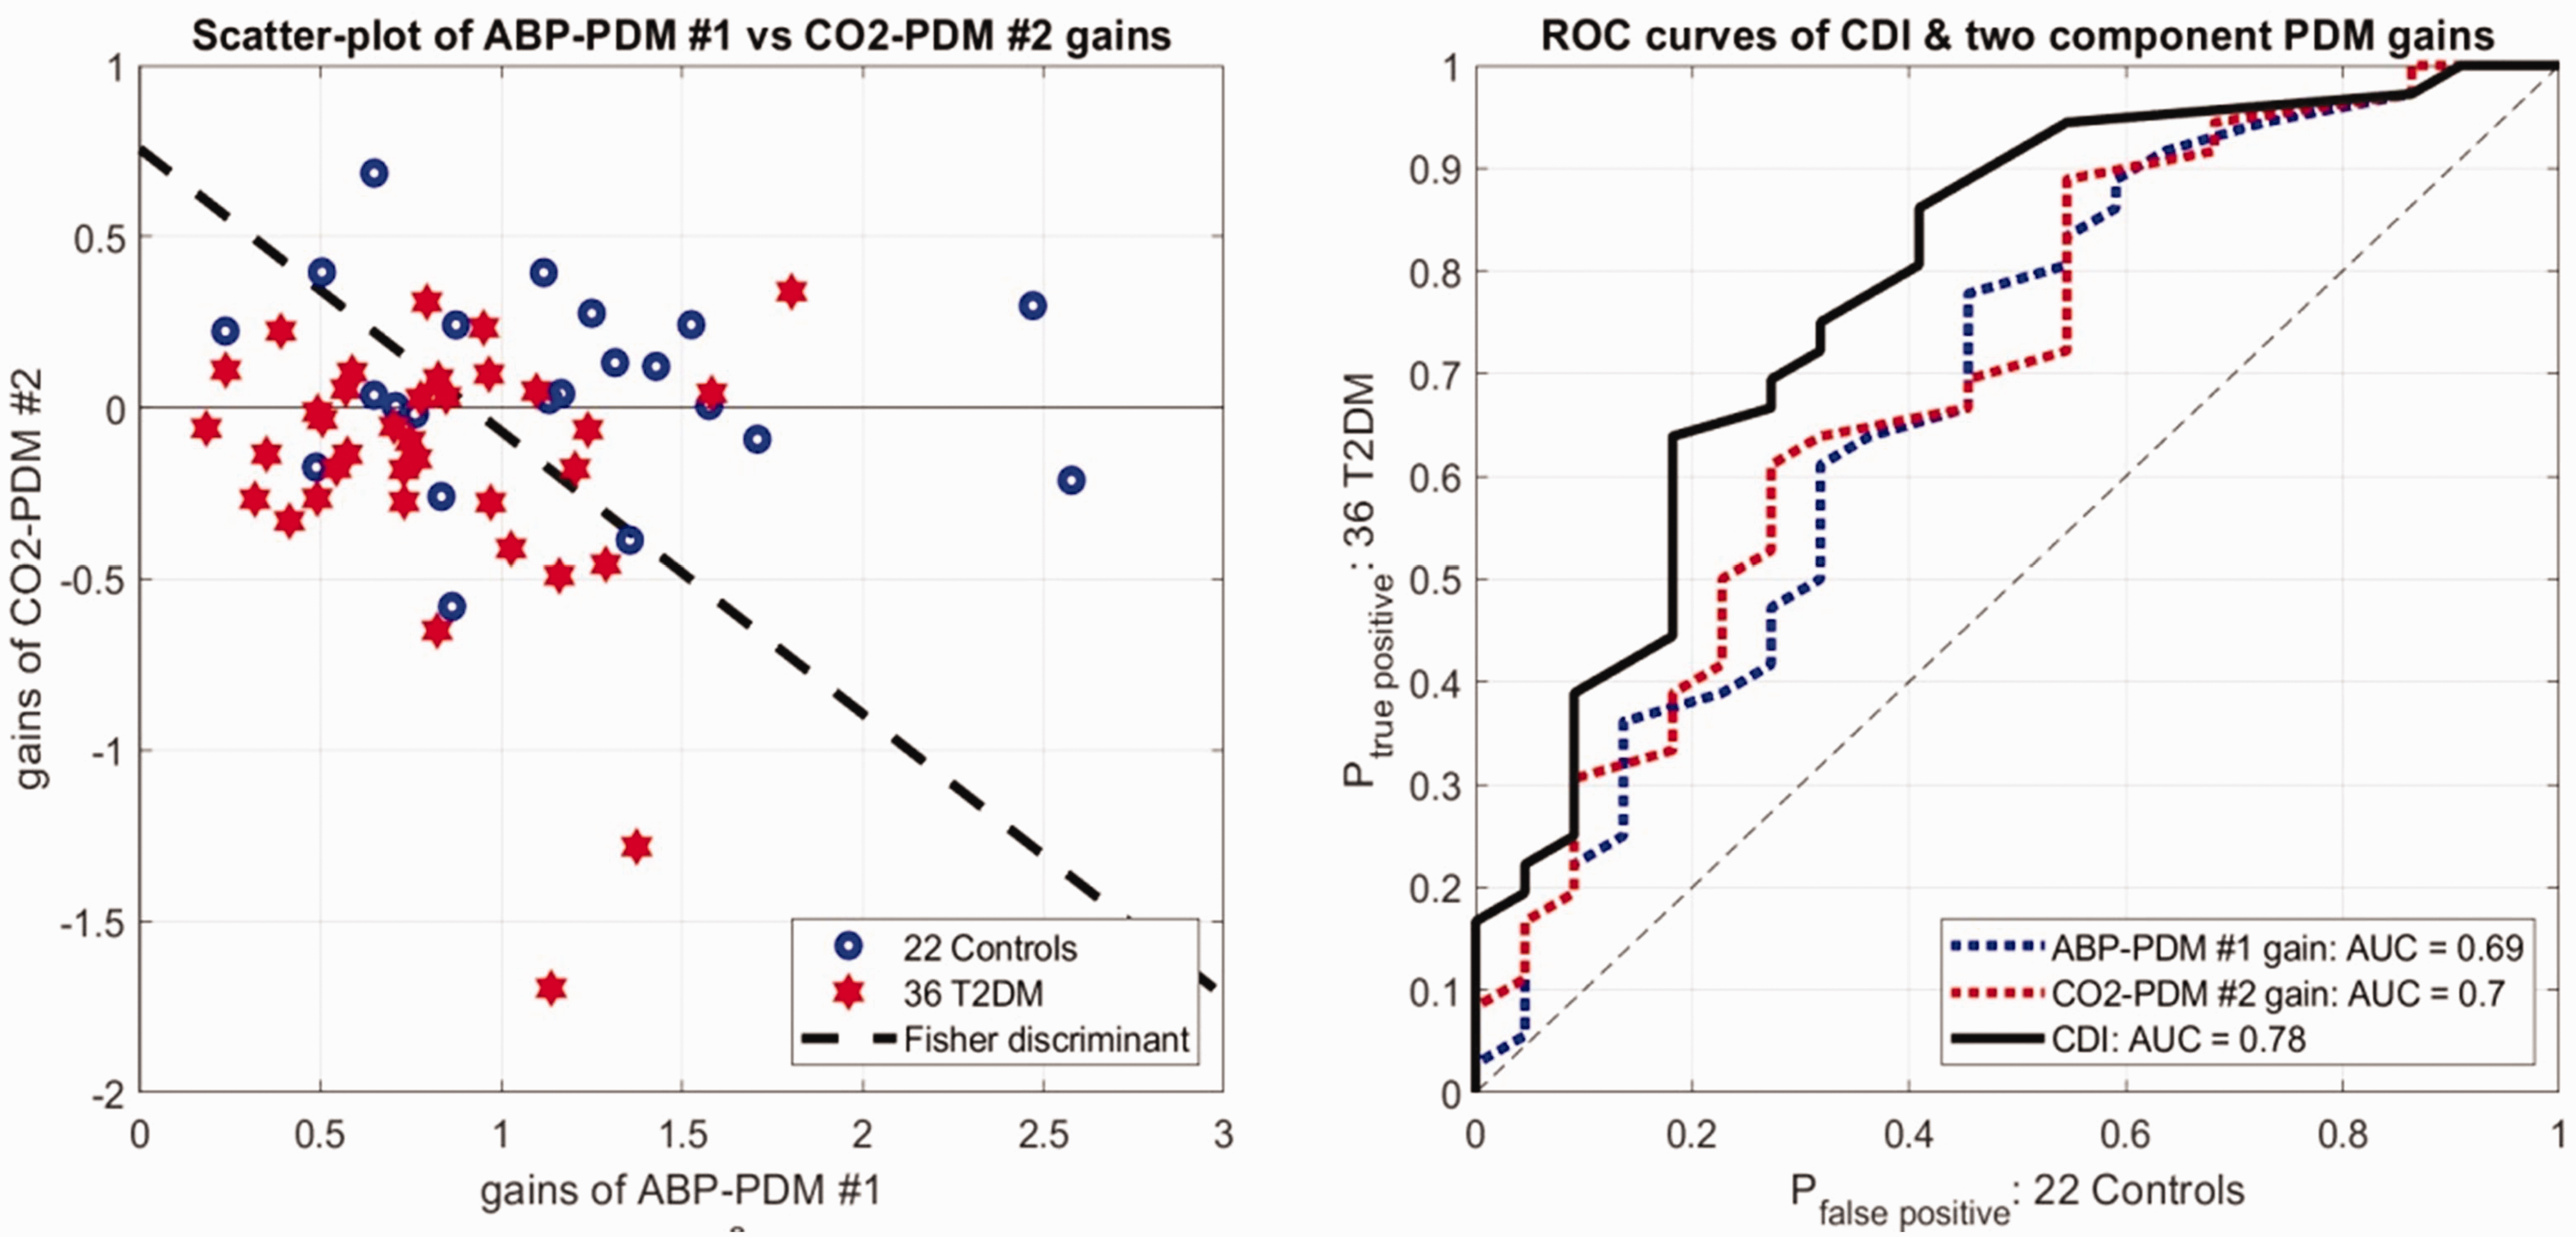
Use of this CDI improves the differentiation between patients and controls (p = 0.0007). To confirm this improvement, we also computed the Receiver Operating Characteristic (ROC) curves using separately as diagnostic markers each of the two PDM gains or the CDI (see right panel of Figure 5). We see an increased Area-Under-the-Curve (AUC) for the CDI (AUC = 0.78). We note that the AUC metric does not depend on the Gaussian assumption.
Discussion
Data-based dynamic modeling of two aspects of cerebral blood flow regulation was used to quantify the possible impairment of DVR and dCA in 36 T2DM (about two-thirds of them with controlled hypertension) relative to 22 age/sex-matched non-diabetic normotensive controls. This quantification was based on PDM analysis, which allows the testing of the hypothesis that T2DM has significant effects on specific components of those two aspects of cerebral blood flow regulation (DVR and dCA).
In previous studies, we utilized a DVR index defined as the time-average of the model-predicted CBv response to a unit-step CO2 input (+1 mmHg) over a specified time-horizon (while the ABP input is kept at baseline zero) in order to examine possible DVR alterations in mild cognitive impairment33 –35 or essential hypertension. 36 Several dCA indices have also been used previously to examine possible dCA impairments, which were defined either in the time-domain or frequency-domain.7 –12,33 –36,42 –44 In this study, we explore the use of dynamic components (PDMs) of the ABP-to-CBv and CO2-to-CBv causal relationships (kernels) to assess quantitatively the effects of T2DM on dCA and DVR, respectively. The results are discussed below in the context of what has been reported previously about the effects of T2DM on dCA and DVR in the literature.
PDM analysis reveals significant effects of T2DM on two dynamic components of dCA and DVR
The expansion of the kernels on the respective PDM orthonormal bases revealed that two PDM expansion coefficients (gains) are significantly different between T2DM patients and non-diabetic normotensive controls: the 1st PDM gain of the ABP-to-CBv kernel expansion (p = 0.024) and the 2nd PDM gain of the CO2-to-CBv kernel expansion (p = 0.013) (see Table 2).
The temporal pattern of the 1st ABP-PDM (see blue line in the top-left panel of Figure 4) shows positive values from 0 to 1 s, becoming negative thereafter until 9 s and resulting in a high-pass characteristic (see red line in the top-right panel of Figure 4). This resembles the temporal pattern of the ABP-to-CBv kernel, as this PDM is dominant (i.e. corresponds to a much larger Singular Value). Table 2 shows that the mean of the 1st ABP-PDM gain decreases from 1.14 in controls to 0.81 in T2DM patients, consistent with the observed reduction of the average Gain Function of patients for frequencies >0.04 Hz (see left panel of Figure 3). Note that this Gain Function is the inverse of the cerebrovascular impedance. This invites the key question: “what is the physiological mechanism that is responsible for this difference in the 1st ABP-PDM gain in T2DM?” In our recent analysis of cholinergic-blockade data, 45 the observed effects on the ABP-PDM gains are consistent with those observed in this study and, therefore, suggest that T2DM may be associated with reduced cholinergic activity – without precluding possible concomitant effects of sympathetic hyperactivity and/or dysfunction of non-cholinergic mechanisms of neurovascular coupling, endothelial and myogenic processes.19 –31
The temporal pattern of the 2nd CO2-PDM (see red line in bottom-left panel of Figure 4), which is also affected significantly by T2DM, shows positive values from 0 to 6 s, becoming negative thereafter and relaxing back to the zero line after 30 s, resulting in a band-pass characteristic with resonant peak around 0.025 Hz (see red line in bottom-right panel of Figure 4). Table 2 shows that the mean of the 2nd CO2-PDM gain reverses polarity from 0.064 in controls to −0.166 in patients, consistent with the change we see in the respective kernels in Figure 1 (right panel) – i.e. a reduction in kernel values over the first 6 s for patients. Regarding a possible physiological mechanism that may correspond to this 2nd CO2-PDM, we note that our recent analysis of cholinergic-blockade data 45 has shown a large reduction in CBv signal power in the frequency range 0.02–0.03 Hz after cholinergic-blockade (see Figures 5 45 and 6 45 ) which suggests that the observed effects of T2DM are consistent with reduction of cholinergic activity (as in the previous effects on the 1st ABP-PDM gain).
Therefore, these results support the hypothesis that
Since sympatho-vagal balance is a key regulator of many physiological functions (including cerebrovascular regulation), we note that a reduction in cholinergic/vagal activity may also be expressed as sympatho-vagal imbalance, with or without sympathetic hyperactivity. This may be important for the interpretation of the results of this study as sympathetic hyperactivity has been reported in previous studies to be associated with T2DM as well as with hypertension and insulin resistance,19 –21 with the highest sympathetic activity found in cases of combined T2DM and hypertension. 19 Sympathetic hyperactivity has also been reported in the metabolic syndrome, where it has been associated with increased arterial blood pressure and decreased baroreflex sensitivity, endothelium-dependent vasodilation, and vascular compliance.20 –22 The reported strong association between T2DM and sympathetic hyperactivity invites the question of whether the latter may be quantified through its possible effects on some specific PDMs. The Mayer wave of spontaneous arterial blood pressure and flow oscillations around 0.1 Hz is considered driven by sympathetic activity and dependent on baroreflex sensitivity. 47 Thus, it would be reasonable to posit that the 4th ABP-PDM, which exhibits a resonance peak around 0.1 Hz (see black line in top-right panel of Figure 4), may be affected primarily by sympathetic hyperactivity. The observed increase of the 4th ABP-PDM gain (see Table 2), although not statistically significant (p = 0.07), may indicate such an increase in sympathetic activity – possibly associated with a reduction of baroreceptor sensitivity in patients with metabolic syndrome and insulin resistance22 –24 that may also have clinical implications for cardiovascular disease in T2DM patients. 48 The interpretation of comments about sympathetic hyperactivity must take into consideration the distinction between cerebral and peripheral sympathetic nerve activity.56,57
The observed sympatho-vagal imbalance in T2DM patients may also be caused in part by other forms of endothelial dysfunction25,26 or impairment of the neurovascular coupling including disruption of the blood brain barrier.30,31 At present, we do not know how the PDMs may be affected by these impairments that have been associated with T2DM. This is an important task left for future studies.
Does T2DM affect the dCA and DVR?
The answer to this question must be given for a specific metric used to quantify dCA or DVR in each study. Many different approaches have been used in this regard,4 –17 generally alluding to such T2DM effects (with respect to the utilized metric) but not always demonstrating statistical significance of these effects.8 –10 In the present study, we use a canonical method of predictive dynamic modeling that is expected to contain all pertinent information under the assumption of linear superposition. 32 The latter assumption is reasonable for the employed spontaneous time-series data that remain within a narrow physiological range. The obtained average kernel estimates for the ABP-to-CBv and CO2-to-CBv dynamic relationships (see Figure 1) indicate that the main difference in both kernels between T2DM patients and non-diabetic normotensive controls is expressed in the early lags (0–5 s) – i.e. T2DM appears to affect mainly the fast dynamics of dCA and DVR.
In frequency-domain analysis, the average Gain Functions of the ABP-to-CBv relationship (see left panel of Figure 3) represent the average cerebrovascular admittance (inverse of the cerebrovascular impedance) and indicate that impedance is higher for the patients over all frequencies higher than 0.04 Hz. The cerebrovascular resistance is the inverse of the value of the Gain Function at zero-frequency, and it is higher for T2DM patients on the average – but not in a statistically significant manner. As the frequency increases above 0.04 Hz, the impedance of the patients remains higher than the controls (admittance remains lower) and tends to a value determined primarily by the compliant elements of the cerebral vasculature that is lower for the T2DM patients on the average (see left panel of Figure 3). The fact that the disparity in average admittance is greater above 0.04 Hz is consistent with the previous observation that T2DM affects primarily the fast dynamics. This, along with the fact that the “hump” around 0.07 Hz in the Gain Function of the controls is absent in the T2DM patients, is consistent with the finding that the gain of the 1st ABP-PDM is reduced in T2DM patients (see Table 2) – given that this PDM has high-pass characteristics and a hump around 0.07 Hz (see blue trace in the top-right panel of Figure 4). We also note that the zero-lag value of the ABP-to-CBv kernel represents the integrated admittance over all frequencies and was found to have Mean (SD) of 1.081 (0.561) for the controls vs. 0.758 (0.352) for the T2DM patients, yielding a p-value of 0.021 for a two-sided mean-difference t-test. Therefore, the integrated average admittance is lower for the T2DM patients, indicating that cerebral blood flow would be lower for the patients (on the average) for a given spectrum of the ABP signal. It must be noted that a previous study of essential hypertension 36 found increased average impedance above 0.1 Hz in hypertensive patients relative to healthy controls. Therefore, at least part of the observed average increased impedance in T2DM patients of this study may be due to co-existing hypertension (28 of 36).
Previous studies on the effects of T2DM upon dCA utilized various metrics:
the observed phase-shift between deep-breathing induced oscillations of ABP and CBv at 0.1 Hz, concluding that T2DM alters dCA;
7
cross-correlation functions between spontaneous time-series data of ABP and CBv, concluding that dCA may be less effective in T2DM in the range 0.04–0.15 Hz;
8
nonlinear phase interactions between spontaneous fluctuations of ABP and CBv under resting conditions, concluding that T2DM alters dCA over a wide frequency range;
9
autoregressive moving-average models from spontaneous ABP and CBv time-series data, concluding that no significant T2DM effects on dCA were seen;
10
Phase Function analysis of spontaneous time-series data of ABP and CBv, concluding that dCA is impaired over the range of 0.07–0.15 Hz only when T2DM is associated with microvascular complications – and no effects of postural changes;
11
direct observation of CBv data during various tests (Valsalva maneuver, deep breathing, rhythmic handgrip, orthostatic head-up tilt), concluding that vasomotor responses during head-up tilt testing are decreased in T2DM patients;
14
chaotic analysis of spontaneous ABP and CBv time-series data, reporting significant effects on Valsalva ratio and tilting responses in T2DM, indicating changes in vasomotor tone of peripheral vessels and baroreflex, as well as “more chaotic” dCA;
15
direct observation of CBv data during orthostatic tests (supine/standing), concluding that T2DM patients with orthostatic hypotension exhibit impaired dCA;
16
Transfer Function analysis of ABP-CBv data during oscillatory neck suction at 0.1 Hz, concluding that decreased phase-shift at 0.1 Hz in T2DM indicates impaired dCA.
17
The results of the present study show a reduction of average phase over the frequency range 0.02–0.07 Hz, without rising to statistical significance, but do not confirm the previously reported reduction of ABP-CBv phase-shift over the frequency range 0.07–0.15 Hz in T2DM (see right panel of Figure 3). However, a significant effect of T2DM was revealed in the average time-course of the model-predicted CBv response to a step change of ABP (after the fiducial point
To quantify this effect, we can define an index:
Regarding DVR, the average kernel estimates for the CO2-to-CBv dynamic relationship (see right panel of Figure 1) also have their main differences at early lags (<5 s), where the patients’ average kernel has much smaller values. This is consistent with the finding that the gain of the 2nd CO2-PDM reverses polarity in T2DM (see Table 2), given that this PDM has large positive values over the first 5 s (see red trace in bottom-left panel of Figure 4). This also suggests that the main effects of T2DM are manifested in the fast dynamics of the DVR regulatory mechanisms, such as endothelial mechanisms or the peripheral chemoreflex that is mediated through neural mechanisms – in contrast to the central chemoreflex that is expected to exhibit slower dynamics due to its mixed humoral/neural mechanisms.49,50 The only published data on the dynamics of CO2 vasoreactivity can be found in some CO2 inhalation or rebreathing studies, such as Figure 1 49 that indicates a fast early transient of CBv in response to rebreathing, which would correspond to the early portion of our average CO2 kernel. Finally, we note that the peripheral and central chemoreflexes have been shown to have strong effects on sympathetic activity in both health and disease50,51 and may be responsible for the sympathetic hyperactivity that has been reported in T2DM.19 –21
Neurovascular coupling
Another known mechanism that may affect dCA and DVR is the neurovascular coupling (NVC)30,31 that adjusts localized cerebral blood flow to match the metabolic needs of neural function in different brain regions by engaging the perivascular smooth muscle (or pericytes for capillaries) and coupling the endothelium with astrocytic and neuronal activity.52,53 The dynamics of neurovascular coupling can be observed through the blood-oxygen-level-dependent (BOLD) signal acquired by functional MRI that is deemed to depend on regionally-averaged neuronal activity and local hemodynamics.52 –55 The relation between the observed BOLD signal and regionally-averaged neuronal activity is typically represented by a convolution operation with the “Hemodynamic Response Function” (HRF).54,55 Reported HRFs have biphasic profile (see, for example, Figures 4 and 5 54 and Figures 1 and 2 55 ) and should give rise to a resonant response characteristic with peak in the 0.04–0.08 Hz range – thus possibly related to the 3rd and/or 4th CO2-PDM (see bottom-right panel of Figure 4). Specialized future experiments, whereby data are collected under conditions of intensive cognitive activity (strongly stimulating the NVC), may enable PDM analysis to reveal the differential effects of NVC in T2DM patients vs non-diabetic normotensive controls. This will elucidate the association between T2DM and NVC dysfunction. 30
Endothelial dysfunction
Plasma levels of vascular and intercellular adhesion molecules that are markers of endothelial and vascular integrity, were associated previously with altered cerebral vasoreactivity (increased vasoconstriction and decreased vasodilation) in several brain regions, and correlated with worse functionality and brain atrophy. 4 Since microglial activation of phagocytic cells in the brain is associated with increased amounts of plasma adhesion molecules and insulin resistance, these findings suggest a connection between T2DM, altered vasoreactivity and inflammation. 4 The postulated cholinergic hypoactivity in T2DM would impact the proper cholinergic regulation of vascular endothelial function 25 and influence such regulation by human T-lymphocytes expressing choline acetyltransferase (ChAT T-cells). 26 This would cause endothelial dysfunction and impair DVR and dCA in a manner consistent with the polarity reversal of the 2nd CO2 PDM gain and the reduction of the 1st ABP PDM gain.
Study limitations
The presented results are potentially useful but remain tentative until hemodynamic data from a larger cohort can be collected and analyzed in the future. Another limitation of this study is the lack of genotyping in terms of the APOE e4 allele that is likely to affect the regulation mechanisms of cerebral perfusion related to dCA and/or DVR and ought to be explored in future studies. Likewise, the effects of co-existing hyperlipidemia upon dCA and DVR ought to be separated from those of T2DM in future studies. Finally, an important limitation of this study is that 78% of the examined T2DM patients (28 of 36) also had controlled essential hypertension and were receiving anti-hypertensive medications. Therefore, it would be of great scientific and clinical value to separate the effects of essential hypertension upon dCA and DVR from those of T2DM in future studies, as well as examine the case where they co-exist. In this regard, we note that PDM analysis of a small cohort with essential hypertension was performed in a previous study, 36 yielding significant differences in two ABP-PDM gains and one CO2-PDM gain. However, the set of the PDM basis in that study was different from the PDM basis of this study (due to the different sets of controls) and, thus, direct comparison is not possible. Future studies may use a common PDM basis (set of controls), thus allowing direct comparison.
Conclusion
Using data-based modeling of the regulation of cerebral hemodynamics, we obtained quantitative results that indicate significant alterations of certain dynamic components (PDMs) of cerebral CO2 dynamic vasomotor reactivity and dynamic cerebral autoregulation in T2DM patients, which are suggestive of cholinergic hypoactivity and sympatho-vagal imbalance in the T2DM patients.
Supplemental Material
sj-pdf-1-jcb-10.1177_0271678X241254716 - Supplemental material for Data-based modeling of cerebral hemodynamics quantifies impairment of cerebral blood flow regulation in type-2 diabetes
Supplemental material, sj-pdf-1-jcb-10.1177_0271678X241254716 for Data-based modeling of cerebral hemodynamics quantifies impairment of cerebral blood flow regulation in type-2 diabetes by Vasilis Z Marmarelis, Dae C Shin, Yue Kang and Vera Novak in Journal of Cerebral Blood Flow & Metabolism
Footnotes
Funding
The author(s) disclosed receipt of the following financial support for the research, authorship, and/or publication of this article: The work was supported by the NIH/NIA grant No. R01-AG058162 to Dr. Vasilis Marmarelis, and by the NIH/NIA grant No. 1R01-AG0287601A2 and American Diabetes Association grants No. 1-03-CR-23 and 1-06-CR-25 to Dr. Vera Novak. The data collection for this project was supported by Harvard Clinical and Translational Science Center (Grant No. UL1 RR025758) and National Center for Research Resources (M01-RR-01032).
Acknowledgements
Declaration of conflicting interests
The author(s) declared no potential conflicts of interest with respect to the research, authorship, and/or publication of this article.
Authors’ contributions
Marmarelis: Design and coordination of the study, analysis of the data and interpretation of results, primary author of the manuscript. Shin: Worked closely with Marmarelis on analysis of the data and interpretation of results, and contributed to the preparation of the manuscript. Kang: Worked with Marmarelis on initial analysis of the data and the interpretation of results, and contributed to manuscript preparation. Novak: Collected the time-series data and contributed to the interpretation of the results in the context of the literature, as well as contributed to the preparation of the manuscript.
Supplementary material
Supplemental material for this article is available online.
References
Supplementary Material
Please find the following supplemental material available below.
For Open Access articles published under a Creative Commons License, all supplemental material carries the same license as the article it is associated with.
For non-Open Access articles published, all supplemental material carries a non-exclusive license, and permission requests for re-use of supplemental material or any part of supplemental material shall be sent directly to the copyright owner as specified in the copyright notice associated with the article.