
Abstract
Dynamic cerebral autoregulation (dCA) can be derived from spontaneous oscillations in arterial blood pressure (ABP) and cerebral blood flow (CBF). Transcranial Doppler (TCD) measures CBF-velocity and is commonly used to assess dCA. Diffuse correlation spectroscopy (DCS) is a promising optical technique for non-invasive CBF monitoring, so here we aimed to validate DCS as a tool for quantifying dCA. In 33 healthy adults and 17 acute ischemic stroke patients, resting-state hemodynamic were monitored simultaneously with high-speed (20 Hz) DCS and TCD. dCA parameters were calcaulated by a transfer function analysis using a Fourier decomposition of ABP and CBF (or CBF-velocity). Strong correlation was found between DCS and TCD measured gain (magnitude of regulation) in healthy volunteers (r = 0.73, p < 0.001) and stroke patients (r = 0.76, p = 0.003). DCS-gain retained strong test-retest reliability in both groups (ICC 0.87 and 0.82, respectively). DCS and TCD-derived phase (latency of regulation) did not significantly correlate in healthy volunteers (r = 0.12, p = 0.50) but moderately correlated in stroke patients (r = 0.65, p = 0.006). DCS-derived phase was reproducible in both groups (ICC 0.88 and 0.90, respectively). High-frequency DCS is a promising non-invasive bedside technique that can be leveraged to quantify dCA from resting-state data, but the discrepancy between TCD and DCS-derived phase requires further investigation.
Keywords
Introduction
Cerebral autoregulation (CA) describes the ability to maintain stable cerebral blood flow (CBF) despite fluctuations in arterial blood pressure (ABP), thus protecting the brain from hypo- and hyper-perfusion.1,2 CA can be described as static or dynamic. Static autoregulation is based on steady-state measurements of CBF and ABP, and thus contains information about the magnitude of CBF regulation but does not account for the speed at which autoregulatory adaptation takes place. Dynamic cerebral autoregulation (dCA) assess blood flow changes relative to sudden changes in ABP and is sensitive to both the magnitude of CBF regulation and the latency (phase) of the vasoregulatory system.1–3 In practice, dCA is readily assessed by inducing a sudden change in ABP, for example via thigh cuff deflation,4,5 Valsalva, 6 or postural maneuvers.7,8 Alternatively, spontaneous oscillations in ABP and CBF in the resting-state can be leveraged, 8 for example by a transfer function analysis (TFA). TFA uses a Fourier decomposition of the two waveforms to quantify the effect of ABP on CBF 9–11 and eliminates the need for an experimental maneuver or intervention to alter ABP. It may therefore be easier to implement and better tolerated in populations at risk for adverse reactions to ABP shifts, including those with cerebrovascular disease.12,13
Transcranial Doppler ultrasonography (TCD) is commonly used to assess cerebral hemodynamics by quantifying dCA.14–17 However, TCD has limitations. TCD requires an operator with technical expertise and measures blood velocity 18 rather than tissue-based flow. Additionally, adequate temporal bone acoustic windows for TCD are absent in nearly 20% of individuals.19,20 Alternative non-invasive tools to measure cerebral hemodynamics are therefore appealing. Cerebral oximetry based near-infrared spectroscopy (NIRS) has been used as a surrogate of CBF in autoregulation research,21–23 but accepting oximetry as a surrogate of CBF relies on assumptions, including constant arterial oxygen saturation and cerebral oxygen metabolism, 24 which may not be true in cerebrovascular disease states. Moreover, the NIRS signal is contaminated by scalp blood flow and may therefore reflect a combination of systemic and cerebral hemodynamics. 25
In this study, we explore the potential of another novel optical technique to measure dCA: diffuse correlation spectroscopy (DCS). DCS uses temporal fluctuations of light scattered by moving red blood cells to measure a signal decay rate that is closely related (e.g., proportional) to cerebral blood flow (CBF).26,27 DCS probes microcirculatory CBF directly and non-invasively, and it has been validated against Xenon CT, 28 arterial spin labeled MRI,29,30 velocity mapping MRI, 31 and 15O PET. 32 Moreover, the technique has been refined with custom probes and multi-layer models to ameliorate scalp contributions.4,33 Operating a DCS-based instrument may require some degree of expertise, but instruments are more commonly incorporating streamlined user interfaces to simplify data collection and thereby avoid the extensive training as would be required with other techniques, such as TCD.
To date, DCS has been used to assess cerebral autoregulation during thigh cuff deflation 4 and by performing a rolling correlation of ABP and CBF during prolonged monitoring. 34 However, DCS data trains have yet to be used in a TFA based approach for computing dCA, which is particularly well-suited for resting-state analyses. Thus, here we aim to validate DCS, by comparison with TCD, in generating TFA-based dCA measures from resting-state data in two groups: (1) healthy volunteers and (2) acute ischemic stroke patients.
Materials and methods
Participants
Healthy volunteers and acute ischemic stroke patients were eligible for inclusion in this analysis if they underwent resting-state hemodynamic monitoring in one of four experimental protocols, each of which required monitoring cerebral hemodynamics during a bedside intervention. Data collected during the experimental interventions were not utilized here. Rather, data from the resting-state baseline measurements were utilized in the analysis. Healthy volunteers were at least 18 years of age without a history of stroke, heart failure, or cerebral mass lesion that would interfere with cerebral hemodynamic monitoring. Acute ischemic stroke patients were at least 18 years of age, with a stroke in the territory of the middle cerebral artery (unilateral). Stroke patients were excluded if they had a history of prior stroke, heart failure, or cerebral mass lesion. Monitoring was completed within 72 hours of stroke onset. Each study protocol was approved by the University of Pennsylvania Institutional Review Board, and all study procedures were in accordance with the ethical standard of the Helsinki Declaration. All subjects provided written informed consent prior to study participation. The study conforms to STROBE guidelines for observational studies.
Hemodynamic monitoring
Diffuse correlation spectroscopy (DCS)
DCS provides a transcranial measurement of relative microvascular CBF. The custom instrument used here has a long-coherence-length source laser operating at 785 nm and eight single-photon counting avalanche photodiode detectors in each of two detection fiber bundles. Optical fibers coupled the sources and detectors to the head via a 2 cm × 5 cm rubber probe, which was placed on the temporal margin of the forehead. Detectors in the probe were positioned 2.5 cm from the light source and are sensitive to flow in the cerebral cortex. The temporal fluctuations of the collected light are quantified by the light intensity temporal autocorrelation function. This autocorrelation function can be fit to a semi-infinite model of the head to detect variation of blood flow. When applied to the head, the probes were secured by double-sided medical tape and a soft headband. Data were collected at 20 Hz.
Transcranial Doppler ultrasonography (TCD)
Cerebral blood velocity (CBv) was assessed using a DWL TCD system (Compumetics Ltd., Singen, Germany). TCD probes were secured using a DiaMon® adjustable headframe, and the middle cerebral artery (MCA) was insonated via the trans-temporal window at the depth of 40-65 mm. MCA waveform and beat-to-beat mean flow velocity were sampled at a rate of 20 Hz and synchronized with DCS data.
Continuous blood pressure monitoring
A finger plethysmograph system (Finometer® Pro, Finapres Medical Systems) was secured to each subject’s wrist and third digit to provide continuous non-invasive measurement of arterial blood pressure. An inflatable brachial cuff was placed on the same arm and used to calibrate the Finometer® Pro prior to data collection. BP waveforms and beat-to-beat mean values were sampled at 20 Hz and synchronized with TCD and DCS data. Respiratory rate and end-tidal CO2 were monitoring throughout the session.
Measurement protocol
Healthy volunteers were enrolled in one of two studies testing bedside interventions: low-dose inhaled nitric oxide or thigh-cuff deflation. At the beginning of each experiment, the subject was in the supine position in a hospital bed, with the head-of-bed at 30°. 5-minutes of resting-state data were collected. After the conclusion of each experiment, following a 5 minute “wash-out” period, another 5-minutes of resting-state data were collected. The acute stroke patients were similarly enrolled in one of two studies testing bedside interventions (either low-dose inhaled nitric oxide or a breathing exercise). Again, patients were positioned in their hospital bed in the supine position, with the head-of-bed at 30°. 5-minutes of resting-state data were collected at the beginning and end of each protocol, and after a 5-minute “wash-out” period, another 5-minutes of resting-state data were collected. For the present analysis, only the resting-state epochs were extracted for investigation. All data taken during or immediately adjacent to any intervention were discarded.
Healthy volunteers were instructed to avoid caffeine, alcohol, and exercise on the day of the monitoring session (prior to the monitoring). Healthy volunteer measurements were all performed in a single temperature controlled (23 °C) room in the Hospital of the University of Pennsylvania. Acute stroke patients were not given specific instructions regarding exercise, alcohol, or caffeine. However, patients do not receive alcohol or caffeinated beverages from dietary services, and exercise is naturally restricted. If patients received a physical or occupational therapy evaluation on the day of the evaluation, the monitoring session was performed at least 2 hours after the therapy evaluation, which was limited to a brief ambulatory and functional assessment. Stroke patient measurements were performed in the patient room in the Hospital of the University of Pennsylvania. Patient rooms are temperature controlled (23 °C).
Dynamic cerebral autoregulation (dCA)
To calculate dCA, a transfer function analysis (TFA) quantifies the relationship between the ABP waveform and the CBF (or CBv) waveform. To compare CBF and CBv based dCA, the TFA analysis was performed once using CBF and once using CBv. TFA was performed using a Matlab script and algorithm provided by the International Cerebral Autoregulation Research Network (CARNet: www.car-net.org). From the data trains, we thus computed gain, normalized gain, phase, and coherence in the low frequency band (0.07–0.2 Hz).9,11 Prior to performing the TFA, the ABP, CBv, and CBF waveforms are visually inspected for artifacts. Brief artifacts of <3 seconds (e.g. signal loss or movement) were manually removed and replaced by linear interpolation. If segments of artifact or signal loss were longer in duration, the epoch was removed from the analysis.
Briefly, gain quantifies the damping effect of autoregulation (lower gain indicates more effective CA). Normalized gain, as reported here, describes relative changes; this approach accounts better for inter-subject differences in CBF and BP. Phase, calculated in degrees, quantifies the time delay of cerebrovascular adaptation (larger phase-shift indicates more effective CA). The coherence function quantifies the fraction of output variance (CBv or CBF) that can be explained by the input variance (ABP) using a linear model. Based on 5 minutes of data collection for each epoch, we applied a coherence threshold of 0.29 to our data, which represents the 95% confidence limit based on Monte Carlo simulation.9,11 If the coherence value was below the standard threshold, then the corresponding phase and gain values were discarded, as per the CARNet algorithm.
Statistical analyses
Summary statistics are presented using means and standard deviations for continuous variables, medians and interquartile ranges for ordinal or non-parametric variables, and proportions for categorical variables. For all statistical tests, a p-value of <0.05 was deemed to represent statistical significance. dCA metrics were tested for normality using Shapiro-Wilk normality test and visually inspected to confirm a normal distribution. Correlation between DCS and TCD derived metrics was evaluated by Pearson’s or Spearman correlation, accordingly. Correlation was evaluated in healthy volunteers and stroke patients separately. The goal is not to compare dCA between healthy volunteers and stroke patients, but rather validate the use of DCS in two distinct cohorts. Test-retest reliability of DCS-based metrics was evaluated by interclass correlation, using a two-way mixed-effects model. Bland-Altman plots were used to graphically depict the degree of agreement (for the DCS vs TCD analyses, and for the test-retest analyses). All statistical analyses were performed in STATA/SE version 15.1 (StataCorp LLC, College Station, TX). The data that support the reported findings are available from the corresponding author upon reasonable request.
Results
Healthy adults
40 healthy adults completed monitoring protocols that included TCD, DCS, and BP monitoring during the resting-state. Figure 1(a) describes subject exclusion from the final analysis on the basis of data quality or TFA processing. TCD and DCS derived autoregulation parameters were derived from the remaining patients; they compared between 33 healthy adult subjects. Test-retest evaluation of DCS-derived dCA was performed in 29 of these 33 subjects. Demographics and dCA summary statistics are reported in in Table 1.
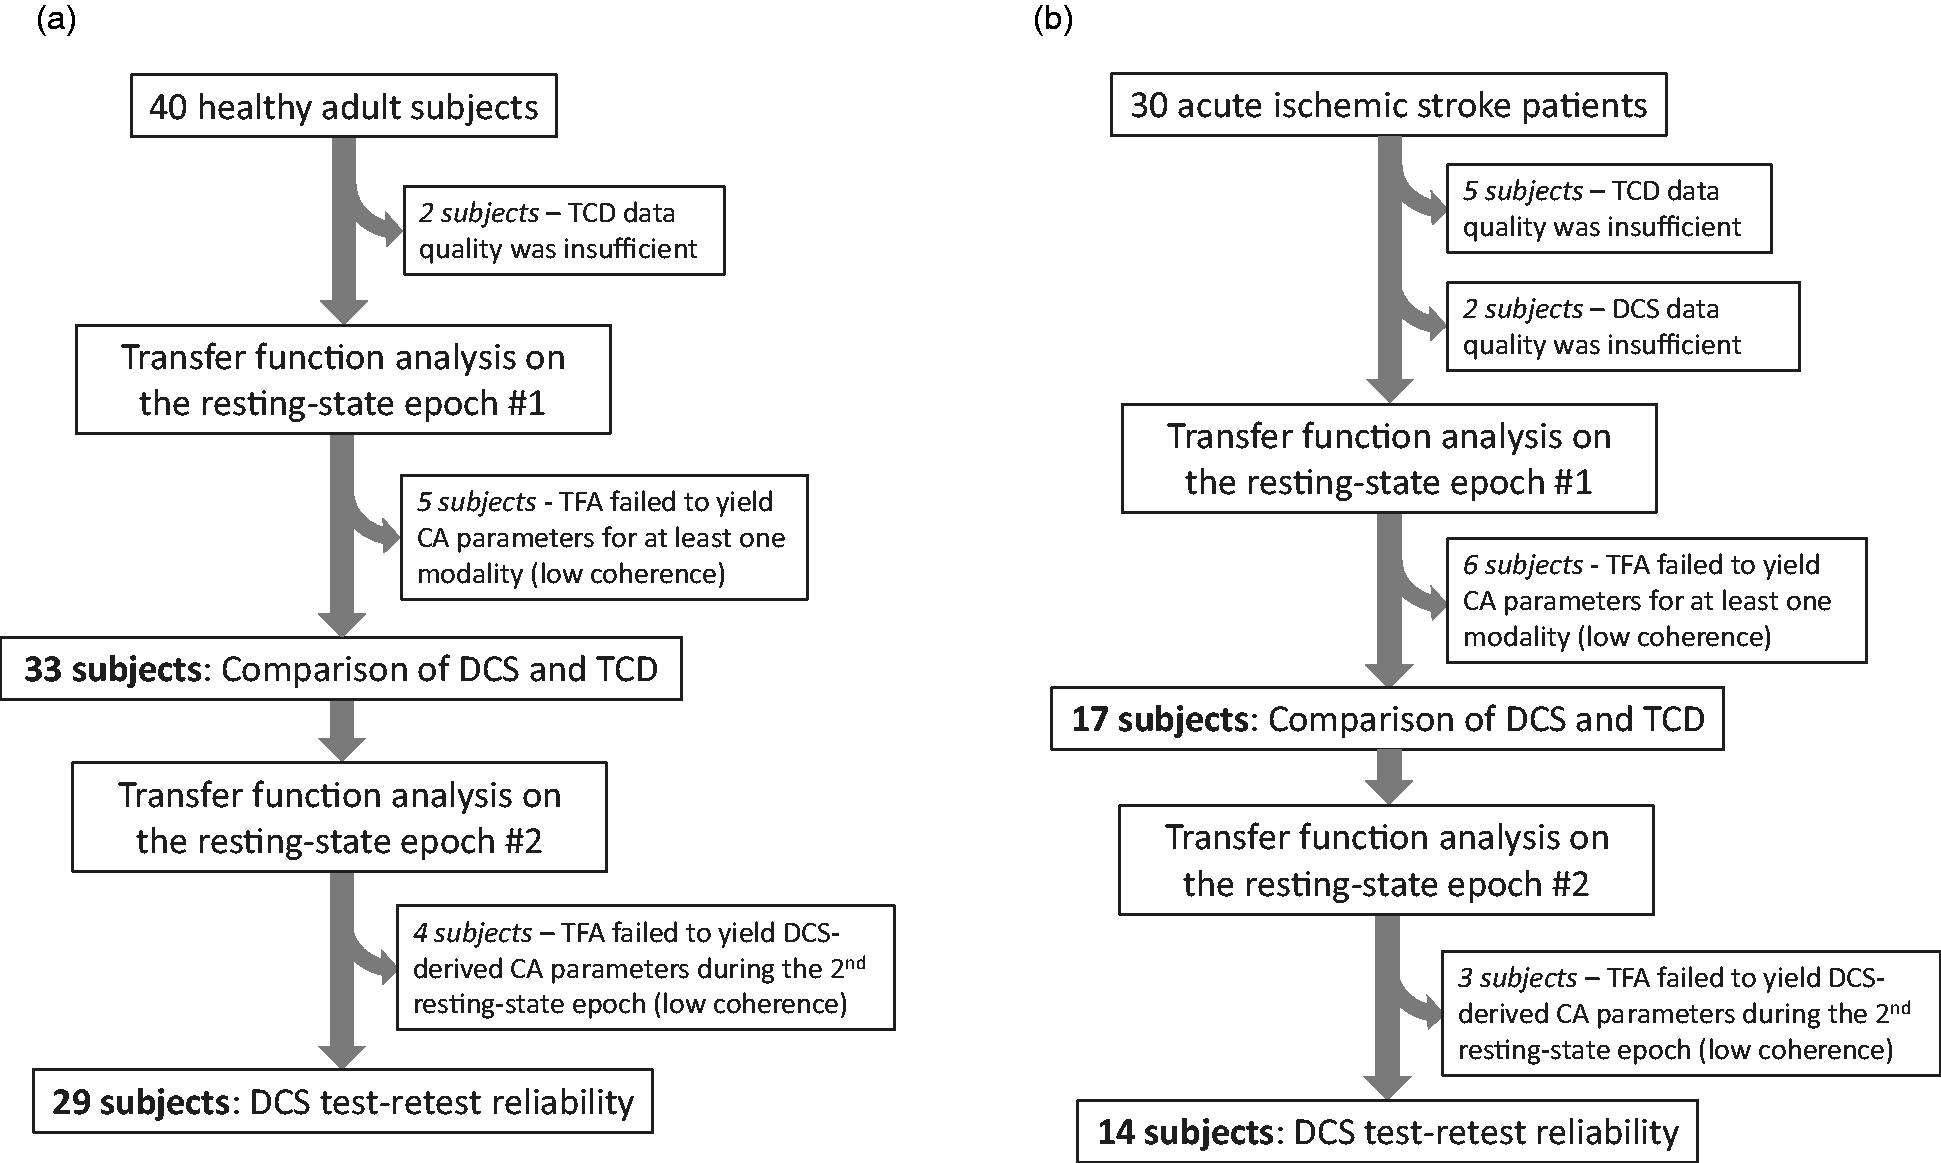
Study accrual: (a) 40 healthy adult subjects were potentially eligible based on completing protocols that included resting-state hemodynamic monitoring with the necessary modalities. 33 yielded data to compare TCD and DCS derived autoregulation parameters, and 29 yielded a second set of DCS-derived autoregulation parameters to assess test-retest reliability and (b) 30 adult patients with acute ischemic stroke were potentially eligible based on completing protocols that included resting-state hemodynamic monitoring with the necessary modalities. 17 yielded data to compare TCD and DCS derived autoregulation parameters, and 14 yielded a second set of DCS-derived autoregulation parameters to assess test-retest reliability.
Healthy volunteer demographics and summary of autoregulation metrics.
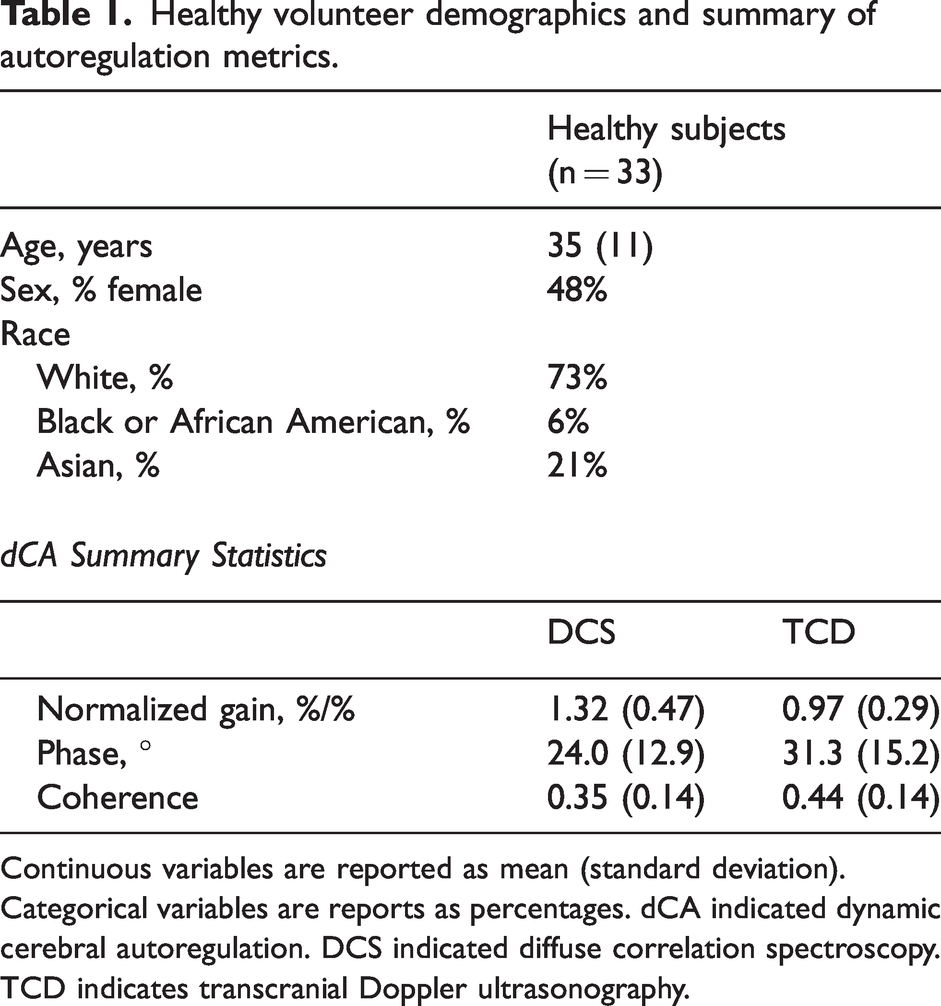
Continuous variables are reported as mean (standard deviation). Categorical variables are reports as percentages. dCA indicated dynamic cerebral autoregulation. DCS indicated diffuse correlation spectroscopy. TCD indicates transcranial Doppler ultrasonography.
In healthy adults, DCS and TCD derived gain are strongly correlated (correlation coefficient 0.73; p < 0.001). Figure 2(a) depicts the linear relationship between the two modalities. A Bland-Altman analysis (Figure 2(b)) indicates that the mean difference between the DCS-gain and TCD-gain is 0.3, and all but one measurement falls within the 95% confidence interval for agreement. There was also strong agreement between DCS derived gain during two resting-state epochs (Figure 2(c); ICC 0.87, p < 0.001).
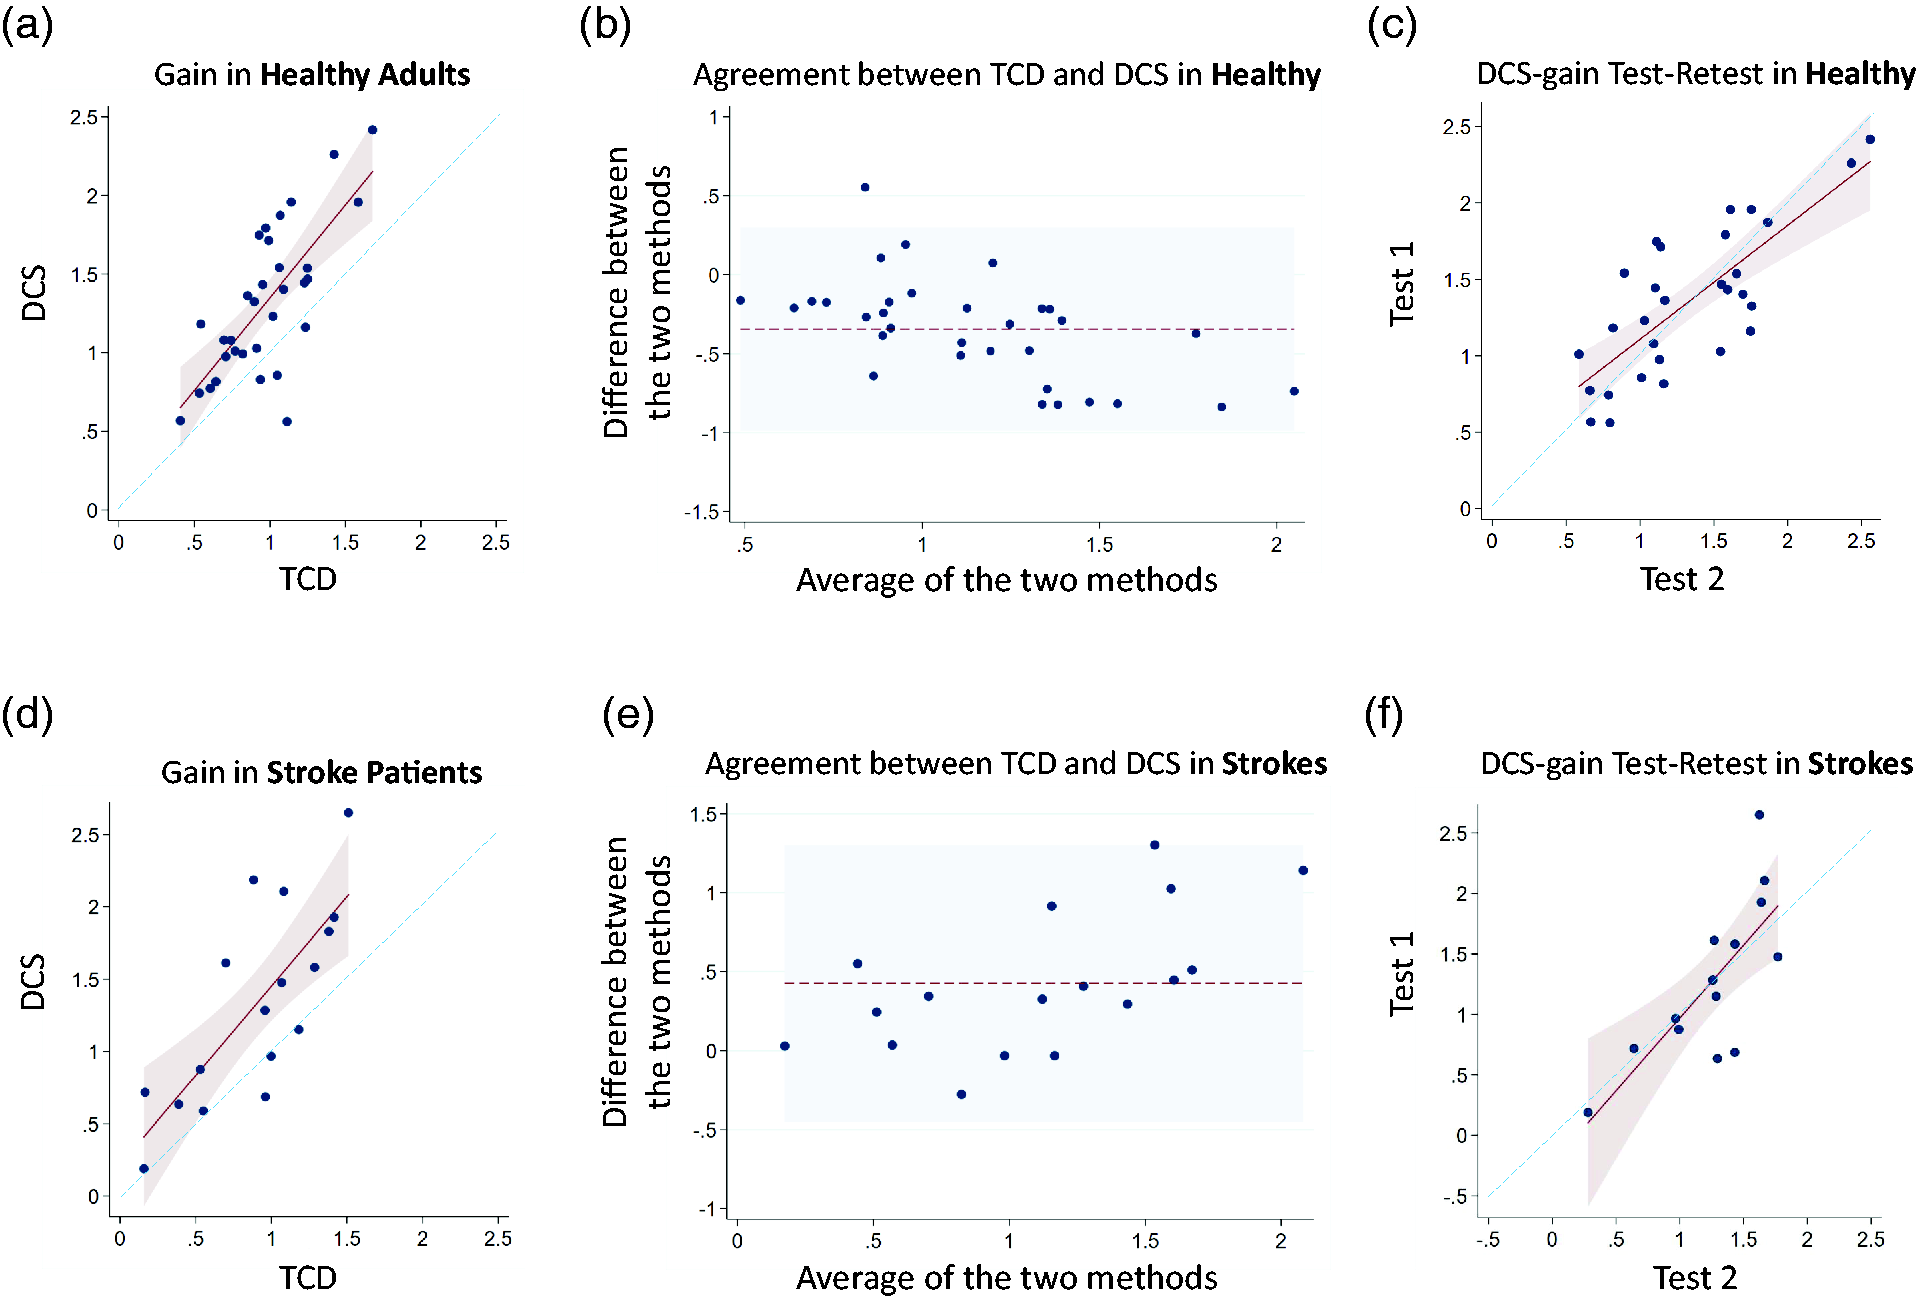
TCD vs DCS measured gain in healthy adults and acute ischemic stroke patients: (a) A scatterplot depicts the TCD-derived gain (x-axis) and DCS-derived gain (y-axis) in healthy volunteers. A linear model (maroon line) with 95% confidence intervals (pink shaded region) is graphed over the scatterplot, along with a line of unity (blue dashed line). The correlation coefficient is 0.73 (p < 0.001), and the linear regression coefficient is 1.17 (+/− 0.20). (b) A Bland-Altman plot indicates that TCD-derived gain is on average 0.3 less than DCS-derived gain (dotted maroon line). The shaded light blue region represents the 95% confidence interval for agreement. (c) Scatterplot depicts the test-retest reliability of DCS-derived gain for healthy volunteers, based on two different resting-state epochs. A linear model (maroon line) with 95% confidence intervals (pink shaded region) is graphed over the scatterplot, along with a line of unity (blue dashed line). The interclass correlation coefficient is 0.87 (p < 0.001), and the linear regression coefficient is 0.80 (+/− 0.13). (d) Scatterplot depicts the TCD-derived gain (x-axis) and DCS-derived gain (y-axis) in acute stroke patients. A lineal model (marron line) with 95% confidence intervals (pink shaded region) is graphed over the scatterplot, along with a line of unity (blue dashed line). The correlation coefficient is 0.76 (p = 0.003), and the linear regression coefficient is 1.23 (+/− 0.26). (e) Bland-Altman plot indicates that DCS-derived gain is on average 0.42 greater than the TCD-derived gain (dotted maroon line). The shaded light blue region represents the 95% confidence interval of agreement. (f) Scatterplot depicts the test-retest reliability of DCS-derived gain for acute stroke patients, based on two different resting-state epochs. A linear model (maroon line) with 95% confidence intervals (pink shaded region) is graphed over the scatterplot, along with the line of unity (blue dashed line). The interclass correlation coefficient is 0.82 (p = 0.001), and the linear regression coefficient is 1.21 (+/− 0.30).
In contrast to gain, the DCS and TCD derived phase are not in agreement in the healthy adults (Figure 3). However, DCS-derived phase retains very good test-retest reliability (Figure 3(c)) as demonstrated by an ICC of 0.88 (p < 0.001).
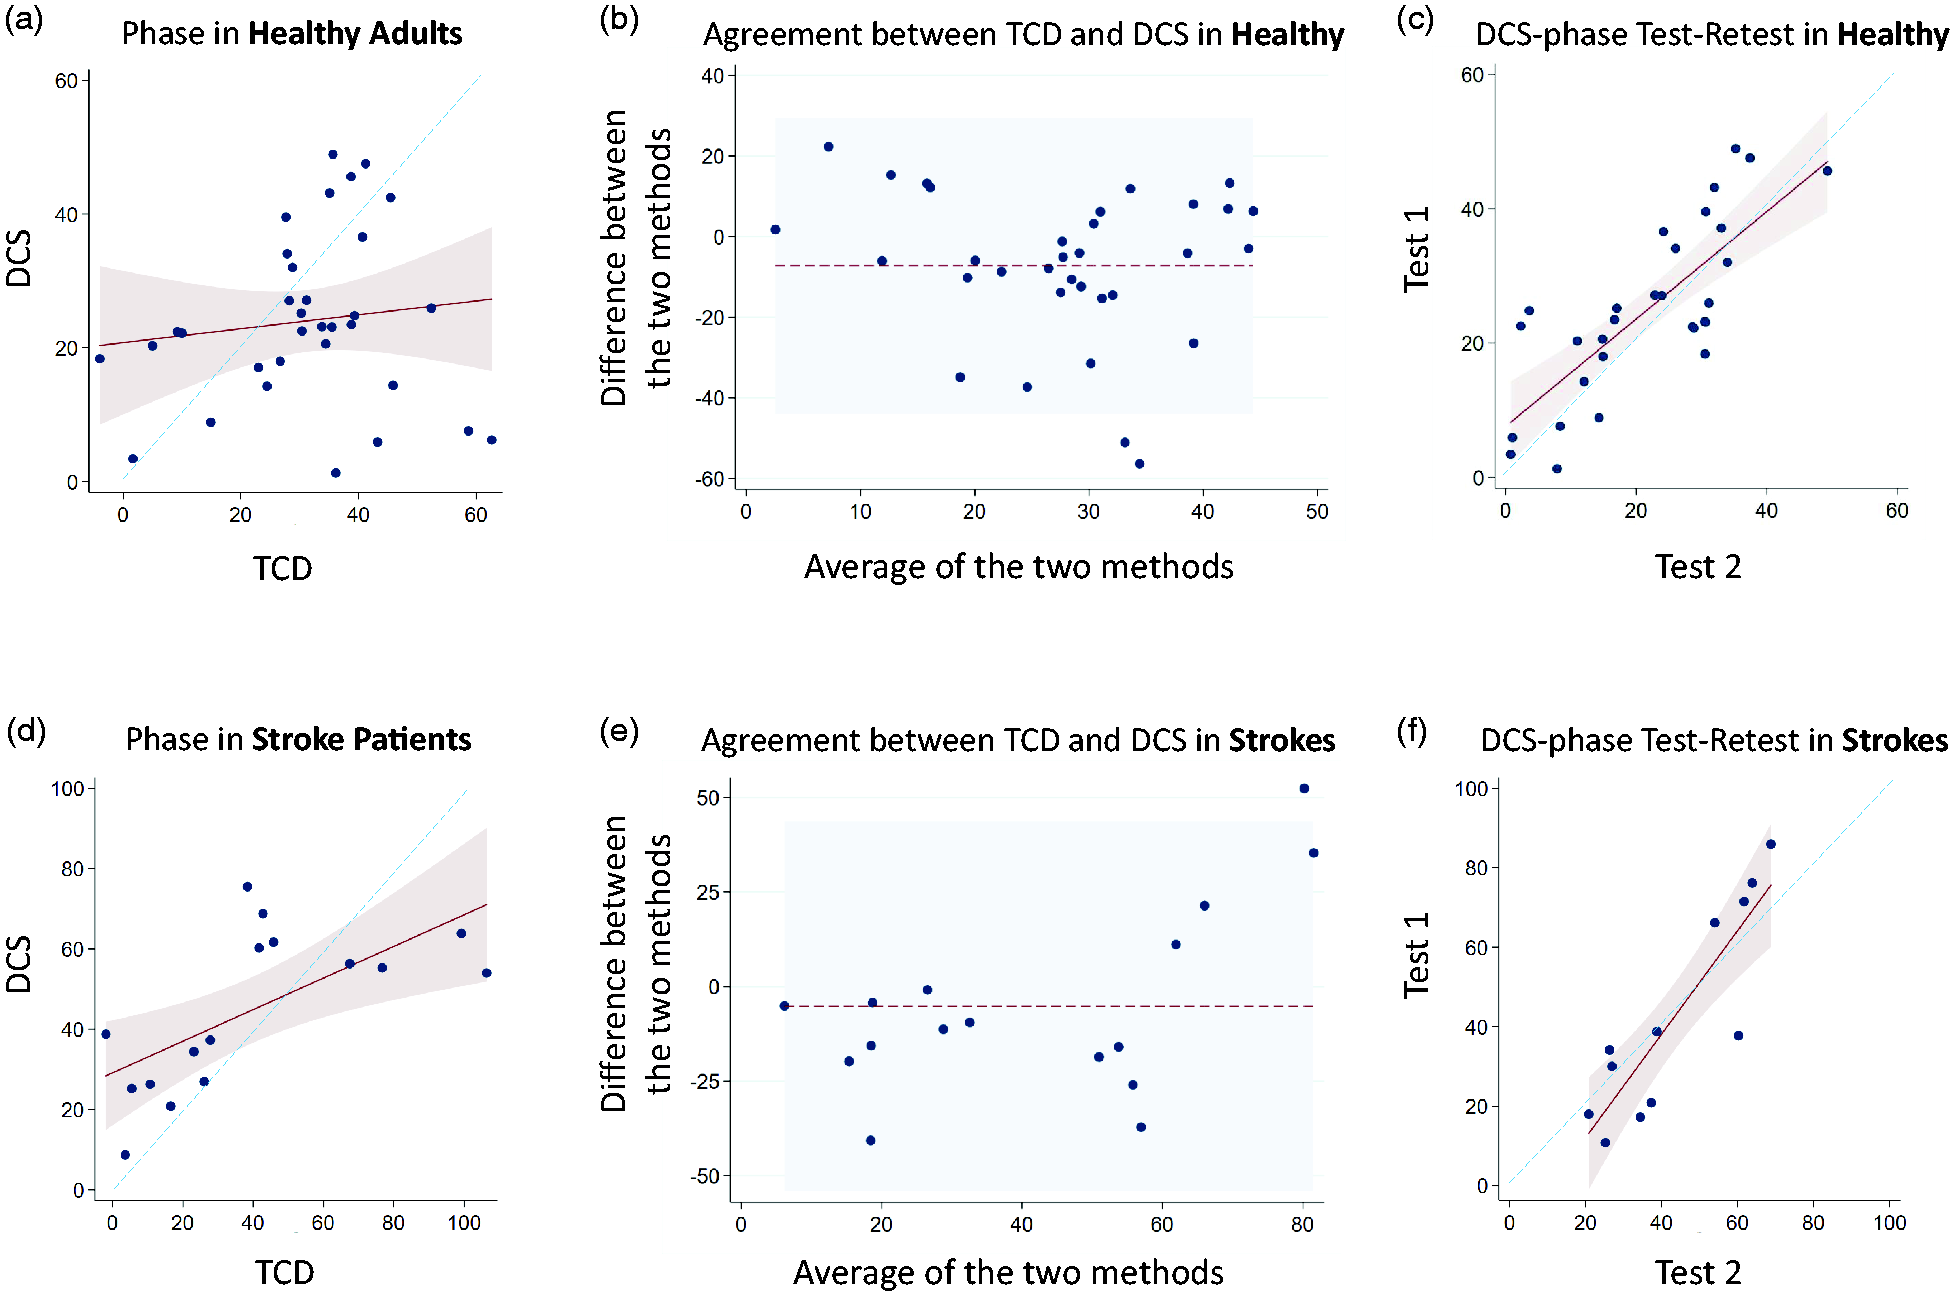
TCD vs DCS measured phase in healthy adults and acute ischemic stroke patients: (a) Scatterplot depicts the TCD-derived phase (x-axis) and DCS-derived phase (y-axis) in healthy volunteers. Correlation is non-significant (p = 0.50). The linear model (maroon line) with 95% confidence intervals (pink shaded region) is similarly non-significant. The blue dashed line represents the line of unity. (b) Bland-Altman plot indicates that DCS-derived phase is on average 7.2 degrees less than the TCD-derived phase (dotted maroon line). The 95% confidence interval for agreement is broad (shaded light blue region). (c) Scatterplot depicts the test-retest reliability of DCS-derived phase in healthy volunteers, based on two different resting-state epochs. A linear model (maroon line) with 95% confidence intervals (pink shaded region) is graphed over the scatterplot, along with a line of unity (blue dashed line). The interclass correlation coefficient is 0.88 (p < 0.001), and the linear regression coefficient is 0.80 (+/− 0.12). (d) Scatterplot depicts the TCD-derived phase (x-axis) and DCS-derived phase (y-axis) in acute stroke patients. The correlation coefficient is 0.65 (p = 0.006). A linear model (maroon line) with 95% confidence intervals (pink shaded region) is graphed over the scatterplot, along with a line of unity (blue dashed line). The linear regression coefficient is 0.40 (+/− 0.12). (b) Bland-Altman plot indicates that DCS-derived phase is on average 5.2 degrees larger than the TCD-derived value. The shaded blue region represents the 95% confidence interval of agreement. (c) Scatterplot depicts the test-retest reliability of DCS-derived gain in acute stroke patients, based on two different resting-state epochs. A linear model (maroon line) with 95% confidence intervals (pink shaded region) is graphed over the scatterplot, along with a line of unity (blue dashed line). The interclass correlation coefficient is 0.90 (p < 0.001), and the linear regression coefficient is 1.30 (+/− 0.22).
In healthy volunteers, coherence was greater for TCD than DCS in both the first and second resting state epoch (p = 0.0002 and p = 0.0001, respectively; Figure 4(a)). Coherence was stable over time, when comparing the first and second resting-state measurement, by DCS (p = 0.85) and TCD (p = 0.94). End-tidal CO2 was similar during the first and second resting state epoch, 37.4 (3.0) vs 37.6 (3.4), p = 0.72 (Figure S1). End-tidal CO2 data were not interpretable in four subjects, and a sensitivity analysis was performed in which subjects without end-tidal CO2 data were excluded, but the results were unaffected.
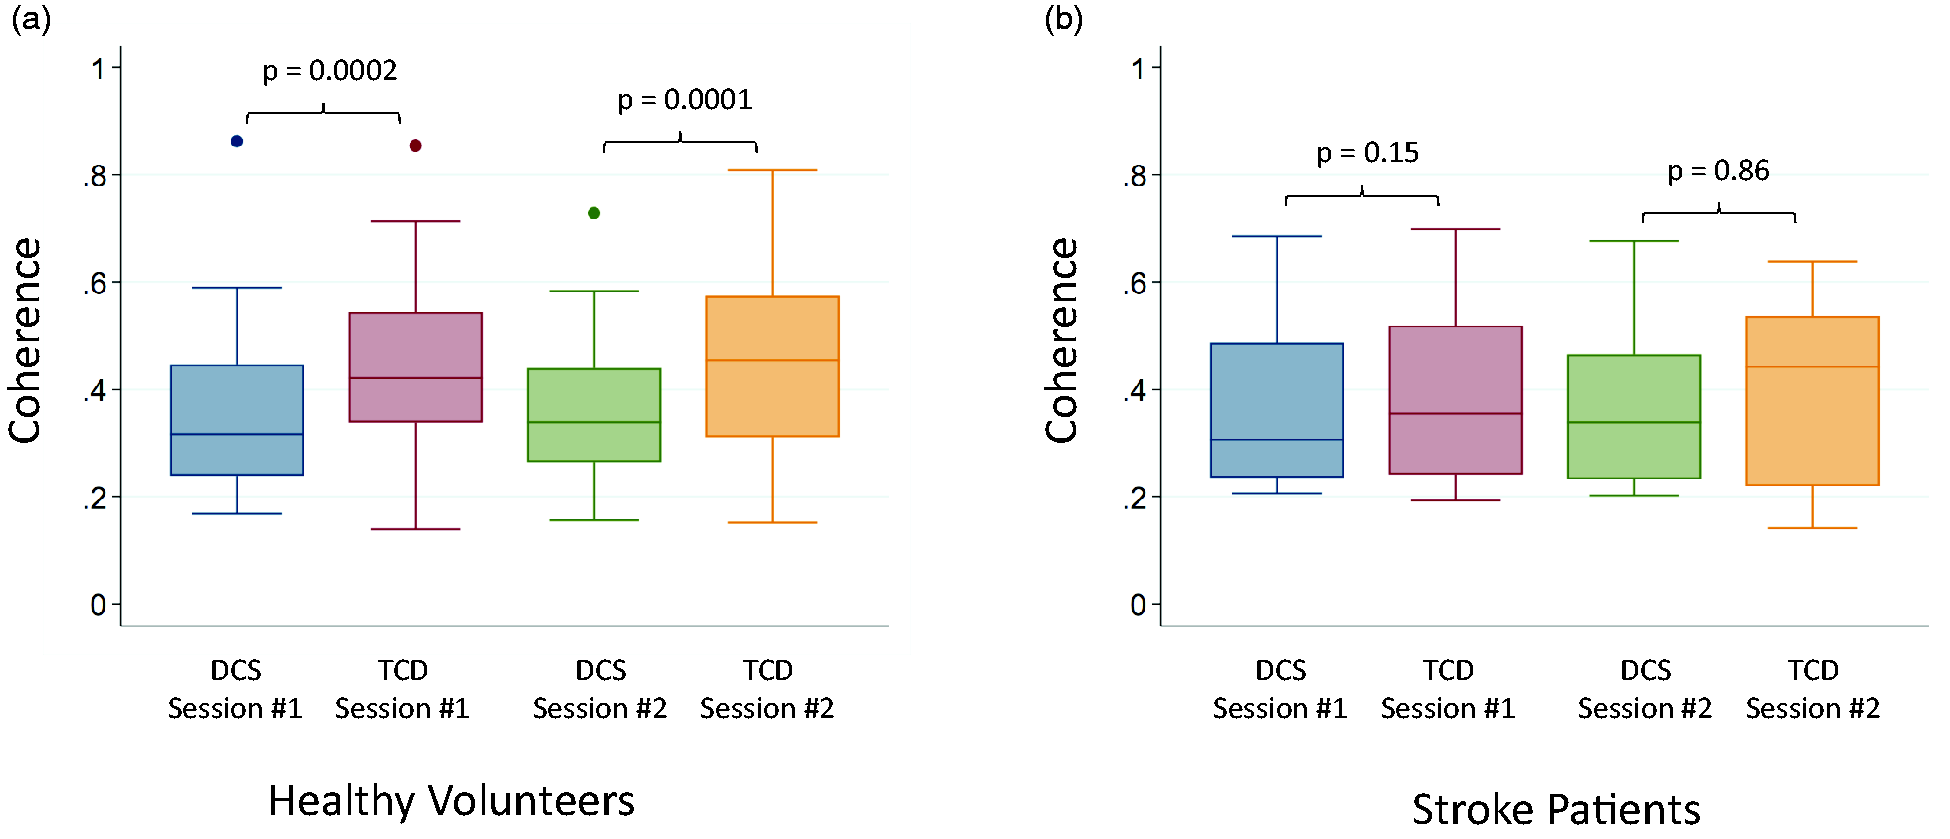
TCD vs DCS measured coherence in healthy adults and acute ischemic stroke patients: (a) In healthy volunteers, Coherence is higher for TCD than DCS during the first (p = 0.0002) and second (p = 0.0001) resting-state epoch. (b) In acute stroke patients, coherence was similar with the two modalities during the first (p = 0.15) and second (p = 0.86) resting-state epoch. P-values were calculated by Wilcoxon signed rank sum test. DCS indicates diffuse correlation spectroscopy. TCD indicated transcranial Doppler.
Acute ischemic stroke patients
30 acute ischemic stroke patients completed monitoring protocols that included TCD, DCS, and BP monitoring during resting-state. Figure 1(b) describes subject exclusion from the final analysis on the basis of data quality or TFA processing. After exclusion, the TCD and DCS derived autoregulation parameters were compared in 17 stroke patients. Test-retest evaluation of DCS-derived CA was performed in 14 of 17 patients. Demographics and dCA summary statistics are reported in Table 2. All strokes were in the MCA territory in one hemisphere, and 47% of strokes affected the left hemisphere. The average admission NIH stroke scale was 6.2 (+/− 4.3).
Acute stroke patient demographics and summary of autoregulation metrics.
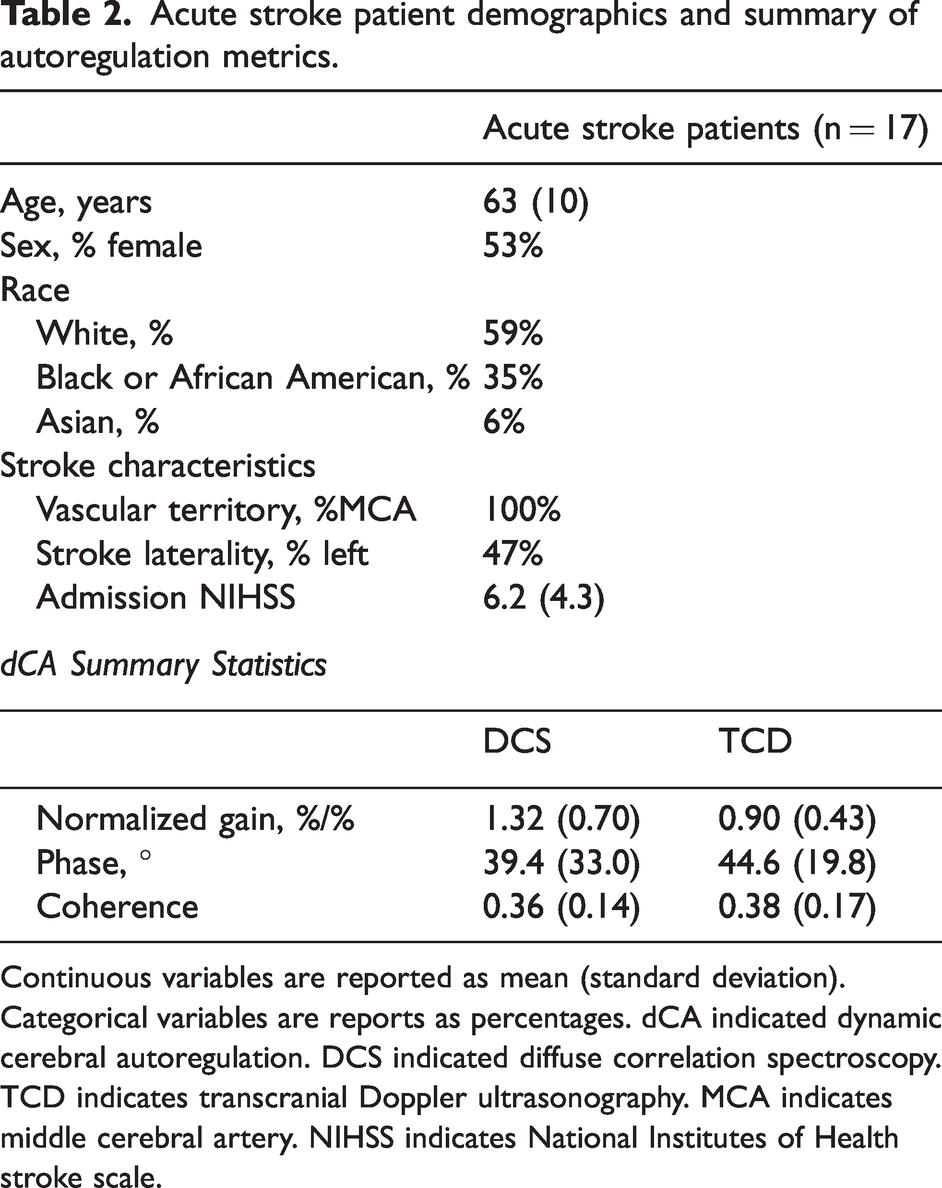
Continuous variables are reported as mean (standard deviation). Categorical variables are reports as percentages. dCA indicated dynamic cerebral autoregulation. DCS indicated diffuse correlation spectroscopy. TCD indicates transcranial Doppler ultrasonography. MCA indicates middle cerebral artery. NIHSS indicates National Institutes of Health stroke scale.
In acute stroke patients, DCS and TCD derived gain are strongly correlated (correlation coefficient 0.76; p = 0.003). Figure 2(d) depicts the linear relationship between the two modalities, and a Bland-Altman analysis (Figure 2(e)) indicates that the mean difference between the DCS-gain and TCD-gain is 0.42. As was noted in healthy volunteers, the DCS-gain is larger, on average. The 95% confidence interval for agreement are broad relative to the mean gain value. In comparing the first and second resting-state epoch, there is strong agreement in DCS-derived gain (Figure 2(f)), as reflected by an ICC of 0.82 (p = 0.001). A Bland-Altman analysis shows that the mean difference between the two gains is very small (0.02).
The correlation between DCS- and TCD-derived phase in acute stroke subjects was significant (Figure 3(d); correlation coefficient 0.65, p = 0.006), though not as strong as the gain values in these same stroke subjects. Although the Bland-Altman plot (Figure 3(e)) indicates the average difference between the two phase values is small (5.2 degrees), the intervals are extremely broad relative to the mean phase values. Despite the relatively weaker agreement (compared to gain) between DCS and TCD-derived phase, the DCS-phase showed excellent test-retest reliability (Figure 3(f)), with an ICC of 0.90 (p < 0.001).
In stroke patients, TCD-based coherence was similar to DCS-based coherence during the first (p = 0.15) and second resting state epoch (p = 0.86), Figure 4(b). Coherence was stable over time, when comparing the first and second resting-state measurement, by DCS (p = 0.09) and TCD (p = 0.53). End-tidal CO2 was similar during the first and second resting state epoch, 38.0 (2.9) vs 37.8 (3.8), p = 0.80 (Figure S1).
Discussion
High-speed DCS is a promising non-invasive bedside technique that can be leveraged to quantify dCA. Our group previously validated DCS as a tool to assess dCA during induced hypotension, 4 but the present investigation represents the first demonstration and validation based on in resting-state data; the work leverages a TFA based technique which can be performed quickly and eliminates the need for inducing an ABP shift, which can be uncomfortable for subjects and may not be safe in all patient populations. DCS-derived gain strongly correlates with TCD and retains excellent test-retest reliability in both healthy volunteers and stroke patients. DCS derived phase is moderately correlated with TCD in stroke patients, but no agreement was observed in healthy volunteers. Still, DCS derived phase retains excellent test-retest reliability in both populations. The discrepancy between TCD and DCS derived phase in healthy volunteers, requires further investigation, but may reflect the temporal dissociation between flow in a proximal arterial trunk, like the proximal MCA, and tissue-level microvascular flow. This work does not quantitatively compare dCA in healthy volunteers and stroke patients, but rather serves to validate the use of DCS in two physiologically distinct cohorts.
One challenge in attempting to validate DCS as a tool for quantifying dCA is the absence of a true gold standard technique for the continuous measurement of tissue level CBF. TCD is commonly used and has the advantage of being non-invasive, well tolerated, and relatively inexpensive,14–17 and test-retest and left-right reliability of TCD has been extensively explored. 17 However, TCD measures CBF-velocity in proximal intracranial arteries; it does not directly measure tissue level perfusion. 18 This is a major limitation and could be a driver of differences in dCA measurements between TCD and optical techniques. Another optical technique, NIRS, has been used to assess dCA, but it quantifies oxy and deoxy-hemoglobin concentration rather than flow.21–23 Thus, to relate NIRS-measured changes to CBF changes requires assumptions, 24 including constant arterial oxygen saturation and cerebral oxygen metabolism, neither of which may be appropriate in all clinical situations, including acute stroke. In contrast to NIRS, DCS has the advantage of directly probing CBF.27,35
Gain reflects how CA attenuates the amplitude of ABP oscillations, and here we report a strong correlation between DCS and TCD-derived gain in healthy volunteers and stroke patients. The two modalities measure different elements of the cerebrovascular system, but this observation indicates that the spontaneous fluctuations in MCA trunk flow velocity and microvascular CBF are similar. This finding is expected, particularly if the MCA trunk has normal caliber. However, it is possible that results would be divergent in the setting of MCA stenosis or occlusion (e.g. if the microvasculature received a larger than usual contribution from collateral flow sources). In such a situation, TCD may not adequately reflect microvasculature flow, so a tool that directly probes tissue flow, such as DCS, is particularly appealing for the study of patients with cerebrovascular disease.
Phase reflects the time delay between changes in ABP and CBF due to CA. DCS and TCD derived phase moderately correlate in stroke patients, but not in healthy volunteers. This discrepancy requires further consideration and investigation but may reflect the fact that DCS and TCD probe different components of the cerebrovascular system. The bulk of vascular resistance is encountered at the level of the arterioles, so proximal (TCD) and distal (DCS) elements of the system may be temporally dissociated. This is consistent with a physiologically-based model of CA developed by Payne and Trassenko, in which CBF-based phase leads CBv-based phase in the frequency range reported here. 36 Baker et al. similarly reported temporal dissociation of TCD and DCS waveforms when calculating critical closing pressure and attributed the difference to compliance of the cerebral microvasculature. 37 In stroke patients, where CA is largely thought to be impaired, it is possible that the dissociation between trunk and microvasculature is attenuated, thereby justifying the moderate correlation between DCS and TCD-derived phase. To better compare the stroke data with non-stroke data, future work should include age-matched adults with vascular risk factors, to ensure the discrepancy is not attributable to a variable other than stroke. In healthy volunteers, if arteriolar resistance is responsible for the phase dissociation, one might therefore expect DCS derived phase to be larger than TCD derived phase. In fact, Elting et al. reported NIRS derived phase to be consistently larger than TCD derived phase, 38 but the relationship between the two modalities in healthy volunteers was only significantly after applying a transit time correction. It is also possible that subtle instability in the DCS signal results in oscillations that confound the phase analysis. Prior work from our group evaluated cerebral autoregulation by inducing hypotension with sudden thigh-cuff deflation. In that paradigm the rate of regulation (ROR) quantifies how quickly the microvasculature resistance adapts to a drop in BP. We found a similar ROR with DCS and TCD, 4 but ROR is calculated over only a few seconds so is less sensitive to subtle background signal instability. Future work may clarify the validity of DCS-based phase by collecting DCS, NIRS, and TCD data in parallel, or by comparing a range of dCA techniques in the same patient population.
In healthy volunteers, a difference in coherence was observed between TCD and DCS. This is likely attributable to a difference in signal-to-noise ratios between the two modalities (i.e. TCD can be expected to have a higher SNR). A similar discrepancy was previously reported when comparing TCD and NIRS. 39 Stroke patients may be less cooperative, and subjects movement may disproportionately compromise the SNR for TCD, justifying the similar coherence values in this cohort. Alternatively, the stroke cohort is smaller and therefore less sensitive to differences between the two modalities. It is also conceivable that the reported coherence differences are physiologically relevant. For example, in healthy adults, proximal CBv may be more linearly dependent on ABP, while the linear relationship between microvascular CBF and ABP is attenuated by vasoregulation at the level of the arterioles. In stroke patients, the two modalities demonstrate similar coherence, which may indicate that arteriolar dysregulation allows the two outputs to achieve a similar linear dependence on ABP.
The study has several limitations. This study contains two distinct cohorts: (1) young healthy volunteers and (2) older ischemic stroke patients. Comparing the groups is confounded by age and vascular risk factors, so one cannot assume the differences are attributable of stroke alone. To facilitate a quantitative inter-group comparison, future work should include a cohort of age-matched subjects with vascular risk factors. Importantly, the aim of this study was not to compare dCA between healthy volunteers and stroke patients, but rather to validate the use of DCS in the study of dCA, in which case diverse cohorts help to ensure in both cohorts. The data were not collected within the confines of a single protocol aimed at studying dCA, but rather a post-hoc analysis of several studies evaluating bedside interventions. Alternatively, this may highlight a strength of the TFA based analysis which can be performed on brief epochs from various protocols. The test-retest evaluation is limited by the fact that the second 5-minute epoch was extracted from the final resting state data from the same monitoring session (i.e., after a bedside intervention was performed). Each intervention was followed by a 5-minute wash-out before collecting the second resting state epoch, thereby reducing the likelihood that the intervention impacted the final resting state data. The strong test-retest reliability reported here minimizes the relevance of this potential limitation. The lack of a gold standard in measuring dCA presents a challenge. TCD is a commonly used and well accepted modality, but it has limitations. In the stroke patients, data quality issues eliminated a substantial proportion of patients from the analysis. TFA requires high-quality data without artifact or signal dropout. In stroke patients, neurologic impairment or other medical complexities may result in a lower level of cooperation and more frequent movement artifacts than is ideal. More broadly, the TFA methodology is limited by the assumption that CA is a linear control system. The sampling frequency of DCS is considerably lower than many other instruments used in dCA research. Although high-speed DCS represents a significant advance, 20 Hz data acquisition as reported here, is considerably lower than TCD and NIRS. To facilitate a matched sample rate across all instruments, the TCD and finometer were down-sampled at 20 Hz. This may fail to capture some very high frequency vascular phenomena but is 100 fold the upper limit of the low frequency band and should therefore be adequate. In future work, linear interpolation could be leverage to artificially increase the DCS frequency and thereby avoid down-sampling other instruments.
DCS is a promising non-invasive bedside technique in studying cerebral hemodynamics. Here we demonstrate the potential role of DCS in quantifying dCA from brief epochs of resting state data. DCS is particularly reliable in assessing magnitude or amplitude changes in CBF, quantified as gain. The temporal regulation of CBF, quantified as phase, should be interpreted with caution as further investigation is required to confirm the validity of DCS derived phase and to clarify the discrepancy between TCD and DCS derived phase.
Supplemental Material
sj-pdf-1-jcb-10.1177_0271678X231153728 - Supplemental material for Dynamic cerebral autoregulation measured by diffuse correlation spectroscopy
Supplemental material, sj-pdf-1-jcb-10.1177_0271678X231153728 for Dynamic cerebral autoregulation measured by diffuse correlation spectroscopy by Christopher G Favilla, Michael T Mullen, Farhan Kahn, Izad-Yar Daniel Rasheed, Steven R Messe, Ashwin B Parthasarathy and Arjun G Yodh in Journal of Cerebral Blood Flow & Metabolism
Footnotes
Funding
The author(s) disclosed receipt of the following financial support for the research, authorship, and/or publication of this article: This work was supported by the AHA (19CDA-34630033, CGF) and NIH (K23-NS110993, CGF; P41-EB01593, AGY).
Acknowledgements
The authors greatly appreciate numerous productive discussions with Dr. Wesley B. Baker, Dr. Tiffany Ko, and Dr. John A. Detre.
Declaration of conflicting interests
The author(s) declared the following potential conflicts of interest with respect to the research, authorship, and/or publication of this article: CGF, MTM, FK, SRM, and IDR declare no potential conflicts of interest with respect to the research, authorship, or publication of this article. ABP and AGY have two patents potentially relevant to this work (United States patents 10,342,488 and 10,827,976) that do not currently generate income. AGY has two additional patents (United States patents 8,082,015 and 6,076,010) that do not currently generate income.
Authors’ contributions
CGF was responsible for study design, data acquisition, data analysis, data interpretation, and manuscript preparation. FK and IDR were responsible for and data analysis, data interpretation, and manuscript revisions. ABP was responsible for data acquisition, data analysis, and manuscript revisions. SRM was responsible for data interpretation and manuscript revisions. AGY was responsible for data analysis, data interpretation, and manuscript revision. MTM was responsible for study design, data interpretation, and manuscript preparation.
Supplemental material
Supplemental material for this article is available online.
References
Supplementary Material
Please find the following supplemental material available below.
For Open Access articles published under a Creative Commons License, all supplemental material carries the same license as the article it is associated with.
For non-Open Access articles published, all supplemental material carries a non-exclusive license, and permission requests for re-use of supplemental material or any part of supplemental material shall be sent directly to the copyright owner as specified in the copyright notice associated with the article.