
Abstract
Neuronal activation sequence information is essential for understanding brain functions. Extracting such timing information from blood-oxygenation-level-dependent functional magnetic resonance imaging (fMRI) signals is confounded by local cerebral vascular reactivity (CVR), which varies across brain locations. Thus, detecting neuronal synchrony as well as inferring inter-regional causal modulation using fMRI signals can be biased. Here we used fast fMRI measurements sampled at 10 Hz to measure the fMRI latency difference between visual and sensorimotor areas when participants engaged in a visuomotor task. The regional fMRI timing was calibrated by subtracting the CVR latency measured by a breath-holding task. After CVR calibration, the fMRI signal at the lateral geniculate nucleus (LGN) preceded that at the visual cortex by 496 ms, followed by the fMRI signal at the sensorimotor cortex with a latency of 464 ms. Sequential LGN, visual, and sensorimotor cortex activations were found in each participant after the CVR calibration. These inter-regional fMRI timing differences across and within participants were more closely related to the reaction time after the CVR calibration. Our results suggested the feasibility of mapping brain activity using fMRI with accuracy in hundreds of milliseconds.
Introduction
The amplitude of the functional MRI (fMRI) 1 signals using the blood oxygen level dependent (BOLD) contrast2,3 has been extensively used to reveal the neurophysiological underpinning of brain function and dysfunction. While the time series of fMRI has also been used to reveal brain networks subserving cognition and behavior,4,5 the fine temporal features (within a second) in the fMRI signal are less studied. The sub-second time scale is closely related to many neuronal processes, whose dynamics are macroscopically manifested in different oscillatory frequencies. 6 At this temporal scale, it was found that sequential neuronal activations can modulate the fMRI signal amplitude. 7 The durations of the fMRI signal, in the range of hundreds of milliseconds, in motor planning areas correlate with behavioral reaction times.8,9 The relative delays between visual hemifield stimuli in hundreds of milliseconds correlate with interhemispheric fMRI latency differences. 8 Timing differences across brain areas in the sub-second time scale have also been reported in chronometry studies.9 –13 More recently, fMRI sampled on the order of milliseconds detects sequential propagation of neuronal activity through functionally defined networks. 14 While these results convergently suggest that the fine timing features in the fMRI signal can be used to study neuronal activity, caution should be taken to address the latency in the fMRI signals caused by cerebral vascular reactivity (CVR;.15 –17 Estimates of inter-regional neuronal timing, synchrony, and causal modulation using inter-regional timing in the fMRI signals can be biased when the vascular component of the fMRI signal is not appropriately adjusted.
Previous studies report that the hemodynamic response function (HRF) differs across brain locations.18,19 At adjacent image voxels, their HRF can exhibit a latency difference of up to 2 s. 11 At image voxels adjacent to vessels and sulci, the lag of the local HRF and the stimulus onset ranges between 8 and 14 s. 20 This latency has been suggested to be related to the transit time of the oxygenated blood 21 and the expansion of the venous drainage system.22,23 Across individuals, the HRF varies in amplitude and waveforms. 11 Suppressing the fMRI timing information from non-neural origins can improve the specificity of estimating sequential brain activity from fMRI signals. Hypercapnic challenge (breath-holding, BH) can quantify and map the hemodynamic latency of vascular responses across the whole brain. 16 The BH task causes local up-regulation of the blood flow and leads to vasodilation. 24 Since BH modulates cerebral blood flow to all vascularized brain regions without an accompanying change in cerebral metabolic rate of oxygen (CMRO2;, 25 it is a simple and robust approach for assessing the regional CVR uncoupled from neural activation.18,26 The fMRI signals in a BH task were correlated with the magnitude of the task-fMRI signal26,27 and the vascular delay. 16 However, the latency of fMRI signals in the BH task cannot reliably predict the latency of the visuomotor saccade task. 27 The weak correlation may be due to the variable motor response time in the saccade task and the inaccurate delineation of fMRI temporal features in a relatively slow sampling rate (2 s).
In this study, we aimed to reliably detect the fMRI sub-second timing features correlated with neuronal activity. To achieve this goal, we used fast fMRI measurements in the 10-Hz sampling rate 28 to measure the fMRI signals when subjects engaged in both BH and visuomotor (VM) tasks. We chose the VM task because it reliably elicits brain activity in visual and sensorimotor areas with a typical sub-second reaction time (RT). This relatively simple task also suggests the likely feedforward neuronal activation from the lateral geniculate nucleus (LGN), visual, 29 and sensorimotor cortices. The BH task was used to characterize the CVR, whose timing will be subtracted from the fMRI signal timing to yield a more sensitive detection of neural activity. Our previous study reported that the inter-regional fMRI timing difference is linearly related to the underlying oscillatory neuronal responses, and the order of inter-regional fMRI activation follows the order of the feed-forward stimulus-response relationship. 30 With the calibration of CVR, we hypothesize that the inter-regional timing difference can be reliably detected not only in a group but within individuals. This inter-regional fMRI timing difference between visual and sensorimotor areas was further hypothesized to be more linearly related to the RT after CVR calibration.
Material and methods
Subjects and the task
This study followed ethical standards of the Helsinki Declaration of 1975. Thirteen healthy right-handed participants (4 females; 24 ± 1.7 years old) joined this study with written informed consent before joining our experiments. The study was approved by the Institutional Review Board of National Taiwan University Hospital. In the experiment, each participant was instructed to engage in a BH and a VM task. The task stimuli were presented by Psychtoolbox.31 –33
The BH task started with a paced breathing (period =43 s; 2 s per inhale-exhale cycle) with visual cues, followed by 2 s of exhalation, and then holding a breath for 15 s. Such a breath-holding task block (60 s) was repeated four times in a 240 s run. In the VM task, participants were instructed to use either their left or right thumb to press a button immediately after perceiving a hemifield checkerboard flashing (1 s duration; 8 Hz checkerboard reversal; 100% contrast). The response hand should match the hemifield stimulus: the right hemifield visual stimulus should respond with the right hand. The left hemifield visual stimulus should respond with the left hand. The onset of each checkerboard flashing was randomized with a uniform distribution of the inter-stimulus intervals varying between 3 s and 15 s (average 5 s). There were 20 trials of the left hemifield visual stimuli and 20 trials of the right hemifield visual stimuli in a 240-s run. Two runs of the BH data and two runs of the VM data were collected from each participant.
MRI data acquisition and reconstruction
All data were acquired from a 3 T MRI scanner (Skyra, Siemens, Erlangen, Germany) with a 32-channel head coil array. We used a fast fMRI protocol, named simultaneous-multi-slice inverse imaging (SMS-InI), to acquire BOLD-contrast fMRI with a 10-Hz sampling rate.28,34 Specifically, each fast fMRI volumetric acquisition collected 20 axial 4-mm thick slices with a 1-mm gap between slices. These slices were separated into two slice groups, each of which had ten slices. It took 50 ms to measure one slice group. Neighboring slices within each slice group were further separated by simultaneous echo-refocusing. 35 Simultaneously excited slices were spatially encoded and unfolded by the blipped controlled aliasing in parallel imaging (CAIPI) method 36 by introducing a 1/3 field-of-view (FOV) shift in the phase-encoding (anterior-posterior) direction in every other slice. Other imaging parameters were: flip angle = 30°, in-plane resolution = 5 mm ×5 mm, FOV = 210 × 210 × 210 mm3, TR =100 ms, and TE =25/27.5 ms. The flip angle choice was based on the Ernst angle with T1 = 1 s and TR = 100 ms. To reconstruct volumetric images, a reference scan was collected with full partition encoding steps after slice group excitation. A reference scan was acquired before the accelerated scan. The fast fMRI scan used the same imaging parameters in the reference scan, except that all partition encoding steps were discarded. Cardiac and respiratory cycles were measured by a photoplethysmogram placed at the index fingertip and a respiration belt strapped around the upper abdomen (Siemens, Erlangen, Germany) of each participant, respectively. Cardiac and respiratory waveforms and the onsets of each SMS-InI volume were recorded. The sampling rate of cardiac and respiration cycle monitoring was 400 Hz.
The reconstruction of InI data was done by a regularized sensitivity encoding (SENSE) algorithm,37,38 which generated 2,400 volumes of brain images in each run. We used the in vivo sensitivity method 39 to construct the imaging encoding matrix because fMRI experiments are primarily concerned with signal changes over time. Disturbances in the fMRI time series related to spontaneous cardiac and respiratory cycles were suppressed by the RETROICOR 40 and RVHRCOR 41 for the VM task. For the BH task, we only used RETROICOR and the heart-rate variability parts of the RVHRCOR method because the changes in the fMRI time series related to breathing were the target effect. Using the respiration rate or depth of the RVHRCOR method would have removed such an effect.
Brain structural images for each subject were also acquired using a T1-weighted pulse sequence (magnetization-prepared rapid gradient echo (MPRAGE); TR/TE/TI = 2530/3.03/1100 ms, flip angle = 7°, partition thickness = 1.33 mm, matrix size = 256 × 256, 192 partitions, FOV = 21 × 21 cm2, generalized autocalibrating partially parallel acquisitions (GRAPPA) acceleration = 2).
fMRI latency estimation
The fMRI signal latency was estimated at each image voxel by correlating its time series and a temporally shifted reference time series. In the BH task, the reference time series was the average time series across voxels significantly correlated with the BH reference waveform, which was the convolution of a canonical hemodynamic response function (SPM8 http://www.fil.ion.ucl.ac.uk/spm/software/spm8/) and a discrete time series with values of ones indicating the interval of BH and zeros otherwise. 16 In the VM task, the reference time series was the convolution of a canonical hemodynamic response function and a discrete time series with values of ones at instants of visual stimulus onsets. The significance of the correlation was calculated by a linear regression analysis, where the design matrix included not only the reference time series but also the confounding terms of a constant and a linear trend. The significance of the correlation was corrected for multiple comparisons by controlling the family-wise error (FWE) with the threshold p = 0.0001. The time shift of the reference time series was permitted between ± 4 s 16 in steps of 0.1 s. At brain locations showing a significant correlation to the reference waveform, the fMRI signal latency was defined as the time shift yielding the maximal correlation. Note that the CVR latency was based on the BH reference time series, identical at all brain locations within one participant but different between participants.
To reduce the bias in timing estimates related to CVR, the fMRI signal latency derived from the BH task was subtracted from the fMRI signal latency derived from the VM task at each image voxel to generate the CVR-calibrated VM latency map, where values referred to the difference between the visual stimulus onset and the BH reference time series. Then, the inter-regional fMRI latency differences extracted from the CVR-calibrated VM latency map were calculated to remove the temporal bias caused by the references in the CVR-calibrated VM latency map. Finally, the inter-regional fMRI latency in the CVR-calibrated VM latency map was correlated with the RT, calculated as the time difference between the onset of the visual stimulus and the time of the button pressing. This correlation was first assessed by taking the average RT across trials across participants. We also studied whether the inter-regional fMRI latency differences correlate with the RT within participants. Specifically, we used a bootstrap approach to estimate the inter-regional fMRI signal latency and RT for each participant. All trials were arbitrarily partitioned into two groups. The fMRI latency difference between the two regions was calculated for each bootstrap group using the procedure described above. Each partitioning also yielded two RTs for two bootstrap groups. The bootstrap process was repeated 100 times to provide 200 estimates of within-participant inter-regional fMRI signal latency differences and 200 estimates of the within-participant RTs. We then used the linear regression described above to test if the within-participant inter-regional fMRI signal latency difference was correlated with the within-participant RT for each participant separately.
Statistical analyses
A two-tailed paired-sample t test was applied to examine the significant differences of the inter-regional fMRI signal timing between two brain regions. Pearson correlation coefficients were computed to reveal the relationships between the inter-regional fMRI timing differences and RTs. The statistical tests were all corrected by the Bonferroni method 42 to prevent errors related to multiple comparisons.
Results
Inter-regional fMRI signal timing after suppressing the vascular reactivity bias
We first quantified the hemodynamic changes caused by the BH task, which was expected to elicit fMRI signal increase across the whole brain. Figure 1(a) shows the distribution of percentage change of the fMRI signal. The largest signal increase was close to veins and sinuses (10.17 +/− 4.34%). The signal increase at the gray matter (3.15 +/− 1.72%) was larger than those at the white matter (0.76 +/− 1.41%). Figure 1(b) shows the latency map. We found the hemodynamic responses at the frontal lobe (−1.20 +/− 0.96 s) were earlier than at other parts of the brain. Relatively delayed responses were found at the deep white matter (0.85 +/− 1.15 s) and the posterior part of the brain adjacent to the large veins, including the superior sagittal sinus (1.77 +/− 0.51 s).
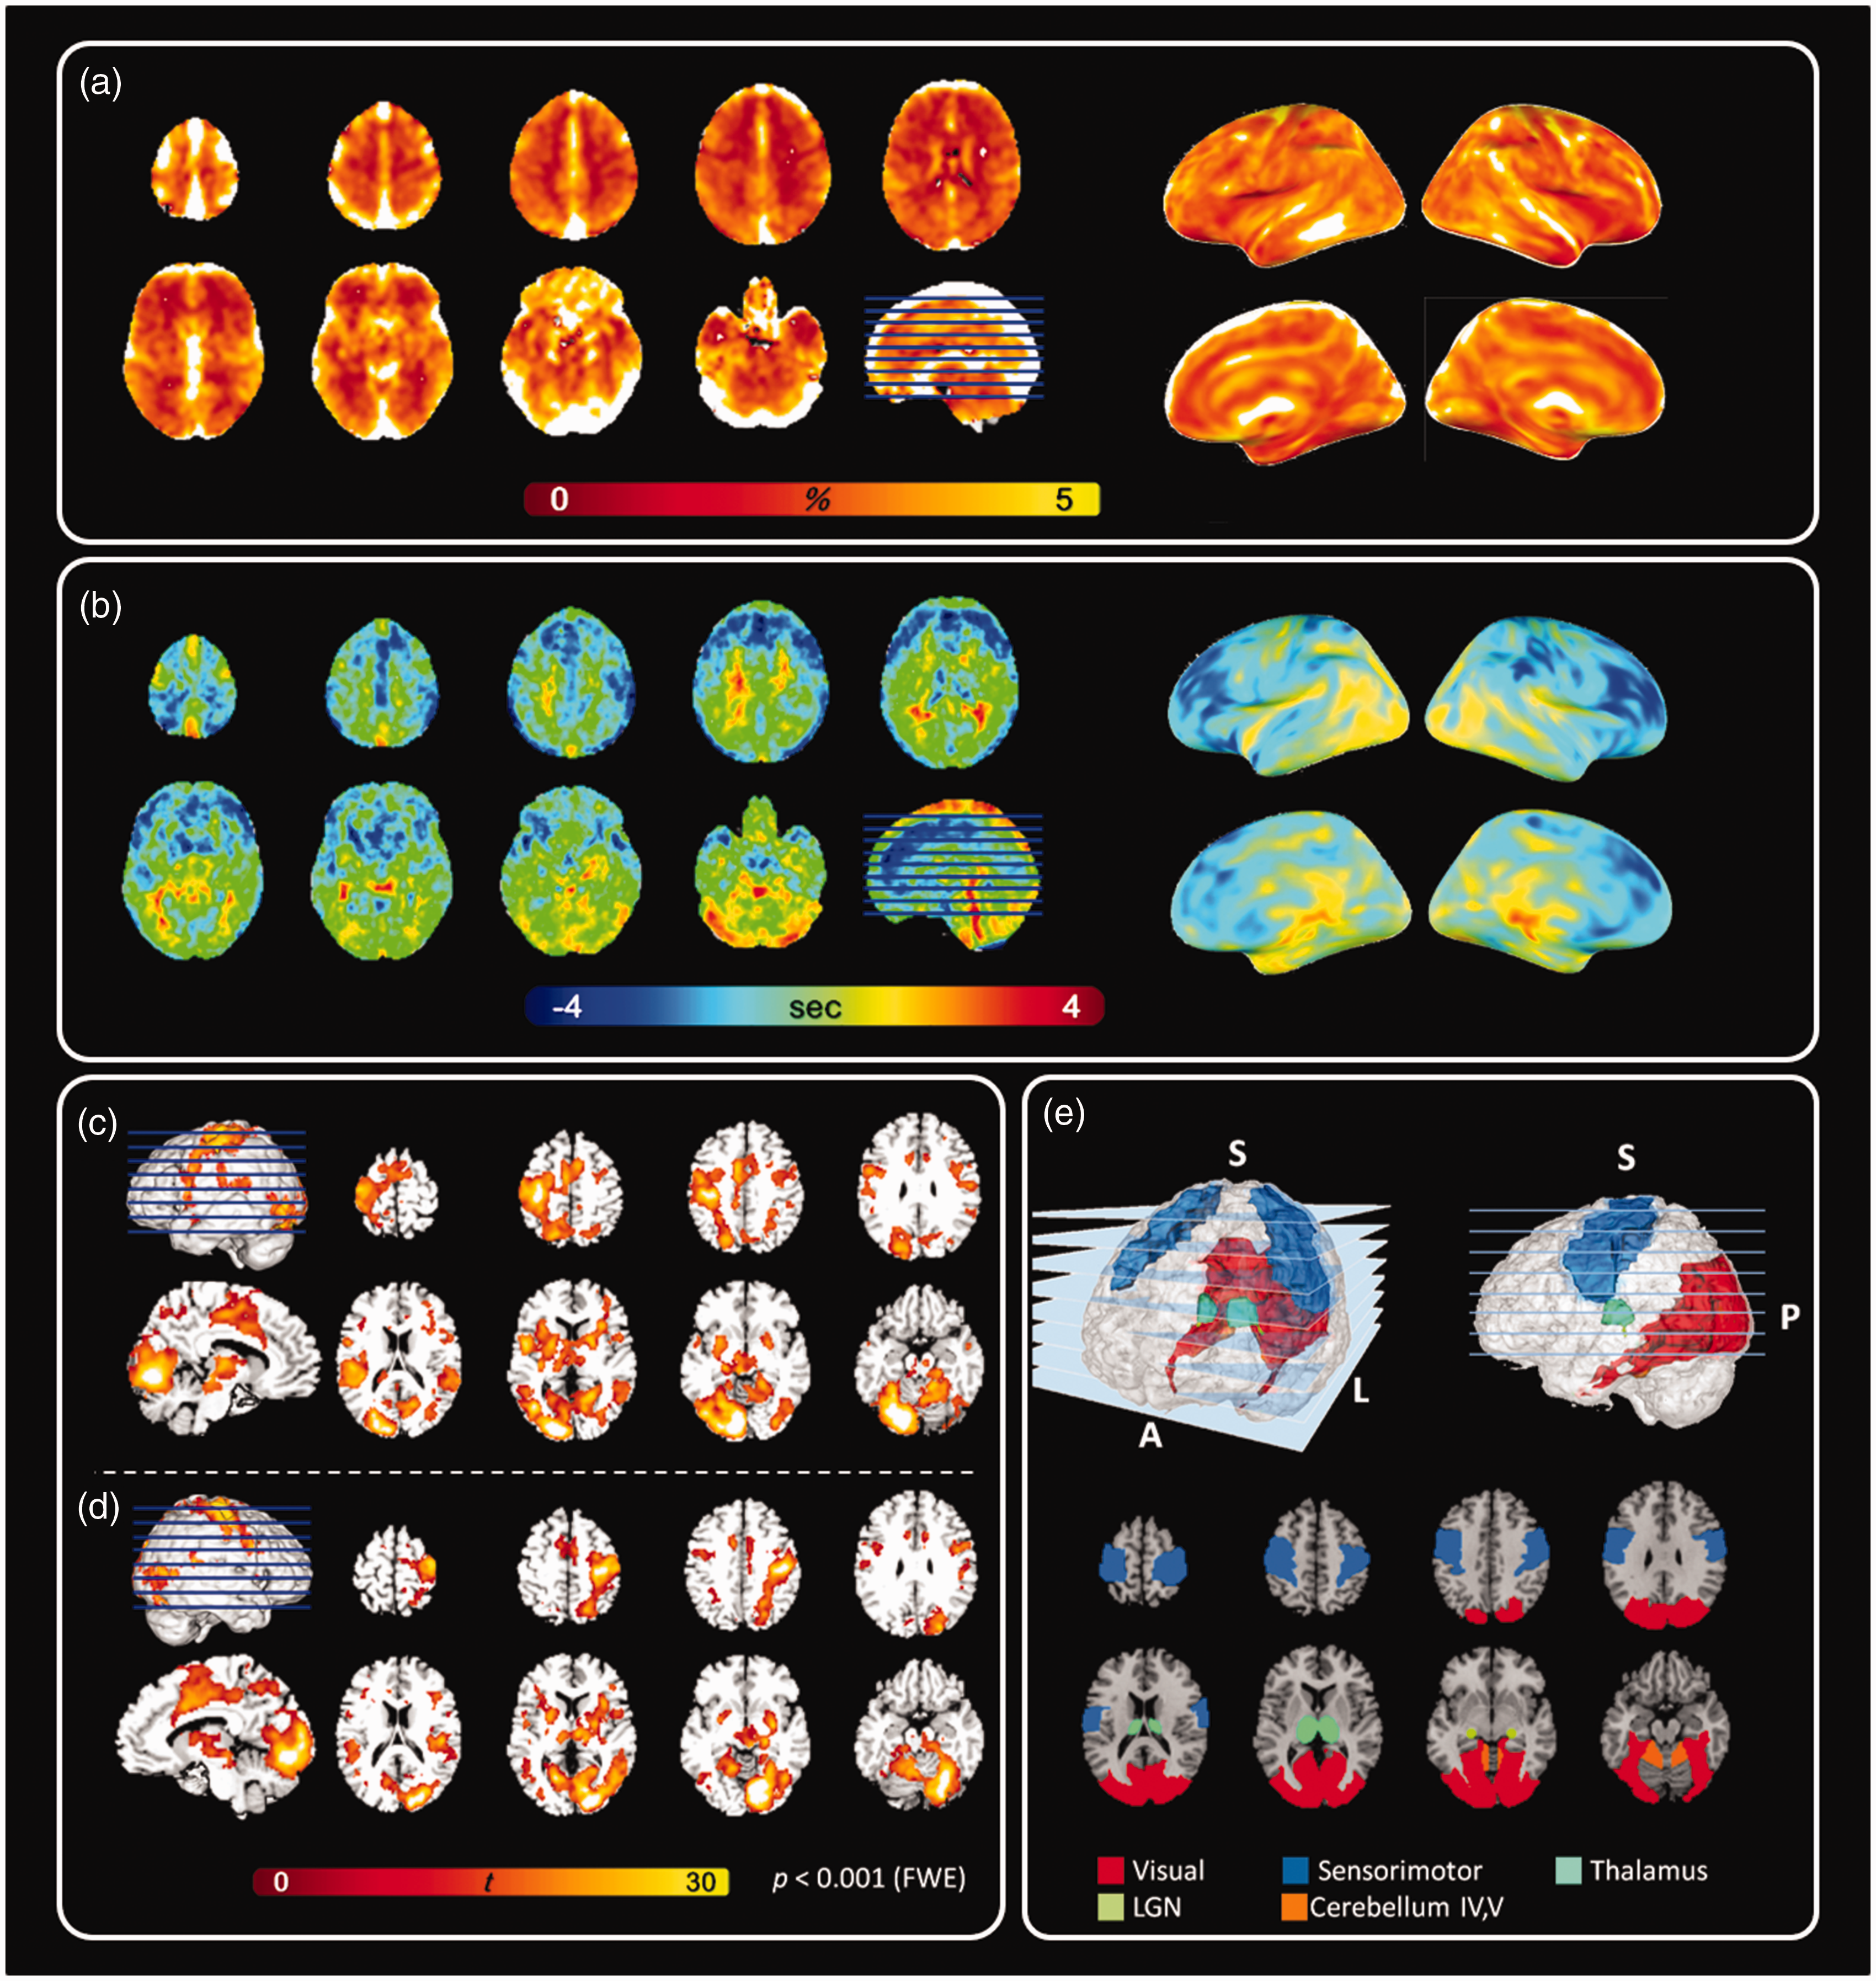
fMRI signals in the BH task and VM task. (a) The group-average fMRI signal in the BH task. (b) The fMRI signal latency maps estimated by the BH task. (c) Maps of significant fMRI signals elicited by the visual stimuli at the right hemifield with the response using the right hand. (d) Maps of significant fMRI signals elicited by the visual stimuli at the left hemifield with the response using the left hand and (e) region-of-interests (ROI) in this study. FWE: family-wise error.
We then measured the spatiotemporal patterns of the fMRI signals elicited by a VM task. The VM task elicited significant fMRI signals at the contralateral visual cortex, contralateral sensorimotor area, contralateral LGN, bilateral thalamus, and ipsilateral cerebellar lobules IV and V (Figure 1(c) and (d), Table S1, and Table S2). Figure 2 shows the distribution of the fMRI signal latency derived from the VM task before and after calibrating the CVR latency estimated by the BH task. Specifically, Figure 2(b) shows fMRI signal latency maps after calibrating the temporal shift between the reference time series for CVR using the BH task and the reference time series for visuomotor fMRI such that their latencies were temporally aligned. Before calibration, there was a trend that the fMRI signal in the visual cortex preceded that in the sensorimotor cortex (sensorimotor cortex latency minus visual cortex latency; right-hand response: 202 ± 387 ms, t = 0.85, p = 0.41; left-hand response: 212 ± 376 ms, t = 1.9, p = 0.08); however, this difference was not significant (Figure 2(c)). Moreover, the fMRI signal at the LGN did not significantly precede that at the visual cortex (Figure 2(c); visual cortex latency minus LGN latency; right-hemifield visual stimuli: −490 ± 592 ms, t = 0.65, p = 0.74; left-hemifield visual stimuli: −114 ± 629 ms, t = 2.98, p = 0.99). After subtracting the fMRI signal latency due to CVR, the group-average fMRI signal latency at the sensorimotor area was significantly later than that at the visual cortex (Figure 2(d); sensorimotor cortex latency minus visual cortex latency; left-hand response: 542 ± 195 ms, t = 10.0261, p < 0.001; right-hand response: 385 ± 235 ms, t = 5.8944, p < 0.001). Furthermore, the fMRI signal at the LGN significantly preceded that at the visual cortex (Figure 2(d); visual cortex latency minus LGN latency; right-hemifield visual stimuli: 453 ± 48 ms, t = 34.3204, p < 0.001; left-hemifield visual stimuli: 493 ± 50 ms, t = 35.4664, p < 0.001). Figure 2(e) and (f) shows the pairwise fMRI signal latency comparison between brain areas (defined by the activation peak regions in the VM task, Figure 1(c) and (d), Table S1, and Table S2) after calibrating the fMRI latency caused by CVR. The fMRI signal at the sensorimotor area was significantly delayed after that at the cerebral cortex, cerebellum, thalamus, and LGN (Figure 2(e) and (f)).
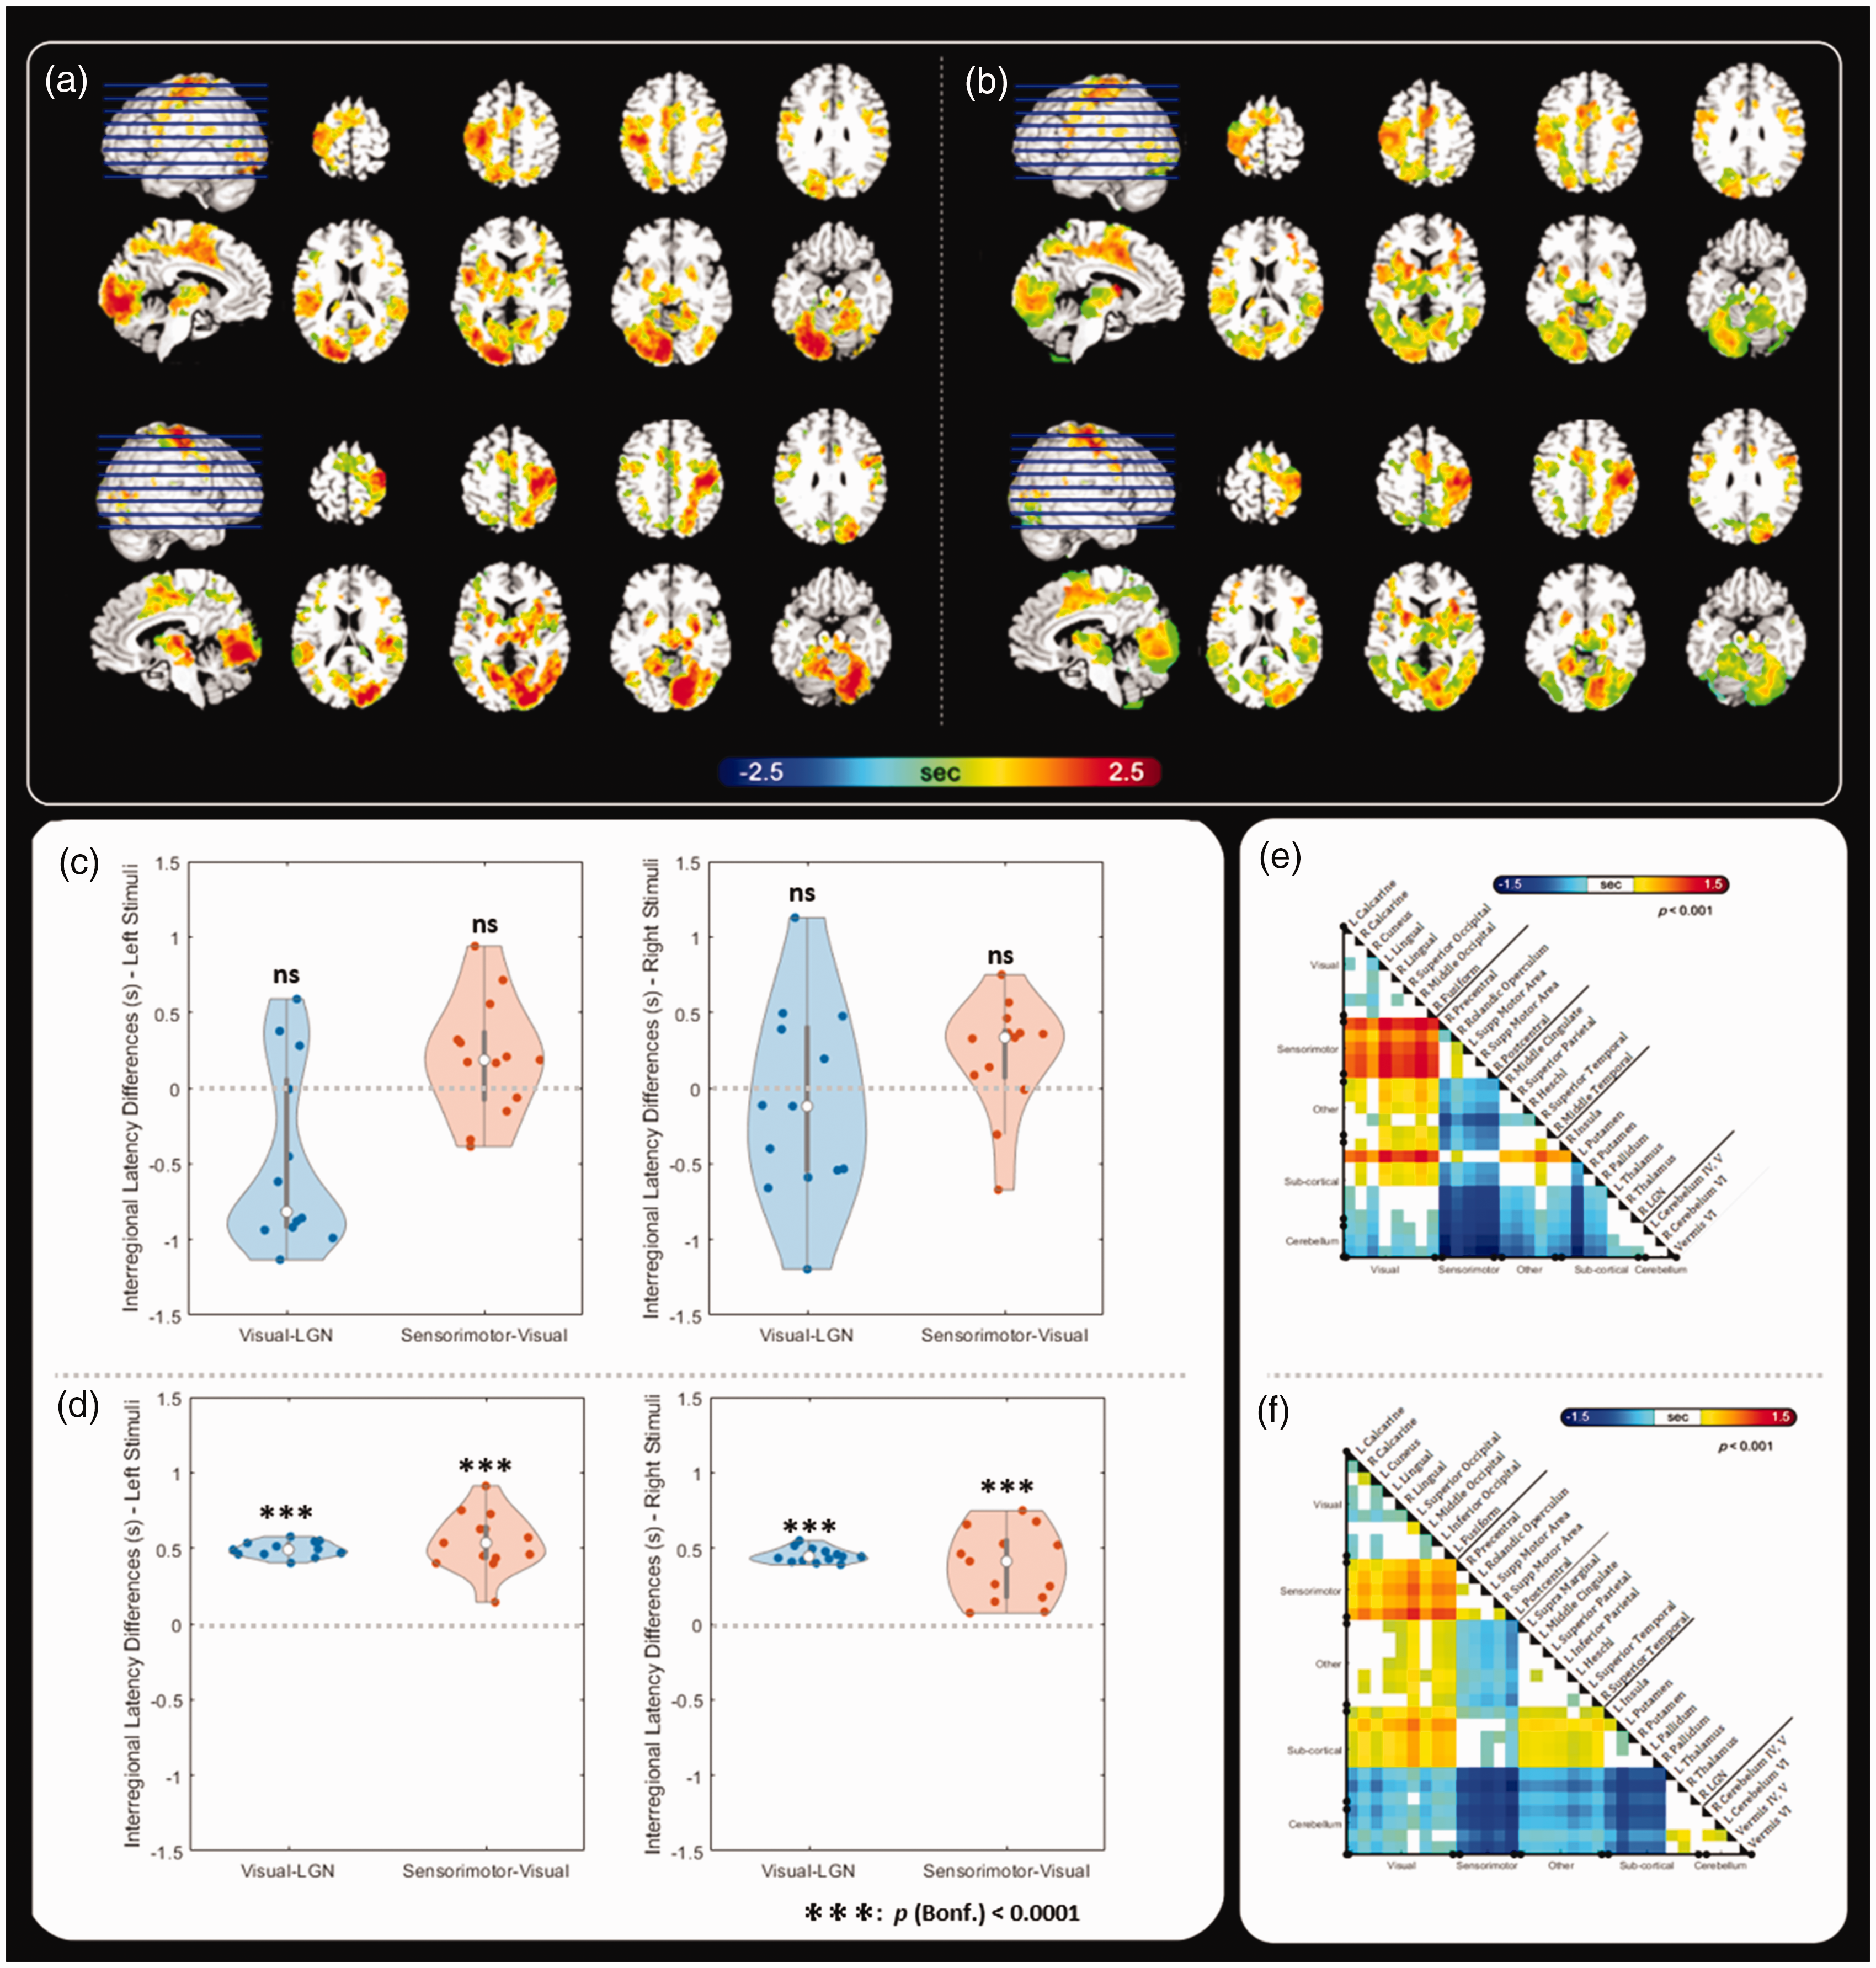
fMRI signal latency map and inter-regional fMRI signal latencies estimated from the VM task. (a) Maps of fMRI signal latency before calibrating the cerebral vascular reactivity by the BH task using right-hemifield (top) and left-hemifield (bottom) visual stimuli and right-hand (top) and left-hand (bottom) responses. (b) Maps of fMRI signal latency after calibrating the cerebral vascular reactivity by the BH task using right-hemifield (top) and left-hemifield (bottom) visual stimuli and right-hand (top) and left-hand (bottom) responses. (c) The inter-regional fMRI signal latency differences before calibrating the CVR contribution. (d) The inter-regional fMRI signal latency differences after calibrating the CVR contribution and (e and f) The regional fMRI signal latency differences in left-hemifield/left-hand (e) and right-hemifield/right-hand (f) conditions. Masked by p < 0.001.
We further examined the inter-regional fMRI signal latency within each individual. After calibrating the fMRI signal latency caused by CVR, the result showed that the fMRI signal at the sensorimotor area was significantly later than that at the visual cortex in 20 out of 26 measurements (2 conditions per participant, 13 participants; Figure 3(a)). The fMRI signal at the LGN was also found significantly earlier than that at the visual cortex in all 26 measurements (2 measurements per participant, 13 participants; Figure 3(b)).
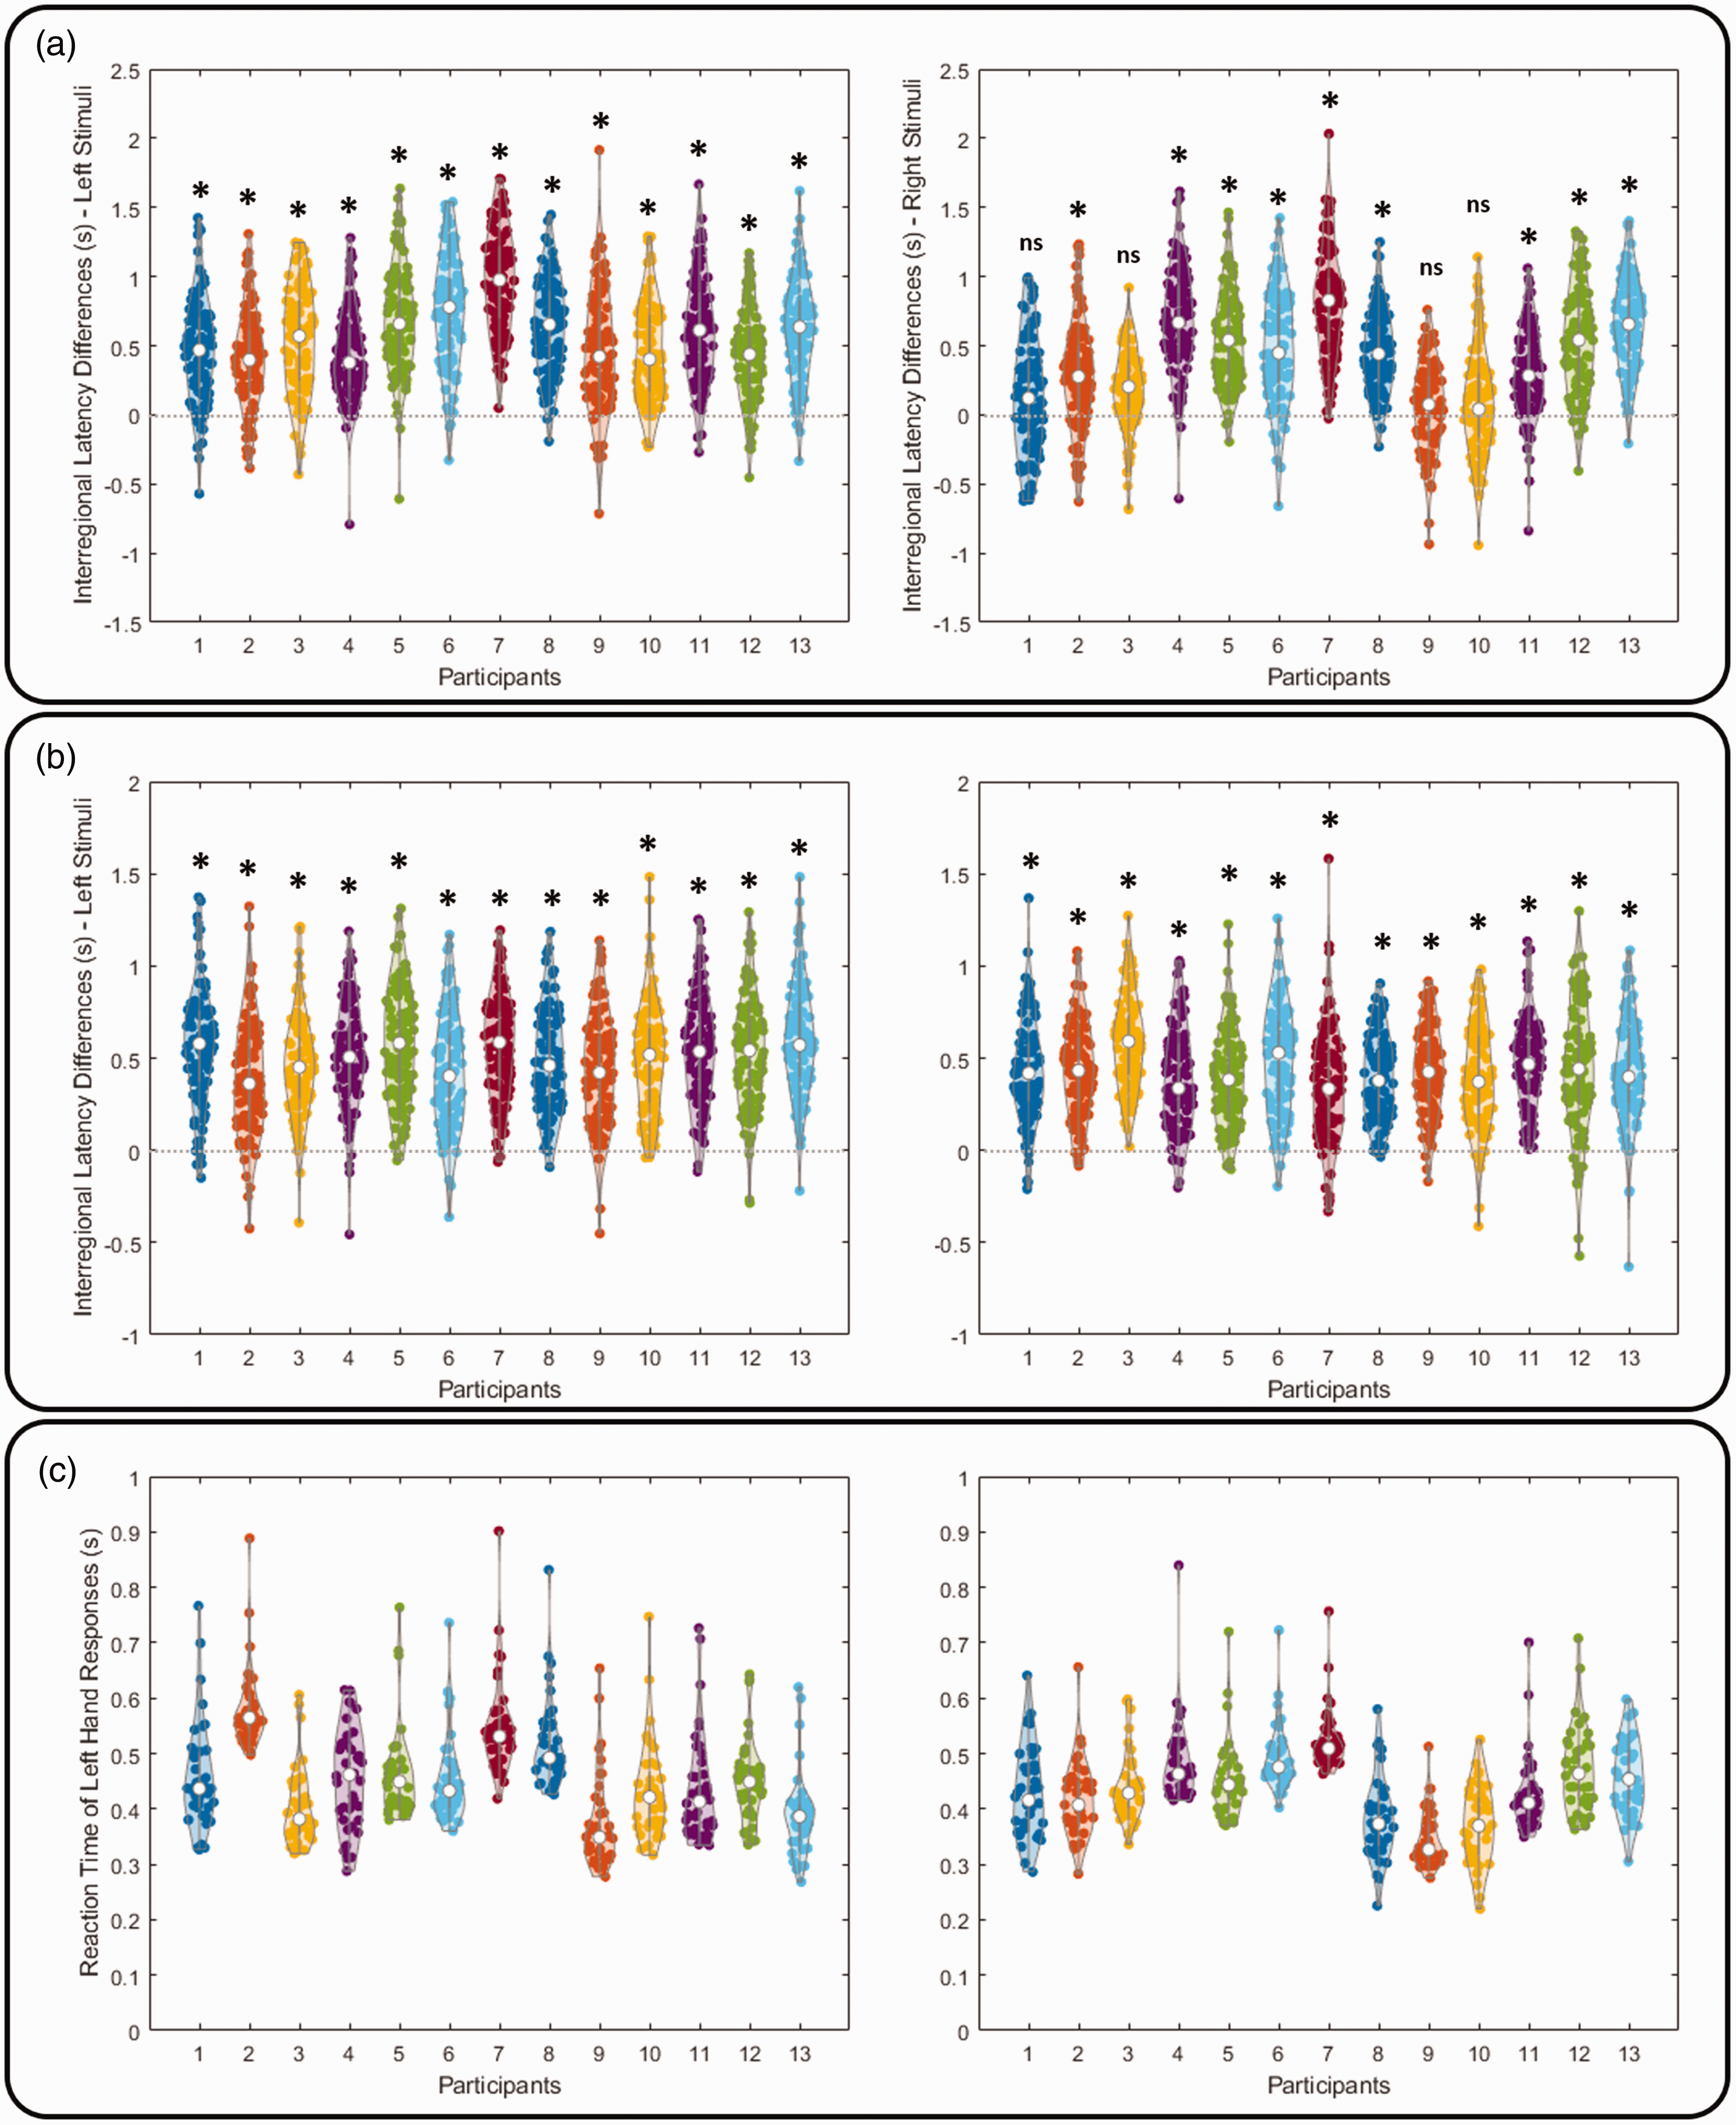
Within-participant inter-regional fMRI signal latency differences after calibrating the fMRI signal latency related to CVR and participants’ reaction time. (a) Inter-regional fMRI signal latency difference between sensorimotor and visual cortices. (b) Inter-regional fMRI signal latency difference between visual cortex and lateral geniculate nucleus and (c) reaction time. Significances were corrected for multiple comparisons using Bonferroni correction.
Correlating the inter-regional fMRI signal timing with the reaction time
In addition to examining the inter-regional fMRI timing difference to study if the order of the fMRI signal onsets matched the hypothesized feed-forward information processing, we also studied the correlation between the inter-regional fMRI timing difference and the RT (Figure 3(c); left-hand response: 443.59 ± 50.56 ms; right-hand response: 435.67 ± 50.67 ms). A significant brain-behavior timing correlation after suppressing the contribution to the regional fMRI signal latency estimates due to CVR: The inter-regional group-average fMRI latency difference between the ipsilateral thalamus and the sensorimotor cortex, between the visual cortex and the sensorimotor cortex, and between the contralateral cerebellar lobules IV, V and the sensorimotor cortex all significantly correlated with the RT (Figure 4(a) to (c)). These correlations were insignificant before calibrating the fMRI latency confounded by the CVR (Figure S1).
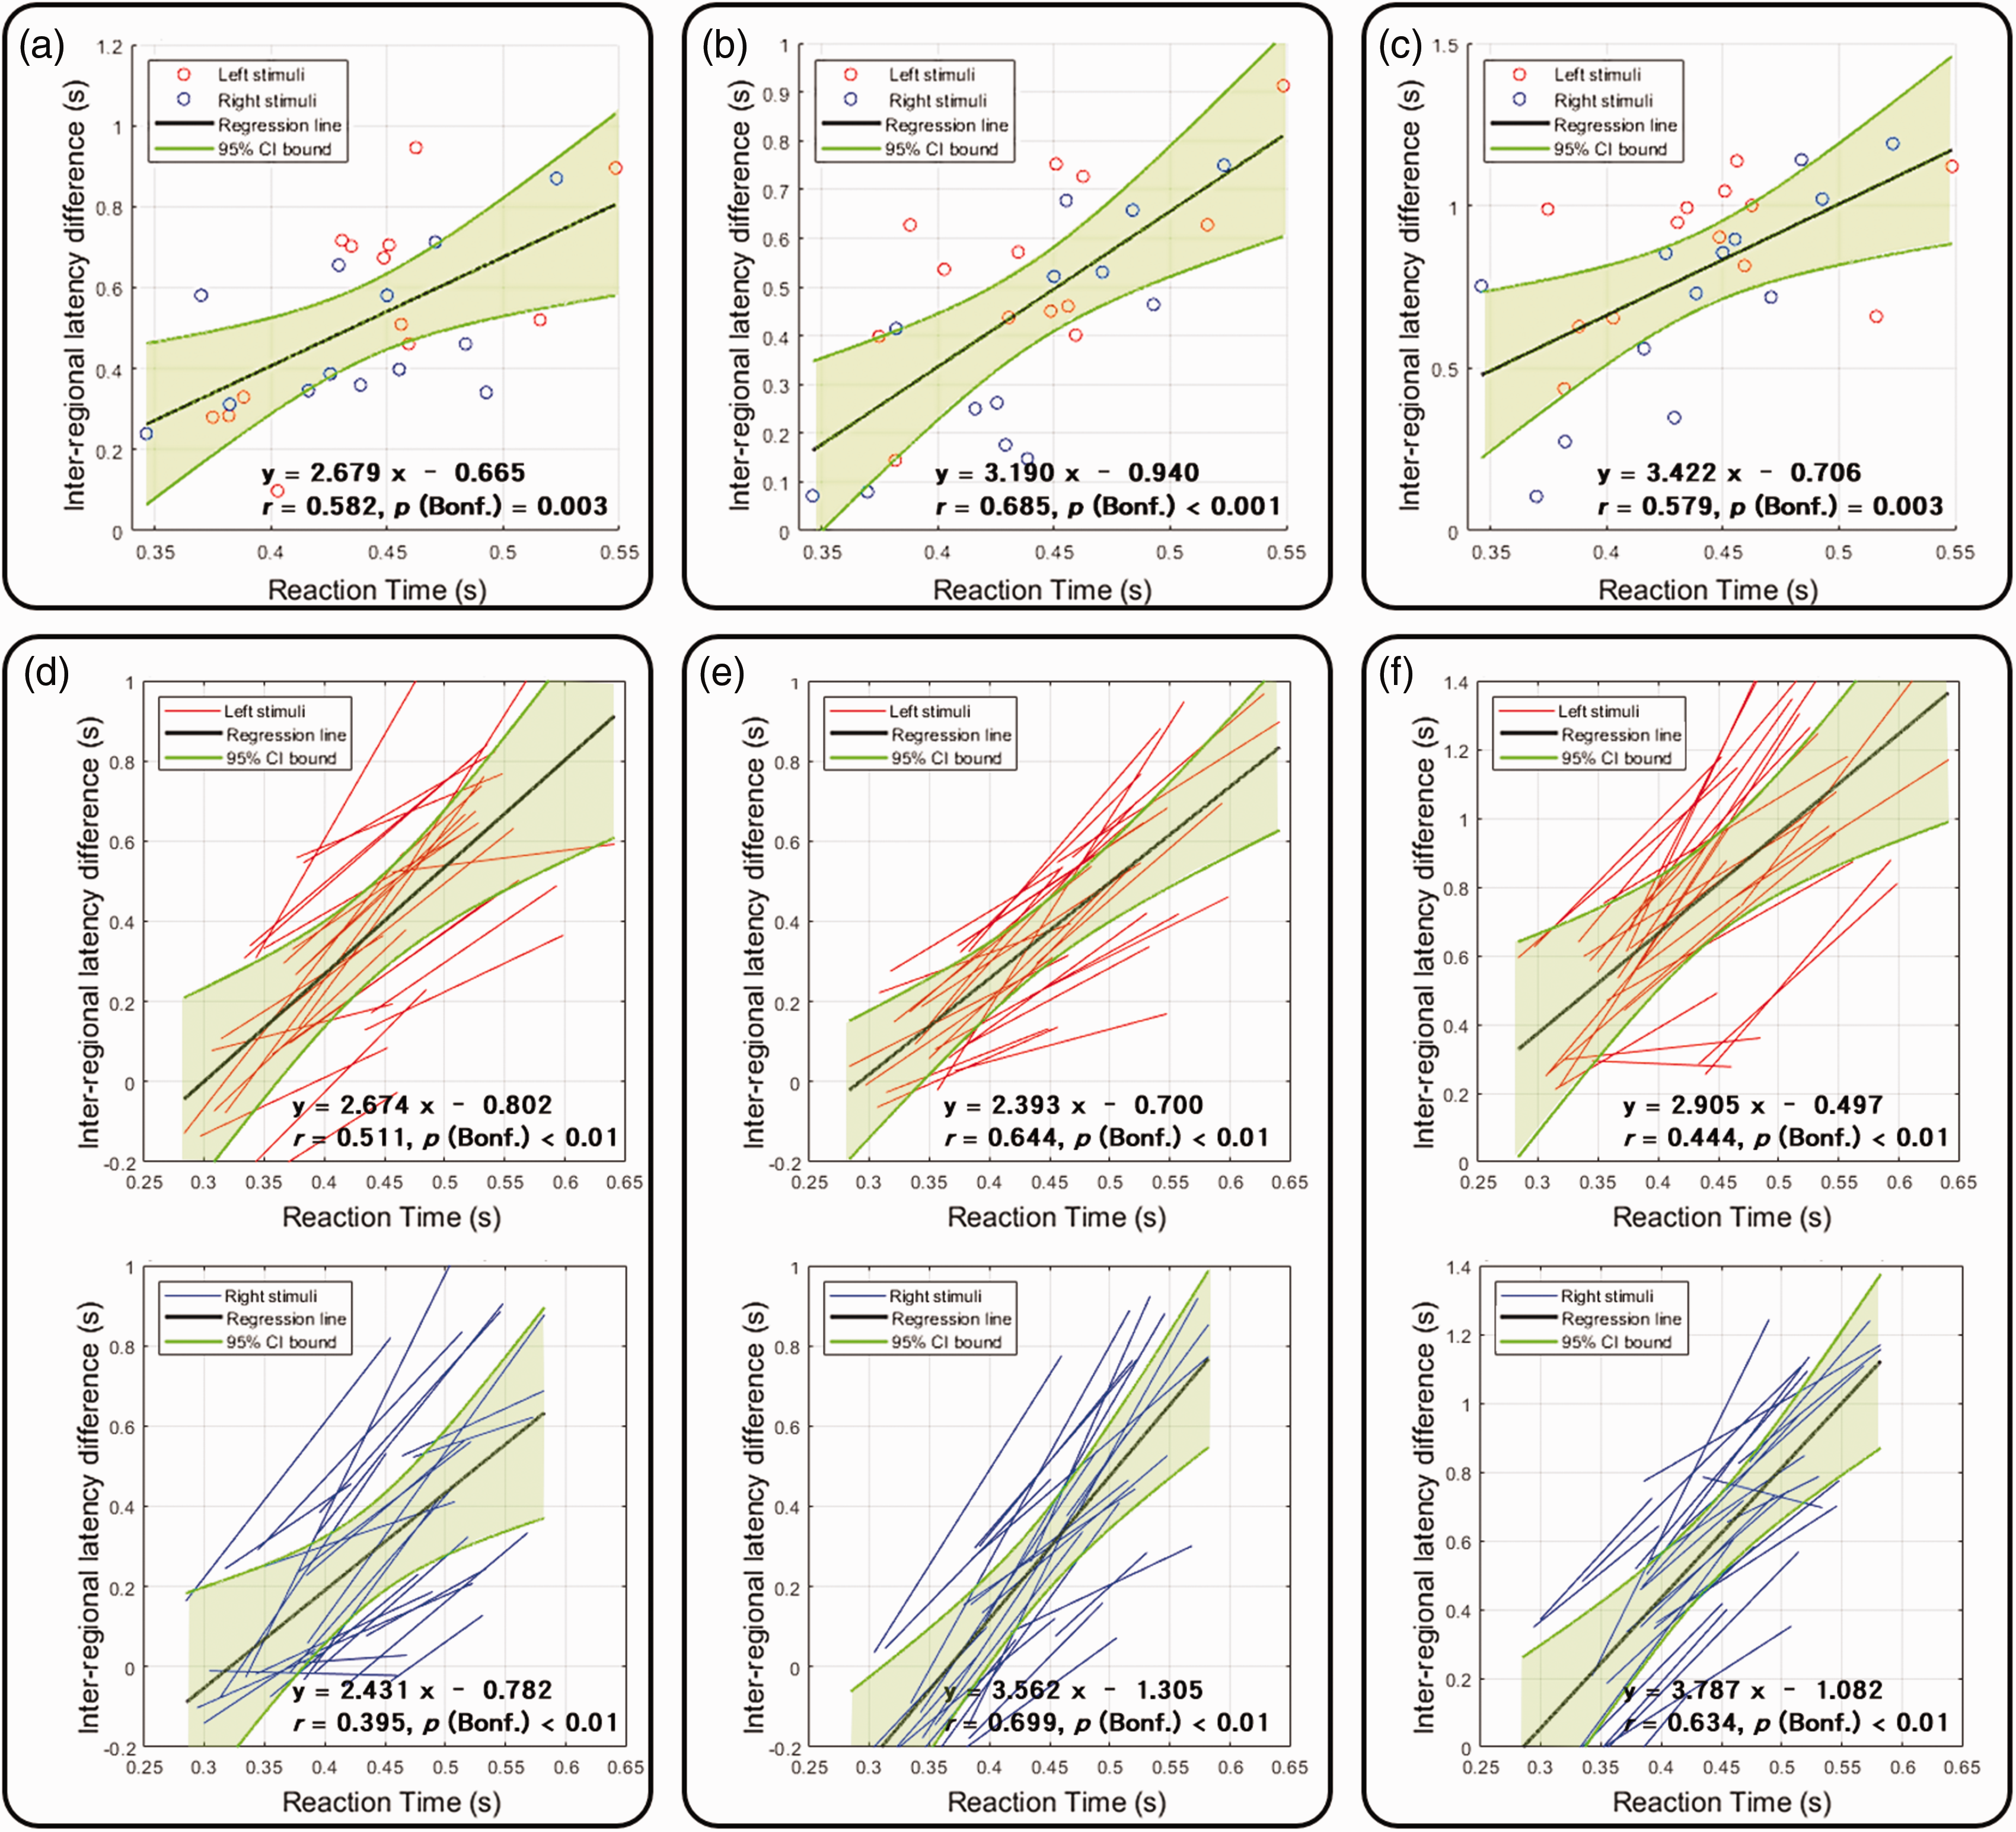
The relationships between the reaction time and the inter-regional fMRI signal latency after calibrating the CVR contribution. (a, b, and c) Scattered plots of reaction time and inter-regional fMRI signal latency differences between the sensorimotor cortex and ipsilateral thalamus (a), sensorimotor and visual cortices (b), and sensorimotor cortex and contralateral cerebellar lobules IV, V and sensorimotor cortex (c) after CVR calibration. Each color dot represents the measurement from one participant condition (between-subject correlation). (d, e, and f) Linear regressions between the reaction time and inter-regional fMRI signal latency between the sensorimotor cortex and ipsilateral thalamus (d), sensorimotor and visual cortices (e), and sensorimotor cortex and contralateral cerebellar lobules IV, V and sensorimotor cortex (f) after CVR calibration in the left hemifield/left hand (top) and right hemifield/right hand (bottom) conditions. Each color line represents one participant's condition. The black line represents the average across participant conditions (within-subject correlation). Confidence intervals of the regression analysis are shown in shaded green regions. Significances were corrected for multiple comparisons using Bonferroni correction.
The brain-behavior timing correlation was also studied within each individual. The fMRI signal latency difference between the visual and sensorimotor cortices was significantly correlated with the task RT after subtracting the fMRI signal latency in all 26 measurements (Figure 4(e)). A significant correlation between an individual’s RT and the inter-regional fMRI latency difference between the ipsilateral thalamus and sensorimotor cortex was found in 24 out of 26 measurements (Figure 4(d)). The inter-regional fMRI signal latency between the contralateral cerebellar lobules IV, V, and the sensorimotor cortex was found significant in 22 out of 26 measurements (Figure 4(f)). These correlations were insignificant before calibrating the fMRI latency, likely due to the CVR.
Discussion
The advancement of fMRI acquisition allows for sampling the whole-brain fMRI signals in a fraction of a second. With the improved data sampling rate, whether the fMRI signal can disclose neuronally relevant timing information remains elusive. In this study, we used a hypercapnic challenge (a BH task) to measure and correct the hemodynamic latency caused by vascular reactivity in search for the inter-regional fMRI timing differences between brain areas that were in the range of hundreds of milliseconds and correlated with behaviors. We found that the fMRI signal at the LGN significantly preceded that at the visual cortex by 496 ms, followed by the fMRI signal at the sensorimotor cortex lagging behind the visual cortex by 464 ms (Figure 2). This order of fMRI signal activity was consistent in 20 out of 26 individual measurements. The inter-regional fMRI timing difference, after calibrating the latency related to CVR, was found to significantly correlate with the RT in individual and group analyses (Figure 4). In brief, we experimentally demonstrated that the fMRI signal has sub-second timing information matched to hypothesized feed-forward neural activity across brain regions and correlated with behaviors.
Estimating the direction of information flow between brain areas using fMRI signal onsets is confounded by the contribution of vascular effects. Different from a model-based method without calibrating CVR effects, 43 we used a data-driven correlational approach to estimate the fMRI signal latency due to CVR. In individual CVR-calibrated VM latency map (Figure 2), image pixels had both positive and negative values. This is due to the fact that the reference time was the difference between the visual stimulus onset and the BH reference time series. The bias caused by this reference time disappeared in the calculation of inter-regional latency difference, because the reference time was identical within each participant. Thus, the correlation between RT and CVR calibrated inter-regional fMRI VM latency was not affected by the reference time. After CVR calibration, we found significant inter-regional fMRI signal timing differences at LGN, the visual cortex (Figure 2(c) and Figure 3(a)), and the sensorimotor cortex (Figures 2(d) and 3(b)). These results suggested that the brain activity at the LGN preceded that at the visual cortex, followed by the activity at the sensorimotor cortex. This inference was consistent with the expected feed-forward information flow in a rather simple VM task. Thus, our results suggested the feasibility of using regional fMRI latency differences in the range of a few hundred milliseconds (Figure 2(e) and (f)) to infer the sequence of brain activity in the cortex, cerebellum, and deep brain regions (Table S1 and Table S2). Our findings suggested the possibility of combining fast fMRI and CVR calibration to complement electroencephalography (EEG) and magnetoencephalography (MEG) in detecting the brain activity timing beyond the superficial cortex.
Our previous study reported that the inter-regional fMRI signal latency in the range of a few hundred milliseconds suggested the order of brain activity matched the hypothesized feed-forward stimulus-response relationship. 30 Furthermore, the regional fMRI signal latency was correlated with the local oscillatory neuronal responses. 30 The vascular bias was suppressed by averaging across participants and brain regions. In the present study, we used a more straightforward approach to calibrate the vascular confound: using a BH task to estimate local fMRI signal latency and subtracting that from the fMRI signal latency in a task of our interest. This approach led to a significant correlation between the regional fMRI signal latency difference in both group (Figure 4(a) to (c)) and individual (Figure 4(d) to (f)) analyses.
Inter-regional differences in the neurovascular coupling as large as a few seconds have been reported in several studies.44,45 Our result corroborated these studies about the spatial variability of the fMRI signal latency (Figure 1(b) and Figure 2(a) and (b)). The fMRI signal strength and latency (Figure 1) were consistent with a previous study: 16 Strong fMRI signal changes were observed across the whole brain. The most delayed responses were found in the deep white matter and the posterior part of the brain adjacent to the large veins, such as the superior sagittal sinus. Note that after calibrating the fMRI signal latency due to CVR, the inter-regional fMRI signal timing differences were still larger than RT (regression slope significantly larger than 1; Figure 4). This was consistent with previous studies30,46,47 and can be potentially explained by the low-pass filtering 48 and the nonlinear natures of the neurovascular coupling. 49
The fMRI signal latency can be calibrated by the group-average CVR latency. 16 However, the venous vasculature varied across individuals. This inter-subject vasculature variability may lead to participant-dependent distributions of the CVR and fMRI signal latency. Here we used the individual’s CVR map to calibrate the inter-regional fMRI signal timing. We compared the results with the calibration using individual or group-average CVR latency. The correlation between RT and the inter-regional fMRI timing difference was less pronounced and even not significant when using the group-average CVR (Figure S2), even though significant inter-regional fMRI timing differences (LGN before visual cortex and visual before sensorimotor cortices) were still present. Thus, we considered that the individual CVR map had a higher specificity than the group-averaged CVR map.
In a previous study, 16 the latency map was estimated from the fMRI time series using echo-planar imaging (EPI) with a 2-s sampling rate. The fMRI time series were up-sampled to the 100-ms temporal resolution using Fourier interpolation before the latency map estimation. However, even with up-sampling, the 2-s sampling rate can be too slow to precisely capture fine temporal features because of the band-limited interpolation. We previously used fast fMRI measurements 28,34 with a high sampling rate (10 Hz) to map the hemodynamic latency and latency variability of the evoked BOLD signal. 50 The result suggested that the latency and variability of regional BOLD signals measured with a high temporal resolution can be useful in detecting regional differences in fMRI signals. 50 To explicitly test whether a high temporal resolution acquisition is beneficial in estimating the fMRI signal latency, we also collected the BH task data from the same participants using EPI with a sampling rate of 2-s. These EPI data were further up-sampled to 100 ms before the latency map estimation. Figure S3 shows a significant positive correlation (r = 0.567, p < 0.0001) between the CVR latencies estimated by fast fMRI and EPI across the whole brain. However, the slope of the regression line was significantly smaller than 1 (R2 = 0.321, slope = 0.427 +/− 0.004, t = 96.381, p < 0.001). The range of the estimated fMRI latencies by fast fMRI was significantly wider than that from the up-sampled EPI (σSMS-InI = 1.008, σEPI = 0.771, F = 1.712, p < 0.0001). This suggested that the fMRI signal latency mapped by fast fMRI acquisitions has a higher sensitivity than by EPI. The likely causes were (1) fast fMRI had a higher temporal resolution than EPI and (2) fast fMRI had a smaller flip angle (30°) than EPI (90°). The flip angle affected the inflow sensitivity, which can be translated to the improved localization of the neural activity51 –53 and accuracy of the fMRI signal timing. 53
Interestingly, using temporally up-sampled EPI for CVR calibration still found the significant inter-regional fMRI timing differences (LGN activation preceded the visual cortex, and the visual cortex preceded the sensorimotor cortex) matched to the hypothesized order of brain activity. However, the correlation between the RT and the inter-regional BOLD timing difference was no longer significant (Figure S4). This suggested that the latencies mapped by fast fMRI had a higher specificity than those mapped by the temporally up-sampled EPI.
Our present study used the BH task to estimate CVR. Controlling the air intake with a precise mixture of gases via a mask may give more accurate estimates of CVR and the associated fMRI signal latency. 54 This procedure comes at the price of a more dedicated experimental setup. The inter-regional fMRI signal timing was found to correlate with behaviors. However, we did not study the relationship between fMRI timing and neuronal activity. Future studies on the neurovascular coupling with either concurrent EEG-MRI or separate invasive recording and fMRI may bridge this gap if the contribution of CVR in fMRI signals is characterized.
We used a BH task to estimate the vascular contribution to the fMRI signal latency, which was then subtracted from the regional fMRI signal latency in order to improve the sensitivity and specificity of inferring the neural activity timing using fMRI signals. Specifically, using a VM task, we only identified a significant correlation between the difference of regional fMRI signal latency and the RT in both between- and within-participant analyses after calibrating the BOLD latency related to CVR. These results also demonstrated the feasibility that fMRI sampled at the 10-Hz rate after CVR calibration can disclose the order of brain regions subserving a task with timing differences between regions in the range of hundreds of milliseconds. This method can complement other high-temporal resolution neuroimaging techniques, including EEG and MEG, to measure neural dynamics across the whole brain without being limited to the cortex because of the homogeneous sensitivity of fMRI.
Supplemental Material
sj-pdf-1-jcb-10.1177_0271678X241241136 - Supplemental material for Functional magnetic resonance imaging signal has sub-second temporal accuracy
Supplemental material, sj-pdf-1-jcb-10.1177_0271678X241241136 for Functional magnetic resonance imaging signal has sub-second temporal accuracy by Yi-Tien Li, Hsin-Ju Lee and Fa-Hsuan Lin in Journal of Cerebral Blood Flow & Metabolism
Footnotes
Funding
The author(s) disclosed receipt of the following financial support for the research, authorship, and/or publication of this article: This work was supported by the Natural Sciences and Engineering Research Council of Canada [grant number RGPIN-2020-05927]; Canada Foundation for Innovation [grant numbers 38913 and 41351]; Canadian Institutes of Health Research [grant number PJT 178345 and PJT 496433]; MITACS [grant number IT25405].
Declaration of conflicting interests
The author(s) declared no potential conflicts of interest with respect to the research, authorship, and/or publication of this article.
Authors’ contributions
Yi-Tien Li: data collection, data analysis, manuscript writing. Hsin-Ju Lee: data analysis, manuscript writing. Fa-Hsuan Lin: experiment design. data analysis, manuscript writing.
Supplementary material
Supplemental material for this article is available online.
References
Supplementary Material
Please find the following supplemental material available below.
For Open Access articles published under a Creative Commons License, all supplemental material carries the same license as the article it is associated with.
For non-Open Access articles published, all supplemental material carries a non-exclusive license, and permission requests for re-use of supplemental material or any part of supplemental material shall be sent directly to the copyright owner as specified in the copyright notice associated with the article.