
Abstract
Cerebral microinfarcts (CMIs), a novel cerebrovascular marker, are prevalent in Alzheimer’s disease (AD) and associated with cognitive impairment. Nonetheless, the underlying mechanism of how CMIs influence cognition remains uncertain. We hypothesized that cortical-CMIs disrupted structural connectivity in the higher-order cognitive networks, leading to cognitive impairment. We analyzed diffusion-MRI data of 92 AD (26 with cortical-CMIs) and 110 cognitive impairment no dementia patients (CIND, 28 with cortical-CMIs). We compared structural network topology between groups with and without cortical-CMIs in AD/CIND, and tested whether structural connectivity mediated the association between cortical-CMIs and cognition. Cortical-CMIs correlated with impaired structural network topology (i.e. lower efficiency/degree centrality in the executive control/dorsal attention networks in CIND, and lower clustering coefficient in the default mode/dorsal attention networks in AD), which mediated the association of cortical-CMIs with visuoconstruction dysfunction. Our findings provide the first in vivo human evidence that cortical-CMIs impair cognition in elderly via disrupting structural connectivity.
Keywords
Introduction
Cerebral microinfarcts (CMIs) are a novel magnetic resonance imaging (MRI) marker of cerebrovascular disease (CeVD), which are associated with cognitive impairment, 1 and prevalent in Alzheimer’s disease (AD) (43%) (against 24% in healthy elderly) based on neuropathological examinations. 2 Recently, cortical-CMIs have been detected in vivo using 3T MRI and shown associations with cognitive dysfunction especially in the domains of visuoconstruction and language. 3 However, the underlying mechanisms of how CMIs lead to impaired cognition remain largely unknown. Animal studies have found that cortical-CMIs induced white matter impairments, neuronal loss,4–6 and decreased neuronal response in cortical areas even beyond the cortical-CMIs loci. 7 Based on these findings, we hypothesized that CMIs may affect cognition via disrupting human-brain white matter pathways, i.e. structural connectivity derived from diffusion MRI. 8 Combining with graph theoretical modeling, 9 diffusion MRI-based white matter fiber tracking provides a unique way of testing brain structural network topological properties. Indeed, AD patients had altered structural network topology, relating to worse cognition. 10
However, there have been no studies in living humans investigating whether and how cortical-CMIs influence topological features of brain structural networks in the AD spectrum. Hence, using graph theoretical modeling, we aimed to compare structural network topology between cognitively impaired patients with and without cortical-CMIs. Given the association between cortical-CMIs and impaired performance in visuoconstruction and language, 3 we hypothesized that patients with cortical-CMIs would show disrupted structural network topology in the higher-order cognitive networks in both pre-dementia and dementia stages. We also planned to control for individual cerebrovascular burden and matching multiple cerebrovascular markers between groups to isolate the effect of cortical-CMIs. Furthermore, we tested the hypothesis that structural network topological changes exert a mediation effect on the association between cortical-CMIs and cognition.
Material and methods
Participants
The present study included 114 AD patients (36 with cortical-CMIs) and 114 patients with cognitive impairment no dementia (CIND, 30 with cortical-CMIs) recruited from memory clinics in the National University Hospital and Saint Luke’s Hospital in Singapore, and 22 HC without cortical-CMIs and significant cerebrovascular disease (CeVD) from memory clinics/community, from an ongoing project as of October 2017. As described previously, 11 diagnoses were made at weekly consensus meetings involving neurologists, psychologists, and research personnel, based on clinical observation, neuroimaging scans (CT/MRI), and laboratory tests. Diagnosis of Alzheimer’s disease (AD) was in accordance with the criteria of National Institute of Neurological and Communicative Diseases and Stroke-Alzheimer’s Disease and Related Disorders Association (NINCDS-ADRDA). 1 Cognitive impairment no dementia (CIND) patients had objective impairment in at least one cognitive domain based on the neuropsychological assessment battery but remained functionally independent and were not demented. No CSF/PET tau and amyloid data were available. Following a previously validated approach with good interrater reliability (k = 0.83), cortical-CMIs were visually identified on 3T MRI images while being blinded to diagnosis, featuring hypointense on T1-weighted image, hypo- or isointense on T2-weighted and fluid attenuation inversion recovery (FLAIR) images, < 5mm in diameter, and perpendicular to cortical surface.3,12 We did not consider subcortical-CMIs due to insufficient detection specificity using 3T MRI. Participants’ exclusion criteria are described in the supplement.
Demographic and neuropsychological features of participants.
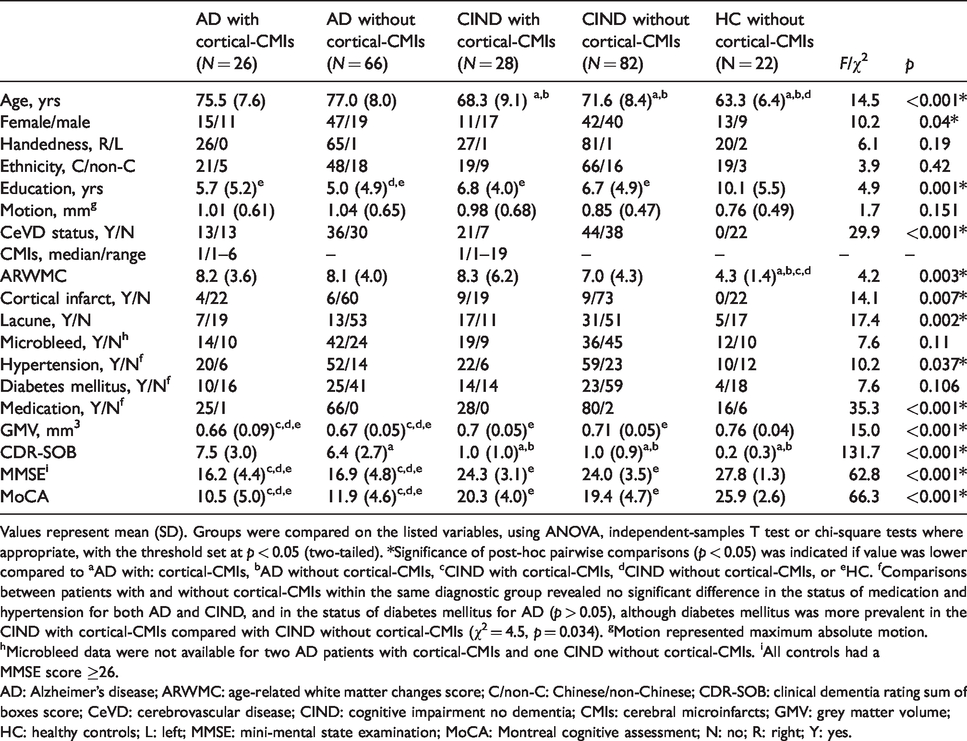
Values represent mean (SD). Groups were compared on the listed variables, using ANOVA, independent-samples T test or chi-square tests where appropriate, with the threshold set at p < 0.05 (two-tailed). *Significance of post-hoc pairwise comparisons (p < 0.05) was indicated if value was lower compared to aAD with: cortical-CMIs, bAD without cortical-CMIs, cCIND with cortical-CMIs, dCIND without cortical-CMIs, or eHC. fComparisons between patients with and without cortical-CMIs within the same diagnostic group revealed no significant difference in the status of medication and hypertension for both AD and CIND, and in the status of diabetes mellitus for AD (p > 0.05), although diabetes mellitus was more prevalent in the CIND with cortical-CMIs compared with CIND without cortical-CMIs (χ2 = 4.5, p = 0.034). gMotion represented maximum absolute motion. hMicrobleed data were not available for two AD patients with cortical-CMIs and one CIND without cortical-CMIs. iAll controls had a MMSE score ≥26.
AD: Alzheimer’s disease; ARWMC: age-related white matter changes score; C/non-C: Chinese/non-Chinese; CDR-SOB: clinical dementia rating sum of boxes score; CeVD: cerebrovascular disease; CIND: cognitive impairment no dementia; CMIs: cerebral microinfarcts; GMV: grey matter volume; HC: healthy controls; L: left; MMSE: mini-mental state examination; MoCA: Montreal cognitive assessment; N: no; R: right; Y: yes.
The current study was approved by the National Healthcare Group Domain-Specific Review Board and the SingHealth Institutional Review Board, in line with the Declaration of Helsinki. Written informed consents were obtained from all the participants.
Neuropsychological assessments
The Mini-Mental State Examination, Montreal Cognitive Assessment and Clinical Dementia Rating were administered to all participants by trained psychologists/clinicians. Moreover, an organized neuropsychological assessment battery, validated in Singaporean elderly, was performed, 12 including verbal and visual memory, attention, executive function, language, visuomotor speed, and visuoconstruction. Standardized domain scores were calculated following previous publication. 13
Image acquisition
MRI data were obtained using a 3T Siemens Magnetom Tim Trio scanner, equipped with a 32-channel head coil at the Clinical Imaging Research Centre of National University of Singapore. A whole-brain T1-weighted structural image was collected using magnetization prepared rapid gradient recalled echo (MPRAGE) sequence (192 slices in the sagittal plane, TR/TE/TI = 2300/1.9/900 ms, flip angle = 9°, slice thickness = 1 mm, voxel size = 1 × 1 × 1 mm3, FOV = 256 × 256 mm2). Diffusion-weighted MRI was obtained with a single-shot fast-spin echo planar image sequence (48 axial slices, TR/TE = 6800/85 ms, voxel size = 3 × 3 × 3 mm3, b value = 1150 s/mm2, 61 diffusion directions, 7 b0 maps, FOV = 256 × 256 mm2). Also, the scanning protocol included a T2-weighted image (48 axial slices, voxel size = 1 × 1 × 3 mm3, TR/TE = 2600/99 ms, flip angle = 150°, FOV = 232 × 256 mm2), a FLAIR image (48 axial slices, voxel size = 1 × 1 × 3 mm3, TR/TE/TI = 9000/82/2500 ms, flip angle = 180°, FOV = 232 × 256 mm2), and a susceptibility weighted image (128 axial slices, voxel size = 1 × 1 × 1.5 mm3, TR/TE = 27/20 ms, flip angle = 15°, FOV = 192 × 256 mm2).
Image processing
Pre-processing
DTI data were pre-processed using the FMRIB Software Library (FSL v5) as described previously. 14 Briefly, the DTI pre-processing steps included: (1) correcting for eddy current distortion and head movement via registering each diffusion volume to a model free prediction calculated based on how eddy current-induced field behaved differently with the presence of movement; 15 (2) rotating diffusion gradients to adapt to movement; and (3) obtaining fractional anisotropy (FA) images by fitting a diffusion tensor model to the diffusion data at the voxel level (DTIFIT). To ensure good data quality, we visually inspected individual’s maps for signal dropout, artifacts, and additional motion. We also calculated root mean square to summarize motion-induced displacement, and participants with maximum displacement > 3 mm (vs. the first b = 0 volume) were excluded.
Pre-processing for the structural image consisted of (1) reducing image noise via nonlinear filtering (SUSAN), 16 (2) skull stripping using the Brain Extraction Tool, 17 and (3) registering T1 image to the standard MNI space (ICBM152 T1 template) using both FLIRT 18 and FNIRT 19 methods.
To prepare for probabilistic fiber tracking as described in the next section, transformations were calculated between the diffusion space, T1 space, and standard MNI space. The pre-processed diffusion image was co-registered to the structural image using Boundary-Based Registration. 20
Structural network construction using probabilistic tractography
We constructed brain structural connectivity matrices per individual based on a predefined set of 144 regions of interest (ROIs) from a published brain parcellation, including 114 cortical regions covering seven networks, 21 30 subcortical regions covering the stratum/thalamus, 22 and the hippocampus and amygdala. 23 These ROIs were transformed from the MNI space to DTI native space using the transformations identified during pre-processing.
To construct whole-brain tractography, Bayesian Estimation of Diffusion Parameters Obtained using Sampling Techniques (Bedpostx) was first performed to calculate the probability distribution of fiber direction at each voxel, using the Markov Chain Monte Carlo sampling technique.
24
Subsequently, probabilistic fiber tracking were conducted with the 144 predefined ROIs in the diffusion native space,
25
using the Pipeline for Analyzing braiN Diffusion imAges (PANDA) toolbox.
26
Four ROIs were removed from further analyses due to lack of brain coverage, leading to a 140 × 140 connectivity probability matrix per participant. Notably, the connectivity probability from one ROI to another and the probability for the reverse may not be equal. Following a previously published method,
25
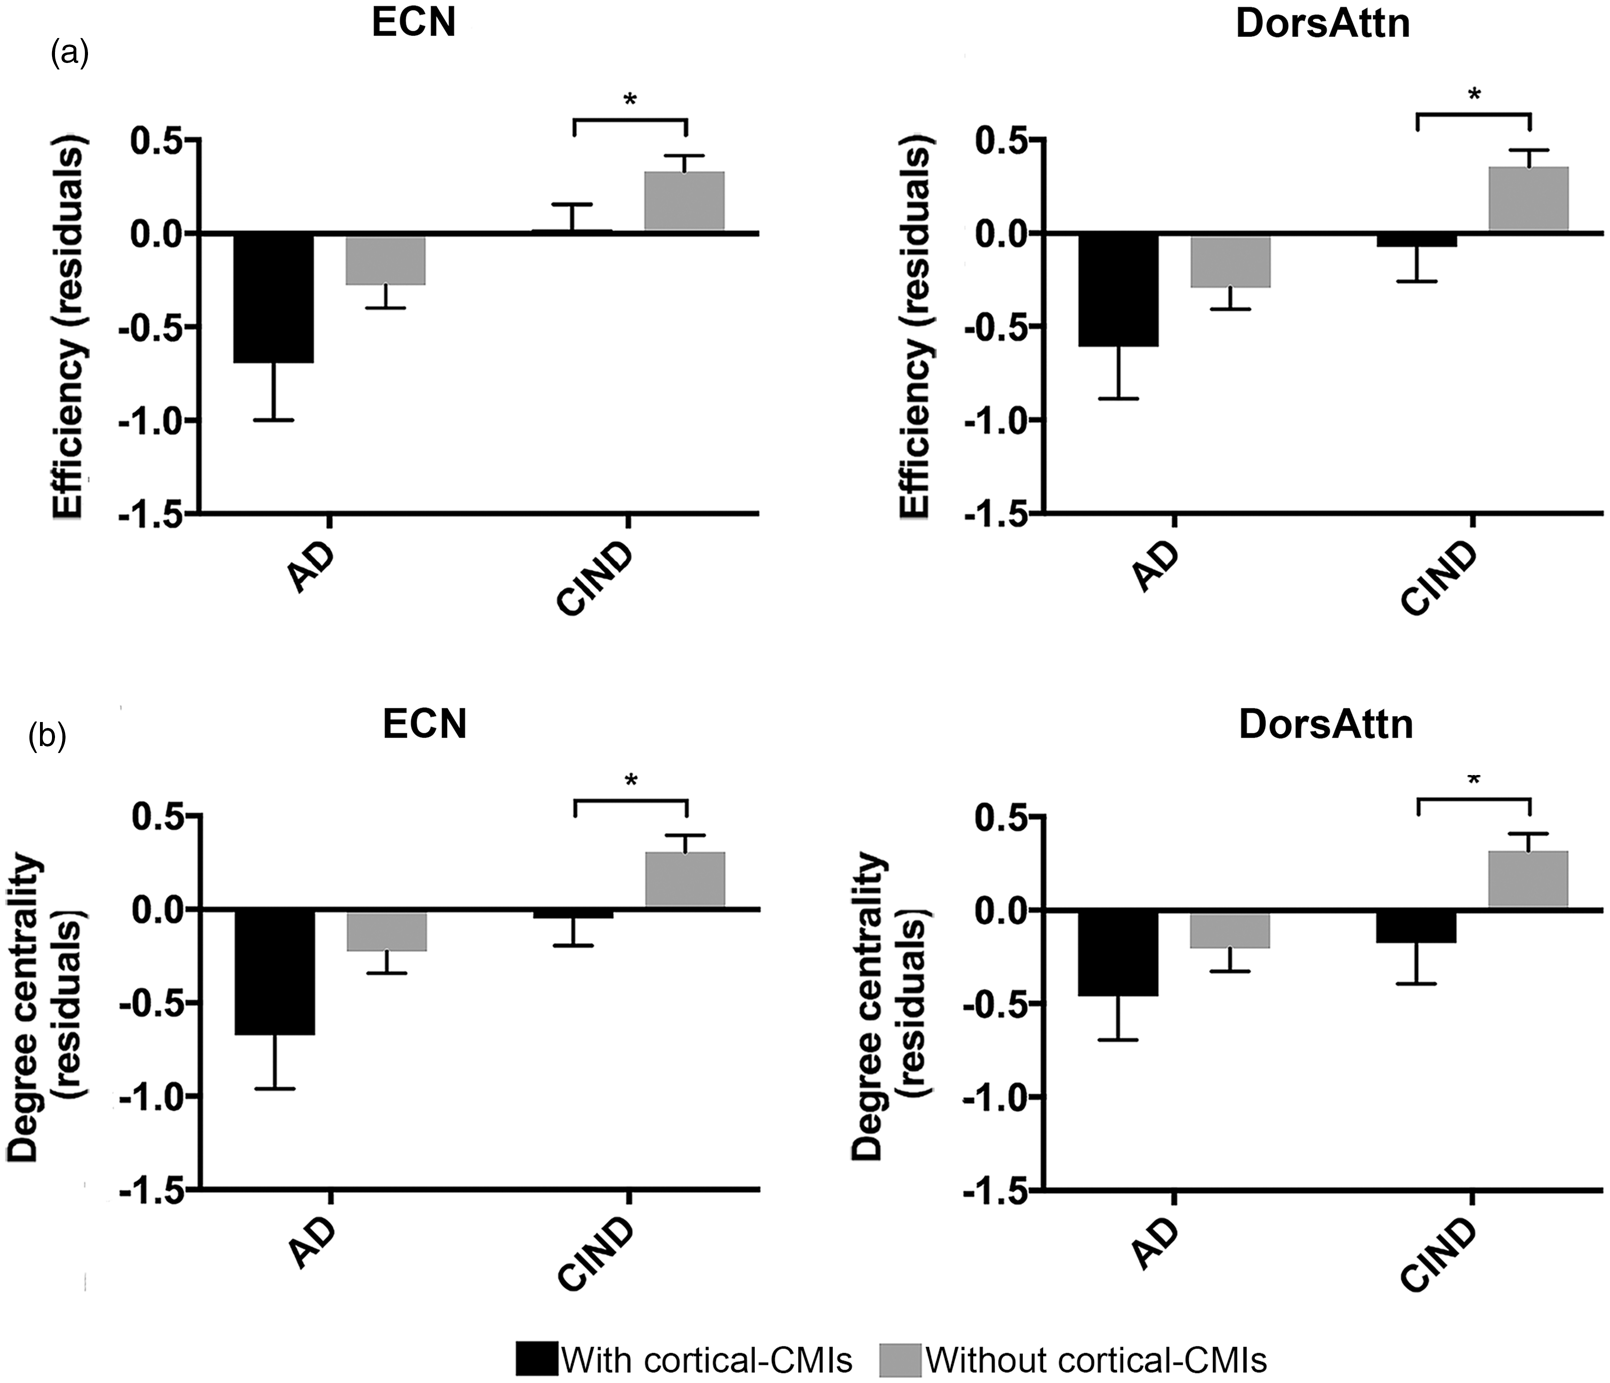
the directional connectivity matrix was then transformed to a unidirectional one by averaging the two connectivity probabilities for each pair of ROIs. The obtained connectivity matrix was then normalized with log transformation and rescaling
Additionally, to assess whether our results were affected by the resolution of brain parcellation, we repeated our analyses using another independent parcellation scheme with 430 nodes. This scheme consists of 400 cortical nodes 27 that has been mapped to the seven brain networks 21 as described earlier, together with the same 30 cortical regions.
Graph theoretical modeling
To make fair comparisons of network topological features across participants, structural connectivity matrices were thresholded using a wide range of cost thresholds from 0.08 to 0.4 in the step of 0.01 to calculate graph theoretical measures. Cost thresholds were defined as the fraction of actual number of connections to the number of all possible connections. We determined cost thresholds following previous approach: (1) brain network was both sparse and fully connected; (2) mean connection for each node was greater than the log of node numbers; 28 and (3) small-worldness of brain network was ≥1.2. 29 This resulted in the selection of a fixed percentage of strongest connections in the matrix while maintaining equal network density across participants.
We conducted graph theoretical modeling to characterize the topological features of the brain structural networks, including integration, centrality, and segregation. 9 Using the GRETNA toolbox, 30 the following graph measures were first calculated from the structural connectivity matrices at each cost threshold for each participant: (1) nodal efficiency (the average inverse shortest path length between the target node and all other ROIs) as an index of integration; 31 (2) degree centrality (centrality measure; the sum of weighted connections linking to each individual ROI); 9 and (3) clustering coefficient (segregation measure, representing the degree of how neighbors of the target ROI are also connected to each other). 28 The area under the receiver operating characteristic curve was then obtained for each graph measure across the cost thresholds. Finally, network-level graph measures were calculated by averaging graph measures across ROIs within each of the higher-order cognitive networks of interest, including the default mode network (DMN), executive control network (ECN), dorsal attention network (DorsAttn), and salience/ventral attention network (Sal/VenAttn) (eTable 1).
Statistical analyses
Network topology comparisons between patients with and without cortical-CMIs
We built a 2 (group: AD/CIND) × 2 (cortical-CMIs presence: present/absent) ANCOVA model per brain structural topological measure per network of interests to examine the effects of cortical-CMIs and group across all patients. Planned comparisons were then performed between patients with and without cortical-CMIs in AD and CIND separately. Age, sex, education, and significant CeVD presence were added as covariates.
We repeated the analyses by controlling for the presence of individual CeVD markers (i.e. white matter hyperintensity, cortical infarct, lacune, and cerebral microbleed). Furthermore, to exclude potential confounding effects from brain atrophy, we built another model to further control for total grey matter volume (GMV) using VBM8 toolbox (www.neuro.uni-jena.de/vbm/download/) embedded in SPM12 (v.6470, www.fil.ion.ucl.ac.uk/spm) (eMethods). Moreover, we derived matched subsamples by matching patients with and without cortical-CMIs on demographics (age, sex, and education) and individual CeVD markers in AD and CIND separately (eTable 2), and repeated the group comparisons on the matched subsamples.
Additionally, to explore deviations of structural network topology disruptions from HC, graph measures were compared between AD groups and HC, and between CIND groups and HC, controlling for age, sex, education, and significant CeVD presence.
Nonparametric permutation tests were used for all analyses. Threshold was set at p < 0.05 (two-tailed), based on the 95% confidence interval (CI) from the resulting permutation distribution (1000 permutations). Holm–Bonferroni multiple comparison correction was applied for the number of higher-order cognitive networks (N = 4).
Mediation analysis
Based on our previous work from the same ongoing dataset showing that cortical-CMIs were associated with impaired visuoconstruction and language in patients including CIND, AD, and vascular dementia, 3 we conducted correlation analyses between cortical-CMIs presence and cognition in all patients, with a priori interest in the domains of visuoconstruction and language. Threshold was set at p < 0.05 (two-tailed).
Furthermore, mediation analysis was applied in all patients to test the hypothesis that cortical-CMIs affected cognitive performance via disrupting the brain structural network topology. The mean efficiency, degree centrality, and clustering coefficient were obtained by averaging across the higher-order networks that showed differences between groups with and without cortical-CMIs. The mean graph theoretical measures were then normalized with log transformation and were added as mediators separately. Bootstrapping was applied (1000 times) and significance was based on the upper and lower bootstrapped 95% CI.
For both correlation and mediation analyses, we controlled for potential confounding effects from age, sex, education, and significant CeVD presence.
Results
Disrupted structural network topology with the presence of cortical-CMIs in all patients
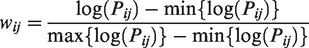
To investigate the effects of cortical-CMIs on brain structural network topology of the four high-order cognitive networks (including the ECN, DMN, DorsAttn, and Sal/VenAttn), we performed a 2 (group: AD/CIND) × 2 (cortical-CMIs: presence/absence) ANCOVA analysis controlling for age, sex, education, and the presence of significant CeVD. We observed a significant main effect of the presence of cortical-CMIs (eTable 3). Patients with cortical-CMIs had lower efficiency in the ECN (F = 5.73, p = 0.023), DMN (F = 5.08, p = 0.022), and DorsAttn (F = 5.79, p = 0.019) compared with their counterparts (Figure 1, left). Similarly, the presence of cortical-CMIs was related to lower degree centrality in the ECN (F = 7.07, p = 0.005), DMN (F = 4.98, p = 0.031), and DorsAttn (F = 5.68, p = 0.028), with the effect in the ECN surviving multiple comparison correction (N = 4) (Figure 1, right). No effects were observed for the clustering coefficient. Repeating the analyses using the CeVD markers matched subsamples showed comparable results, with the effects of cortical-CMIs in the ECN, DMN and the DorsAttn for both efficiency and degree centrality remaining significant (p < 0.05 corrected for multiple comparisons).
Patients with cortical-CMIs had lower efficiency and degree centrality in major cognitive networks. Among all patients (92 AD and 110 CIND combined), those with cortical-CMIs (N = 54) had lower efficiency (left) and degree centrality (right) in the ECN, DMN, and DorsAttn compared with those without cortical-CMIs (N = 148). Values represented mean standardized residuals after regressing out covariates of no interest (i.e. age, sex, education, and the presence of significant CeVD). Error bar represents standard error. *p < 0.05, #p < 0.05 after Holm–Bonferroni multiple comparison correction.
There was no interaction between group and cortical-CMIs presence for all graph measures. As expected, for efficiency and degree centrality (eTable 3), there were main effects of disease stage group (AD versus CIND) in the ECN (efficiency: F = 18.42, p < 0.001; degree centrality: F = 14.65, p < 0.001), DMN (efficiency: F = 19.68, p < 0.001; degree centrality: F = 15.69, p < 0.001), DorsAttn (efficiency: F = 14.54, p < 0.001; degree centrality: F = 6.62, p = 0.006), and the Sal/VenAttn (efficiency: F = 16.00, p < 0.001; degree centrality: F = 7.71, p = 0.005). All survived multiple comparison correction. Regarding clustering coefficient, there were main effects of group (DMN: F = 4.66, p = 0.028; DorsAttn: F = 6.60, p = 0.01), with the latter passing multiple comparison correction (p < 0.05). Repeating the analyses in the CeVD markers matched subsample revealed comparable results.
In addition, we examined structural network topology changes in patients compared with HC. As expected, compared with HC, AD patients showed network topological abnormalities, which was absent in CIND patients (Supplementary Results and eFigures 1 to 3).
Comparisons between patients with and without cortical-CMIs in AD and CIND separately
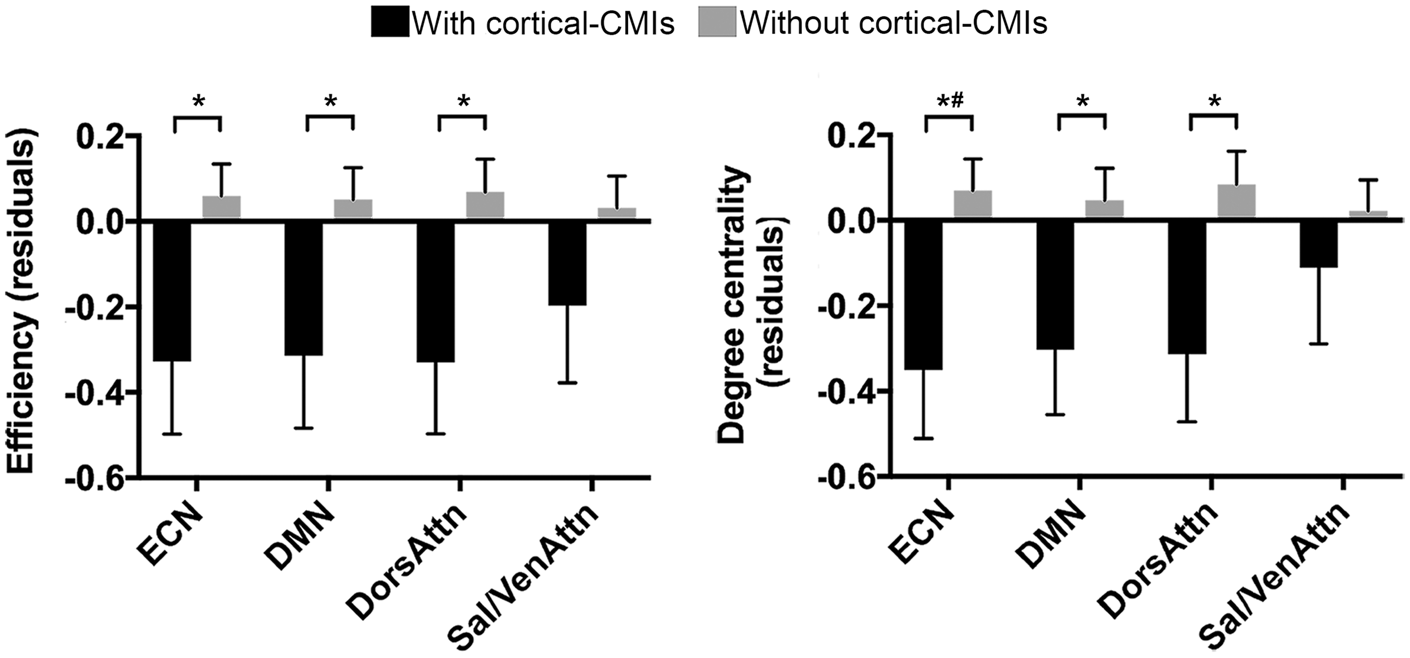
To examine whether there were stage-dependent structural network topological disruptions in association with cortical-CMIs, we planned comparisons between patients with and without cortical-CMIs in AD and CIND stages separately. This revealed similar but slightly differential effects of cortical-CMIs on brain structural network topology between the two disease stages (eTable 3). Specifically, compared with CIND patients without cortical-CMIs, efficiency and degree centrality were lower in CIND patients with cortical-CMIs in the ECN (efficiency: Figure 2(a) left, p = 0.044, Cohen’s d = 0.43; degree centrality: Figure 2(b) left, p = 0.035, Cohen’s d = 0.45) and DorsAttn (efficiency: Figure 2(a) right, p = 0.018, Cohen’s d = 0.51; degree centrality: Figure 2(b) right; p = 0.018, Cohen’s d = 0.53). Further explorative analyses showed that these observed results were mainly contributed by an ECN subnetwork localizing in the lateral prefrontal cortex (ECN-A) and a DorsAttn subnetwork localizing in the parietal part (DorsAttn-A) (eTables 1 and 4). No difference in clustering coefficient was found.
Cortical-CMIs were associated with lower efficiency and degree centrality in patients with CIND. (a) CIND with cortical-CMIs showed lower efficiency and (b) degree centrality in the ECN and DorsAttn than CIND without cortical-CMIs. Values represented mean standardized residuals after regressing out covariates of no interest (i.e. age, sex, education, and the presence of significant CeVD). Error bar represents standard error. *p < 0.05.
In AD patients, cortical-CMIs presence was associated with lower clustering coefficient in the DorsAttn (Figure 3 left, p = 0.045, Cohen’s d = 0.45), and the DMN (Figure 3 right, p = 0.04, Cohen’s d = 0.48), but not efficiency and degree centrality. Exploratory analyses revealed that the observed effect of cortical-CMIs was driven by the posterior DMN (DMN-C, e.g. retrosplenial cortex and paraphippocampus, eTables 1 and 4).
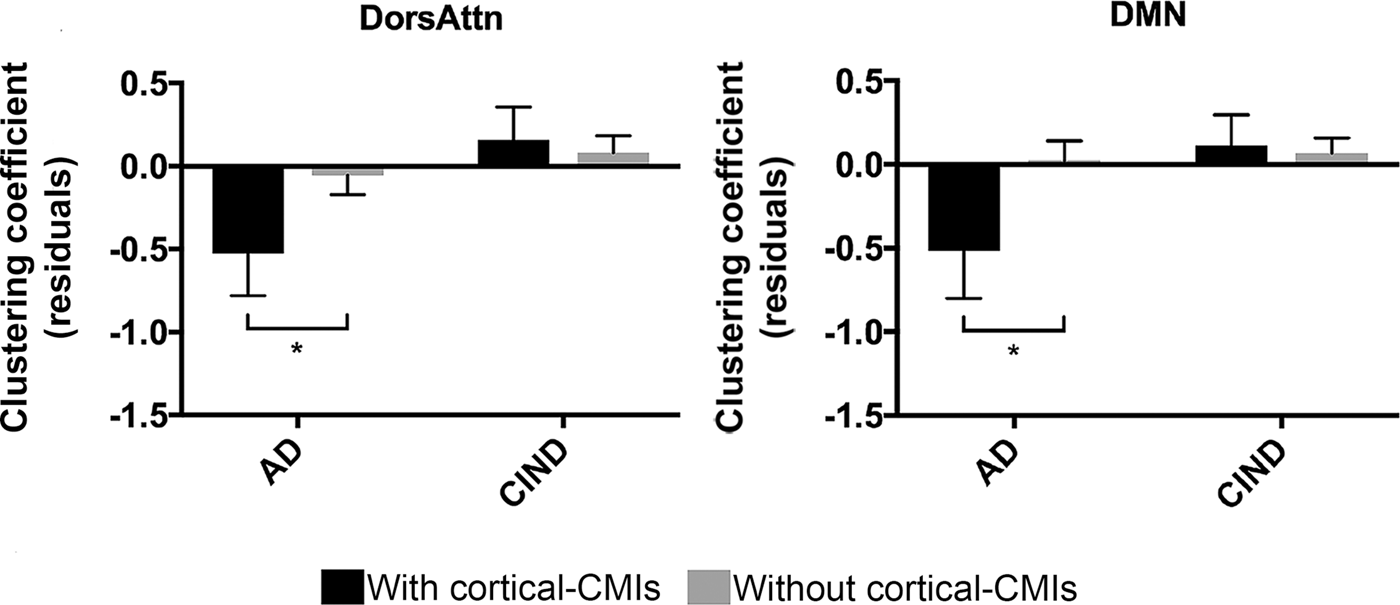
Cortical-CMIs related to lower clustering coefficient in AD patients. Compared with AD without cortical-CMIs, AD with cortical-CMIs showed lower clustering coefficient in the DorsAttn (left) and DMN (right). Values represented mean standardized residuals after regressing out covariates of no interest (i.e. age, sex, education, and the presence of significant CeVD). Error bar represents standard error. *p < 0.05.
For the purpose of excluding potential confounding effects from other variables other than cortical-CMIs, we performed further validation analyses. Briefly, controlling for presence of individual CeVD markers or grey matter volume (GMV) in the whole sample, and repeating the analyses in the CeVD markers matched subsample (with and without controlling for GMV) revealed largely similar results (eTable 5). Furthermore, repeating analyses using an independent 430-node parcellation scheme showed similar results (eTables 3 and 5).
Structural network topology mediates the association between cortical-CMIs and impaired cognition
Mediation analyses were conducted to test whether structural network topological disruptions mediated association between cortical-CMIs and cognition. The presence of cortical-CMIs was associated with worse performance in visuoconstruction in all patients (r = −0.15, p = 0.039). Mediation analysis showed that there was an indirect effect of cortical-CMIs on visuoconstruction via network averaged efficiency (Figure 4(a); indirect effect = −0.29, bootstrapped 95% CI = [−0.63, −0.02]), and degree centrality (Figure 4(b); indirect effect = −0.36, bootstrapped 95% CI = [−0.71, −0.11]), but not via clustering coefficient. These mediation effects were not driven by certain disease group, supported by the moderation analyses via adding diagnostic group as a moderator in the mediation model (see Supplementary Results).
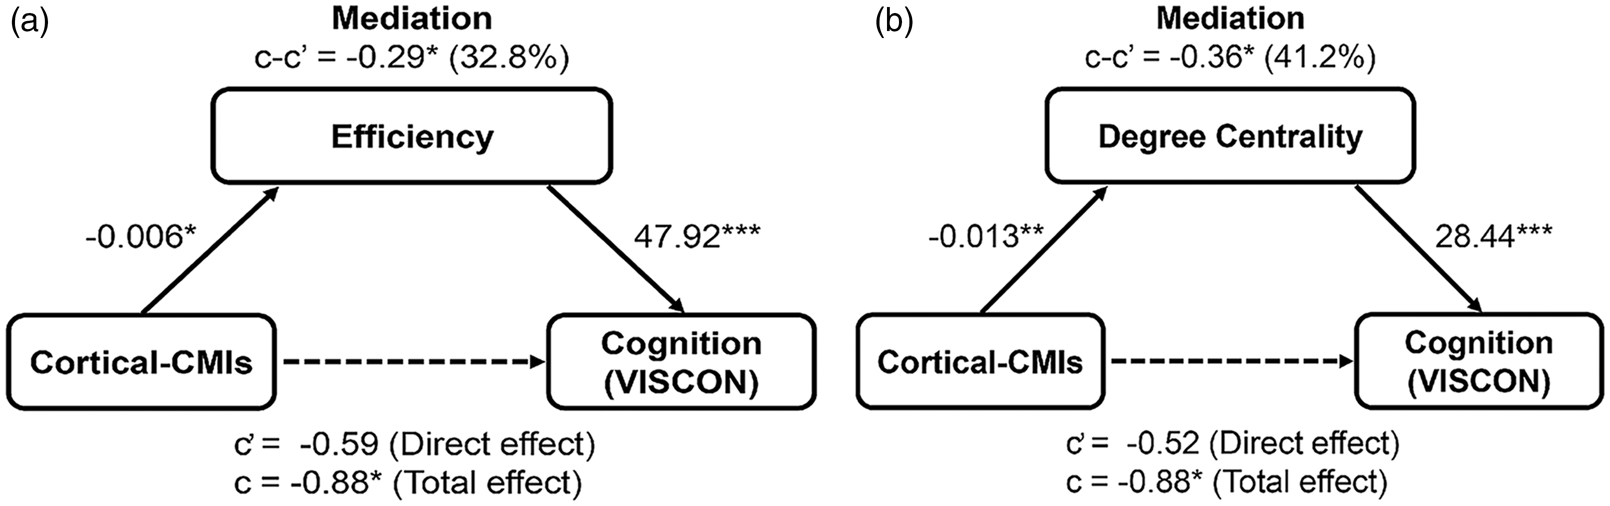
Network-based efficiency and degree centrality mediated the association between cortical-CMIs and visuoconstruction impairment. Mean efficiency or degree centrality (i.e. average across networks showing significant group differences between patients with and without cortical-CMIs) was added as a mediator in all patients. Full mediation of the mean efficiency (a) or degree centrality (b) was observed over the association between cortical-CMIs and cognition in the visuoconstruction domain. Age, sex, education, and the presence of significant CeVD were added as covariates of no interest. “c” denotes the total effect of cortical-CMIs on cognition; “c” denotes the direct effect of cortical-CMIs on cognition excluding effects from individual mediator; and “c-c” denotes the indirect effect of cortical-CMIs on cognition (mediation effect via graph measures). VISCON data were not available for one AD patient with cortical-CMIs and another AD without cortical-CMIs. *p < 0.05, **p < 0.01, ***p < 0.001.
Exploratory analyses in each network separately showed network-general mediation effects in ECN and DorsAtten network degree centrality and efficiency (ECN degree centrality: indirect effect = −0.21, bootstrapped 95% CI = [−0.51, −0.02]); DorsAttn degree centrality: indirect effect = −0.26, bootstrapped 95% CI = [−0.51, −0.01]); ECN efficiency: indirect effect = −0.23, bootstrapped 95% CI = [−0.55, −0.003]); DorsAttn efficiency: indirect effect = −0.29, bootstrapped 95% CI = [−0.64, −0.004]).
Discussion
The present study provided the first evidence of the influence of cortical-CMIs on brain structural network topology in living human patients with AD and CIND. As hypothesized, cortical-CMIs were associated with disrupted structural network topology in higher-order cognitive networks in patients with cognitive impairment and dementia. Specifically, compared with their counterparts without cortical-CMIs, CIND patients with cortical-CMIs had lower efficiency and degree centrality in the ECN and DorsAttn, whereas in AD patients with cortical-CMIs there were lower clustering coefficient in the DMN and DorsAttn. Importantly, reduced efficiency/degree centrality in these higher-order cognitive networks mediated the association between cortical-CMIs and visuoconstruction impairment in all patients. Our findings suggest that cortical-CMIs were associated with initial integration impairment at CIND stage and predominantly with disrupted segregation when demented. This difference may be of potential interest to represent stage-dependent marker, shedding light on the underlying mechanism of how cortical-CMIs pathology contributes to impaired cognition in patients with CIND and AD.
Structural network topology degradation in the higher-order cognitive networks are associated with the presence of cortical-CMIs
In CIND patients, the presence of cortical-CMIs decreased efficiency and degree centrality in the ECN and DorsAttn, indicating that information integration between brain areas is less efficient in these two higher-order cognitive networks. 9 CeVD is a common comorbidity to AD32–34 and has been related to cognitive impairment including deficits in executive control and attentional processing. 35 CeVD has been associated with impaired functional connectivity and structural covariance in the ECN. 11 In agreement with the ECN involvement in relation to CeVD, we showed cortical-CMIs specific pathology in the ECN (including the dorsal lateral prefrontal cortex and posterior parietal cortex) structural topology in CIND patients. Moreover, the DorsAttn mainly lies in the fronto-parietal areas (e.g. frontal eye field and intraparietal sulcus), right next to the ECN regions.21,36 This network plays an important role in top-down orientation of attention, 36 which is crucial for complex cognitive activities. Our findings suggest that the presence of cortical-CMIs in the early stage of dementia might lead to suboptimal integration in the fronto-parietal white matter pathways which are closely related to cognition (eTable 6). Indeed, CeVD affects functional connectivity in the fronto-parietal regions, 37 which was observed in patients with CIND. 11 By contrast, AD patients with cortical-CMIs had a lower clustering coefficient in the DorsAttn and DMN than AD patients without cortical-CMIs. This reflects decreased segregation 9 in the DMN/DorsAttn at the demented stage which was absent at the CIND stage. AD has been shown to specifically target the DMN,38,39 and attention has been found to be the first affected nonmemory domain in AD. 40 Importantly, these findings remained after controlling for potential confounding effects from other CeVD factors and atrophy.
Taken together, given that long-range communication plays an important role in network integration while the short-range local communication between nodes is more critical for segregation, 9 we propose that the association with cortical-CMIs may begin with diffuse influence on communication efficiency of the fronto-parietal cognitive networks at the early stage, and then continue in both diffuse and focal manners as reflected by its associations with both long-range and short-range pathways, especially the local processing of the DMN and DorsAttn regions as the disease progresses.
Structural network topology mediates the association between cortical-CMIs and cognition
Impairment in visuoconstruction is prevalent in patients with AD and CIND,41–44 and evidence has shown that coexistence of cerebrovascular disease was associated with worse visuoconstruction in patients with AD. 45 Moreover, it has been found that cortical-CMIs were not only associated with worse performance on visuospatial cognition at baseline, but also with longitudinal follow-up. 46 These findings suggest a close association between cortical-CMIs and visuoconstruction ability. Indeed, we found that the presence of cortical-CMIs related to worse performance in the visuoconstruction cognitive domain, in line with our previous work. 3 However, an association between cortical-CMIs presence and impaired language cognitive domain 3 was not shown in our current study. The discrepancy may be explained by differences in the sample size and patient groups. In addition, evidence from community-based study and ex vivo investigation have also shown a relationship between presence of cortical-CMIs and impaired cognition in executive function, visual/verbal memory, 12 and motor functioning, 47 which needs future investigations on variables causing the inconsistency.
More importantly, as we hypothesized, cortical-CMIs exert its influence on visuoconstruction ability via affecting structural network topology (network averaged efficiency and degree centrality) in higher-order cognitive-networks. Animal studies showed degradation of white matter tracts linking to remote brain regions with the presence of cortical-CMIs, disrupting communication between areas via damaging myelin sheath of fiber axon.1,4–6 This suggests a potential underlying mechanism between cortical-CMIs and cognitive impairment. Our study provides the first supporting evidence of such hypothesis in living humans, showing that cortical-CMIs influence visuoconstruction ability by affecting both local and remote brain regions via white matter pathways. Altogether, we propose that brain structural network topology plays an important role in the relationship between cortical-CMIs and cognitive impairment. Future studies are needed to investigate other potential vascular and synaptic pathways underlying the cortical-CMIs–cognition relationship.
Limitations and future directions
Some limitations need to be considered. Firstly, we detected cortical-CMIs from 3T MRI images with limited sensitivity and only larger cortical-CMIs could be detected. 3 As such, we defined our groups in a binary manner (with or without cortical-CMIs). Although we cannot exclude the possibility that some patients without cortical-CMIs as defined here may actually have cortical-CMIs, it should be noted that detecting a single cortical-CMIs from 3T MRI images might indicate many more small ones in the brain. 1 Thus, the degree of cortical-CMIs burden differed between the cortical-CMIs and non-cortical-CMIs groups. In vivo 7 T data in living humans might be of help to validate our findings and characterize the effect of cortical-CMIs in a continuous manner. Secondly, it is important to investigate the brain network topology profiles in association with cortical-CMIs at the preclinical stage. However, due to lower prevalence of cortical-CMIs in the HC group and relatively lower detection sensitivity of 3T MRI images, the HC group with cortical-CMIs in our cohort did not have sufficient power to be included. 3 Thirdly, our findings were cross-sectional and association-based, and it remains unknown whether there is any causal relationship between cortical-CMIs, disrupted structural network topology, and cognitive impairment. Fourthly, participants included in this study did not have CSF or PET biomarker data to confirm pathology. Future work is needed to address whether cortical-CMIs influence brain structural and functional networks longitudinally and relate to dementia conversion in biomarker validated samples. Finally, it would be important to test whether and how the location of cortical-CMIs influences the brain structural connectivity and cognition.
Conclusion
In conclusion, the presence of cortical-CMIs in patients with CIND and AD was related to brain structural network topological deterioration in higher-order cognitive networks, with network topology disruptions starting from initial integration impairment at CIND stage while mainly disturbed segregation when demented. Importantly, these network topological changes mediated the association between cortical-CMIs and visuoconstruction impairment. The present findings highlight the importance of brain structural network topology in understanding the role of cortical-CMIs pathology in the AD spectrum.
Supplemental Material
JCB902187 Supplemental Figure - Supplemental material for Cerebral microinfarcts affect brain structural network topology in cognitively impaired patients
Supplemental material, JCB902187 Supplemental Figure for Cerebral microinfarcts affect brain structural network topology in cognitively impaired patients by Liwen Zhang, Geert Jan Biessels, Saima Hilal, Joanna Su Xian Chong, Siwei Liu, Hee Youn Shim, Xin Xu, Eddie Jun Yi Chong, Zi Xuen Wong, Yng Miin Loke, Narayanaswamy Venketasubramanian, Boon Yeow Tan, Christopher Li-Hsian Chen and Juan Helen Zhou in Journal of Cerebral Blood Flow & Metabolism
Footnotes
Funding
The author(s) disclosed receipt of the following financial support for the research, authorship, and/or publication of this article: This research was funded by the National Medical Research Council (NMRC) Centre Grant (NMRC/CG/013/2013 and NMRC/CG/NUHS/2010 to Dr. Christopher Chen), the Biomedical Research Council, Singapore (BMRC 04/1/36/372 to Dr Juan Zhou), the National Medical Research Council, Singapore (NMRC/CBRG/0088/2015, NMRC/CIRG/1390/2014 to Dr Juan Zhou, and NMRC/CIRG/1446/2016 to Dr Christopher Chen), and Duke-NUS Medical School Signature Research Program funded by Ministry of Health (to Dr Juan Zhou), Singapore.
Acknowledgements
The authors acknowledge all participants for their contribution to this study, and their colleagues at the Clinical Imaging Research Centre, National University of Singapore for their help with data collection.
Declaration of conflicting interests
The author(s) declared no potential conflicts of interest with respect to the research, authorship, and/or publication of this article.
Authors’ contributions
LZ, CC, and JZ contributed to the conception and design of the study, data analyses, and article preparation. GJB advised on visual rating of cerebral microinfarcts, data analyses, and contributed to article writing. SH was responsible for visual rating of cerebral microinfarcts. JSXC, SL, HYS, and YML contributed to neuroimaging data analyses and article writing. XX, EJYC, and ZXW were responsible for collection of the neuropsychological assessment data and contributed to data analyses. RNV and BYT contributed to clinical consultation and article writing. De-identified data are available upon reasonable requests from the corresponding authors.
Supplemental material
Supplemental material for this article is available online.
References
Supplementary Material
Please find the following supplemental material available below.
For Open Access articles published under a Creative Commons License, all supplemental material carries the same license as the article it is associated with.
For non-Open Access articles published, all supplemental material carries a non-exclusive license, and permission requests for re-use of supplemental material or any part of supplemental material shall be sent directly to the copyright owner as specified in the copyright notice associated with the article.