
Abstract
Glucose is the obligate energetic fuel for the mammalian brain, and most studies of cerebral energy metabolism assume that the majority of cerebral glucose utilization fuels neuronal activity via oxidative metabolism, both in the basal and activated state. Glucose transporter (GLUT) proteins deliver glucose from the circulation to the brain: GLUT1 in the microvascular endothelial cells of the blood—brain barrier (BBB) and glia; GLUT3 in neurons. Lactate, the glycolytic product of glucose metabolism, is transported into and out of neural cells by the monocarboxylate transporters (MCT): MCT1 in the BBB and astrocytes and MCT2 in neurons. The proposal of the astrocyte—neuron lactate shuttle hypothesis suggested that astrocytes play the primary role in cerebral glucose utilization and generate lactate for neuronal energetics, especially during activation. Since the identification of the GLUTs and MCTs in brain, much has been learned about their transport properties, that is capacity and affinity for substrate, which must be considered in any model of cerebral glucose uptake and utilization. Using concentrations and kinetic parameters of GLUT1 and −3 in BBB endothelial cells, astrocytes, and neurons, along with the corresponding kinetic properties of the MCTs, we have successfully modeled brain glucose and lactate levels as well as lactate transients in response to neuronal stimulation. Simulations based on these parameters suggest that glucose readily diffuses through the basal lamina and interstitium to neurons, which are primarily responsible for glucose uptake, metabolism, and the generation of the lactate transients observed on neuronal activation.
Keywords
Introduction
The central dogma of cerebral energy metabolism is that glucose is the obligate energetic fuel of the mammalian brain and the only substrate able to completely sustain neural activity (Siesjo, 1978). Furthermore, it has traditionally been assumed that the majority of cerebral glucose utilization fuels neuronal activity via oxidative metabolism, both in the basal and activated state (Sokoloff et al, 1977). Rates of cerebral blood flow directly relate to measurements of cerebral oxygen consumption, generating the concept of the ‘flow-metabolism couple’ (Sokoloff, 1976; Sokoloff et al, 1977). The introduction of neuroimaging techniques to study cerebral metabolism revealed an ‘uncoupling’ between cerebral oxygen consumption, blood flow, and glucose utilization during brain activation (Fox and Raichle, 1986; Fox et al, 1988), with the suggestion of regional stimulation of oxidative glycolysis during neuronal activation. The temporal relationship between the release of lactate and the onset of neuronal activation, the source of the lactate, that is neuronal or glial, and its subsequent diffusion and disposal are all matters of considerable debate. Initial studies by Prichard et al (1991) assumed astrocytic and neuronal generation of lactate. A more recent proposal by Gjedde and colleagues (Gjedde and Marrett, 2001; Gjedde et al, 2002) suggests that afferent neurons and astrocytes, rather than efferent neurons, are the source of lactate, whereas Fillenz (2005) suggests that glutamate release from astrocytes results in subsequent lactate secretion from these cells. A very recent in vitro study investigated the relative significance of glucose and lactate as fuels to maintain neurotransmitter homeostasis during synaptic activity (Bak et al, 2006). They concluded that whereas lactate is capable of maintaining basal neuronal metabolism, glucose is the necessary substrate during synaptic activity. Structural considerations such as the relative dearth of mitochondria in both dendritic spines and the peripheral processes of astrocytes, serve to further confuse the picture (Dienel and Cruz, 2003; Sorra and Harris, 2000). Studies by Dienel, Cruz, and colleagues (Cruz et al, 1999; Dienel and Cruz, 2003) have shown that lactate, wherever generated, is rapidly dispersed throughout the brain and into the bloodstream. Conversely, the studies of Korf and co-workers have shown the interaction of circulating lactate with neural lactate pools (Gjedde and Marrett, 2001; Gjedde et al, 2002; Leegsma-Vogt et al, 2004, 2003; Korf, 2006; Fillenz, 2005; Jones et al, 2000). The dogma has been further challenged by the astrocyte—neuron lactate shuttle (ANLS) hypothesis proposed by Magistretti, Pellerin, and colleagues, who postulated that astrocytes play the primary role in cerebral glucose utilization by metabolizing the glucose to lactate, which is subsequently transported to the neuron to fuel neuronal energetics (Pellerin and Magistretti, 1994). During the decade since the ANLS was first proposed, there has been continual debate over whether neuronal activity is fueled primarily by glucose or lactate. There have been a plethora of reviews written specifically to either support or refute the ANLS hypothesis, without any apparent consensus (Aubert et al, 2005; Chih and Roberts, 2003; Hertz, 2004; Kimelberg, 2004; Leybaert, 2005; Magistretti and Pellerin, 1999; Magistretti et al, 1999; Pellerin and Magistretti, 1994, 2003; Tsacopoulos and Magistretti, 1996). Although some of these recent reviews mention the glucose transporter (GLUT) proteins and the monocarboxylate transporter (MCT) proteins, little or no consideration has been given to the transport properties (capacity and affinity for substrates) of these transport systems and their relative contributions to substrate transport across the blood—brain barrier (BBB) and into the neural cells within the brain. The objective of this review is to address the role that transport may play in modulating cerebral metabolism, and the limitations that must be imposed on previously proposed models by the known concentrations and kinetic properties of the GLUTs and MCTs in the brain. To this end, we now propose a model that incorporates, where known, the kinetic properties and concentrations of the respective transporter proteins, as well as the role the basal lamina plays in the diffusion/delivery of glucose and lactate.
Glucose Transporters
The transport of glucose and other hexoses into most mammalian cells is mediated by the SLC2 family of 13 transport proteins, GLUT1 to GLUT12 and HMIT, the myoinositol transporter (for review see Joost and Thorens, 2001; Uldry and Thorens, 2004; Wood and Trayhurn, 2003). With the exception of GLUT1, which is ubiquitously expressed, the other family members have fairly distinct tissue- and cell-specific patterns of expression. Given the cellular heterogeneity of the brain, it is not surprising that most, if not all, family members have been reported to be present in mammalian brain in vivo or in vitro preparations, as depicted in Figure 1. Much of the data supporting the indicated cellular distribution have been reviewed previously by us and others (Duelli and Kuschinsky, 2001; Dwyer et al, 2002; Maher et al, 1994; Vannucci et al, 1997), and will not be further discussed here. However, it is important to note that many of the transporters indicated in Figure 1 are either unable to transport glucose (GLUT5, −6, and −11, and HMIT have very low affinity for glucose), or have very limited localization and concentrations (GLUT2 and −4), whereas for others, their location, ability, or capacity to transport glucose has yet to be assessed (GLUT8 and −10). Thus, with all of the above exclusions, the predominant transporters in mammalian brain involved in cerebral glucose utilization are GLUT1 and −3, which are expressed throughout the brain and whose localization and kinetic characteristics are well established. The cellular localizations of the GLUTs are shown together in Figure 1 with the relevant MCTs, which are responsible for the transport of lactate, pyruvate, acetoacetate, and β-hydroxybutyrate.
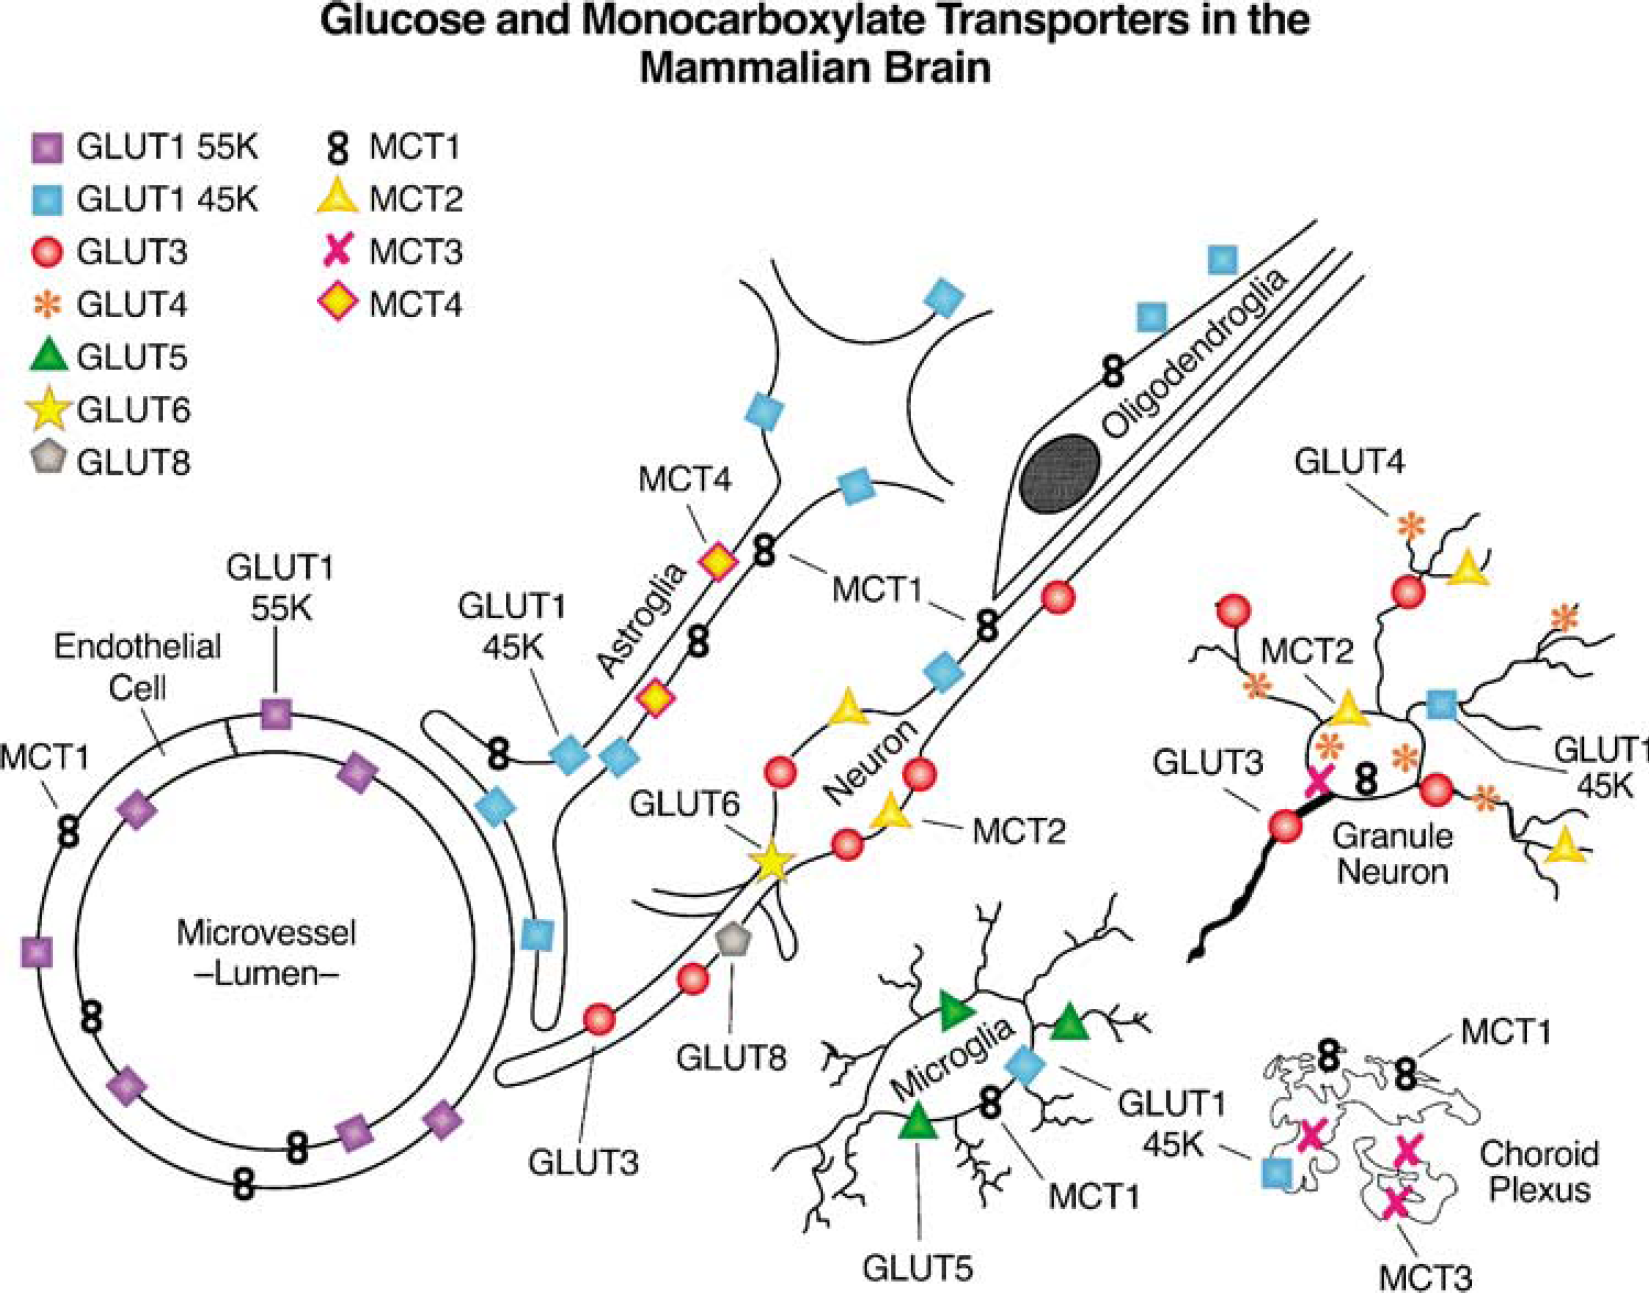
A schematic representation of the cellular localization of glucose transporter (GLUTs) and monocarboxylate transporters (MCTs) in mammalian brain.
Cerebral Glucose Utilization: Glucose Transporter1 and −3
Glucose transporter1 was the first GLUT to be cloned and whose kinetic characteristics have been most extensively studied (Mueckler et al, 1985). Two different molecular weight forms (45 and 55 kDa) of GLUT1 have been detected in mammalian brain. The difference in their relative molecular weight is accounted for by a differing extent of glycosylation (Birnbaum et al, 1986). However, these species do not appear to differ in their protein structure or kinetic characteristics (Birnbaum et al, 1986). The higher molecular weight 55 kDa form, which is comparable to that found in circulating erythrocytes of higher mammalian species, is found exclusively in the microvascular endothelial cells that make up the BBB, where it is present in both the luminal and abluminal membranes, and in a substantial intracellular pool (see Figure 2) (Dick et al, 1984; Farrell and Pardridge, 1991; Harik et al, 1990; Maher et al, 1992; Sivitz et al, 1989). Early studies in rat BBB endothelial cells reported an asymmetric distribution among these compartments: 11% luminal membranes, 44% abluminal membranes, and the remaining 45% residing in the intracellular pool (Cornford et al, 1993; Farrell and Pardridge, 1991). Our own fractionation and kinetic studies, and more recent electron micrograph (EM) studies (Figure 2), support a more balanced distribution between the luminal and abluminal membranes, in agreement with Gerhart and colleagues (Gerhart et al, 1989; Simpson et al, 2001). Clearly, the ratio of luminal to abluminal GLUT1 can have a direct effect on rates of glucose uptake into the brain, with increased luminal transporters supporting increased uptake (Simpson et al, 1999). A potential role of the intracellular pool in acute modulation of glucose transport across the BBB could be realized if these transporters were recruited to the luminal membrane in response to increased neural demand. Previous studies from our laboratory show that the increased cerebral glucose uptake observed in the chronically hypoglycemic rat is associated with both an increase in total endothelial GLUT1 per mg microvessel protein, and specifically increased levels of luminal GLUT1 (Simpson et al, 1999). It will be important to devise other more acute in vivo paradigms to show whether translocation of transporters to the luminal membrane plays a role in acutely modulating glucose transport into the brain.
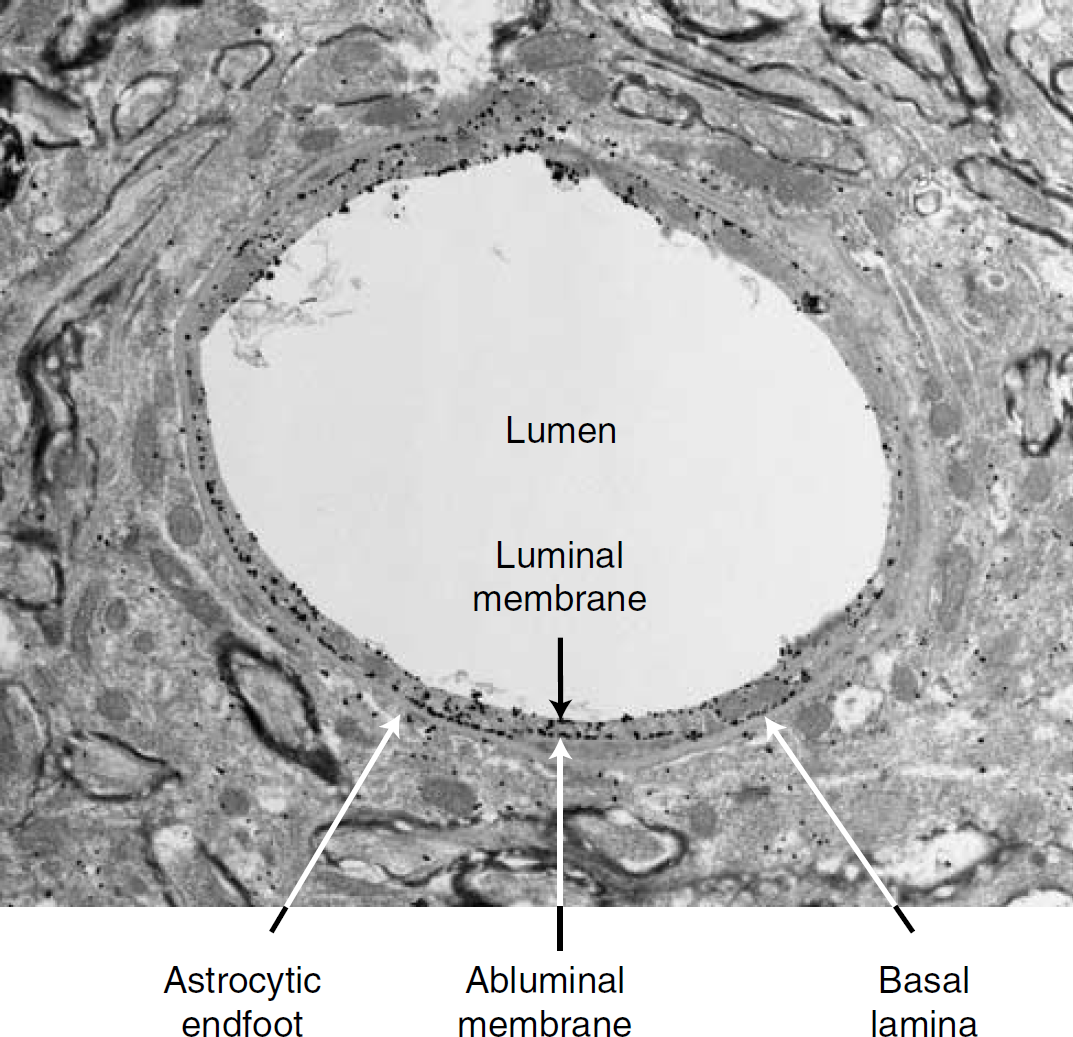
A representative EM illustrating the relative distribution of immunogold labeling of glucose transporter GLUT1 in endothelial cells and astrocytic endfeet. Glucose transporter GLUT1 was detected by a combination of an antibody raised against purified human erythrocyte GLUT1 (Wheeler et al, 1982) and a goat-antirabbit Alexa Fluronanogold Fab fragment Nanoprobe. Arrows, endothelial GLUT1; arrowheads, astrocytic GLUT1.
Although it was originally maintained that the only GLUT1 in the brain was in the BBB, Western blot analysis of vascular-free brain membranes yields a GLUT1 band at 45 kDa (Maher et al, 1992, 1994; Sivitz et al, 1989). The 45 kDa form of GLUT1 is found in all glial cells, as well as in the basolateral and apical membranes of the choroid plexus, and ependyma.
Another relevant aspect of the EM depicted in Figure 2 is the relative paucity of glucose transporter GLUT1 in the astrocytic endfeet adjacent to the endothelial cell. Under normal conditions, there is very limited in vivo expression of 45 kDa GLUT1 in neurons, although expression is increased in response to environmental stressors or when neurons are placed in culture (Gerhart et al, 1994; Lee and Bondy, 1993; Maher et al, 1991; Wheeler et al, 1982).
Glucose transporter3, originally cloned from a human fetal skeletal muscle cell line (Nagamatsu et al, 1992), was subsequently cloned from a variety of mammalian brain cDNA libraries, and in brain it has been localized almost exclusively to neurons (Gerhart et al, 1992; Maher et al, 1992; McCall et al, 1994; Nagamatsu et al, 1993). Interestingly, peripheral sites of GLUT3 expression include sperm, platelets, placenta, and certain human gliomas; all cell types that exhibit high rates of glucose metabolism (see Joost and Thorens, 2001; Uldry and Thorens, 2004; Wood and Trayhurn, 2003). During cerebral maturation, the increase in GLUT3 expression precedes the expression of the glial 45 kDa GLUT1 and is coincident with neuronal maturation, synaptogenesis, functional activity, and increased rates of cerebral glucose utilization (Vannucci, 1994; Vannucci et al, 1993).
Kinetics of Glucose Transport
With the exception of the HMIT which is proton-driven, all of the GLUTs (1 to 12) are facilitative transporters. These transporters mediate energy-independent transport, which leads to glucose equilibration, but not glucose accumulation, by cells. However, these transporters catalyze bi-directional fluxes, and the presence of intracellular and/or extracellular glucose alters the kinetics of transport both in and out of the cell. This bidirectional transport must be actively considered when modeling the flow of glucose from blood to the individual types of neural cells, primarily neurons and glial cells (see below Blomqvist et al, 1991; Carruthers, 1990; Choi et al, 2001; Cloherty et al, 1996; de Graaf et al, 2001; Gjedde, 1980; Gruetter et al, 1998; Hebert and Carruthers, 1991; Qutub and Hunt, 2005).
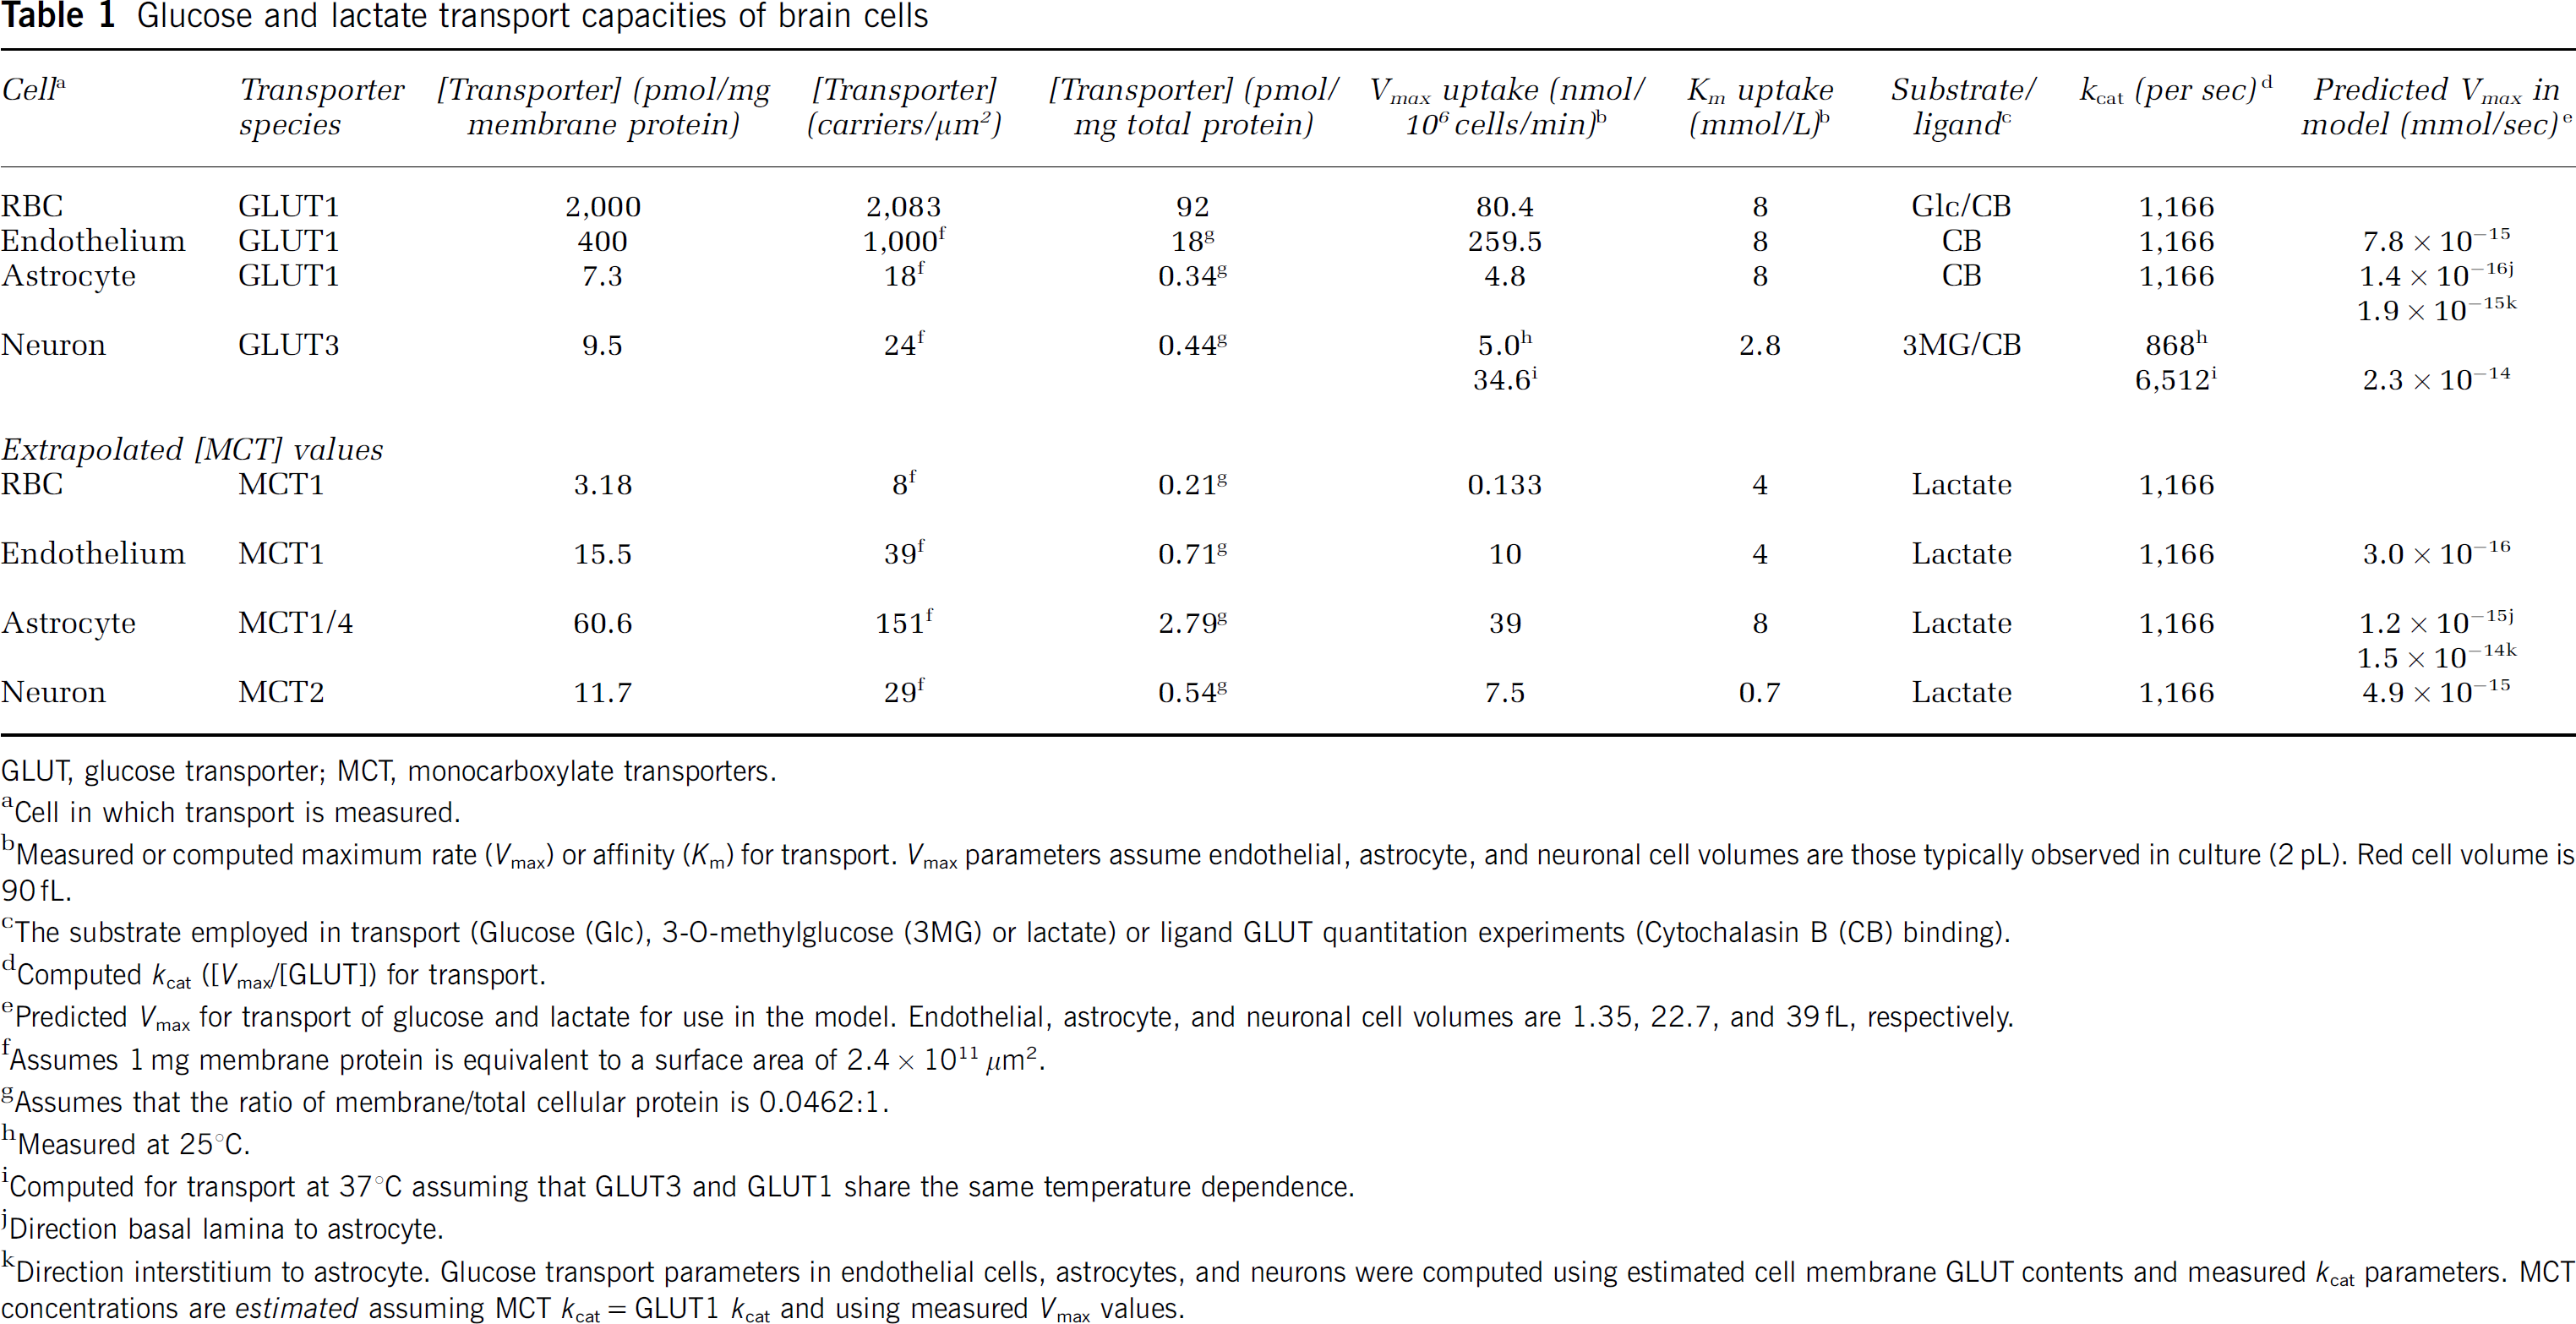
The capacity for glucose transport depends on the concentration of the transporter proteins as well as their intrinsic catalytic turnover activity or number of transport cycles catalyzed per transporter per sec (kcat) within the respective cellular compartments. It is relatively easy to determine the total concentration of GLUTs in brain microvessels, as these vessels can be readily isolated from whole brain (Vannucci, 1994). Absolute concentrations of GLUT are determined by measuring the equilibrium binding of cytochalasin B (CB) (Weber et al, 1988). Cytochalasin B is a competitive inhibitor of GLUT1- and GLUT3-mediated glucose transport that binds to the intracellular glucose-binding site of the transporters. Since CB is known to bind to other cellular proteins including actin, specificity of transporter concentration is achieved by measuring only that component of binding which is glucose inhibited. Specificity is further enhanced by performing the assay in the presence of cytochalasin E, which blocks binding to other cellular proteins but does not affect CB binding to the GLUTs (Weber et al, 1988). Values for concentrations of GLUT1 in human and rat microvessels range from 40 to 125 pmol/mg protein (Kalaria et al, 1988; Vannucci et al, 1997). These values reflect binding to intact microvessels and include basement membrane and pericyte contamination. We have also measured binding to isolated bovine luminal and abluminal microvascular endothelial cell membranes and observe concentrations of 620 and 280 pmol/mg membrane protein, respectively (Simpson et al, 2001). Since CB binds to all GLUT isoforms, binding assays of whole brain fractions yield total GLUT values, that is both 55 and 45 kDa GLUT1, GLUT3, and even GLUT4, although in much lower concentrations (Kalaria et al, 1988; Maher and Simpson, 1994; Maher et al, 1994; Simpson and Davies, 1994). Such studies have revealed total transporter concentrations of 7 and 18 pmol/mg protein for human and rat brain, respectively. To delineate further GLUT1 and GLUT3 concentrations in whole brain samples, we employed a bis-mannose photolabel which, on photoactivation, covalently modifies the transporter proteins with a radioactive tag 2-N-4[3H](1-azi-2,2,2 trifluroethyl)benzoyl-1,3-bis-(mannose-4yloxyl)-2-propylamine ([3H] ATB-BMPA) (Maher and Simpson, 1994). The different transporter isoforms were then isolated by immunoprecipitation and the quantity of radioisotope was determined. Using this approach, we concluded that the levels of (55 +45) GLUT1 = GLUT3; 55 kDa GLUT1, 2.3 to 2.5; 45 kDa GLUT1, 6.9 to 7.7; GLUT3, 8 to 11 pmol/mg protein (Maher and Simpson, 1994; Vannucci et al, 1997).
The catalytic properties of GLUT1 have been studied most extensively in human red blood cells, where cellular homogeneity and uniform cell size permit a level of accuracy in transport determinations, which is not always possible with other cells. Human red cells are replete with the glucose transport protein GLUT1, containing approximately 2,000 copies/μm2 (Gorga and Lienhard, 1982). At subphysiologic temperatures (0°C to 24°C), GLUT1-mediated glucose transport is rapid and asymmetric (Lowe and Walmsley, 1986). Asymmetry describes the relationship between Km and Vmax parameters for net glucose uptake and exit (Miller, 1968; Widdas, 1980). At 24°C, Vmax and Km for D-glucose exit into glucose-free medium are approximately fourfold greater than the equivalent parameters for
where [Glc] represents either intra- or extracellular glucose levels. Provided that the ratio Vmax/Km for exit = Vmax/Km for entry, the rate of glucose exit and entry will be identical at identical, subsaturating intra- and extracellular [Glc]. Glucose transport in cytosol-depleted human red cell ghosts is symmetric, that is Vmax and Km for D-glucose entry increase to match the equivalent parameters for exit (Carruthers, 1986; Carruthers and Melchior, 1983; Helgerson et al, 1989). In human erythrocytes, the GLUT1 activity is modulated by ATP, which interacts allosterically to transform the intrinsically symmetric carrier into an asymmetric carrier (Carruthers and Helgerson, 1989; Levine et al, 1998). Transport measurements in red cell ghosts show that the rate of net cellular export of 10 mmol/L glucose into saline containing 3 mmol/L glucose is inhibited 50% by intracellular ATP (i.e., when transport is asymmetric). Thus red cells serve as less efficient glucose carriers when metabolically replete, but efficiently transfer intracellular glucose to surrounding tissues when demand for glycolytic ATP is increased (Carruthers, 1986, Cloherty et al, 1996; Heard et al, 2000). Although not yet specifically shown, this may apply to other GLUT1-expressing cells, such as BBB endothelial cells and astrocytes. Glucose transporter1 transport asymmetry in erythrocytes declines from 12-fold at 4°C to 4-fold at 24°C to 1.3-fold at 37°C (Lowe and Walmsley, 1986).
Glucose transporter3-mediated glucose transport is less extensively characterized than GLUT1-dependent transport. When expressed in Xenopus oocytes, GLUT3-mediated glucose transport shows high-affinity glucose transport relative to GLUT1 and GLUT2 (Colville et al, 1993; Rumsey et al, 1997). Glucose transporter3-mediated transport in primary cultures of rat cerebellar granule cell neurons is characterized by high-affinity, high-capacity zero-trans glucose uptake (i.e., into cells that contain zero-glucose) at 24°C (Maher et al, 1996). kcat for GLUT3-mediated glucose transport (Vmax/[GLUT3]cell surface = 880/sec) is significantly greater than GLUT1 kcat at 24°C (151/sec; Lowe and Walmsley, 1986). If the observed 7.4-fold increase in GLUT1 kcat for net glucose import between 24°C and 37°C (Lowe and Walmsley, 1986) is also observed with GLUT3, then kcat for GLUT1 and GLUT3 at 37°C are 1,116 and 6,512/sec, respectively (see Table 1). Interestingly, recent tissue culture studies of Barros and colleagues used the glucose analogs [2-[N-(7-nitrobenz-2-oxa-1, 3-diazol-4-yl)amino]-2-deoxyglucose (2NBDG) and 6-[N-(7-nitrobenz-2-oxa-1,3-diazol-4-yl)amino]-6-deoxy-glucose (6NBDG), which are transported very slowly, to show that glutamate can reciprocally inhibit glucose uptake in neurons while promoting transport in astrocytes; the mechanism(s) by which these modulations are achieved, that is alterations in kcat or Km, and confirmation that they occur in vivo remain to be established (Loaiza et al, 2003; Porras et al, 2004). Although the fluorescent sugars are generally considered to be very poor substrates for GLUT1 (Cloherty et al, 1995), the authors show that NBDG transport is inhibited by the glucose transport inhibitor CB. However, CB also inhibits the nucleoside transporter ENT1 (Leitch and Carruthers, unpublished), and ENT1 is known to modulate glutamatergic neurotransmission in the rat spinal dorsal horn (Ackley et al, 2003) raising the possibility that NBDG transport is not mediated solely by the GLUTs.
Monocarboxylate Transporters
The MCTs comprise the gene family SLC16, which has 14 members (Halestrap and Meredith, 2004). However, of these 14 family members, only MCT1 to 4 have been definitively shown to transport metabolically relevant monocarboxylic acids such as lactate, pyruvate, and the ketone bodies acetoacetate and β-hydroxybutyrate (Halestrap and Meredith, 2004; Hertz and Dienel, 2005; Pierre and Pellerin, 2005). Moreover, as illustrated in Figure 1, all four are found in brain although MCT3 expression is limited to choroid plexus, and the pigment epithelial cells of the retina where it is abundant (Philp et al, 2001). The localization and kinetic characteristics of the MCTs in brain has been the subject of several recent reviews, and therefore we will present only a brief synopsis here (Halestrap and Meredith, 2004; Hertz and Dienel, 2005; Pierre and Pellerin, 2005).
MCT1
The expression of MCT1 mRNA and protein are strongly developmentally regulated in the rodent brain. Early in postnatal development, MCT1 mRNA is widely expressed in all cell types, although the protein expression, particularly in neurons, appears more limited (Gerhart et al, 1997; Hanu et al, 2000; Leino et al, 1999; Pierre and Pellerin, 2005; Pierre et al, 2000; Vannucci and Simpson, 2003). This robust expression early in development coincides with the period of suckling and active ketogenesis in the rodent, and probably facilitates transport and utilization of ketone bodies (Hawkins and Biebuyck, 1979; Nehlig and Pereira de Vasconcelos, 1993; Vannucci and Simpson, 2003). The relation between MCT1 expression, circulating ketone body concentrations, and cerebral utilization is most closely seen in the cerebral microvessels in which MCT1 expression reaches a peak at postnatal days 14 to 17, before decreasing to relatively low, adult levels by postnatal day 27. The levels of MCT1 mRNA increase with development in astrocytes and decline in neurons, the MCT1 protein concentration in the parenchyma remains remarkably constant as the brain grows and develops (Vannucci and Simpson, 2003).
Glucose and lactate transport capacities of brain cells
GLUT, glucose transporter; MCT, monocarboxylate transporters.
Cell in which transport is measured.
Measured or computed maximum rate (Vmax) or affinity (Km) for transport. Vmax parameters assume endothelial, astrocyte, and neuronal cell volumes are those typically observed in culture (2 pL). Red cell volume is 90fL.
The substrate employed in transport (Glucose (Glc), 3-O-methylglucose (3MG) or lactate) or ligand GLUT quantitation experiments (Cytochalasin B (CB) binding).
Computed kcat ([Vmax/[GLUT])for transport.
Predicted Vmax for transport of glucose and lactate for use in the model. Endothelial, astrocyte, and neuronal cell volumes are 1.35, 22.7, and 39 fL, respectively.
Assumes 1 mg membrane protein is equivalent to a surface area of 2.4 × 1011 μm2.
Assumes that the ratio of membrane/total cellular protein is 0.0462:1.
Measured at 25°C.
Computed for transport at 37°C assuming that GLUT3 and GLUT1 share the same temperature dependence.
Direction basal lamina to astrocyte.
Direction interstitium to astrocyte. Glucose transport parameters in endothelial cells, astrocytes, and neurons were computed using estimated cell membrane GLUT contents and measured kcat parameters. MCT concentrations are estimated assuming MCT kcat = GLUT1 kcat and using measured Vmax values.
MCT2
The extent of MCT2 expression is species-specific because, while widely expressed in rodents, expression in human tissue is very restricted (Halestrap and Meredith, 2004). In brain, initial in situ hybridization studies suggested that MCT2 was expressed almost exclusively in neurons (Gerhart et al, 1998; Koehler-Stec et al, 1998; Pellerin et al, 1998) and was detected in cultured neurons by immunohistochemistry as early as 1997 (Broer et al, 1997). However, it was not until 2002 that MCT2 protein expression was definitively localized to neurons in intact brain. These and subsequent studies have shown MCT2 to be extensively expressed in dendrites and associated with postsynaptic densities (Bergersen et al, 2005; Pierre et al, 2002; Pierre and Pellerin, 2005). Unlike MCT1, MCT2 mRNA and protein expression show little developmental response to changes in ketone body utilization (Vannucci and Simpson, 2003). Rather, the developmental expression of MCT2 is similar to that of GLUT3, in that it increases in concert with cerebral maturation, synaptogenesis, and increases in glucose utilization.
MCT4
MCT4 has been extensively characterized in highly glycolytic muscle, where it is responsible for lactate export. It is also expressed in chondrocytes, white blood cells, and in placenta, where it exports lactate from the fetal circulation (Halestrap and Meredith, 2004). In rodent brain, MCT4 is widely distributed, yet appears to be localized exclusively to astrocytes (Bergersen et al, 2002; Rafiki et al, 2003).
Kinetics of MCT
The most definitive data on the kinetics of MCT1 were obtained from studies on human erythrocytes conducted long before the gene was cloned (for review see Poole and Halestrap, 1993). These studies revealed that the transport of lactate proceeds by an ordered mechanism in which one proton binds to the transporter followed by one molecule of lactate, the protein undergoes a conformational change, and the lactate and then the proton are released on the other side of the membrane (Deuticke, 1982; Dubinsky and Racker, 1978; Leeks and Halestrap, 1978). The Ks for the proton is 0.2 μmol/L, which is equivalent to a pH of 6.7; the Km for L-lactate when measured by zero-trans uptake ranges from 4 to 13 mmol/L (depending on pH); the Km for efflux is 10.5 mmol/L (De Bruijne et al, 1983; Deuticke, 1982, 1989). As with the glucose transporter GLUT1, influx or efflux is accelerated by the presence of substrate on the opposite side of the membrane, that is ‘trans acceleration’ (Deuticke, 1982). Subsequent studies in which MCT1 was expressed in Xenopus oocytes confirmed Km for pyruvate (0.7 mmol/L), L-lactate (3 to 5 mmol/L), acetoacetate (4 to 6 mmol/L), and β-hydroxybutyrate (10 to 12 mmol/L (Broer et al, 1998; Manning Fox et al, 2000)) (see Table 1).
Expression of MCT2 in Xenopus oocytes revealed it to be a proton-driven MCT with a much greater affinity for lactate and pyruvate than MCT1, 3, and 4, with Km of 0.7 and 0.1 mmol/L, respectively (Broer et al, 1999; Dimmer et al, 2000; Lin et al, 1998). Kinetic analysis of MCT4 differs from that of MCT1 and MCT2, in that MCT4 has a higher affinity for lactate than pyruvate, although affinity for both substrates is significantly lower than that of MCT1 to 3, with rat MCT4 having a Km for lactate and pyruvate of 28 and 150 mmol/L, respectively, when expressed in oocytes (Manning Fox et al, 2000).
Several studies have been conducted to measure monocarboxylate transport in cultured neurons and astrocytes; however, in all studies, the simultaneous expression of more than one MCT isoform precludes a precise determination of activity of a given isoform. It is not surprising that MCT 1 is co-expressed with MCT2 in neuronal cultures, as most are prepared from embryonic or early postnatal brains where MCT1 is much more widely expressed. In some studies with neurons and synaptosomes, a low Km for L-lactate (0.66 to 0.68 mmol/L) has been observed in both, with corresponding Vmax values of 3.4 and 4.2 nmol/min per mg of protein, respectively (McKenna et al, 1998; Nedergaard and Goldman, 1993). However, in both studies, a second transport activity with a lower affinity and higher Vmax activity was also observed which would appear more consistent with MCT1 expression. In other studies, no high-affinity uptake was observed (Dringen et al, 1995). In the case of astrocytes, the wide range of Km (7 to > 15 mmol/L) and Vmax (174 to 250 nmol/min per mg) values that have been observed can probably be attributed to the relative extents to which MCT1 and MCT4 are expressed in the particular culture (Broer et al, 1997; Manning Fox et al, 2000; Tildon et al, 1993).
Effects of pH on Kinetics of MCT
MCT1-catalyzed electroneutral proton-lactate co-transport is insensitive to membrane potential (Broer et al, 1998), but is sensitive to pH. At 4 mmol/L intracellular and 1 mmol/L extracellular lactate, net lactate export (computed using the general cotransport equation suggested by Stein (1986a) increases 1.4-fold (pHi = pHo) or 1.9-fold (pHo = 7.2), when intracellular pH decreases from 7.2 to 6.8. As intracellular lactate increases above Km(app) (4 mmol/L), the effect of pH on net exit diminishes greatly.
MCT2-catalyzed electroneutral proton-lactate cotransport is also insensitive to membrane potential and is much less sensitive to pH at physiologic [lactate] (Broer et al, 1998). Thus at 1 mmol/L [lactate] or greater (i.e., when [lactate] >Km(app)), net lactate uptake is unchanged by extracellular pH in the range 5.5 to 7.5. These considerations indicate that while lactate-proton cotransport is influenced by intra- and extracellular pH, the overall impact of altered pH at physiologic [lactate] and pH is very small. Given the uncertainties associated with modeling pH changes and the observation that lactate transport is not greatly affected by pH, we made the simplifying assumption that intra- and extracellular pH are equal and constant.
Model for Glucose and Lactate Flows in the Mammalian Brain
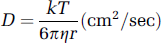
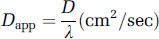
Having established the concentrations and kinetic parameters of the individual GLUTs and MCTs (Table 1), the objective of this review was to develop a new model of nutrient transport in the mammalian brain that incorporates these parameters. Figure 3A is an electronmicrogaph (EM), which depicts a typical cross-section through a microvascular endothelial cell and the adjacent parenchyma, indicating the proximity of the astrocytic endfeet and the neurons to the endothelial cell. Figure 3B is another EM, which depicts the potential diffusible spaces or compartments that need to be included in the kinetic model. The critical experimental component of Figure 3B is the inclusion of horseradish peroxidase, which was infused into the lateral ventricle, and clearly delineates the diffusible spaces (Brightman and Reese, 1969). The importance of this early study is the demonstration of the accessibility of the basement membrane, or more completely the basal lamina, to relatively large molecules. Thus, it is clear that smaller molecules, such as lactate and glucose, will also enter and readily diffuse within this space, and rapidly distribute along the entire basal lamina providing an effective conduit to both neurons and astrocytes. The basal lamina is an integral component to the model we propose to describe the passage of glucose and lactate into neurons and glia (Figure 3C).
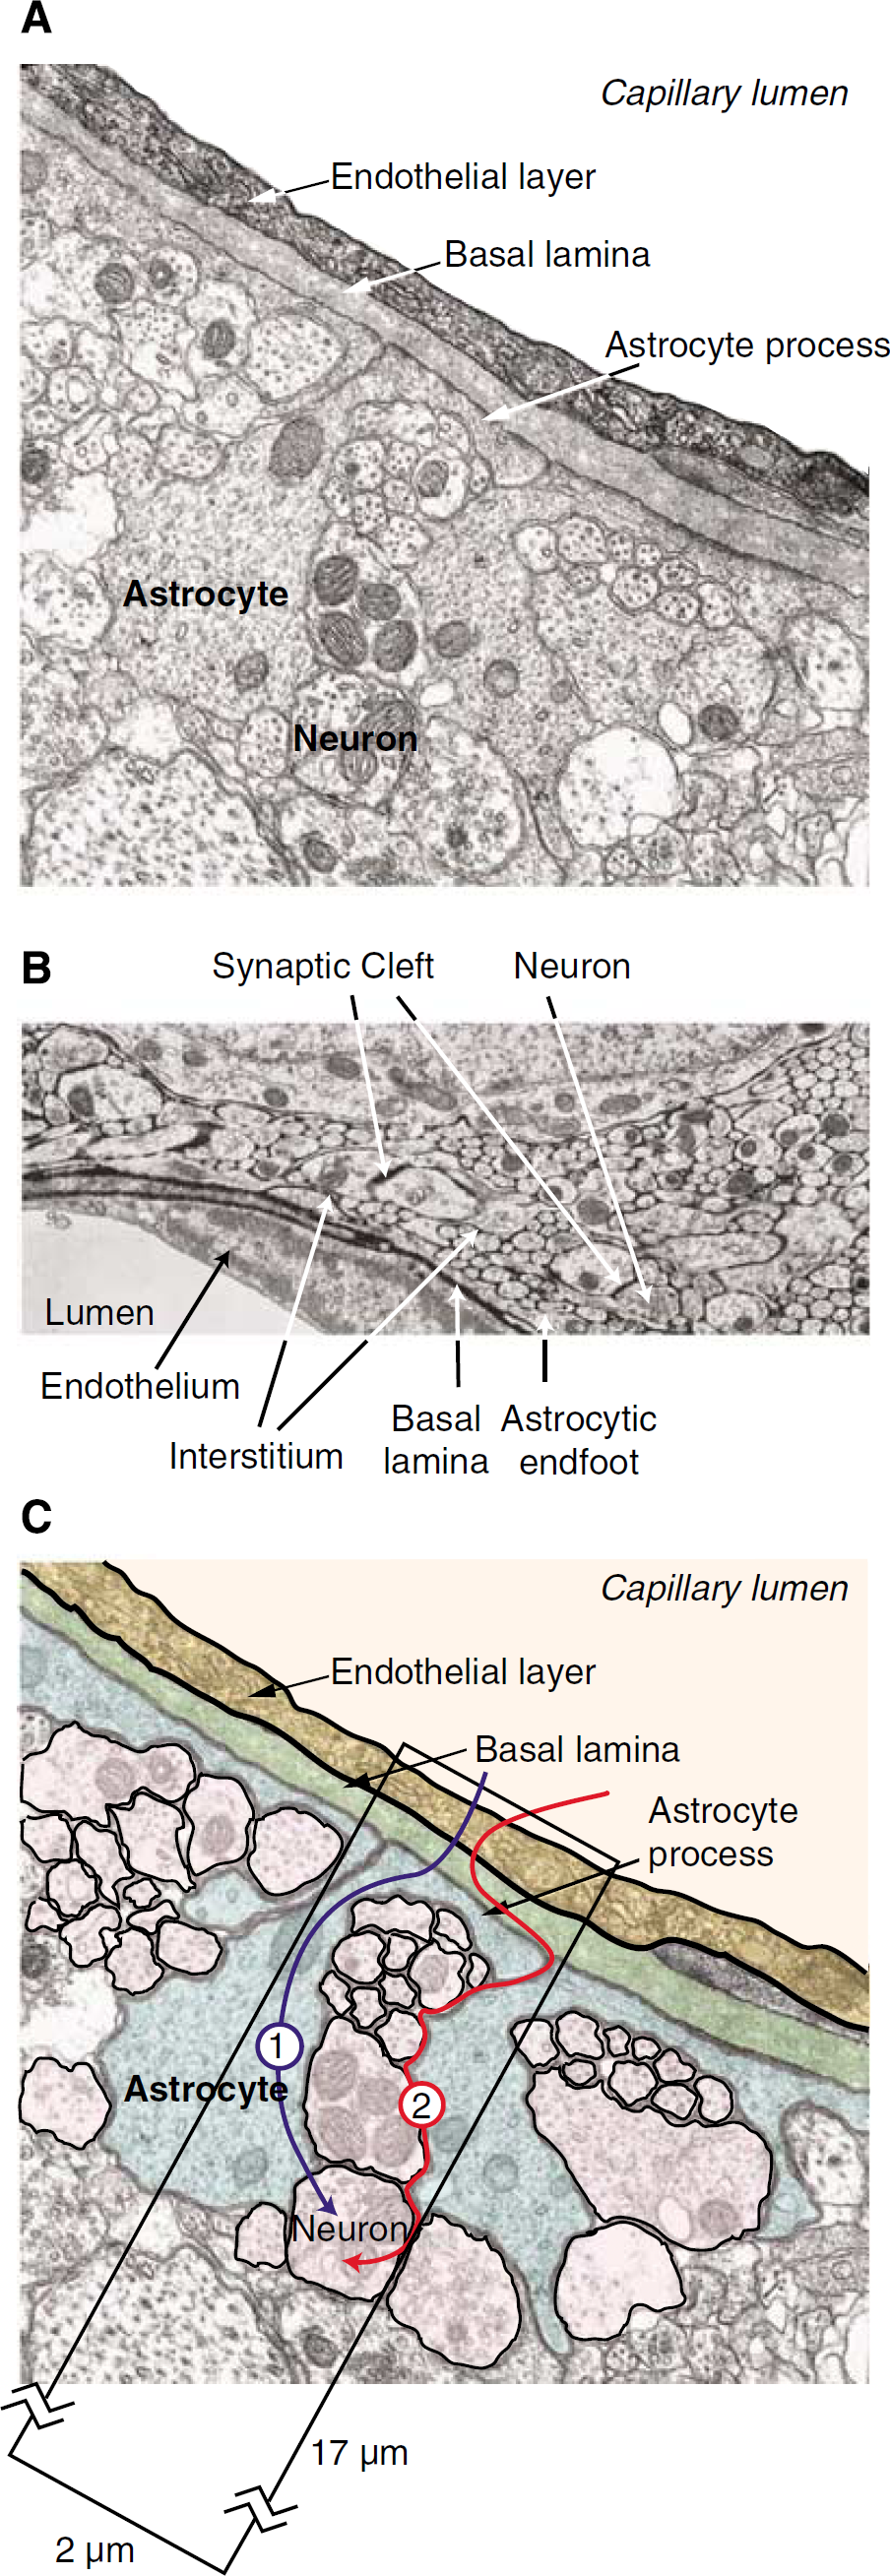
Electron micrograph depiction of barriers and pathways for solute delivery from serum to brain. (
As depicted in Figure 3C, glucose enters the mammalian brain and equilibrates with the basal lamina via rapid facilitated transport across the endothelial cell layer of the BBB. We model two potential outcomes from this point. Pathway 1, which does not include diffusion through the basement membrane, shows glucose entering the astrocyte where it can be converted into lactate as proposed by the ANLS hypothesis (Magistretti and Pellerin, 1997), and subsequently transported into the interstitium. Another possibility within pathway 1 is that glucose enters the astrocyte, traverses the cell, and is transported out, unchanged, into the interstitium. Lactate or glucose can then be transported into adjacent neurons. An alternative hypothesis is posed by pathway 2 of Figure 3C, which proposes that basal lamina glucose diffuses freely into the astrocytic endfoot and the interstitium, whence it is transported directly into astrocytes and neurons. The purpose of our model building is to examine these hypotheses by application of transport theory.
Mass Transport of Glucose and Lactate
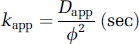
Two mass transport processes are considered, free diffusion and carrier-mediated facilitative transport. The free diffusion of glucose is analogous to Stokesian diffusion of small molecules in aqueous solution in which the diffusion coefficient, D, is given by
where k is the Boltzman constant, T the temperature (°K), η the viscosity of the solvent, and r the molecular radius of glucose. The tortuosity of the brain's extracellular space (λ) represents the hindrance imposed on diffusing molecules by the tissue in comparison with an obstacle-free medium (Hrabetova and Nicholson, 2004). A value of 1 would indicate an absence of such hindrance. The apparent diffusion coefficient (Dapp) for molecular self-diffusion in the brain is thus given by
where λ has been measured experimentally to be 1.6 (Hrabetova and Nicholson, 2004). This value is significantly greater than the 1.25 that would have been predicted based on their model building and reflects the so-called ‘dead-end spaces,’ which lead to a restriction of specific flow. The value of 1.6 refers to diffusion within cortex; greater values have been reported for hippocampus and cerebellum, and in pathological situations such as ischemia (Nicholson, 2005; Tao et al, 2005, 2002; Tao and Nicholson, 2004). However, even with the experimentally determined limitations, it is clear that small molecules, such as glucose and lactate, can rapidly diffuse throughout the interstitium, as illustrated in Figures 3A and 3B. The rate constant (kapp) for molecular diffusion between two points (separated by φ cm) in space is given by:
Thus for D-glucose (D = 7 × 10⁻⁶cm2sec at 37°C), Dapp = 4.4 × 10⁻⁶cm2 per sec and kapp for diffusion across 25 × 10−6cm (the average midpoint between adjacent brain capillaries (Jucker and Meier-Ruge, 1989; Pawlik et al, 1981) is 0.7/sec (t1/2 = 1 sec). An important question concerns small molecule diffusion between cells. As illustrated in Figure 3B, the distribution of horseradish peroxidase clearly shows that the marker equilibrates throughout the interstitial space, up to and including the basal lamina. This suggests that molecular diffusion of horseradish peroxidase (MW = 40,000) and, by inference, of D-glucose (MW = 180.16) between astrocytes is not limiting. Given that a first-order process is more than 92% complete within four half-lives, the data above suggests that in the absence of glucose consumption, basal lamina and interstitial glucose attain 92% equilibration within 4 secs. The rapidity of this diffusion defines pathway 2.
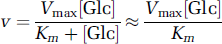
Analyses of steady-state, carrier-mediated glucose transport typically address two specific transport conditions: zero-trans and equilibrium exchange transport (Lieb and Stein, 1972). In zero-trans transport, glucose is absent at the opposite or trans-side of the membrane, while it is varied at the originating or cis-side of the membrane. Thus, for zero-trans entry, intracellular glucose is absent and extracellular glucose is varied to obtain Vmax and Km(app) for zero-trans entry. In equilibrium exchange, intracellular [Glc] = extracellular [Glc] and radio-tracer glucose is added at zero-time to initiate the transport measurement. The rate constant for radio-tracer equilibration is measured as a function of unlabeled [Glc] to obtain Vmax and Km(app) for equilibrium exchange.
Mathematical descriptions of carrier-mediated passive transport reduce to a single equation comprising constants derived from these measurements of Vmax and Km(app) (Carruthers, 1991; Stein, 1986a). These constants include an affinity term (K) and four resistance terms (Roo, Ree, Rio, and Roi), where R is defined as the inverse of Vmax. Three of these resistance terms (Ree, Rio, and Roi) are measured directly as 1/Vmax for equilibrium exchange, zero-trans exit, and zero-trans entry, respectively. For example, if Vmax for zero-trans D-glucose uptake in primary, neuronal cultures were measured as 32 pmol/106 cells/sec, Roi for transport would be 1/Vmax, which is 3.1 × 10⁸ secs per 106 cells/mol. If Vmax for zero-trans D-glucose uptake in primary astrocytic cultures were measured as 9 pmol/106 cells/sec, Roi for transport would be 1/Vmax which is 11 × 108 secs per 106 cells/mol. Thus the resistance term R is inversely related to Vmax; the greater the resistance parameter, the lower the cellular glucose transport capacity.
The transport equation is

with the constraint Roo = Roi + Rio–Ree, where Glc is glucose concentration, o and i refer to extra- and intracellular, respectively, and where Voinet is the steady-state rate of net glucose transport in the direction of extracellular to intracellular. Because the resistance terms are related to Vmax for transport, this transport equation describes both cellular affinity (K term) and capacity (R terms) for glucose transport. The equation for lactate transport includes a multiplicand [H+] term associated with each [lactate] term (see Appendix Table A2 and Carruthers, 1991; Stein, 1986a), but we assume that [H+]i=[H+]o = 63 nmol/L (pH 7.2).
Table 1 presents transporter concentrations, kcat, Vmax, and Km parameters for glucose and lactate transport by endothelial cells, astrocytes, and neurons at 37°C. Appendix Table A3 summarizes R and K parameters for glucose and lactate transport by endothelial cells, astrocytes, and neurons at 37°C. In some instances, such as lactate transport and red cell and neuronal glucose transport, constants are computed directly from measurements of Vmax for transport. Alternatively, when measuring glucose transport in endothelial cells, astrocytes, and neurons, identification of the cell membrane GLUT species (e.g., GLUT1 or GLUT3) and determination of the respective concentrations (based on CB binding measurements) are sufficient to compute R parameters. Although lactate transport is mediated by H+ /lactate symport (Halestrap and Meredith, 2004; Halestrap and Price, 1999), we cannot describe all transmembrane proton gradients with an acceptable degree of confidence. We thus model lactate transport as lactate/H+ symport in the absence of a transmembrane H+ gradient. MCT kcat is not known because cell surface [MCT] has not been measured in cells where lactate transport has been quantified. MCTs are members of the major facilitator superfamily of transport proteins (Saier et al, 1999) and kcat may approach that of GLUT1 (another major facilitator superfamily protein). We, therefore, assigned each MCT a kcat value identical to that of GLUT1 (1,166/sec). In support of this assumption, it should be noted that Vmax for lactate transport in human red cells (0.13 nmol/million cells per min; Pattillo and Gladden, 2005) is approximately 100-fold lower than Vmax for lactate transport in rabbit red cells, which contain approximately 0.5 nmol/mg membrane protein, which corresponds to approximately 160,000 copies of MCT protein (Jennings and Adams-Lackey, 1982). This suggests that MCT kcat= 1,000/sec, in good agreement with our designation of 1,166/sec.
Cellular Glucose Transporter Concentrations
Examination of Table 1 reveals that the capacity (Vmax) of GLUT1 in the microvascular membranes of the BBB is dramatically higher than in either the astrocyte or neuron. These determinations of transport capacity come from measurements of CB binding to membranes isolated from neurons, astrocytes, and endothelial cells (Vannucci et al, 1997) and from transport measurements (Maher and Simpson, 1994; Maher et al, 1991, 1994). As discussed above, high-affinity CB binding to endothelial cells, astrocytes, and neurons is a good measure of the GLUT content of membranes from these cells because glucose uptake is quantitatively inhibited by CB in each of these systems. Thus, astrocytes contain 5.8 to 7.3 pmol CB binding sites/mg membrane protein (Keller et al, 1986; Vannucci et al, 1997); endothelial cells contain 400 pmol CB binding sites/mg membrane protein (Simpson et al, 2001); neurons contain 9.5 pmol CB binding sites/mg membrane protein (Maher et al, 1996). On the basis of CB binding content and glucose transport capacity of rat cerebellar granule neurons, and the identity of their major glucose transport species as GLUT3, Maher et al (1996) conclude that GLUT3 kcat is some eightfold greater than GLUT1 kcat. While the neuronal CB binding capacity is comparable to that of the astrocyte, the kinetic parameters of GLUT3 (Km = 2.8 mmol/L; kcat = 6,512/sec) result in an overall increase in glucose transport capacity relative to GLUT1-expressing astrocytes (Km = 8 mmol/L; kcat = 1,166/sec). In view of these numbers, the glucose transport capacity of membranes isolated from neurons is at least ninefold greater than that of astrocytic membranes at 5 mmol/L [Glc].
Geometries and Metabolism
To examine this further, we next consider brain ‘geometry,’ cellular composition, and cellular metabolic profiles. Our model assumes a simple 2 × 2 × 17 μm section into the brain from the capillary lumen (Figure 3C). Dimensions are arbitrary but are based on the observations in rat cortex that (1) neurons occupy 49%; (2) astrocytes occupy 25%; (3) interstitial space is 20% of the brain volume (Hrabetova and Nicholson, 2004; Maher and Simpson, 1994). Cell volumes, plasma membrane protein (GLUT1, GLUT3, and so on) contents, and cell total protein content are based on previously measured parameters obtained with neurons, astrocytes (Maher et al, 1996; Vannucci et al, 1997), and human red cells (Carruthers, 1986). Our calculations assume: (1) cell protein content = 10% cell mass; (2) primary cultures of neurons are composed of cells of average volume = 2 pL; (3) red blood cells surface area = 144 μm2; (4) red blood cells volume = 90 fL; (5) neuron GLUT3 content = 9.5 pmol/mg membrane protein; (6) neurons in primary culture contain 20 μg total protein per 106 cells (Maher et al, 1996). Table 1 summarizes our calculations of endothelial, neuronal, and astrocytic GLUT contents.
Metabolic activity is modeled assuming simple one-step Michaelis—Menten steady-state kinetics for glucose conversion to lactate and simple one-step Michaelis—Menten steady-state kinetics for lactate conversion into CO2. For example, glucose conversion to lactate is described by
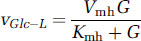
where Vmh is Vmax for conversion of one glucose molecule into two lactate molecules, and Kmh is Km(app) for phosphorylation of glucose by hexokinase (≈40 μmol/L glucose (Whitesell et al, 1995; Wilson, 2003). Glycolysis and oxidative metabolism are known to be more complex than these simplifications allow; for a comprehensive analysis of astrocytic and neuronal glucose metabolism see Aubert and Costalat (2005). However, these expressions are not introduced to simulate the detailed regulation of metabolic flow. Rather they are used to permit a simple but saturable flow of glucose and lactate into glycolytic and oxidative pathways, respectively. During neuronal stimulation, glycolysis in neurons and/or astrocytes is modeled to undergo a brief (45 secs) three to fourfold increase. This is preceded by a shorter (25 secs) 1.4-fold increase in neuronal and astrocytic lactate oxidation.
Several studies have reported relative rates of glucose and lactate transport and metabolism in neurons and astrocytes. In mice, rats, and humans, the brain metabolizes glucose at an average rate 80, 74, and 100 μmol/100 g brain per min, respectively (Brown and Lorden, 1989; Choi et al, 2001; Itoh et al, 2001). The ratio of net glucose uptake/glucose metabolic capacity is 2.7 ± 0.1 (Choi et al, 2001). In our primary model, outlined in Figures 4–6, blood levels of glucose and lactate are assumed to be 6 mmol/L and 1 mmol/L, respectively, and the simulated sum of neuronal and astrocytic glucose utilization is 80 μmol/100g brain per min. The model also assumes that the ratio of steady-state glucose uptake/glucose metabolism is 1:1, the Km for simulated net glucose import is 10 mmol/L, and that glucose utilization is saturated at [Glc] greater than 0.5 mmol/L. Thus, at 6 mmol/L [Glc], the ratio of glucose import/utilization capacity is 2.7:1, which is a result consistent with the reported value of 2.7 (Choi et al, 2001).
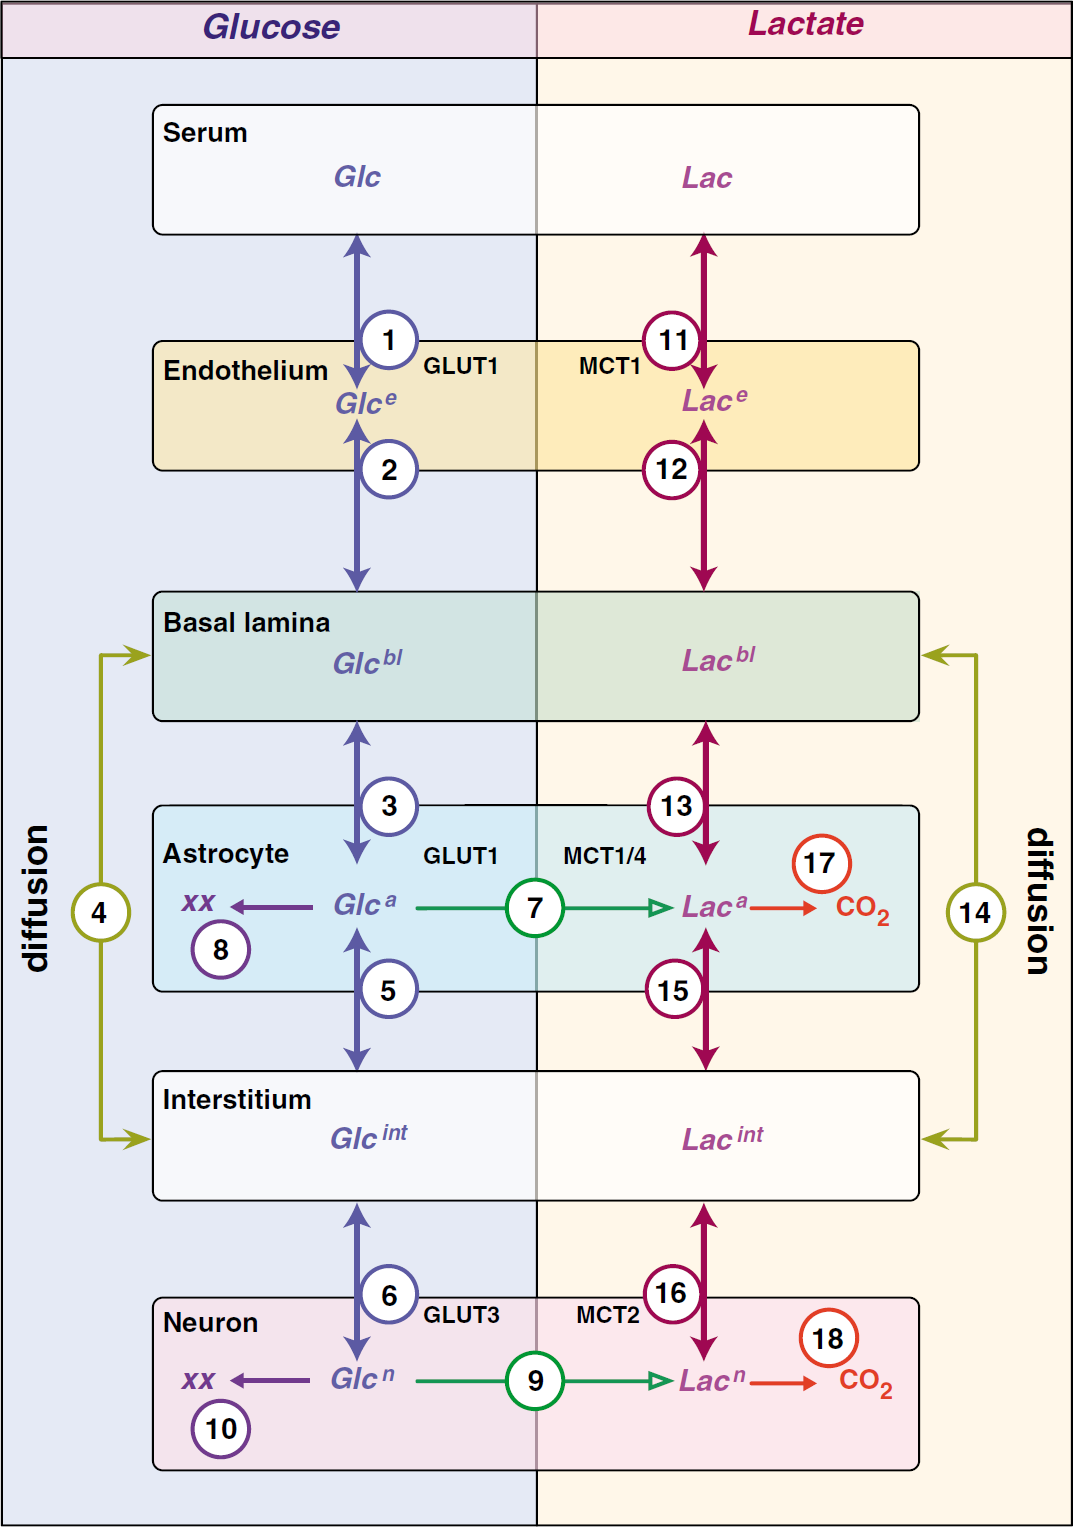
Compartment model for glucose transport and metabolism in mammalian brain. Glucose (Glc) and lactate distribute among six compartments in the brain: serum; endothelial cells; basal lamina; interstitium; astrocytes; neurons. Glc distributions are shown on the left, and lactate distributions on the right. Flows between compartments (transport is bidirectional and metabolism is unidirectional) are indicated by the arrows (double or single-headed, respectively). Each flow is assigned a number and the transport process is indicated. For example, the astrocyte shows four flows for Glc: GLUT1-mediated uptake from basal lamina (flow 3); GLUT1-mediated uptake from interstitium (flow 5); metabolic conversion to lactate (flow 7); to other metabolites (XX) such as glycogen (flow 8). Direct flow of Glc and lactate between the basal lamina and interstitium is diffusion mediated and is described by flows 4 (Glc) and 14 (lactate), respectively. The number assigned to each flow is cross-referenced in Appendix Tables A1 and A2. Appendix Table A2 presents the mass transport equation describing each individual net flow, and Appendix Table A3 describes each parameter contributing to each flow equation and the volume of each compartment.
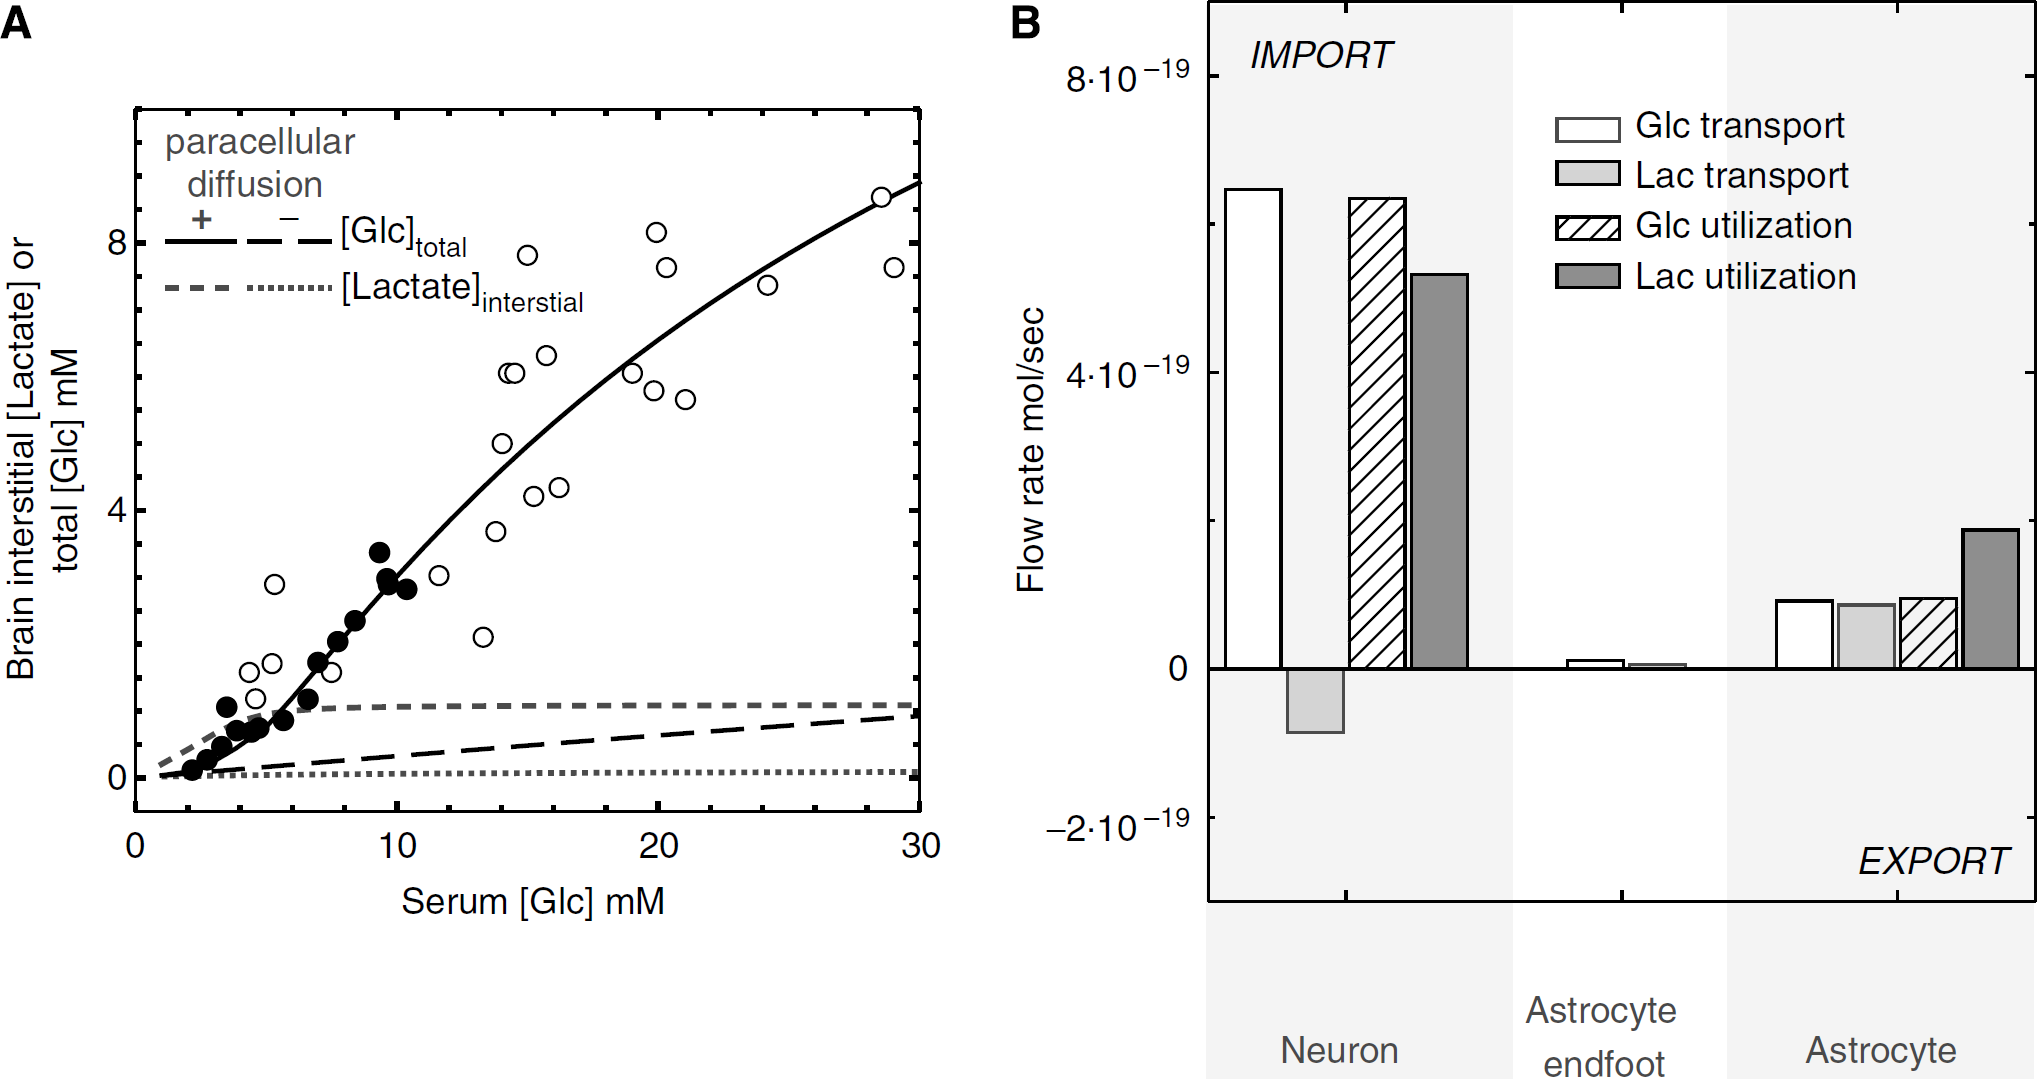
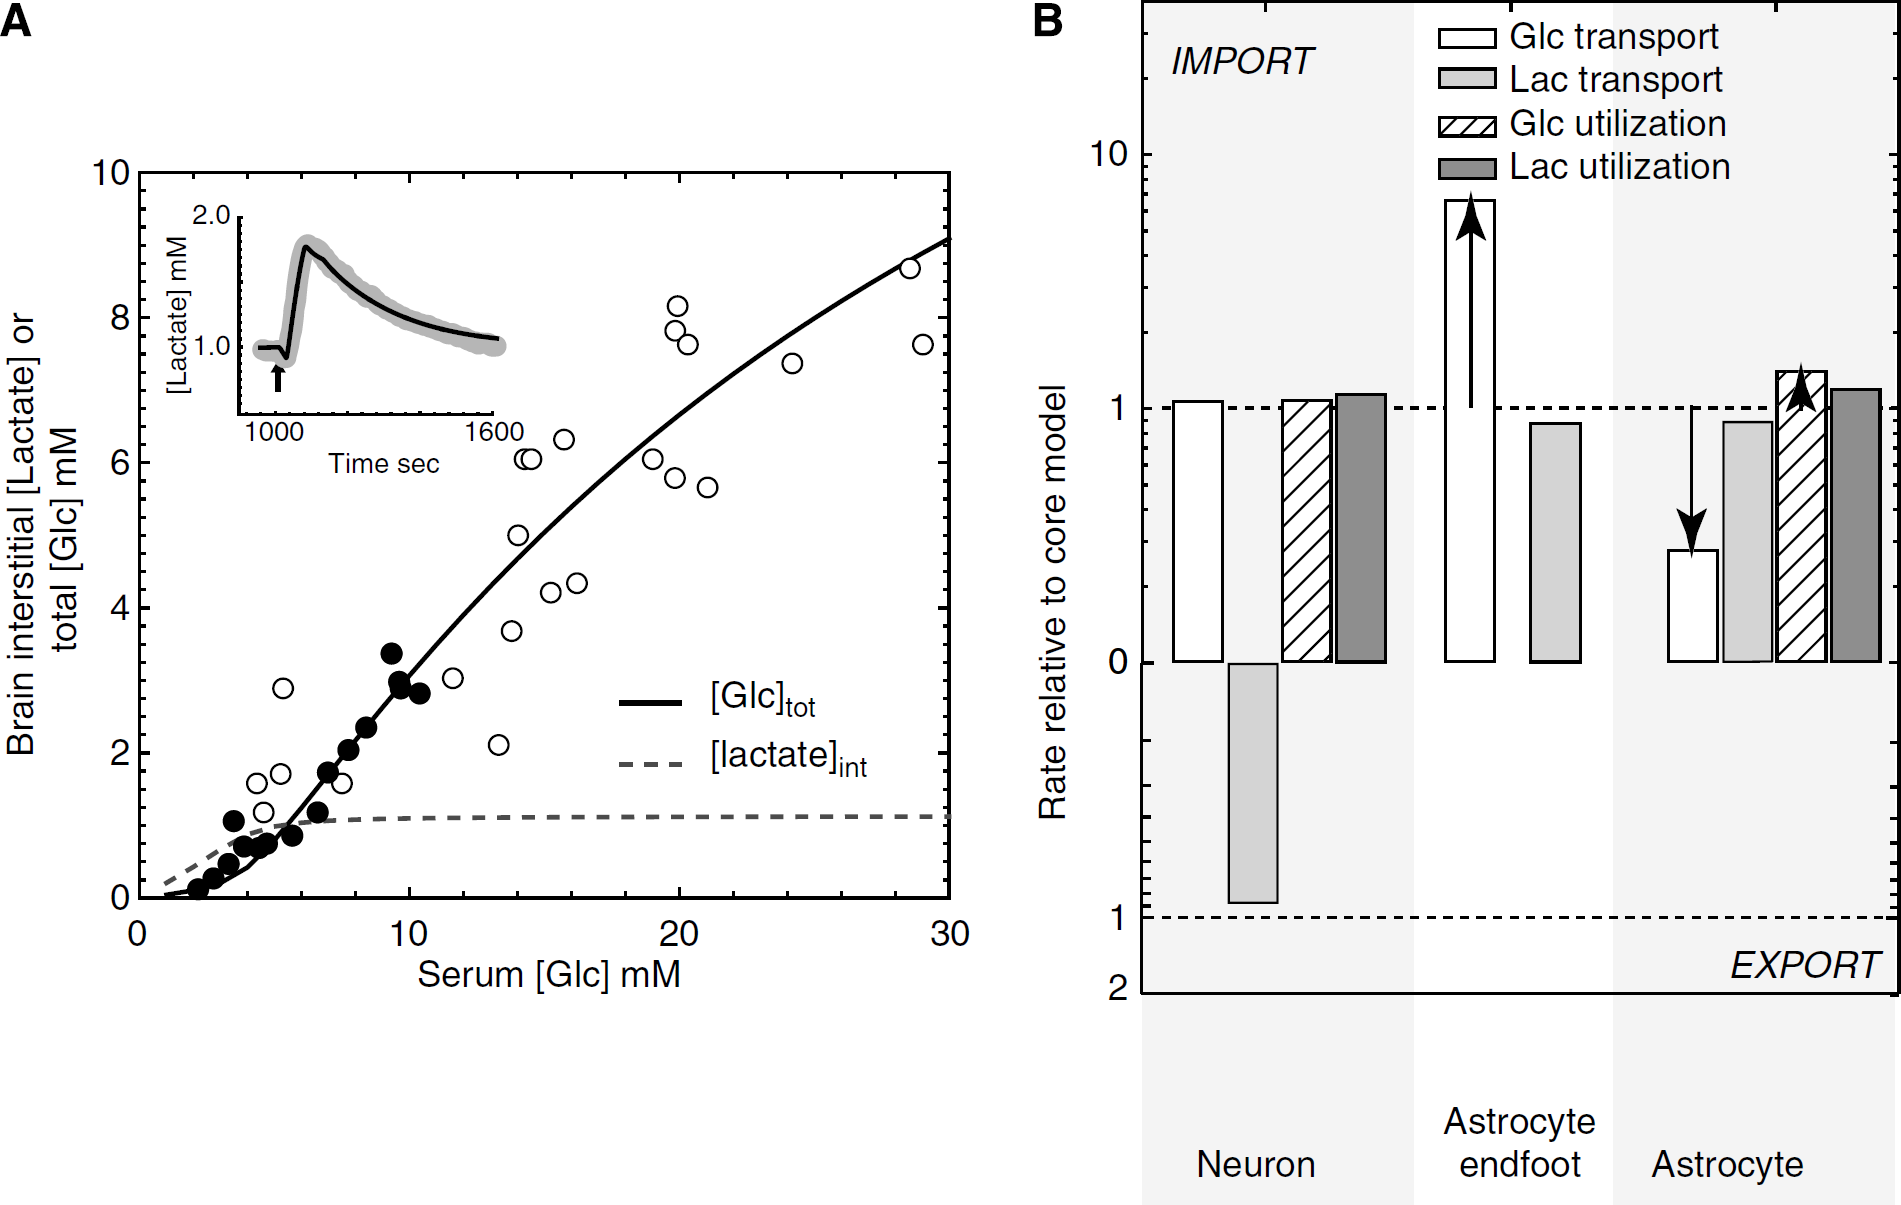
Simulations of basal, steady-state brain total glucose, and interstitial lactate versus serum glucose. (
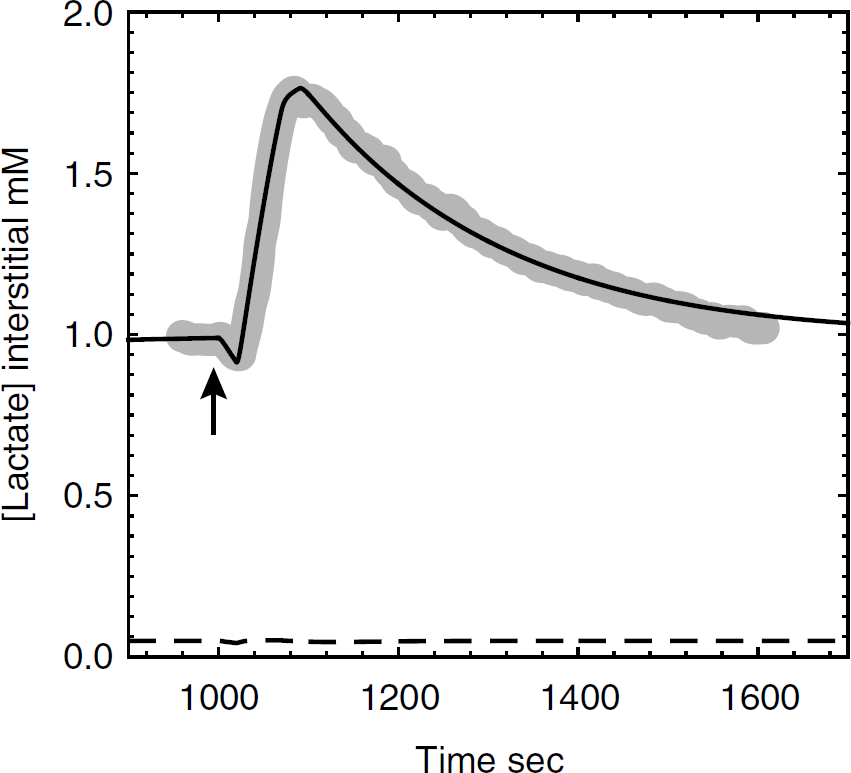
Lactate transients during neuronal stimulation. Data obtained from Hu and Wilson (1997) of extracellular measurements of lactate made during and after a short period of neuronal stimulation are depicted as the shaded line. The thin black line depicts simulated brain interstitial [lactate] (mmol/L) obtained on applying the model presented in Figure 4 with parameters summarized in Appendix Table A3. Neuronal and astrocytic lactate oxidation were simulated to undergo a 1.5-fold increase at t = 1,000 secs (duration = 25 secs) followed by a 3.2-fold increase in glycolysis at t = 1,028 secs (duration = 45 secs). Serum [Glc] and [lactate] are 6 and 1 mmol/L, respectively. Elimination of paracellular diffusion (dotted lines), causes predicted interstitial lactate levels to decrease significantly and eliminates the lactate transient.
Flows between Compartments
Figure 4 models the flow of glucose (left) and lactate (right) from serum to neurons. The transporter catalyzing each flow is indicated next to each arrow. Flows between compartments are described in Appendix Table A1, and are indexed by a number and are fully annotated in Appendix Table A2. Equation parameters are defined in Appendix Table A3.
Model simulations were performed by fourth-order Runge Kutta numerical integration using the software package Berkeley Madonna (version 8.3.12; http://www.berkeleymadonna.com). Time-dependent increases in glycolysis and lactate oxidation were simulated by introducing square-wave pulses in Vmax for glycolysis and lactate oxidation. The model is available as a text file of differential equations and is accessible via a link in the Supplementary data.
Simulations and results
Using the proposed model, we posed the following questions:
What are the predicted steady-state brain glucose and lactate levels, and how do these compare with observed values? What is the net effect of diffusion through the basal lamina on glucose uptake into the brain, that is net flux via pathway 1 versus pathway 2, as depicted in Figure 3C? What is the effect of neuronal activity on lactate transients in the brain? What are the relative astrocytic and neuronal contributions to these lactate levels? What properties of the model must be altered to simulate the predictions of the ANLS hypothesis?
Brain glucose levels represent a net balance between glucose uptake from the circulation (serum) and glucose metabolism to lactate, CO2, and other metabolites, as well as glucose transport back to the circulation. Glucose movements between cerebrospinal fluid and interstitium are not considered here. The baseline parameters of the model are summarized in Table 1 and Appendix Table A3. These parameters fall into three categories: (A) transport capacities/affinities; (B) glucose utilization capacities; (C) lactate utilization capacities. The core model uses previous estimates of cellular GLUT and MCT contents, and transport measurements to establish transport capacities and affinities. The values in Table 1 and Appendix Table A3 support the following statements: (1) neurons transport glucose with 12-fold greater capacity (Vmax) than do astrocytes; (2) lactate transport capacities of neurons and astrocytes are very similar; (3) neuronal and astrocytic glycolysis and glucose transport are related through a ‘glycolytic coupling factor’ (GCF), which is proportional to VhRoi or Vmax for glucose utilization/Vmax for zero-trans glucose uptake. GCF prevents the ratio for total brain glucose import/glycolytic capacity from decreasing below 2.7:1 (Choi et al, 2001); this is important because experimental brain total glucose levels of 9 mmol/L observed at 30 mmol/L serum glucose (Choi et al, 2001; Gruetter et al, 1998) would not otherwise be possible; (4) lactate utilization is proportional to lactate production and lactate transport in neurons and astrocytes. This is established through an ‘oxidation coupling factor’ (OCF), which is proportional to VLRoi or Vmax for lactate utilization/Vmax for zero-trans lactate uptake. OCF ensures that lactate cannot be consumed faster than it is produced and/or imported by the cell. The OCF which permits the most accurate simulation of experimental data by the model is 0.1. It should be emphasized that GCF and OCF are simulation constants that permit net balance of transport and metabolic flows.
Simulation 1: Brain Steady-State Glucose and Lactate Levels (Questions 1 and 2)
The first challenge we presented to the model was simulation of basal brain steady-state glucose and lactate levels. Figure 5 summarizes our results. Our simulations varied the starting serum glucose levels from 1 to 30 mmol/L, and were permitted to run until steady-state total glucose levels were achieved. These simulations (Figure 5A) predicted a very close correspondence between theory and data obtained in rats and humans (Choi et al, 2001; Gruetter et al, 1998), but only when pathway 2 (see Figure 3C) was permitted. Table 2 summarizes the predicted [Glc] of each brain compartment at 6 and 30 mmol/L serum [Glc]. Under basal conditions and at 6 mmol/L serum glucose, astrocytic lactate utilization is twofold greater than astrocytic lactate production, leading to net lactate import from the interstitium (see Figure 5B). Neuronal glucose and lactate utilization are 5- and 2.5-fold greater than astrocytic glucose and lactate utilization, respectively (see Figure 5B). If basal lamina to interstitium diffusion is not permitted (only pathway 1 of Figure 3C is operational), simulated total brain [Glc] approaches 10% of experimental values (dashed line, Figure 5A); interstitial [lactate](dotted line, Figure 5A) is dramatically reduced as discussed below. When diffusion is eliminated, net glucose transport at steady-state from serum (6 mmol/L glucose) to basal lamina is reduced by 13-fold, while basal lamina [glucose] approaches equilibrium with serum glucose as 5.7 mmol/L. When diffusion is permitted, steady-state basal lamina glucose decreases to 2.1 mmol/L because paracellular glucose diffusion circumvents the potential resistance barrier posed by the low transport capacity of the astrocytic endfoot (see Figure 2). Glucose can diffuse from the basal lamina to the interstitium where it is transported into, and used by, both neurons and astrocytes. Without paracellular diffusion between basal lamina and interstitium, successful simulation of experimental steady state and transient glucose and lactate levels is not possible. Transport through the astrocyte thus represents a significant barrier to overall glucose uptake by the brain. It is important to note that diffusion between the basal lamina and interstitium is 92% complete within 4 secs (see section Mass Transport of Gluocose and Lactate). Thus, paracellular diffusion would bypass the astrocytic barrier to glucose uptake and facilitate rapid and extensive glucose equilibration between basal lamina, interstitium, and neuronal compartments.
Compartment glucose levels in mmol/L
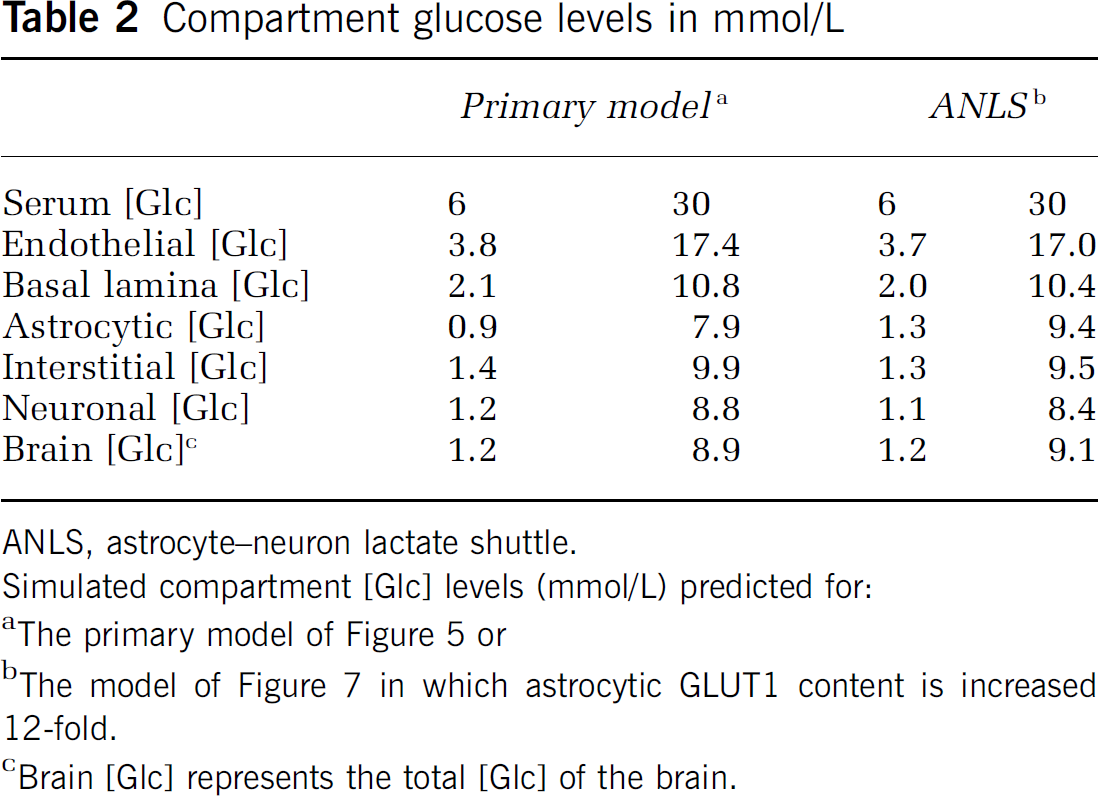
ANLS, astrocyte—neuron lactate shuttle.
Simulated compartment [Glc] levels (mmol/L) predicted for:
The primary model of Figure 5 or
The model of Figure 7 in which astrocytic GLUT1 content is increased 12-fold.
Brain [Glc] represents the total [Glc] of the brain.
Simulations of brain interstitial lactate and total glucose versus serum glucose when astrocytic glucose transport capacity is increased to match neuronal glucose transport. The experiments of Figures 5 and 6 were simulated allowing for paracellular flux with two changes: (1) astrocytic glucose transport capacity was increased 12-fold to match neuronal glucose transport and (2) neuronal and astrocytic metabolic parameters were adjusted to reproduce the variation of brain glucose with serum glucose and lactate transients during glycolytic stimulation. (
Simulation 2: Lactate Transients and Neuronal Activity (Question 3)
Brain interstitial lactate levels are known to undergo a significant but transient increase after neuronal stimulation (Hu and Wilson, 1997). We simulated the effects of neuronal stimulation by introducing a 25 secs burst of neuronal lactate oxidation (a 1.4-fold increase) followed by a 45 secs burst of neuronal and astrocytic glycolytic activity (a 4.3-fold increase) at a time (1,000 secs) when brain glucose levels have reached steady state with serum glucose (6 mmol/L). The oxidative pulse briefly lowers neuronal and interstitial lactate levels while the glycolytic pulse transiently depletes neuronal [Glc] by 5-fold and increases interstitial [lactate] almost twofold from 1.0 to 1.8 mmol/L. On cessation of stimulation, neuronal [Glc] and interstitial [lactate] recover with a half-time of approximately 90 secs (Figure 6). This result is very similar to the experimentally reported behavior of interstitial lactate (Choi et al, 2001; Hu and Wilson, 1997). In the absence of paracellular diffusion, steady-state interstitial lactate levels are significantly lower (0.05 mmol/L) and the lactate transient produced by elevated glycolysis is eliminated (Figure 6). On cessation of enhanced glycolysis, the return to baseline is determined by the steady-state kinetics of lactate transport and lactate utilization. We address the sources of interstitial lactate in more detail below (Figure 8).
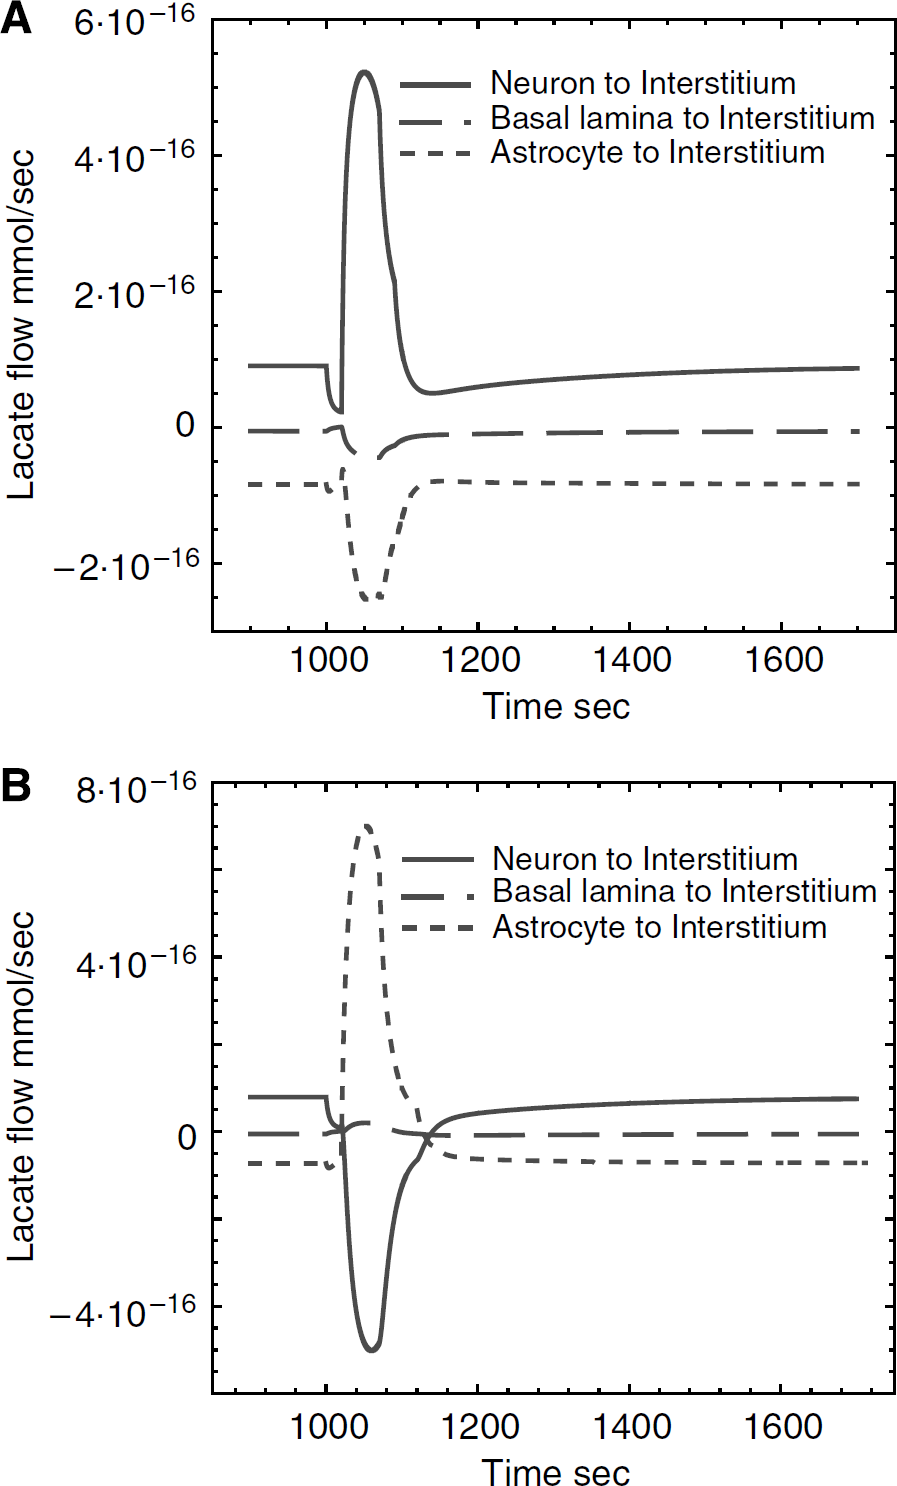
Contributions to interstitial lactate before and after neuronal stimulation. (
The following simulations were designed to specifically address question 4, that is what properties of the model must be altered to simulate the predictions of the ANLS?
Simulation 3: Basal Lamina to Interstitium Diffusion is Operational and Astrocytes and Neurons Transport Glucose with Equal Efficiency
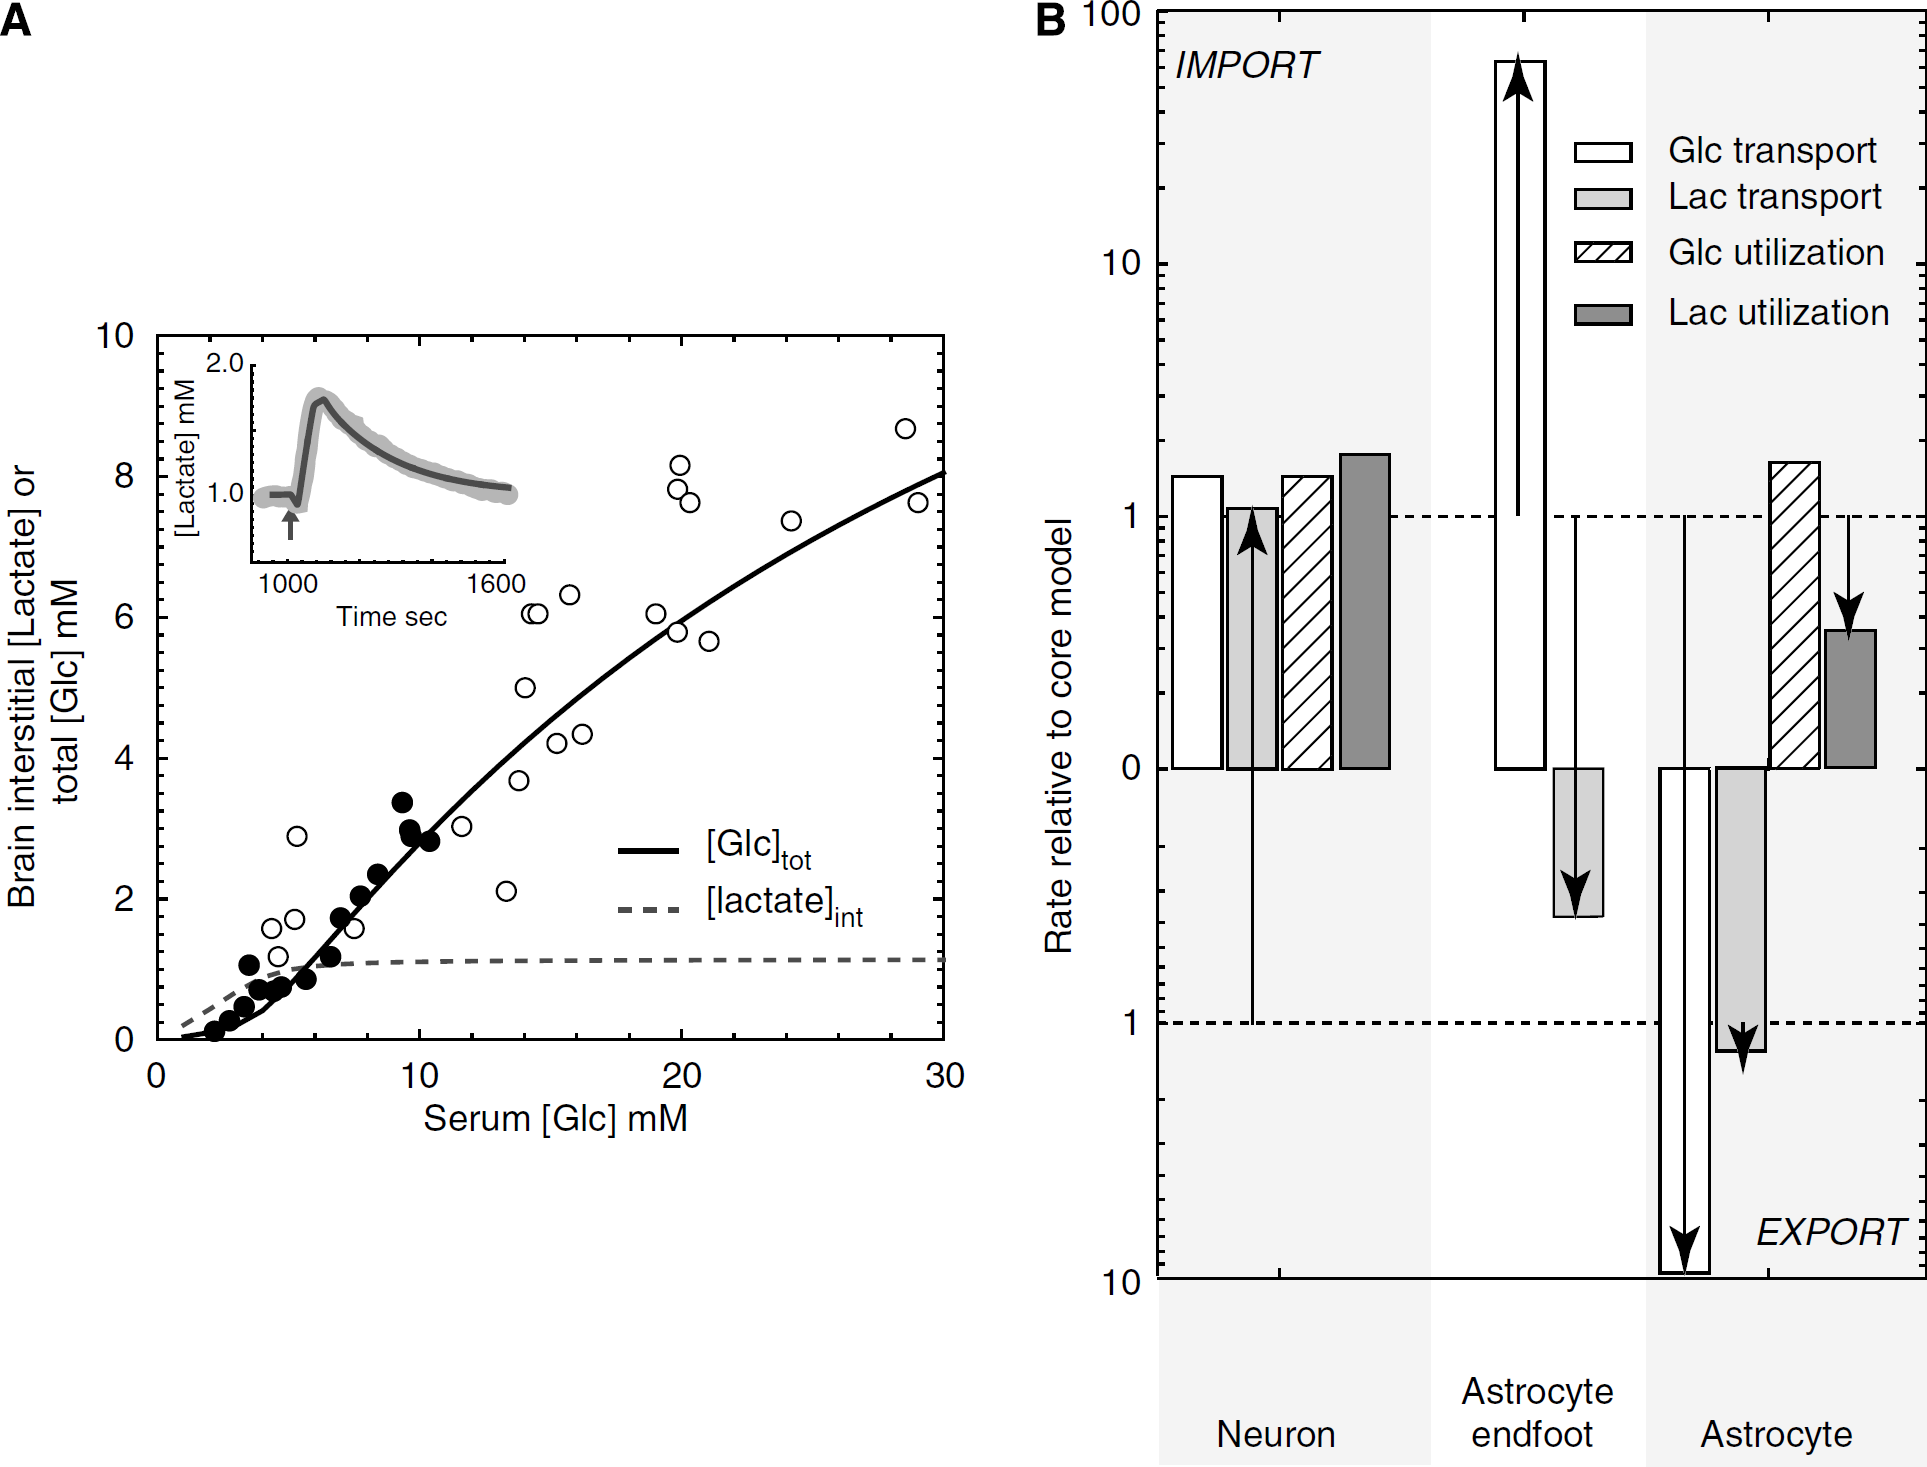
We next simulated a scenario in which astrocytic and neuronal glucose transport capacities are identical and where paracellular diffusion from the basal lamina to interstitium is permitted. We further imposed a condition in which neuronal glycolysis was assumed to be unresponsive to increased electrical activity (stimulation). This scenario models a central tenet of the ANLS hypothesis, which holds that neuronal stimulation activates astrocytic glycolysis which generates lactate to fuel neuronal lactate oxidation. To recapitulate the results of Figures 5 and 6, astrocytic glucose transport capacity must be increased to levels 12-fold greater than those predicted to occur based on GLUT1 measurements. Several metabolic adjustments are also necessary. These are: (1) astrocytic glycolytic capacity is increased by 21% and (2) astrocytic and neuronal lactate oxidation capacity and neuronal glycolytic capacity are increased very slightly (4%). Figure 7 summarizes the results of these simulations and the changes in glucose and lactate flows in neurons and astrocytes. The results of Figures 5 and 6 are recapitulated by these adjustments to the model. Under basal conditions, the neuron remains a lactate exporter and the astrocyte a lactate importer. Astrocytic endfoot glucose import is increased by sixfold at 6 mmol/L blood glucose, but glucose utilization by the astrocyte is only slightly (5%) increased. However, the adjusted model shows a major change in behavior during the neuronal stimulation-induced lactate transient.
Figure 8 illustrates these changes in lactate transients. The core model (based on measured GLUT contents and permitting increased neuronal glycolysis during neuronal stimulation; Figure 8A) shows that interstitial lactate is derived largely from neuronal export of lactate. Net flow of lactate from interstitium to basal lamina by diffusion is low but significant, and astrocytes undergo net uptake of interstitial lactate. During the brief (25 secs) stimulation-induced oxidative burst, neuronal lactate levels decrease rapidly causing a net decrease in lactate export to the interstitium with a resultant decrease in interstitial [lactate]. During the stimulation-induced glycolytic burst immediately after the oxidative response (neuronal and astrocytic glycolysis are quadrupled for 45 secs), neuronal, astrocytic, and consequently interstitial glucose are rapidly reduced by 75%. Neuronal lactate levels increase twofold resulting in net lactate export to the interstitium whence it is imported by the astrocyte. The major source of interstitial lactate during the transient is neuronal.
When the basic model is modified to increase astrocytic glucose transport capacity 12-fold and to render the neuron glycolytically unresponsive to stimulation (see parameters of Figure 7), the neuron still exports lactate and the astrocyte imports lactate under basal conditions (Figure 8B). During the brief (25 secs) stimulation-induced oxidative burst, astrocytic and neuronal lactate levels decrease rapidly. This reduces neuronal lactate export to the interstitium causing a reduction in interstitial lactate. During the stimulation-induced glycolytic burst immediately after the oxidative response (astrocytic glycolysis is increased by 14.4-fold for 45 secs), astrocytic glucose is rapidly depleted. As a consequence, interstitial glucose is reduced by 60%; neuronal glucose decreases in response to reduced glucose import in the face of continued glycolysis. Increased astrocytic lactate production leads to lactate export into the interstitium. Reduced neuronal glucose limits endogenous substrate for neuronal lactate production causing the neuron to import lactate from the interstitium. Thus, the astrocyte supplies lactate to the neuron during stimulation because it indirectly exhausts the neuron's supply of glucose. This effectively recapitulates the ANLS model proposed by Pellerin, Magistretti, and colleagues in that, on neuronal stimulation, the astrocytes produce lactate which is taken up by the neurons. For this to be a viable model, it requires paracellular diffusion and a substantial increase in astrocytic glucose transport capacity. As CB binding studies support a limited concentration of total glucose transporters GLUT1 and GLUT3 in isolated glial/neuronal membranes, the increased transport capacity must be mediated by a transporter other than GLUT1 that does not bind CB. However, our own transport studies in cultured astrocytes have indicated that the vast proportion of 2-deoxyglucose uptake is inhibited by CB (data not shown), suggesting that expression of the requisite transporter is either lost on culturing the astrocytes or non-extant.
Simulation 4: No Diffusion from the Basal Lamina to Interstitium and the Necessary Compensations (Pathway 1 of Figure 3C)
This simulation models the two central tenets of the ANLS hypothesis: (1) neuronal activation stimulates astrocytic glycolysis, which supplies lactate for neuronal oxidation and (2) glucose passes through the astrocyte to access the interstitium (paracellular diffusion is not permitted; only pathway 1 of Figure 3C is operational). The purpose of this simulation was to investigate which adjustments in astrocytic glucose transport are necessary for brain glucose and lactate levels to respond normally to alterations in serum [glucose] and to neuronal stimulation. We further imposed the condition where neuronal glycolysis is unresponsive to stimulation, whereas the astrocyte responds with increased glycolysis.
We successfully mimicked the simulations of Figures 5 and 6 in the absence of diffusion by increasing astrocytic glucose transport by 100-fold. It was necessary to reduce neuronal and astrocytic glucose utilization by 5 and 80%, respectively, and to increase neuronal and astrocytic lactate utilization by 7 and 5%, respectively, to prevent unphysiological accumulation of interstitial lactate (Figure 9). Under these conditions, the astrocytic endfoot imports glucose 67-fold faster than in Figure 5, and the astrocyte exports glucose into the interstitium for increased net uptake by the neuron. In essence, an astrocyte with high glucose transport and low glucose utilization capacities serves as a conduit for glucose delivery to the interstitium. These parameter changes permit faithful reproduction of the experiments depicted in Figures 5 and 6 and simulated with the primary model. The neuron remains the major (90%) source of lactate production and consumption both at rest and during stimulation. The neuron is the major source of interstitial lactate at rest, whereas the astrocyte is the major source of interstitial lactate during stimulation. This simulation together with the data presented in Figure 5, in which the effects of eliminating paracellular flux were also investigated, clearly suggest that transport of glucose exclusively through the astrocytic endfoot is not a viable option.
Simulations of total brain glucose versus serum glucose: adjustments required when diffusion is eliminated. The experiments illustrated in Figures 5 and 6 were simulated with two changes: (1) diffusion is eliminated (pathway 2 of Figure 3C; flows 4 and 14 of Figure 4) and (2) astrocytic glucose transport, and neuronal and astrocytic metabolic parameters were adjusted to reproduce experimental behavior. (
Comparison with Other Models
Several investigators have considered models for steady-state and transient lactate and glucose distributions in the brain. Fillenz (2005) critically evaluates the ANLS hypothesis and concludes that the thermodynamic cost of glutamate uptake by astrocytes (3% of brain ATP consumption) is insufficient to stimulate astrocytic glycolysis and lactate production from glucose. The author proposes that the initial dip in interstitial lactate on neuronal stimulation results from increased neuronal oxidative metabolism, coincident with a simultaneous increase in neuronal glycolysis, causing glucose levels to decline, consistent with our model (see Figure 6). However, the author further hypothesizes that neuronal stimulation causes astrocytes to release glutamate, which leads to intracellular astrocytic Ca2+ waves causing increased lactate production and release. This latter event is much slower than neuronal activation and correlates with the slow increase observed in astrocytic nicotinamide adenine dinucleotide levels which was interpreted as an increase in astrocytic G-3-P dehydrogenase activity but does not account for a release in lactate which is nicotinamide adenine dinucleotide neutral (Kasischke et al, 2004). An alternative explanation for these data that would be consistent with the studies described here would be that the increased nicotinamide adenine dinucleotide levels seen in the astrocyte arise from an uptake of lactate derived from neuronal glycolysis.
Gjedde and Marrett (2001) argue that glycolysis in neurons, not astrocytes, delays oxidative metabolism in the stimulated visual cortex. In addition, and in agreement with our premise, the authors argue that astrocytic endfeet are not an integral part of the BBB, and thus do not restrict the use of glucose to astrocytes. They propose that astrocyte metabolism is not less oxidative than that of neurons (Gjedde and Marrett, 2001), and conclude that neuronal stimulation increases both neuronal and astrocytic glycolysis and O2 consumption.
Leegsma-Vogt et al (2004) measured and simulated cerebral arteriovenous lactate kinetics after intravenous lactate infusion in the rat. Their data supports a model in which serum lactate exchanges with a brain lactate compartment that represents approximately 24% of brain volume. Since astrocytic, neuronal, and extracellular compartments are 25, 50, and 20%, respectively, of brain volume (Aubert and Costalat, 2005), this exchangeable compartment could represent extra cellular fluid (ECF), astrocytes or a subfraction of total neurons. Aubert and Costalat (2005) present a detailed and lucid analysis of glucose, lactate, and pyruvate metabolism in brain. Their model assumes glucose exchange between four major compartments: capillary, extracellular space, astrocytes, and neurons. Their model differs from this study by combining the basal lamina and interstitium as a single compartment but, as with the present model, diffusion of glucose between the extracellular space adjacent to capillaries and neurons is not limiting. In the current study, the rates of astrocytic glucose transport are proposed to be 12-fold slower than neuronal glucose transport, compared with a five-fold difference proposed by Aubert and Costalat (2005). Their model does not use standard carrier-mediated transport equations for glucose uniport or lactate/proton symport; the consequences of known differences in affinity of GLUT1 and GLUT3 for glucose or of MCT1 and MCT2 for lactate are not considered (Stein, 1986b). The other major distinction between the two models is that in the present model, glucose transport across the endothelial cell appears to be considerably faster.
Aubert et al (2005) investigate models for the very rapid lactate transients observed in rat hippocampus after electrical stimulation of the perforant pathway as described Hu and Wilson (1997). These kinetics (see Figure 6) show a brief decrease in interstitial [lactate] followed by a 1.8-fold increase, which then returns to baseline levels over a period of 500 secs. The authors conclude that these three phases represent (1) an initial increased brain lactate oxidation, as also observed by Kasischke et al (2004); (2) a sustained increase in lactate production which on termination of increased glycolysis; (3) is followed by lactate oxidation and uptake by cells. The authors successfully simulate the observed kinetics and, like us, conclude that local changes in cytoplasmic and interstitial pH have only a very small effect on net lactate distributions. They also conclude that the greater Km(app) for MCT1-catalyzed lactate transport in astrocytes favors export by astrocytes rather than high-affinity MCT2-catalyzed export by neurons. We would disagree with this conclusion because high-affinity, high-capacity MCT2-catalyzed lactate export produces greater transport rates at physiologic [lactate]. Their conclusion might have arisen from the failure to use appropriate carrier equations for symport (Stein, 1986b).
In this study, we have manipulated our proposed model to accommodate the predictions of ANLS, and to delineate the potential changes in transport capacities that are necessary to fit the published data of Gruetter and colleagues (Choi et al, 2001; Gruetter et al, 1998) and Hu and Wilson, (1997), as illustrated in Figures 5 and 6. For the model to accommodate the ANLS hypothesis, where the astrocyte is the primary source of lactate production and the neuronal glycolytic burst response to stimulation is eliminated, the following compensatory adjustments to the model are necessary: (1) astrocytic glucose transport is increased 13-fold to match quantitatively neuronal glucose transport when paracellular glucose diffusion from basal lamina to interstitium is permitted; (2) astrocytic glycolysis and lactate oxidation, and neuronal lactate oxidation are increased (Figures 7 and 8B). Measured physiologic levels of astrocytic GLUT1 cannot meet these requirements, thus necessitating the hypothetical participation of additional GLUTs, such as GLUT6 and GLUT9, which have been identified, but as yet have not been characterized (Augustin et al, 2004; Doege et al, 2000). It is important to note, however, that the additional transporters, if present, are inhibited by CB because astrocytic glucose uptake is completely inhibited by CB, and thus should have been detected in astrocyte CB and photolabel experiments. Our attempts to recapitulate the ANLS hypothesis by reducing neuronal glucose transport capacity to the level of the astrocyte were unsuccessful (data not shown). Constraining the passage of glucose solely through the astrocytic endfoot (pathway 1 of Figure 3C), as most commonly drawn diagrammatically when ALNS is illustrated, results in dramatic reductions in total brain glucose and lactate levels (Figure 5). For this pathway to become viable, it is necessary to elevate astrocytic glucose transport 100-fold over predicted values to mimic experimental observations (Figure 9). Under these conditions, (1) glucose must be transported into the astrocyte and then exported to the interstitium to enter neurons; (2) interstitial lactate derives from neurons under resting conditions, and from astrocytes during neuronal stimulation, assuming that neuronal glycolysis is not activated during neuronal stimulation. If neuronal and astrocytic glycolysis respond equally to neuronal stimulation, the neuron remains the major source of interstitial lactate.
Conclusions
In this review, we have used the measurable levels and kinetic properties of GLUT1 and GLUT3 of BBB endothelial cells, astrocytes, and neurons, along with the corresponding kinetic properties of the MCTs, MCT 1, 2, and 4, to model successfully brain glucose and lactate levels as well as lactate transients in response to neuronal stimulation. To the best of our knowledge, this is the first working model that incorporates the cell-specific concentrations and properties of the transport proteins. In constructing this model and testing different conditions, we have revealed several important properties and constraints of the system. Perhaps, the most vital is the appreciation of the role of the basal lamina as a postendothelial cell ‘reservoir’ and conduit for diffusion of glucose and metabolites directly to the interstitium. Successful modeling of relevant glucose and lactate levels requires free diffusion of glucose from the BBB endothelial cell via the adjacent basal lamina to the interstitium surrounding the neurons and astrocytes (pathway 2 of Figure 3C) and back to the serum. The other important conclusion derived from the current model is that the neuron is predicted to be responsible for the evolution of the lactate transients obtained after a neuronal stimulation, and that the astrocyte may actually take up lactate under such circumstances.
Although the model presented here represents a unique contribution to the understanding of glucose and lactate metabolism in the mammalian brain, it does rely on average cellular values for the respective transporter proteins and does not address regional heterogeneity in cerebral metabolism. Such studies are clearly a goal for future exploration. However, it seems clear from these calculations that the neuron is the primary site of glucose uptake and utilization, both under steady-state and stimulated conditions. Certainly, this is consistent with all previous observations obtained with in vivo paradigms of increased neuronal activity that show an increase in neuronal GLUT3, and BBB GLUT1 as the glucose transport accommodations to increased cerebral glucose utilization (reviewed in Vannucci et al, 1998).
Footnotes
Acknowledgements
We thank Milton Brightman for his helpful discussions.
Notes
Appendix
Definition of parameters
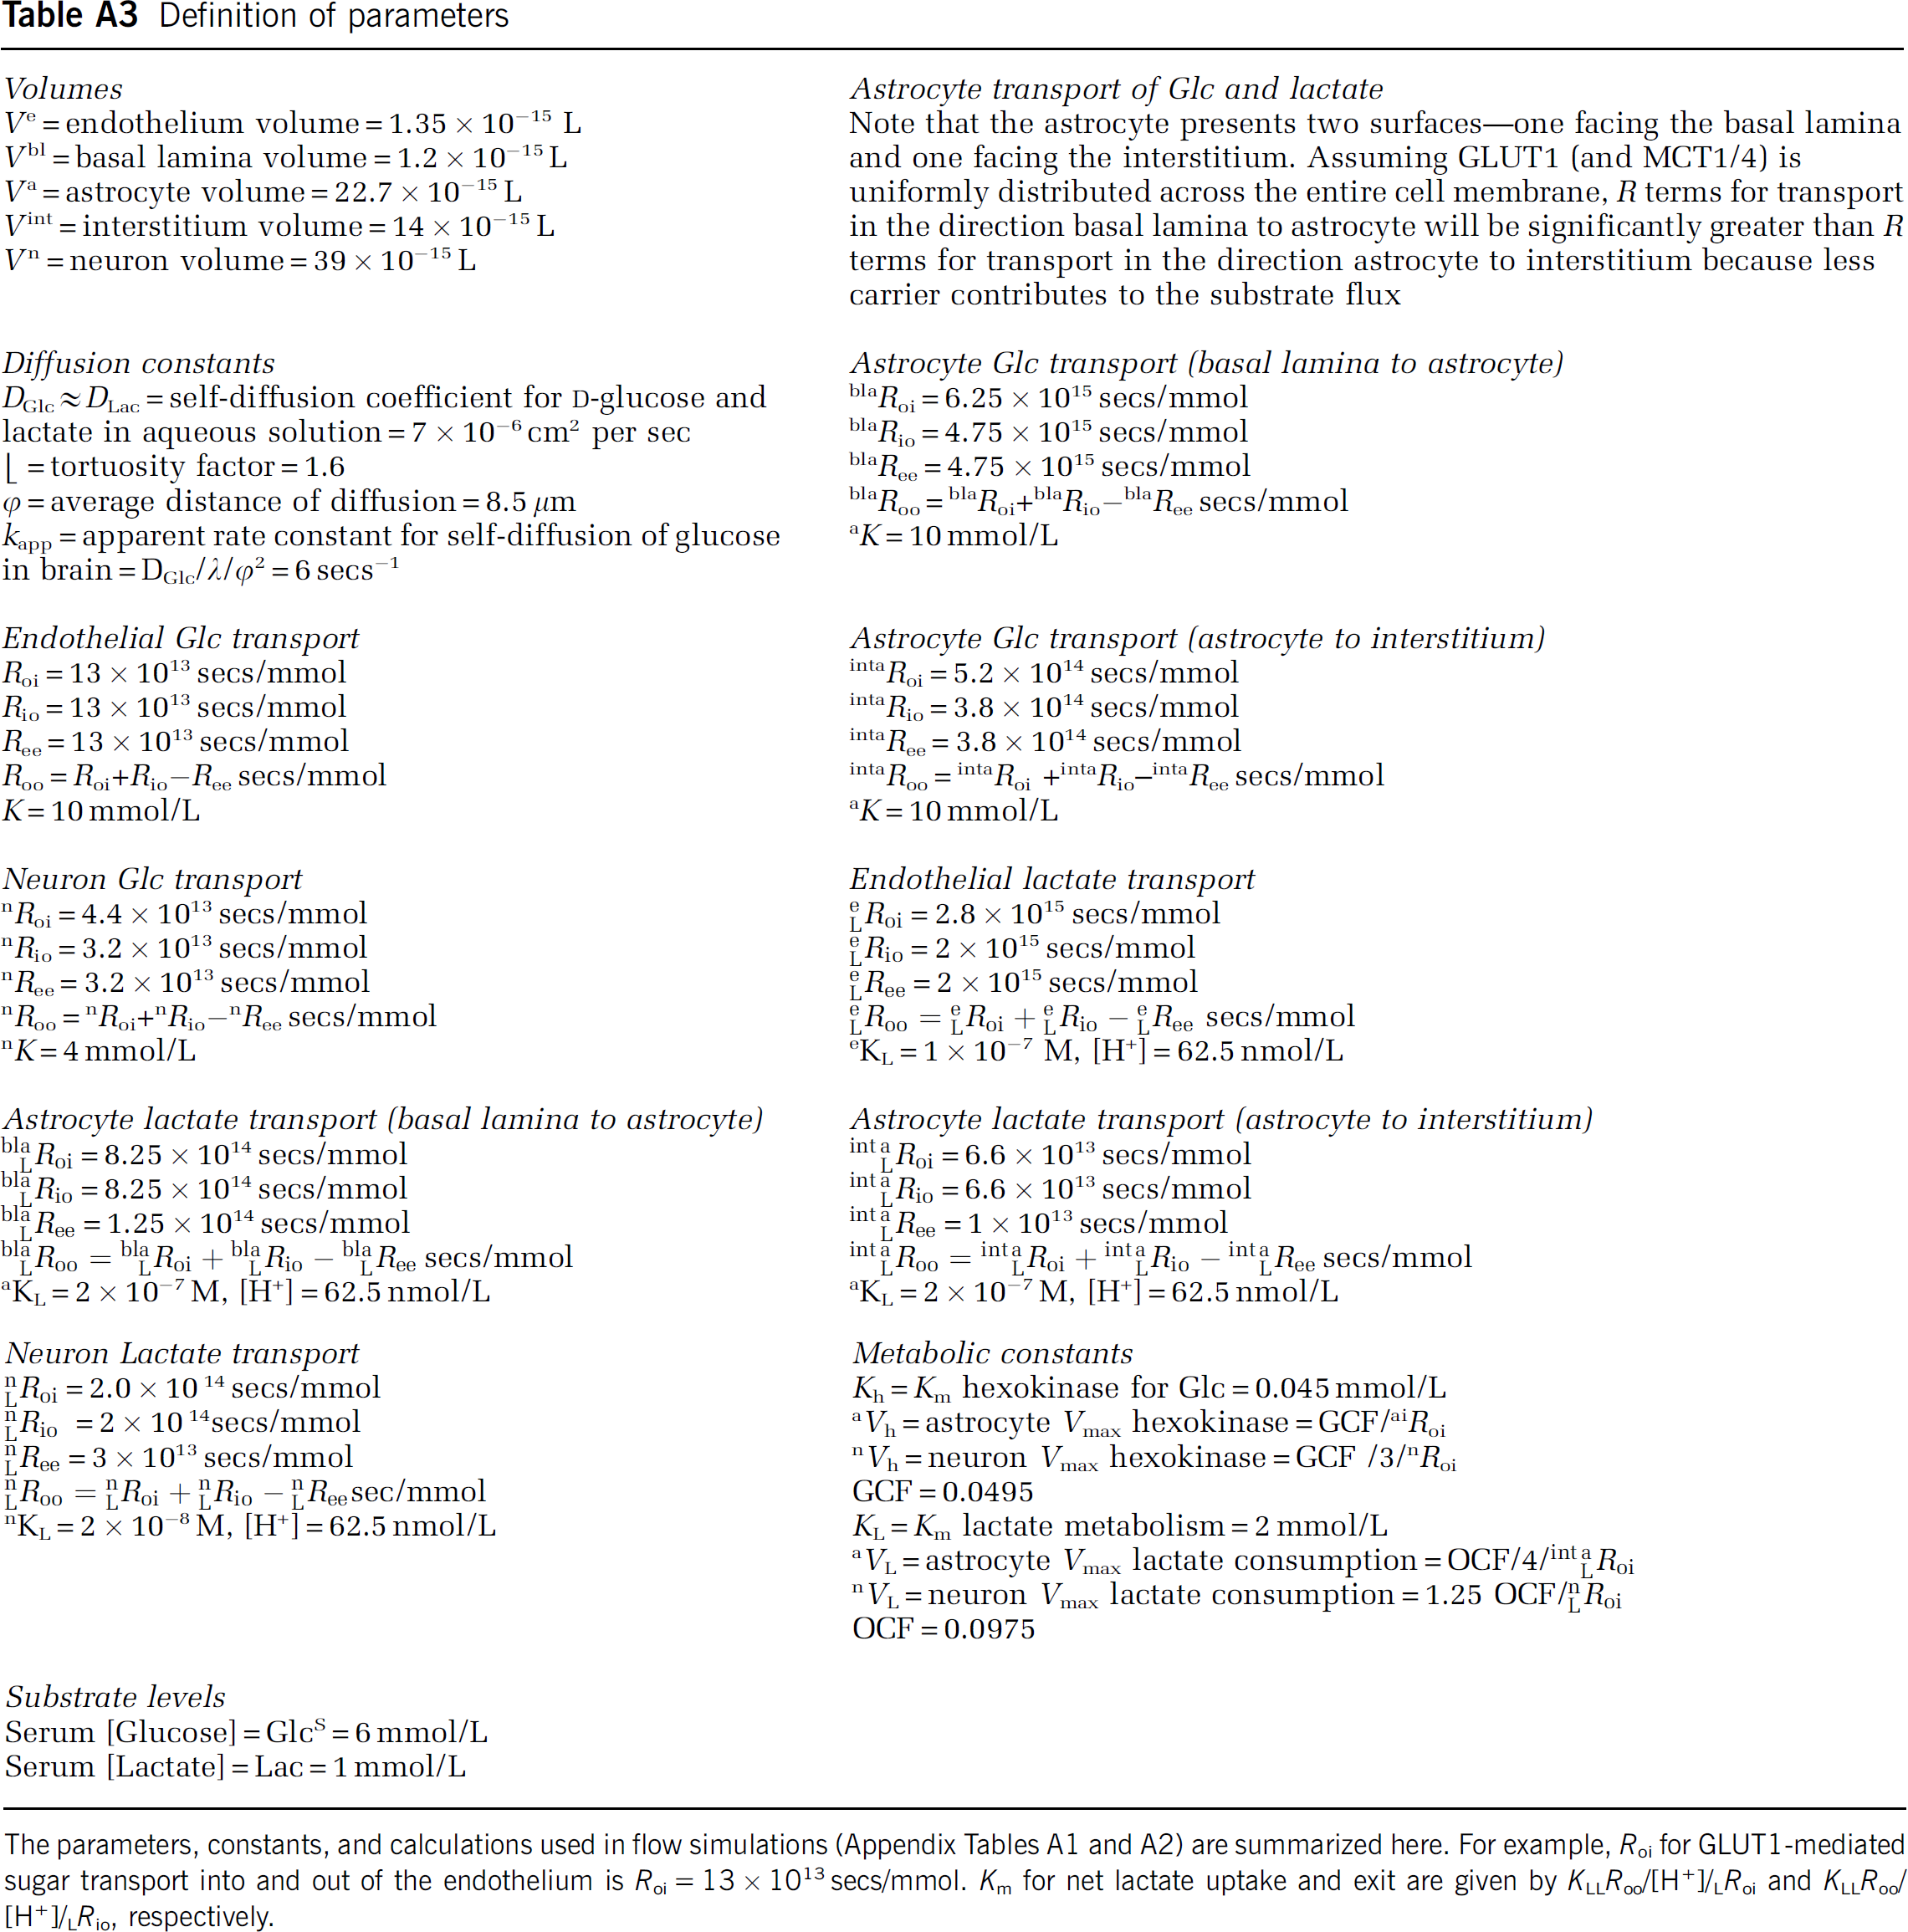
| Volumes | Astrocyte transport of Glc and lactate |
| Ve = endothelium volume = 1.35 × 10⁻¹⁵ L Vbl= basal lamina volume = 1.2 × 10⁻¹⁵ L Va = astrocyte volume = 22.7 × 10⁻¹⁵L Vint = interstitium volume = 14 × 10−15 L Va = neuron volume = 39 × 10−15 L |
Note that the astrocyte presents two surfaces—one facing the basal lamina and one facing the interstitium. Assuming GLUT1 (and MCT1/4) is uniformly distributed across the entire cell membrane, R terms for transport in the direction basal lamina to astrocyte will be significantly greater than R terms for transport in the direction astrocyte to interstitium because less carrier contributes to the substrate flux |
| Diffusion constants | Astrocyte Glc transport (basal lamina to astrocyte) |
| DGlc ≈ DLac = self-diffusion coefficient for D-glucose and lactate in aqueous solution = 7 × 10⁻⁶cm2 per sec ⌊ = tortuosity factor = 1.6 øpH = average distance of diffusion = 8.5 µmUm kapp = apparent rate constant for self-diffusion of glucose in brain = DGlc/λ/ø2 = 6 secs−1 |
blaRoi = 6.25 × 10¹⁵ secs/mmol blaRio = 4.75 × 10¹⁵ secs/mmol blaRee = 4.75 × 10¹⁵ secs/mmol blaRoo =blaRoi+blaRioblaRee secs/mmol aK = 10 mmol/L |
| Endothelial Glc transport | Astrocyte Glc transport (astrocyte to interstitium) |
| Roi = 13 × 1013 secs/mmol Rio = 13 × 1013 secs/mmol Ree = 13 × 1013 secs/mmol Roo =Roi+Rio—Ree secs/mmol K = 10 mmol/L |
intaRoi = 5.2 × 10¹⁴ secs/mmol intaRio = 3.8 × 10¹⁴ secs/mmol intaRee = 3.8 × 10¹⁴ secs/mmol intaRoo =intaRoi +intaRio—intaRee secs/mmol aK = 10 mmol/L |
| Neuron Glc transport | Endothelial lactate transport |
| nRoi = 4.4 × 10¹³ secs/mmol nRio = 3.2 × 10¹³ secs/mmol nRee = 3.2 × 10¹³ secs/mmol nRoo =nRoi+nRio—nRee secs/mmol nK= 4 mmol/L |
eLRoi = 2.8 × 10¹⁵ secs/mmol eLRio = 2 × 10¹⁵ secs/mmol eLRee = 2 × 10¹⁵ secs/mmol eLRoo =eLRoi + eLRio - eLRee secs/mmol eKL = 1× 10⁻⁷ M, [H+] = 62.5 nmol/L |
| Astrocyte lactate transport (basal lamina to astrocyte) | Astrocyte lactate transport (astrocyte to interstitium) |
| blaLRio = 8.25 × 10¹⁴ secs/mmol blaLRio = 8.25 × 10¹⁴ secs/mmol blaLRee = 1.25 × 10¹⁴ secs/mmol blaLRoo =blaLRoi + blaLRio — blaLRee secs/mmol aKL = 2× 10⁻⁷M, [H+] = 62.5 nmol/L |
intaLRoi = 6.6 × 10¹³ secs/mmol intaLRio = 6.6 × 10¹³ secs/mmol intaLRee = 1 × 10¹³ secs/mmol intaLRoo =intaLRoi + intaLRio — intaLRee secs/mmol aKL = 2× 10⁻⁷ M, [H+] = 62.5nmol/L |
| Neuron Lactate transport | Metabolic constants |
| nLRoi = 2.0 × 10¹⁴ secs/mmol nLRio = 2× 10¹⁴secs/mmol nLRee = 3 × 10¹³ secs/mmol nLRoo =nLRoi + nLRio — nLReesec/mmol nKL = 2× 10⁻⁷ M, [H+] = 62.5 nmol/L |
Kh =Km hexokinase for Glc = 0.045 mmol/L aVh = astrocyte Vmax hexokinase = GCF/aiRoi nVh = neuron Vmax hexokinase = GCF /3/nRoi GCF = 0.0495 KL =Km lactate metabolism = 2 mmol/L aVL = astrocyte Vmax lactate consumption = OCF/4/intaLRoi nVL = neuron Vmax lactate consumption = 1.25 OCF/nRoi OCF = 0.0975 |
| Substrate levels | |
| Serum [Glucose] = GlcS = 6 mmol/L | |
| Serum [Lactate] = Lac = 1 mmol/L |
The parameters, constants, and calculations used in flow simulations (Appendix Tables A1 and A2) are summarized here. For example, Roi for GLUT1-mediated sugar transport into and out of the endothelium is Roi = 13 × 1013secs/mmol. Km for net lactate uptake and exit are given by KLLRoo/[H+]/LRoi and KLLRoo/ [H+]/LRio, respectively.
References
Supplementary Material
Please find the following supplemental material available below.
For Open Access articles published under a Creative Commons License, all supplemental material carries the same license as the article it is associated with.
For non-Open Access articles published, all supplemental material carries a non-exclusive license, and permission requests for re-use of supplemental material or any part of supplemental material shall be sent directly to the copyright owner as specified in the copyright notice associated with the article.