
Abstract
Hypoglycemia increases the risk related to stroke and neurodegenerative diseases, however, the underlying mechanisms are unclear. For the first time, we studied the effect of a single episode (acute) of severe (ASH) and mild (AMH) hypoglycemia on mouse brain microvascular proteome. After four-hour fasting, insulin was administered (i.p) to lower mean blood glucose in mice and induce ∼30 minutes of ASH (∼30 mg/dL) or AMH (∼75 mg/dL), whereas a similar volume of saline was given to control mice (∼130 mg/dL). Blood glucose was allowed to recover over 60 minutes either spontaneously or by 20% dextrose administration (i.p). Twenty-four hours later, the brain microvessels (BMVs) were isolated, and tandem mass tag (TMT)–based quantitative proteomics was performed using liquid chromatography-mass spectrometry (LC/MS). When compared to control, ASH significantly downregulated 13 proteins (p ≤ 0.05) whereas 23 proteins showed a strong trend toward decrease (p ≤ 0.10). When compared to AMH, ASH significantly induced the expression of 35 proteins with 13 proteins showing an increasing trend. AMH downregulated only 3 proteins. ASH-induced downregulated proteins are involved in actin cytoskeleton maintenance needed for cell shape and migration which are critical for blood-brain barrier maintenance and angiogenesis. In contrast, ASH-induced upregulated proteins are RNA-binding proteins involved in RNA splicing, transport, and stability. Thus, ASH alters BMV proteomics to impair cytoskeletal integrity and RNA processing which are critical for cerebrovascular function.
Introduction
Incidences of acute and severe hypoglycemia are very rare in healthy subjects, but these are very common side effects of anti-diabetic therapies, particularly insulin therapy, in both type 1 and type 2 diabetic subjects.1,2 Recurrent hypoglycemic episodes are frequent in diabetic subjects which are made worse by diabetes-induced autonomic dysfunction and hypoglycemia unawareness. 3 Recurrent episodes of severe and mild hypoglycemia have been known to negatively impact the central nervous system. Recent studies revealed that hypoglycemia increases the risk of developing stroke and injury.4,5 Furthermore, recurrent mild hypoglycemia promotes Alzheimer’s disease progression, dementia, and cognitive defects.6 –8 Although the detrimental effects of hypoglycemia on the central nervous system have been well studied, the underlying mechanisms are poorly understood.
Neurons are highly susceptible to hypoglycemic insult as glucose is their major energy source. Severe hypoglycemia has been shown to induce neuronal death and cognitive dysfunction whereas recurrent mild hypoglycemia can induce cognitive deficits despite minimal neuronal death. Hypoglycemia was shown to alter neural inputs and induce dendrite injury.9 –12 In addition, hypoglycemia was found to alter the function of other brain cells including astrocytes, oligodendrocytes, microglia, and pericytes.8,13 –17 Although mechanisms of hypoglycemic injury have been well-established in neurons and partly in other brain cell types, they were not adequately examined in the microvascular endothelial cells which are important members of the neurovascular unit. Brain microvessels (BMVs) are comprised of three types of blood vessels, namely, precapillary arterioles, capillaries, and post-capillary venules.18 –21 Capillaries contain predominantly endothelial cells along with a few pericytes whereas precapillary arterioles and venules also contain smooth muscle cells. BMVs are critical for maintaining brain-specific microenvironment and perfusion by regulating blood-brain-barrier (BBB) and neurovascular coupling (NVC). Hypoglycemia was shown to induce endothelial dysfunction and blood-brain-barrier defects in vitro, but its effect on BMVs was not studied previously.22 –32 Studies focusing on global proteomic changes in the microvasculature in response to hypoglycemia were never reported before.
In this study, we investigated whether a single episode of mild and severe hypoglycemia significantly alters the proteome of the brain microvasculature in healthy mice. To investigate this, we have given a single injection of insulin to mice intraperitoneally to induce mild and severe hypoglycemia. After 24 hours, we isolated the brain microvessels from control, mild, and severe hypoglycemic mice and performed discovery-based global proteomics using a tandem-mass-tag (TMT)-based mass spectrometric approach.
Materials & methods
Animals
Male C57BL/6J mice (2–4 months of age, n = 18) were purchased from Jackson Laboratories (Bar Harbor, Maine). Animals were housed according to the Institutional Animal Care and Use Committee (IACUC) of Tulane University guidelines and in compliance with National Institutes of Health Office of Laboratory Animal Welfare guidelines. In addition, all the protocols were approved by IACUC of Tulane University and were also in compliance with ARRIVE (Animal Research: Reporting in Vivo Experiments) guidelines. Mice had free access to soft food and water ad libitum, with a standard light/dark cycle. All animals have been randomly assigned to various experimental groups. No exclusion or inclusion criteria were necessary as all the animals were included in the final analysis. The investigators were not blinded as the experimental design requires the investigator to know the animals assigned to each group for insulin or saline injection.
Materials
Detailed information about the materials used in these experiments were given in the supplemental data.
Acute severe and mild hypoglycemia
After the acclimatization period, mice were kept fasting for four hours in fresh cages that were cleared of food pellets and excretory material (08.00 AM – 12.00 PM). Mice were divided into three groups: control, severe acute hypoglycemia (ASH), and mild acute hypoglycemia (AMH). Basal blood glucose levels were measured from the tail vein blood using a Contour Next One glucometer (Ascensia Diabetes Care, New Jersey) and compatible glucose strips. A single episode of severe or mild hypoglycemia was induced by intraperitoneal injection of insulin (Humulin, Elli Lilly, Indianapolis) 2 units/kg or 0.4 units/kg body weight, respectively. Control mice were given sterile saline (50 µL) whereas insulin for the hypoglycemic mice was diluted to the desired concentration in sterile saline. Blood glucose readings were taken 0, 30, 60, 90, and 120 minutes after the insulin injection. Insulin/saline injections and measurement of blood glucose levels were done in awake mice. Control mice blood glucose levels were ∼130 mg/dL (range: 80–140 mg/dL), whereas ASH mice experienced blood glucose levels of ∼30–mg/dL (range: 20–55 mg/dL) for at least 30–60 minutes, whereas AMH mice experienced blood glucose levels around 75 mg/dL (range: 55-110mg/dL). The 20% dextrose injections (200 mg/ml, 100 µL i.p) were administered to mice that were exhibiting lower-than-normal blood glucose levels after the 2 hours of hypoglycemia to bring the blood glucose values back to normal.
Brain microvessels isolation
Twenty-four hours after the hypoglycemic episode, mice were anesthetized with isoflurane and perfused with heparinized Dulbecco's phosphate-buffered saline (DPBS) for five minutes at room temperature. The perfusion was performed by intracardiac injection of DPBS into the left ventricle accompanied by excision of the right atrium in order to wash away the blood from the circulation. Microvessels were isolated from brains as described previously. 21 Briefly, cerebral hemispheres were dissected out and rolled over the filter paper to remove the larger surface blood vessels. Later, tissues were homogenized in DPBS and centrifuged at 3000 × g for 15 minutes. The supernatant was discarded, and the pellet was resuspended in 17.5% dextran (prepared in DPBS). Later the samples were spun at 5000 × g for 15 minutes. Supernatants were removed along with the myelin plugs using a vacuum and the step was repeated to minimize contamination with other cell types. Subsequently, the microvessel pellets were resuspended in 2% BSA in DPBS and filtered through 200 µm filters followed by 40 µm filters. The microvessel fraction between 200 40 µm filtrations was centrifuged at 3000 × g for 15 minutes in 50 ml centrifugation tubes using an Eppendorf centrifuge with a swinging bucket rotor (Model: S-4-72). The isolated BMVs contain mainly capillaries (more than 90%) along with a few pre-capillary arterioles and venules. 18 Thus, centrifugation of BMV suspension and removal of the supernatant eliminated the BSA from the microvessels. BSA contamination will be negligible as we removed the BSA before proteomic analysis. Later, the BMV pellets were saved at −80°C for the subsequent proteomic analysis.
Proteomics and the data analysis
Proteomic analysis was performed on the BMVs as described previously.18,33 Briefly, the BMVs (16 experimental samples) were suspended in 1% SDS in water and sonicated for twenty seconds on ice. Samples were further lysed by repeated pipetting on ice (3 times with 15-minute breaks). Samples were then centrifuged to pellet cell debris, and supernatants were transferred to clean tubes. Protein content was estimated using a NanoDrop One (Thermo Fisher Scientific) and absorbance at 280 nm (1 absorbance unit = 1 mg/mL). 50 µg protein of each sample was taken for proteomic analysis. Cysteine residues in the proteins were reduced using TCEP (tris(2-carboxyethyl) phosphine) and alkylated using iodoacetamide, and then the samples were subjected to a methanol/chloroform extraction followed by drying using a speed-vacuum centrifuge. The pellets were each re-suspended in 100 µL of 50 mM triethyl ammonium bicarbonate (TEAB) pH 8.5 containing 2 µg of trypsin. Samples were digested by trypsin overnight at 37 °C. Primary amines on the trypsinized samples were then labeled using TMTpro16-Plex reagents following the manufacturer’s protocol (Thermo Fisher Scientific). After labeling, the reactions were quenched using 0.2% hydroxylamine final concentration. Each of the 16 labeled samples was pooled together and excess labels and salts were removed using a Sep-Pak™ C18 column (Waters, Ireland) using reverse-phase chromatography under basic pH conditions. Next, the labeled peptides were separated into multiple fractions using basic pH, and reverse-phase chromatography. A total of 48 fractions (200 µL each) were collected in a 96-well microplate in a “serpentine” fraction collection scheme (fraction B12 in the tray was the 13th fraction collected, fraction C1 in the tray was the 25th fraction collected, etc.). The fractions were then recombined to create 16 “super fractions” (original fractions 1, 17, and 33 became new super fraction #1, original fractions 2, 18, and 34 became new super fraction #2, etc.). Each of the 16 super fractions was then run in quadruplicate on a Dionex U3000 nanoflow system coupled to an Orbitrap Fusion Tribrid mass spectrometer (Thermo Fisher Scientific). The fractions were subjected to a 95-min chromatography method using an acetonitrile + 0.1% formic acid (ACN/FA) gradient over 80 min (1%⊟10% (over 10 minutes), 10%⊟32% (over 60 minutes), 32%⊟50% (over 10 minutes). The gradient was followed by a step to 99% ACN/FA for 3 min followed by a 12 min re-equilibration to 1% ACN/FA. Chromatography was carried out in a “trap-and-load” format using a PEPMAP100 C18 5 µm (0.3 mm × 5 mm) trap column (Thermo Fisher Scientific), a PepMap™ RSLC C18 (2 µm, 100 Å, 75 µm × 25 cm) separation column (Thermo Fisher Scientific) and an Easy Spray NG source (Thermo Fisher Scientific). The entire LC-MS run employed a 0.3 µL/min flow rate. Electrospray utilized a 1.9 kV potential.
A total of 16 experimental samples were analyzed for this study (control-5, ASH-5, and AMH-6). Spectrometric data were analyzed using Proteome Discoverer 2.4 software (Thermo Fisher Scientific) using the Mus Musculus SwissProt tax ID = 10090, version 2022-06-14 protein FASTA database. Modifications included static labeling of lysine and N-terminus) with TMTpro labels (+304.207 Da, static cysteine carbamidomethylation (+57.021), dynamic phosphorylation of serine, threonine, and tyrosine (+79.966 Da), and dynamic modification of oxidation of methionine (+15.9949). Parent ion tolerance was 10 ppm, fragment mass tolerance was 0.6 Da, and the maximum number of missed cleavages was set to 2. Proteins were identified based on the availability of at least one unique high-scoring peptide. One-way ANOVA was performed between the abundant proteins from the control, ASH, and the AMH groups using Proteome Discover 2.4. Data including abundance ratios (female/male), adjusted p-values, SEQUEST-HT and PEP scores, % coverage, peptide spectral matches, the number of peptides, and unique peptides were exported to MS Excel. The identified altered proteins with a p value less than or equal to 0.10 were then subjected to Ingenuity Pathway Analysis (IPA). IPA Core analysis focused on proteins that were significantly altered or showed a strong trend toward change between ASH vs Control, AMH vs Control, and AMH vs ASH groups to identify significantly altered pathways.
Statistical analysis
Results were expressed as mean ± standard deviation with the number of independent measurements indicated by ‘‘n’’. All the protein data sets were tested for normality using the Shapiro–Wilk normality test. Data comparison was performed using one-way ANOVA with Tukey’s post hoc analysis. p < 0.05 was considered statistically significant.
Results
Severe and mild acute hypoglycemia
A single episode of severe and mild acute hypoglycemia was successfully induced in mice by intraperitoneal administration of insulin (2 units and 0.4 units/Kg body weight respectively). Control mice exhibited blood glucose levels around ∼130 mg/dL. Mice in the ASH group experienced glucose levels less than 55 mg/dL (average 30 mg/dL with more than 90% of mice in the range between 20–55 mg/dL) for a minimum of 30 minutes, whereas mice in the AMH group experienced glucose levels around 70 mg/dL (average 75 mg/dL with more than 80% of mice in the range between 60–90 mg/dL) (Figure 1).
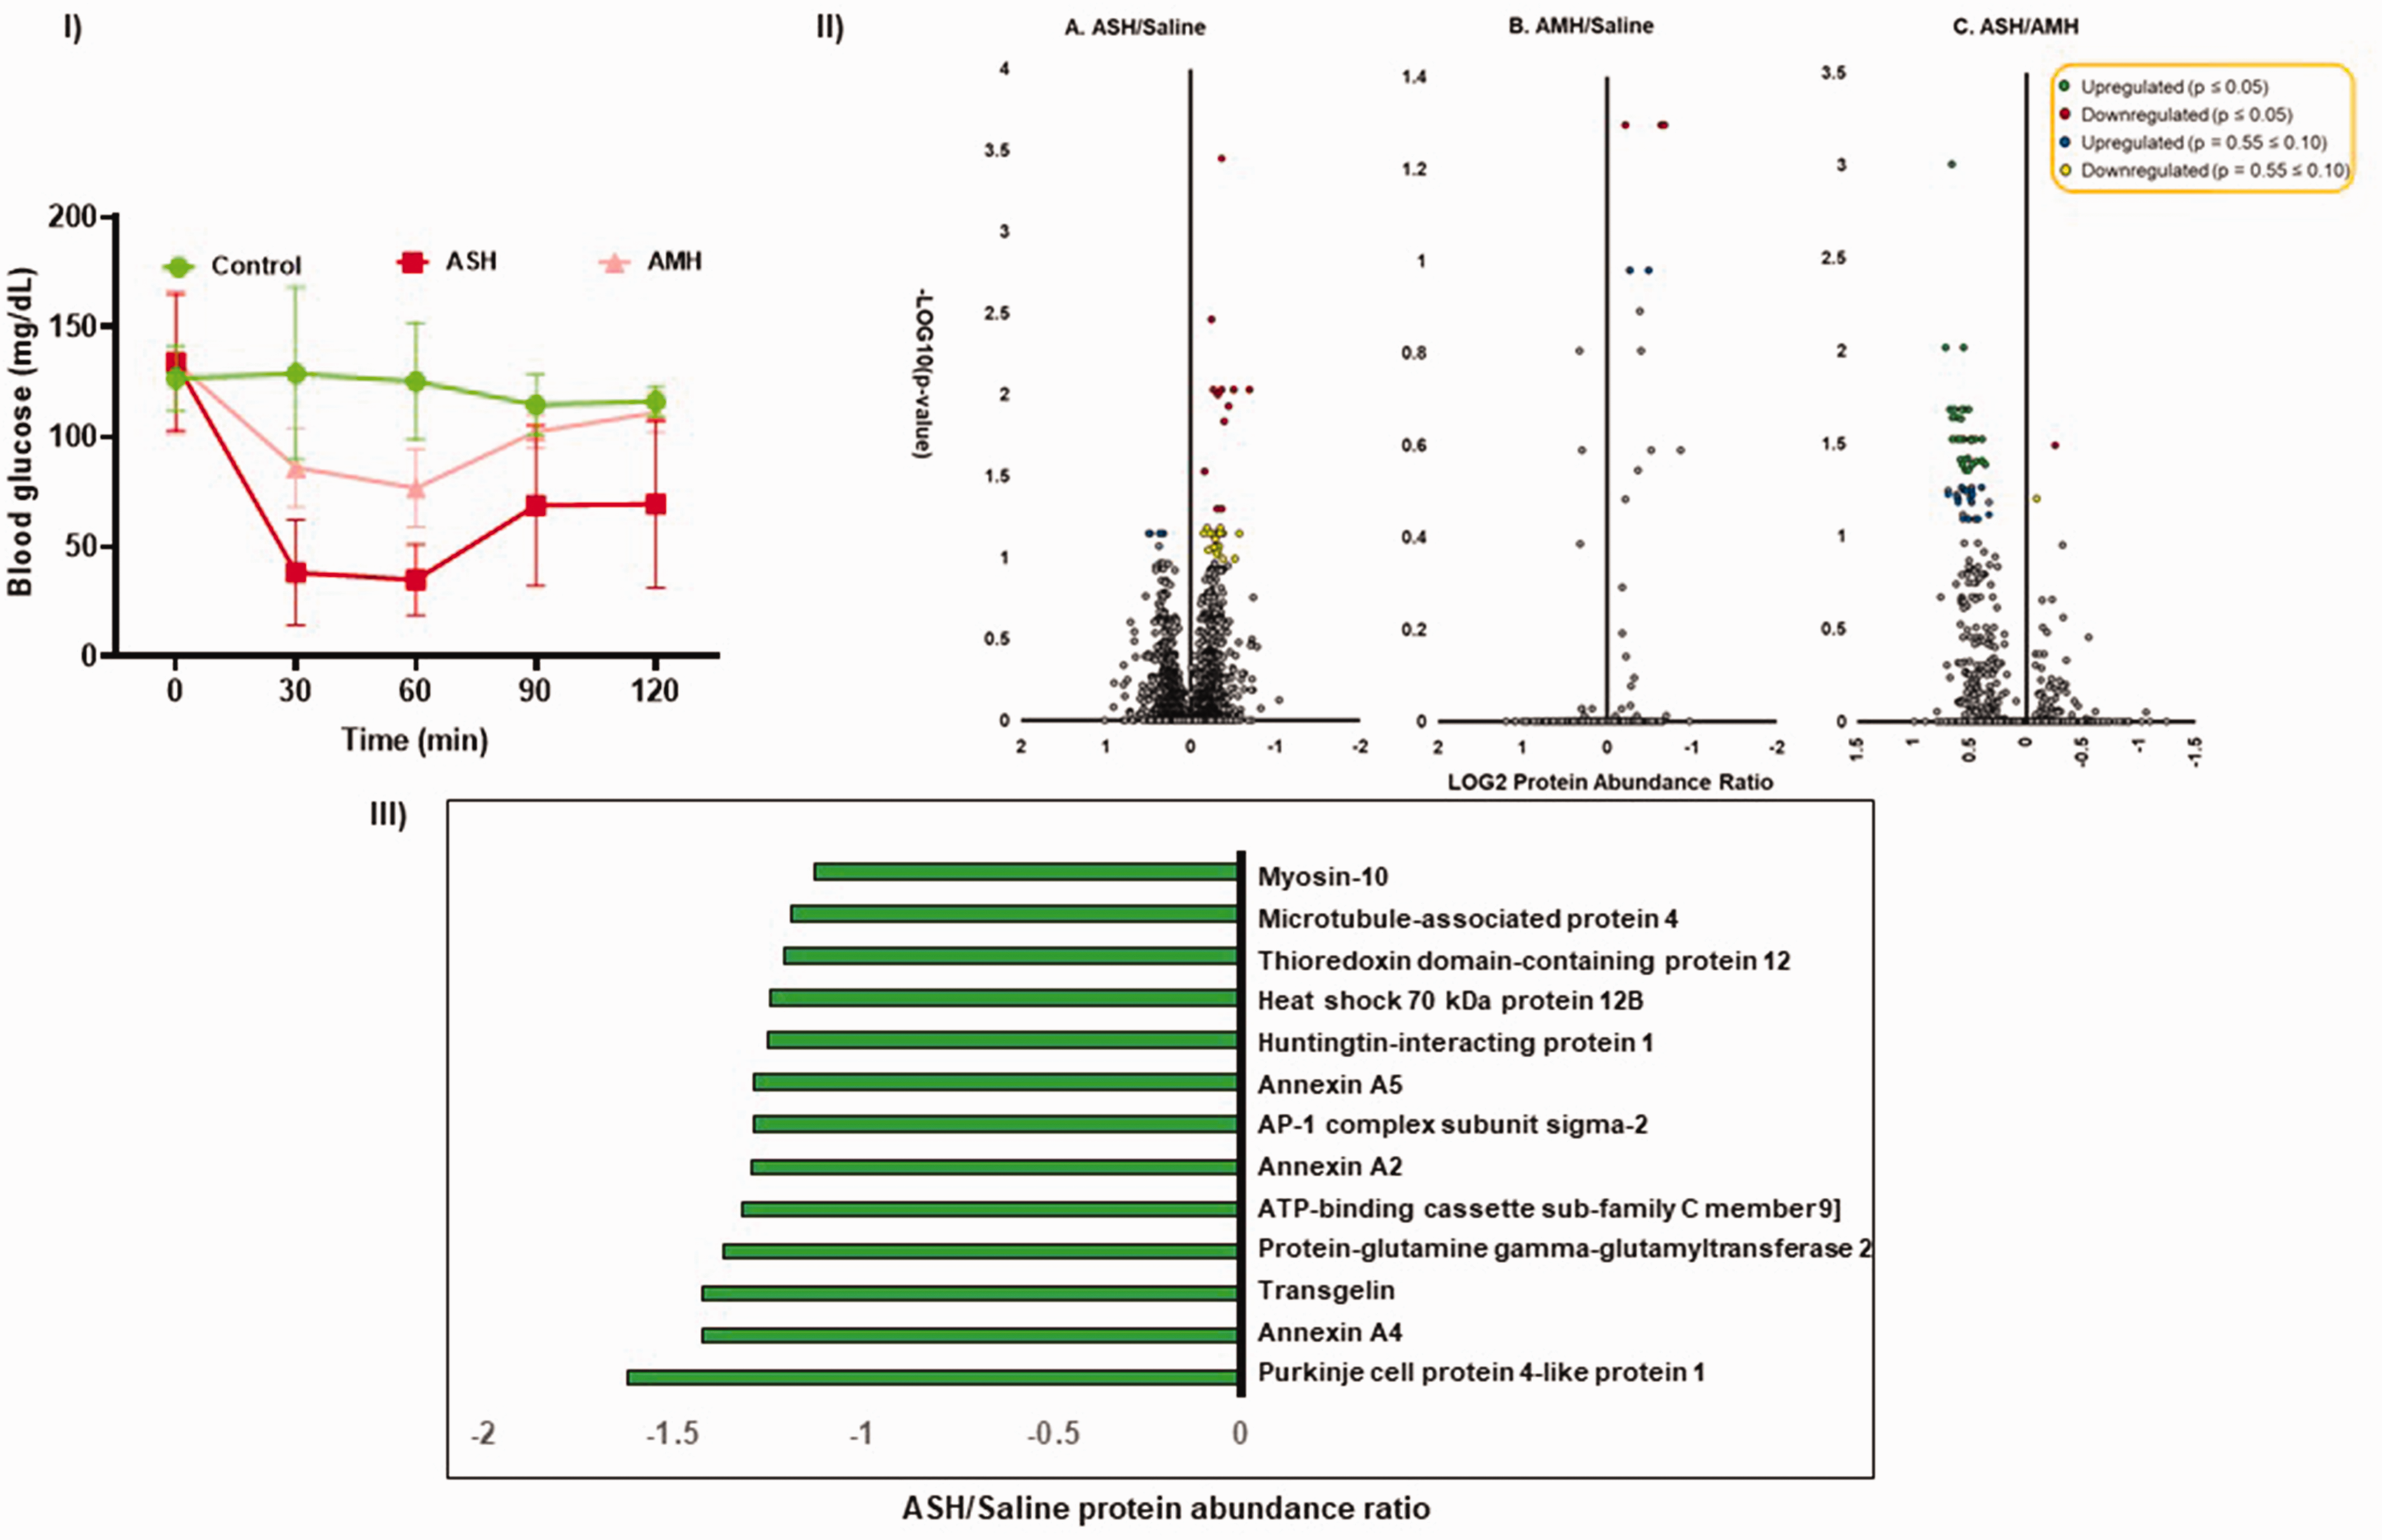
(I) Induction of acute severe- and mild- hypoglycemia (ASH and AMH). A single episode of ASH and AMH was induced in 2–4-month-old C57bl/6j mice after four hours of fasting by intraperitoneal injection of insulin (2 units/kg and 0.4 units/kg body weight respectively). Mice experienced a single ASH or AMH episode for at least 30–60 minutes (mean blood glucose values between 30 mg/dL for ASH& 75 mg/dL for AMH). Data represented as mean ± S.D. After twenty-four hours, BMVs were isolated and processed for TMT-based proteomics using LC/MS. N = 6 mice/group. (II). Volcano plots represent up- and down-regulated proteins between saline, severe- and mild-acute hypoglycemia. Statistical significance was measured using one-way ANOVA between the three groups. N = 5–6 mice/group. (III). List of downregulated proteins (p ≤ 0.05) by Severe Acute Hypoglycemia (ASH) in mouse brain microvessels (BMVs). The x-axis represents the protein abundance ratio between ASH and saline groups. The Y-axis represents proteins that are downregulated significantly (p ≤ 0.05). N = 5–6 mice/group.
Overview of the proteomic changes
BMVs were isolated 24 hours after the hypoglycemic episode and performed TMT-based quantitative proteomics using LC/MS. The current study detected 4891 quantifiable proteins in the mouse BMVs based on the detection of at least one unique peptide. Out of 4891, 4771 proteins were detected with high confidence with a false discovery rate (FDR) of less than one percent. Volcano plots were plotted between the three groups using the protein abundance ratios and ‘p’ values (Figure 1).
Proteins regulated by acute severe hypoglycemia (ASH)
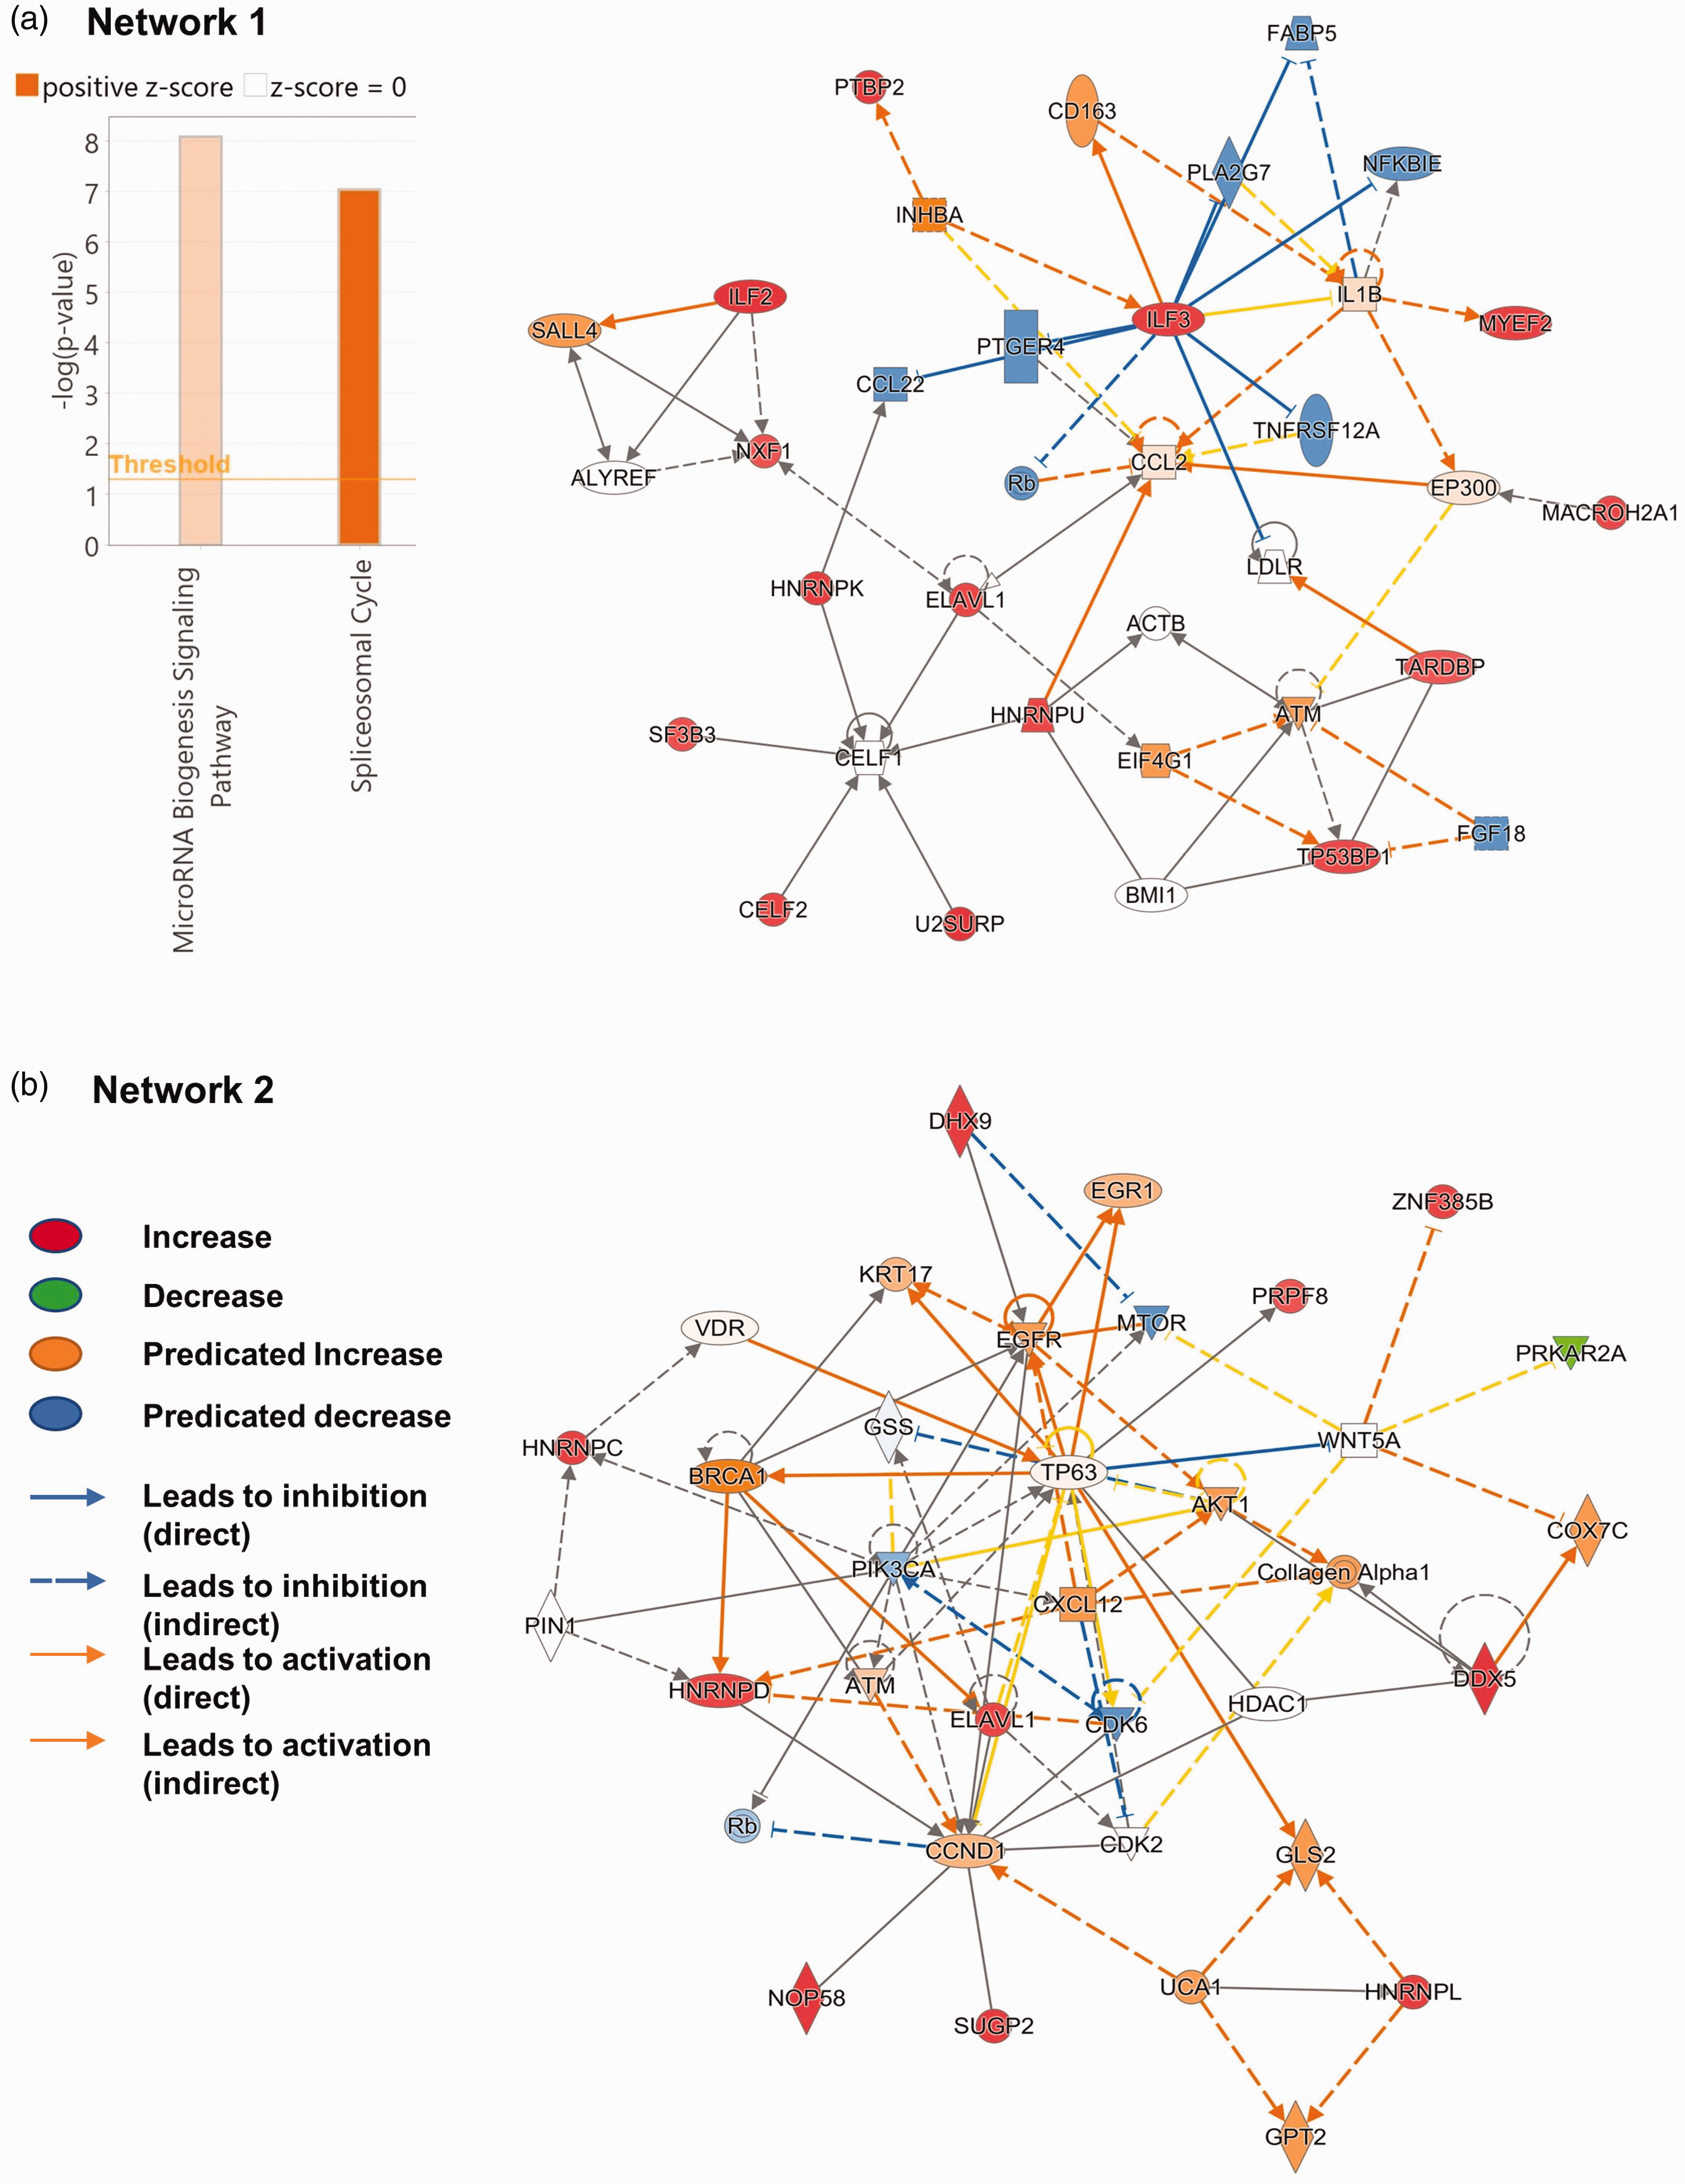
A total of thirteen proteins were significantly decreased (p ≤ 0.05) after 24 hours of the single episode of the ASH in mouse BMVs (Figure 1). None of the proteins were significantly elevated by the ASH. ASH appeared to significantly decrease the levels of twenty-three proteins (p ≤ 0.10), while five proteins exhibited a trend toward an increase (Figure 2). The majority of the downregulated proteins are structural proteins present in the extracellular matrix, plasma membrane, or cytoplasm mainly regulating actin filament dynamics thus regulating endothelial cell structure, movement, and permeability. Notable downregulated proteins include annexins (annexin 3 and 6), ATP-binding cassette family proteins (ABCB11, ABCC9, and ABCG2), and myosins (MYH 9 and 10) along with transgelins (TAGLN and TAGLN2) and Von Willebrand factor (VWF) (Figure 2). Both significantly downregulated proteins and the proteins that showed a strong tendency toward change were uploaded to the Ingenuity Pathway Analysis (IPA) software for the core analysis. IPA canonical pathway analysis revealed a significant decrease in cell movement, migration, and invasion pathways by the ASH in BMVs (Table 1). Most of the proteins downregulated are critical for angiogenesis (Table 1). Further IPA analysis reveals the upregulation of the cellular apoptotic pathway (Table 1). Network analysis further revealed possible downregulation of vascular endothelial growth factor (VEGF)-A signaling by ASH (Network 1, Figure 3), whereas similar changes were observed in C-X-C Motif Chemokine Ligand 8 (CXCL8) signaling (Network 2, Figure 3). Furthermore, IPA analysis revealed potential upstream regulators responsible for the observed proteomic alterations such as ubiquitin-like modifier activating enzyme 1 (UBA1), myocardin-related transcription factor B (MRTFB), protein tyrosine phosphatase 3 (PTPN3), and signal transducer and activator of transcription 3 (STAT3) (Table 1). Overall, the proteomic analysis of mouse BMVs a day after an episode of ASH reveals a possible decline in angiogenic potential through actin cytoskeleton remodeling and elevated apoptotic signatures.
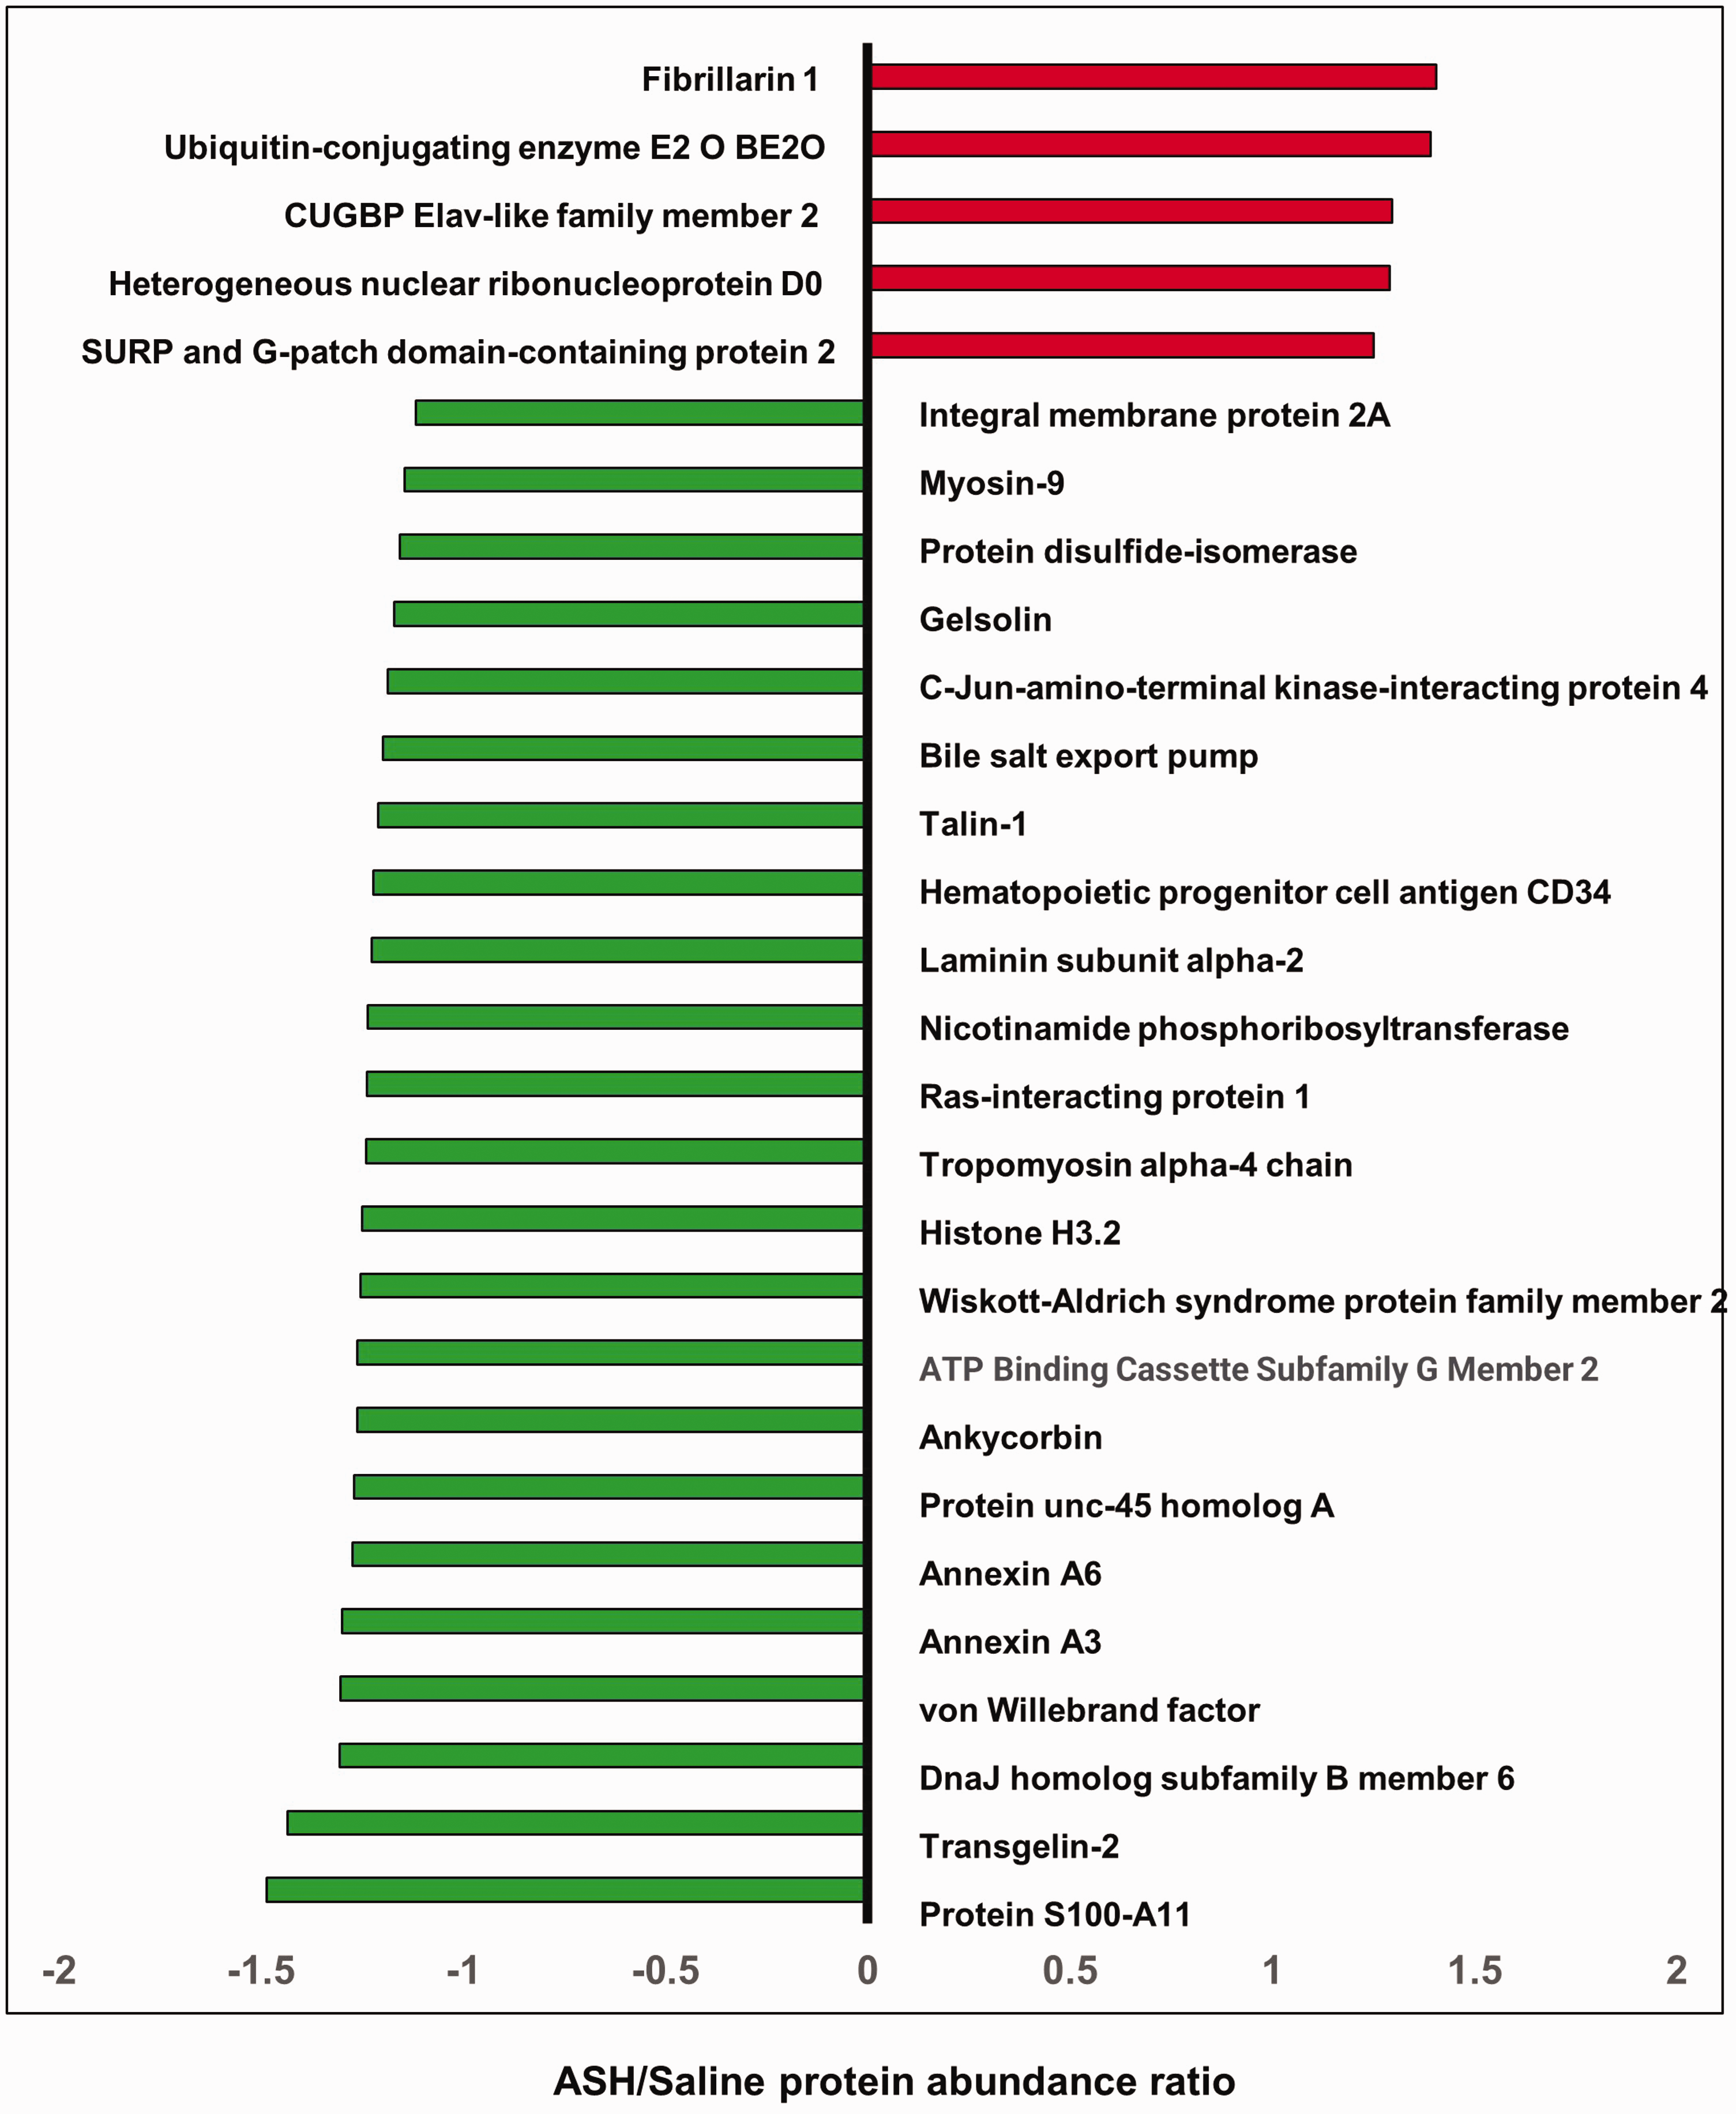
List of up-and down-regulated proteins (p ≤ 0.10) by Acute Severe Hypoglycemia (ASH) in mouse brain microvessels (BMVs). A single episode of ASH was induced in 2–4-month-old C57bl/6j mice after four hours of fasting by intraperitoneal injection of insulin (2 units/kg body weight). Mice experienced a single ASH episode for at least 30–60 minutes (mean blood glucose value 30 mg/dL). After twenty-four hours, BMVs were isolated and processed for TMT-based proteomics using LC/MS. The x-axis represents the protein abundance ratio between ASH and saline groups. The Y-axis represents proteins that showed a strong trend toward increase or decrease by ASH (p ≤ 0.10). N = 5–6 mice/group.
Ingenuity Pathway Analysis (IPA) of altered proteins.
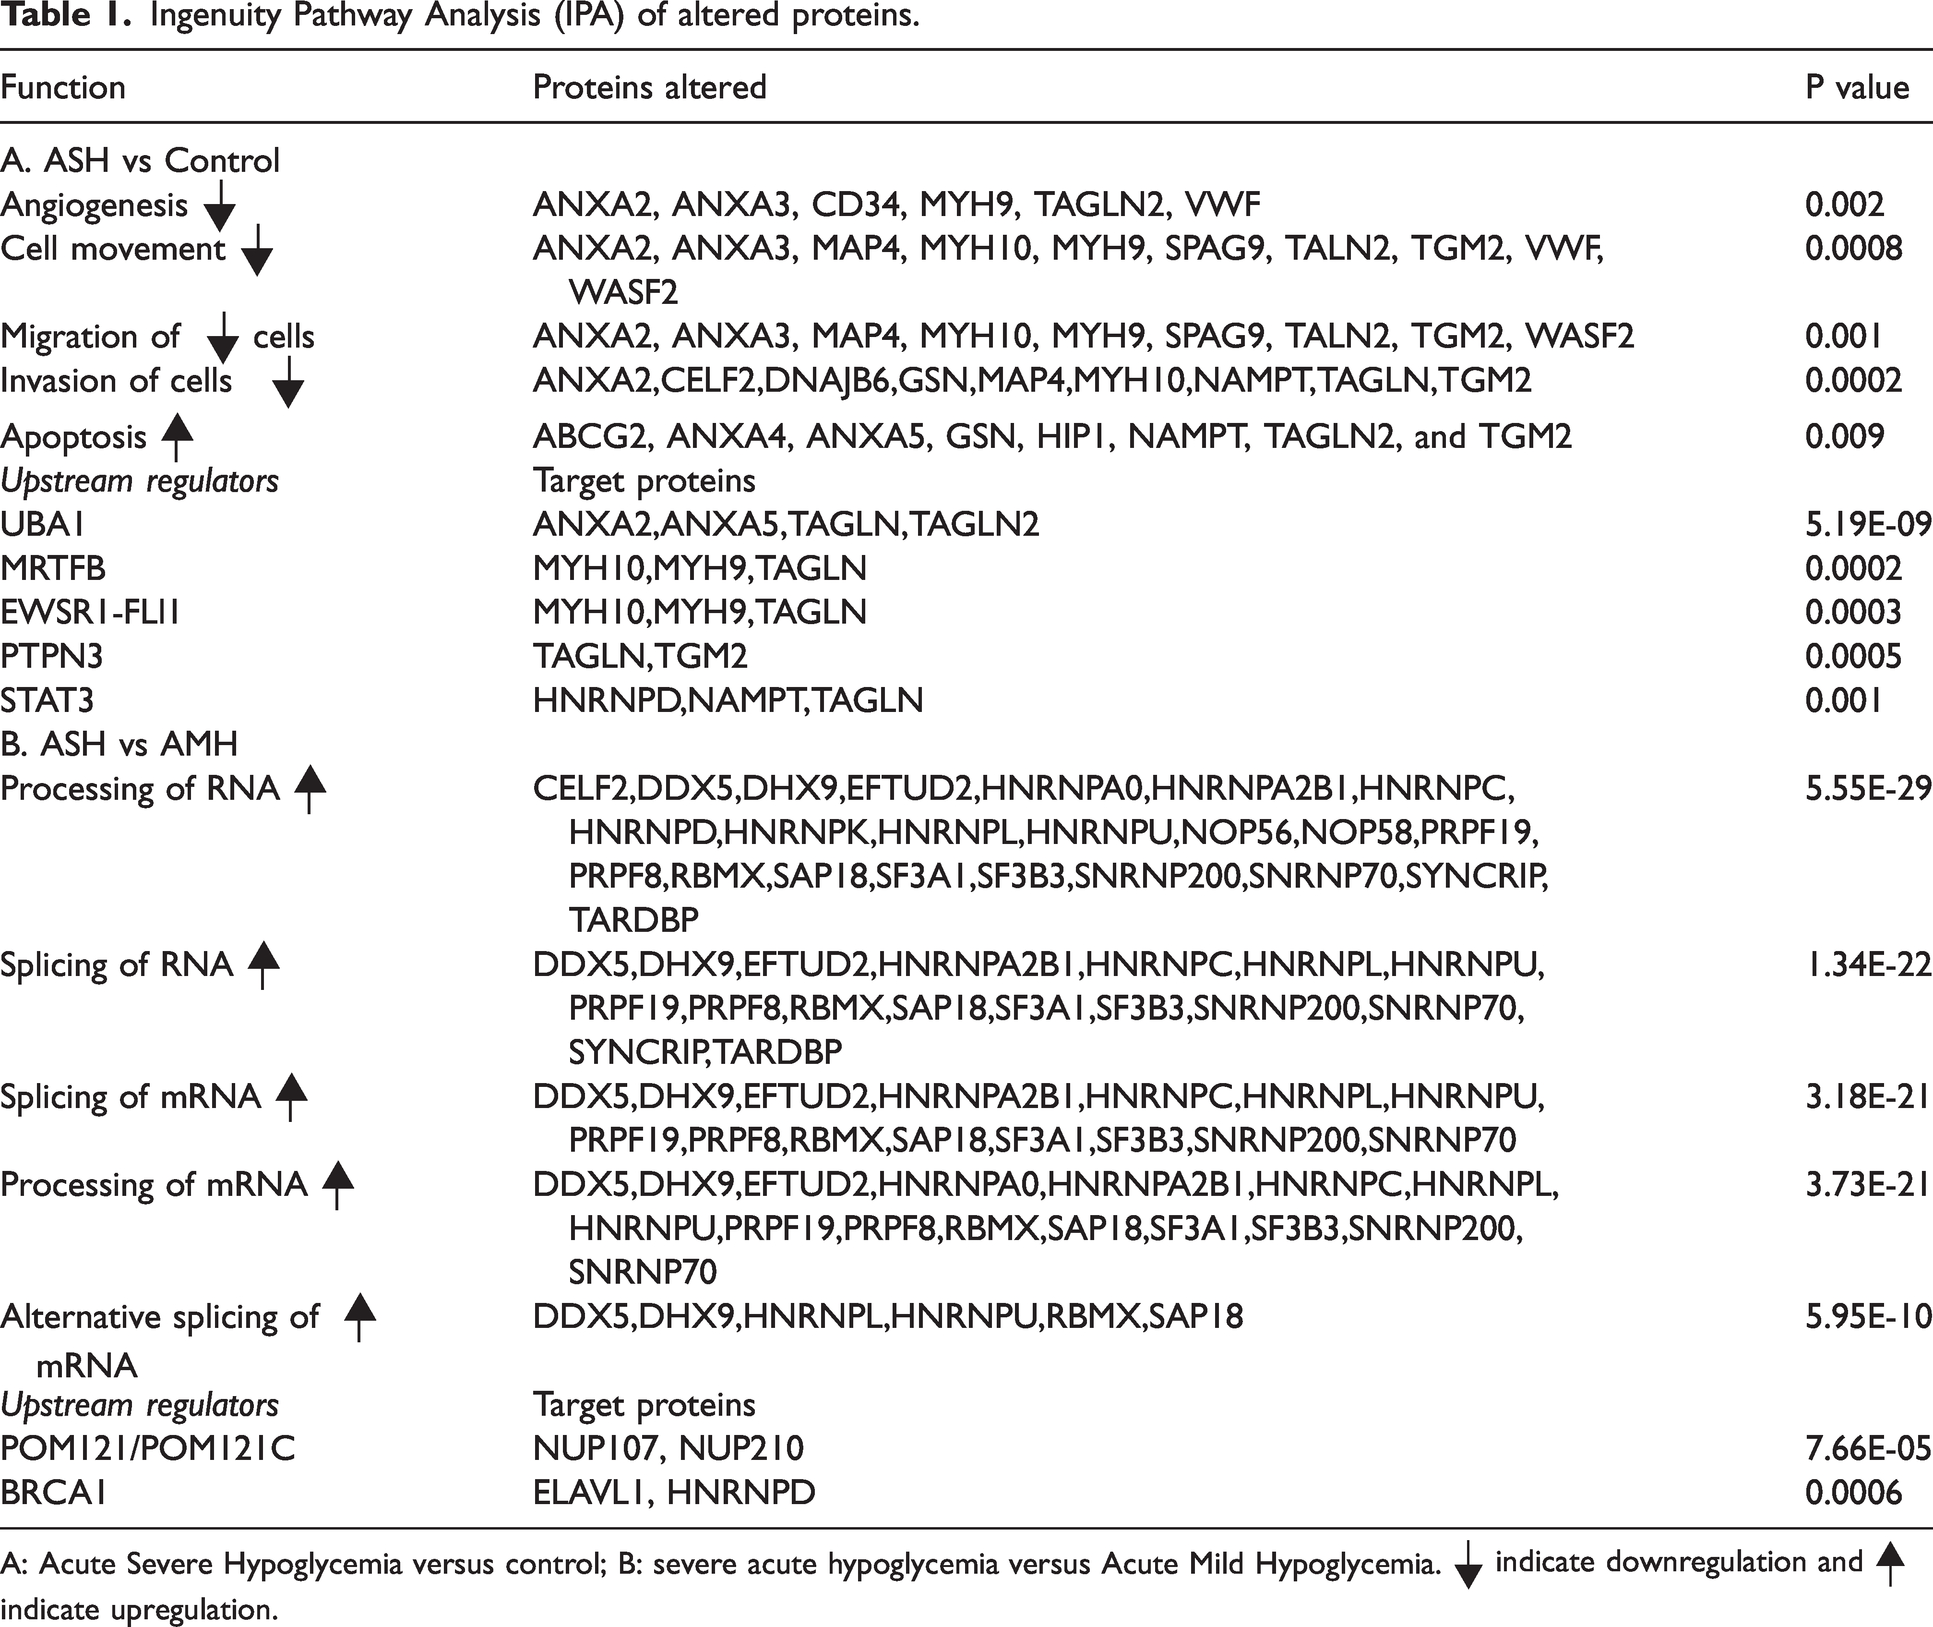
A: Acute Severe Hypoglycemia versus control; B: severe acute hypoglycemia versus Acute Mild Hypoglycemia. |▾ indicate downregulation and ▴| indicate upregulation.
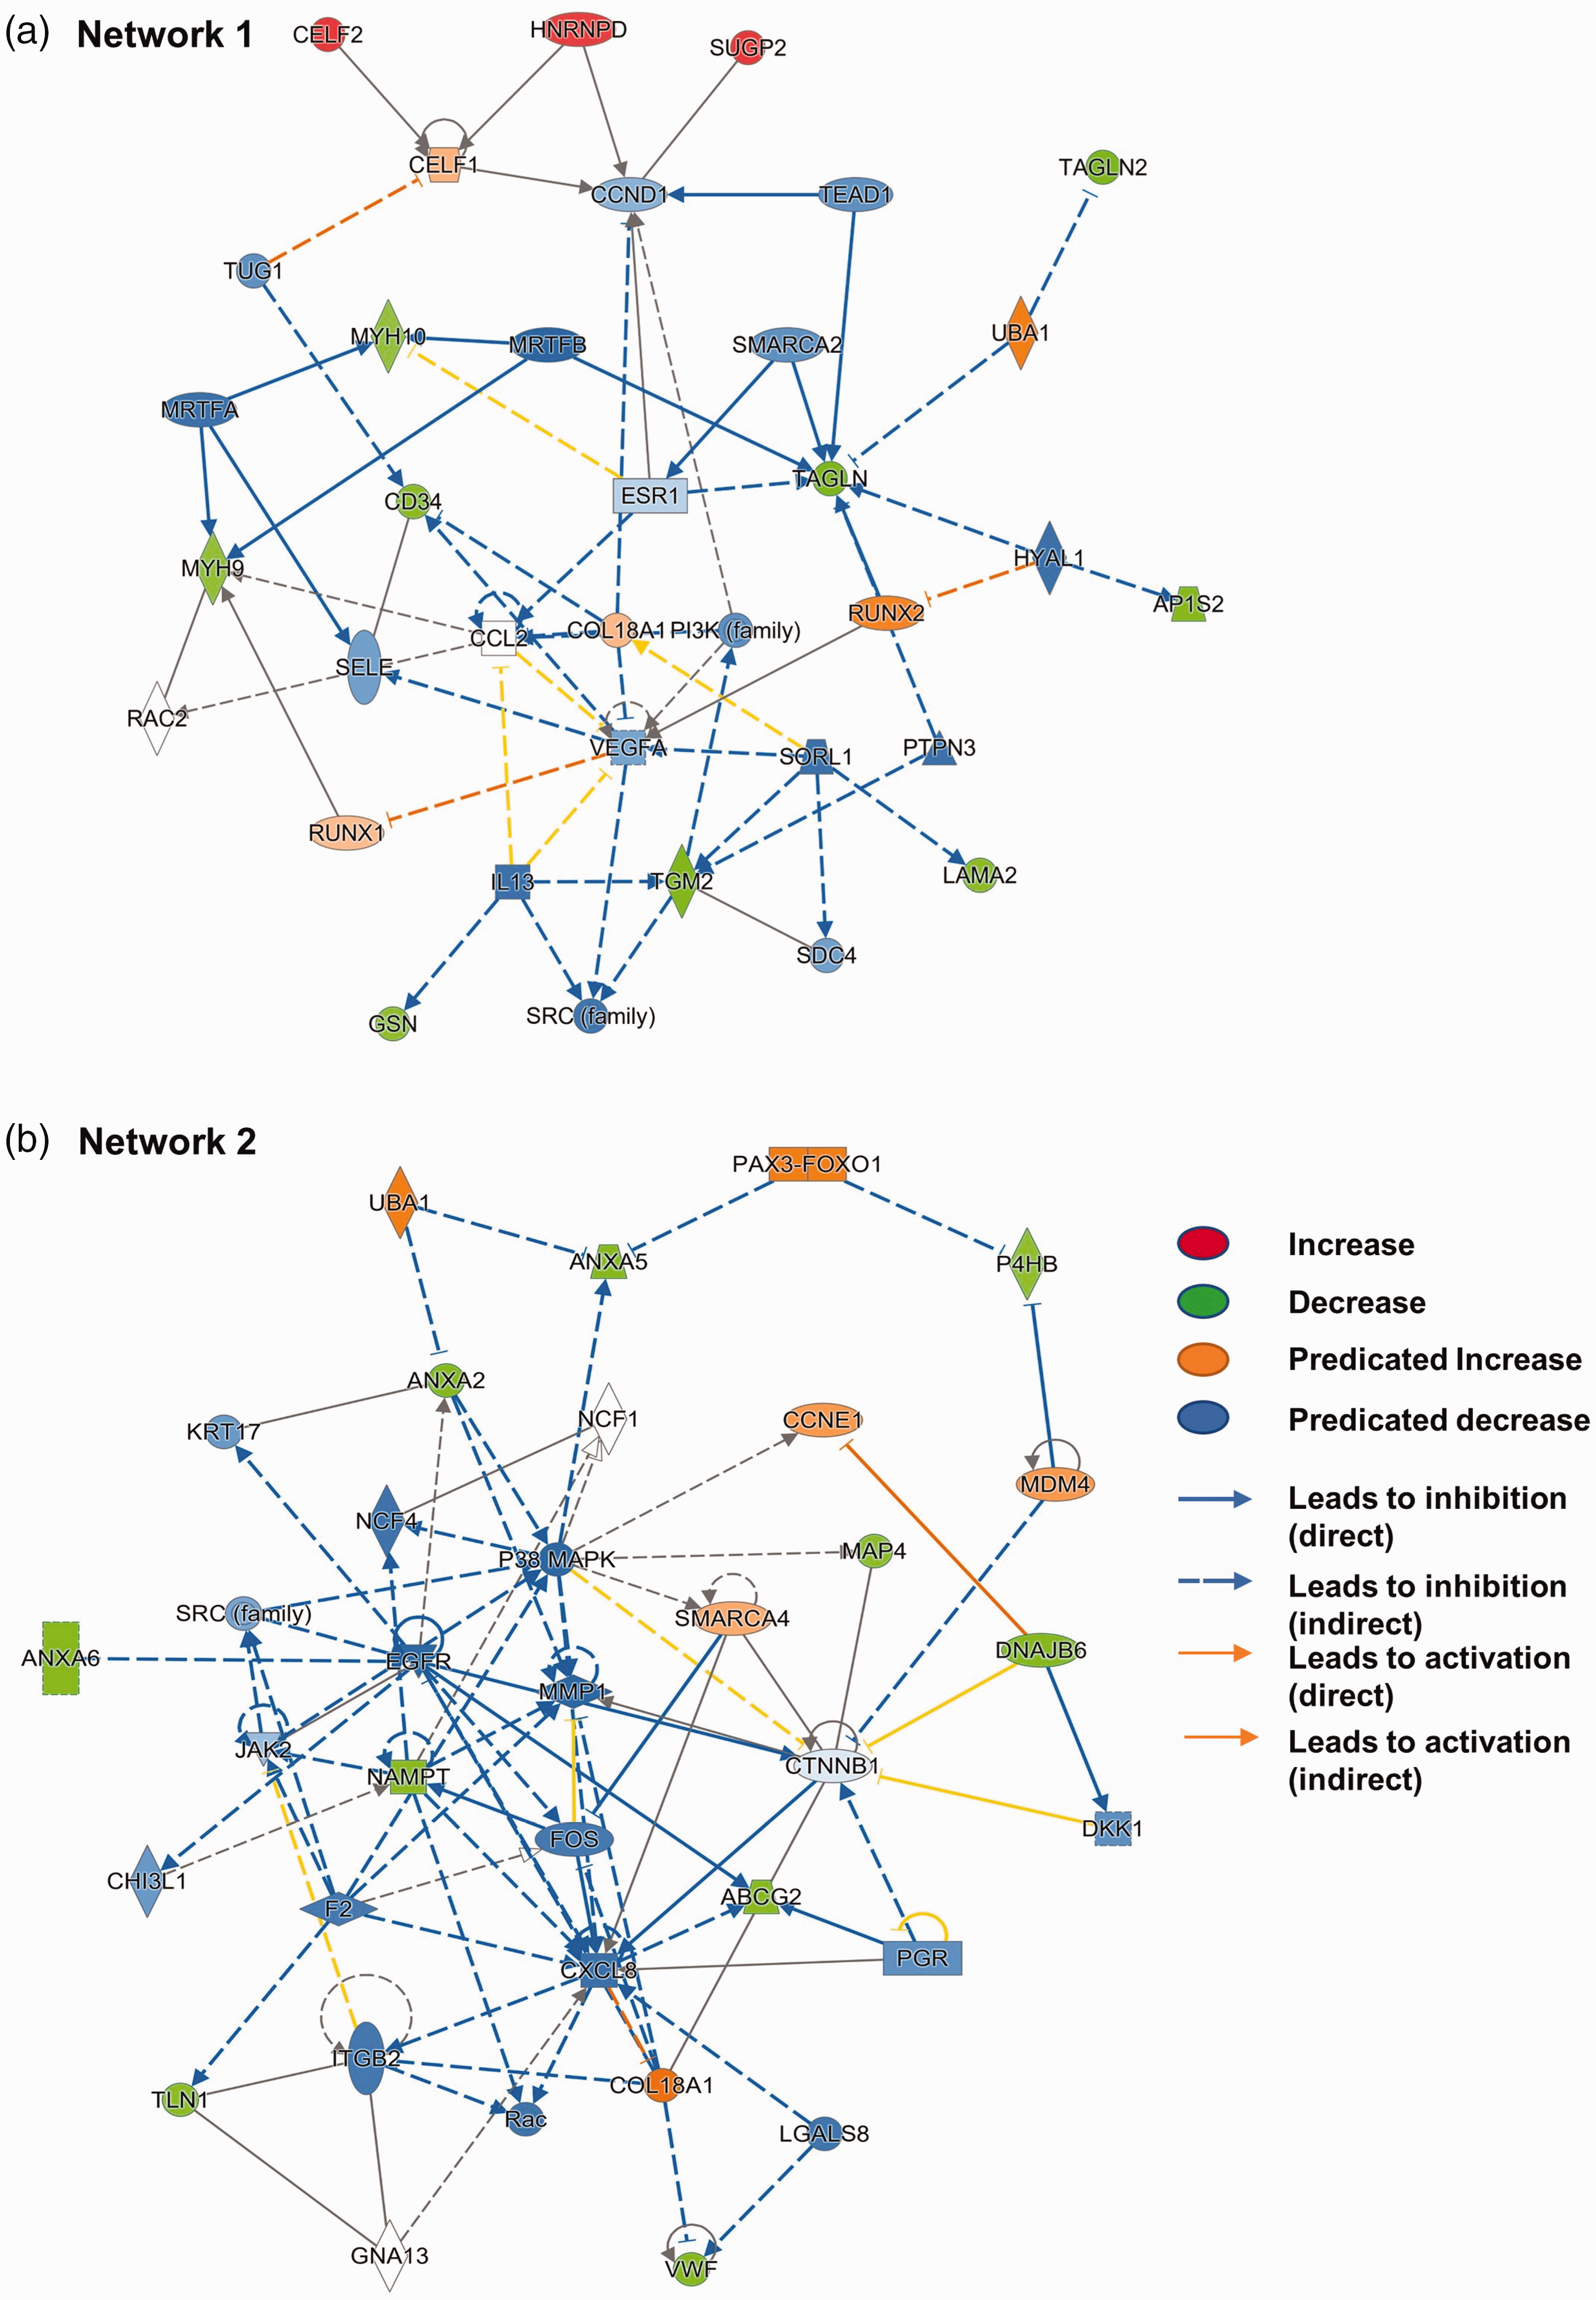
Predicted changes in molecular pathways based on altered protein expression by acute severe hypoglycemia in brain microvasculature. Ingenuity pathway analysis (IPA) was performed using the list of proteins significantly altered (p ≤ 0.05) and showed a strong trend (p ≤ 0.10) by ASH when compared to the control mice group. IPA analysis revealed two major networks. (a). Network 1. (b). Network 2.
Proteins regulated by acute mild hypoglycemia (AMH)
AMH induced the least proteomic changes in the BMVs. Only three proteins were significantly downregulated, and another two proteins showed a strong trend toward a decrease in AMH in the mouse BMVs when compared to the control mice (Figure 4(a)). Significantly downregulated proteins include Purkinje cell protein 4-like protein 1 (PCP4L1), transgelin (TAGLN), and hemoglobin subunit alpha (HBA1). Microtubule-associated protein 4 (MAP4) and thioredoxin domain-containing protein 12 (TXNDC12) showed a strong trend toward a decrease in AMH.
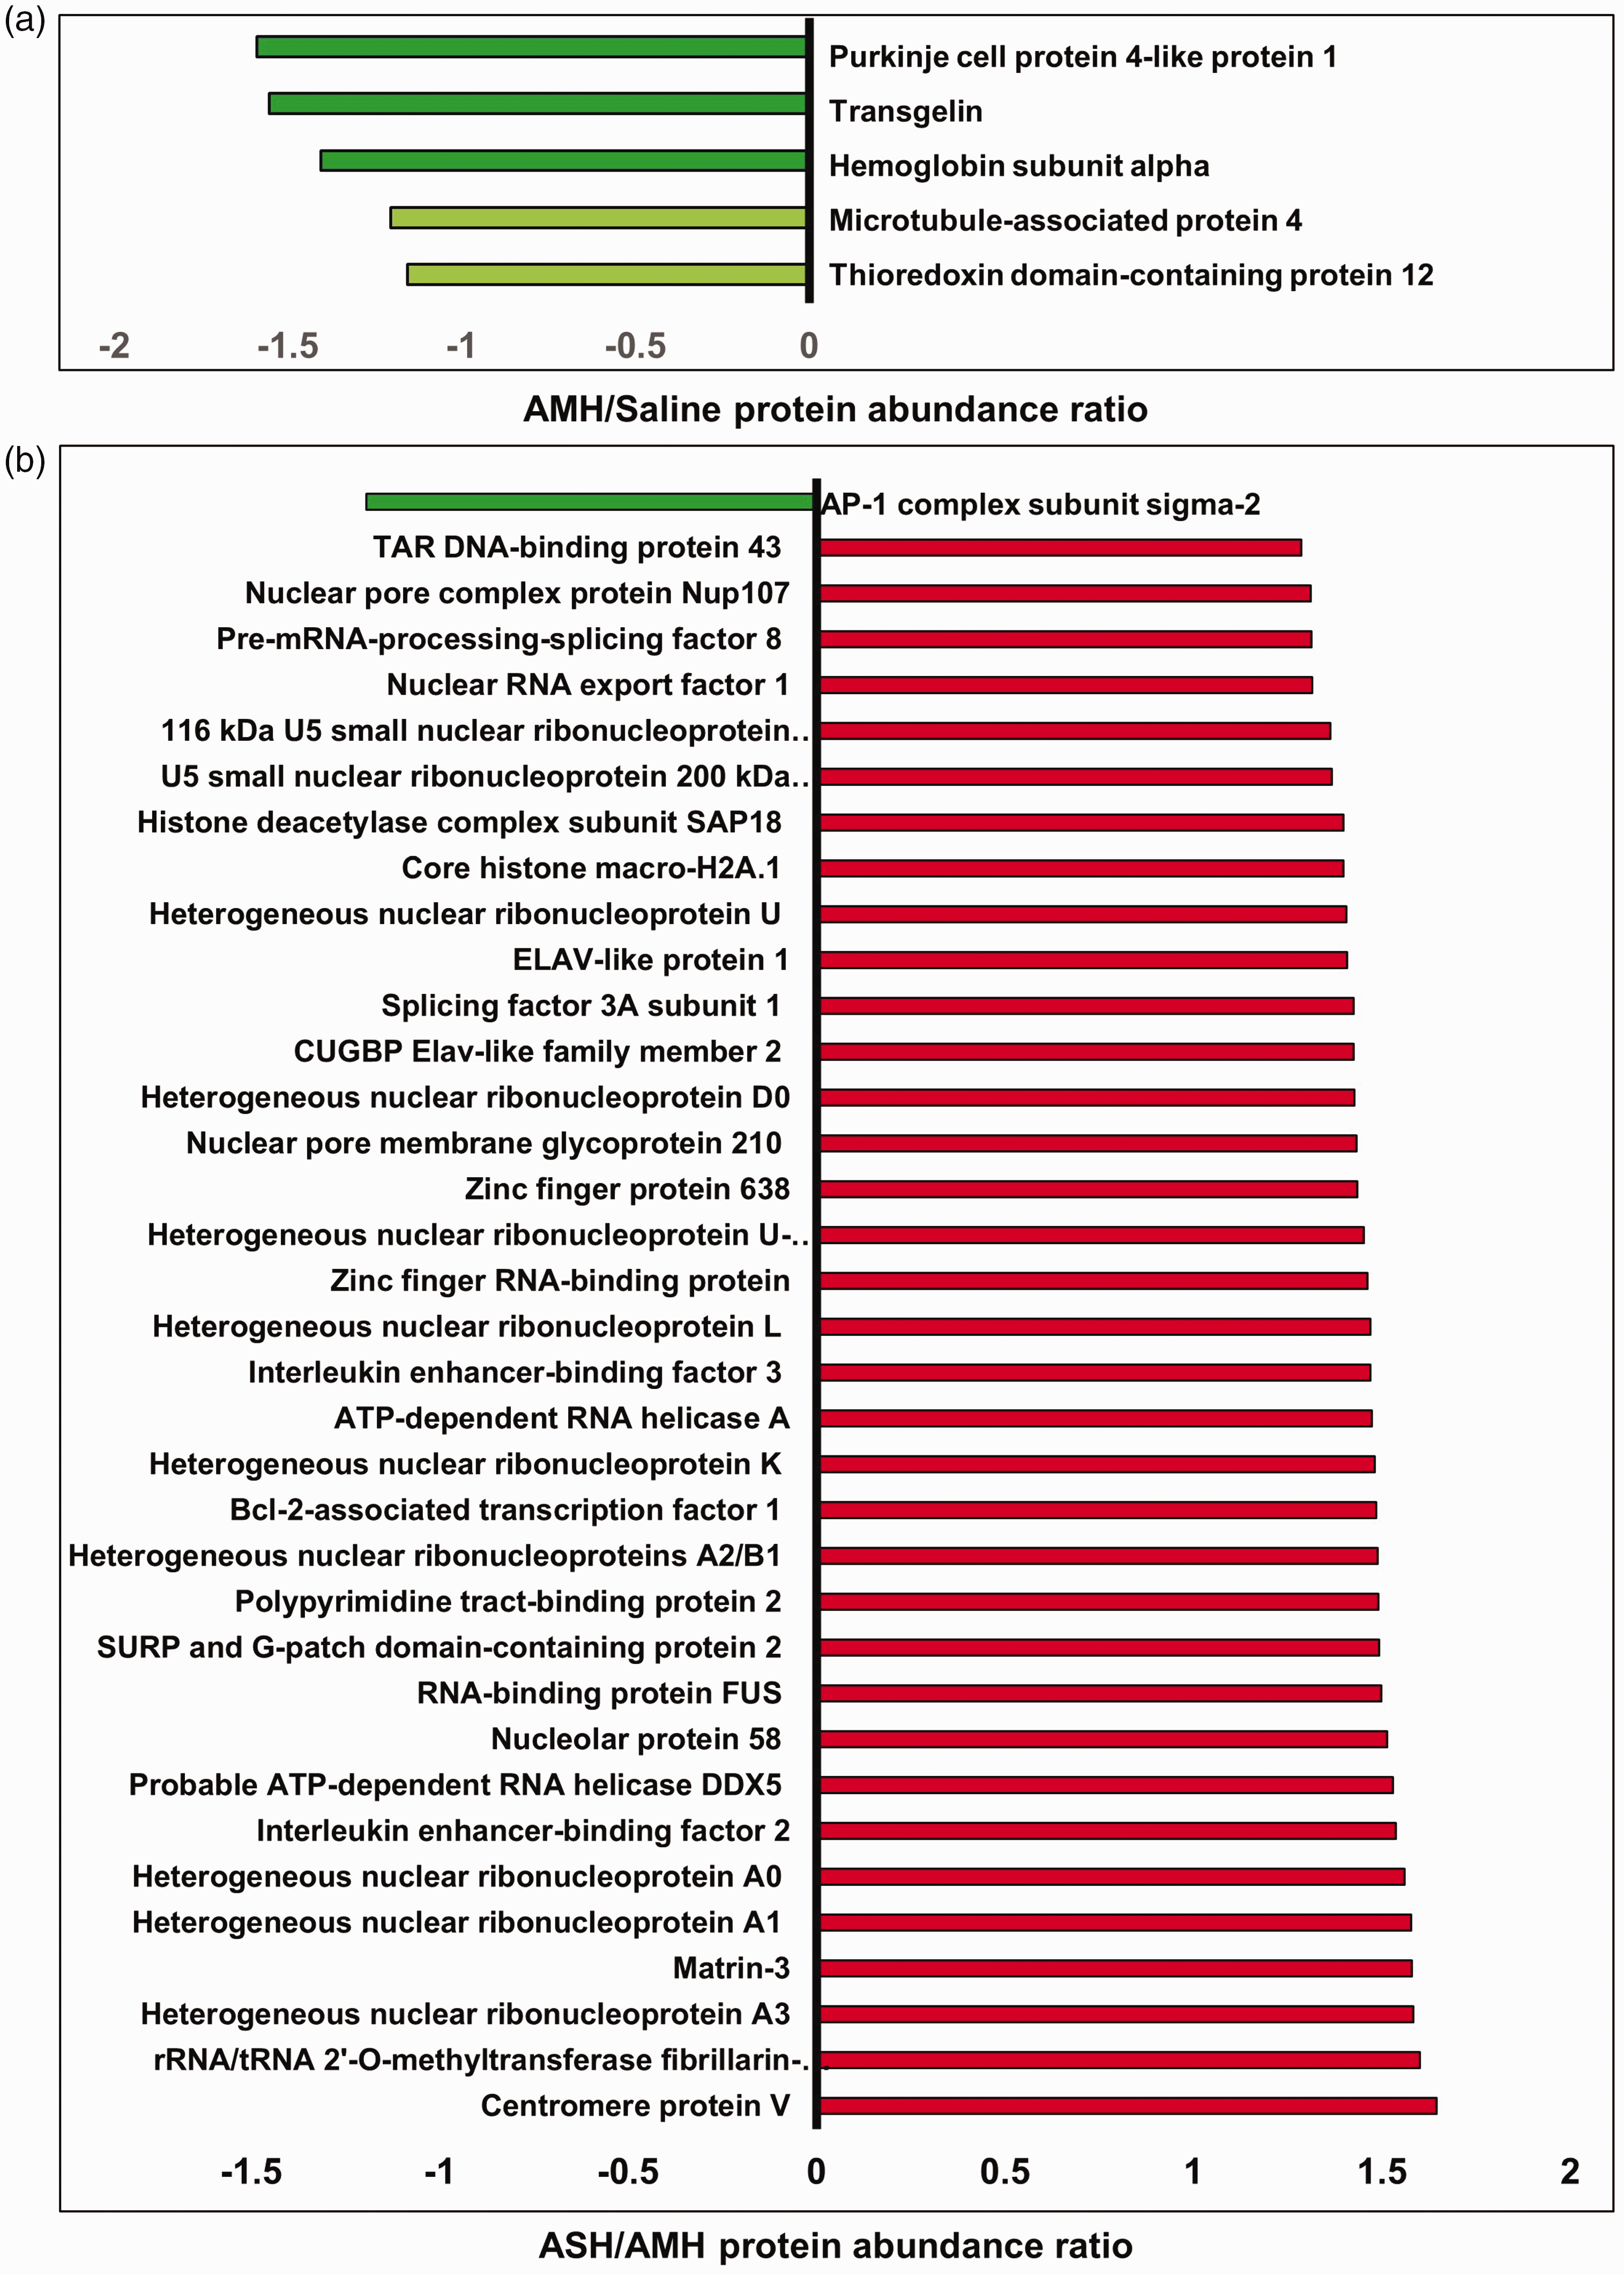
(a). List of downregulated proteins by Acute Mild Hypoglycemia (AMH) in mouse brain microvessels (BMVs). A single episode of AMH was induced in 2–4-month-old C57bl/6j mice after four hours of fasting by intraperitoneal injection of insulin (0.4 units/kg body weight). Mice experienced a single AMH episode for at least 30-60 minutes (mean blood glucose values between 70 mg/dL). After twenty-four hours, BMVs were isolated and processed for TMT-based proteomics using LC/MS. The x-axis represents the protein abundance ratio between AMH and saline groups. The Y-axis represents proteins that are downregulated significantly (dark green bars: p ≤ 0.05) and the ones that showed a strong trend towards decrease (light green bars: p ≤ 0.10). N = 5–6 mice/group. (b). List of up-and down-regulated proteins (p ≤ 0.05) between Acute Severe and Mild Hypoglycemia (ASH & AMH) in mouse brain microvessels (BMVs). A single episode of ASH and AMH was induced in 2–4-month-old C57bl/6j mice after four hours of fasting by intraperitoneal injection of insulin (2 units/kg and 0.4 units/kg body weight respectively). Mice experienced a single ASH or AMH episode for at least 30–60 minutes (mean blood glucose values; 30 mg/dL for ASH& 70 mg/dL for AMH). After twenty-four hours, BMVs were isolated and processed for TMT-based proteomics using LC/MS. The x-axis represents the protein abundance ratio between ASH and AMH groups. The Y-axis represents proteins that are dysregulated significantly (p ≤ 0.05). N = 5–6 mice/group.
Altered proteins between ASH and AMH
A total of thirty-five proteins were significantly upregulated by ASH when compared to AMH in the mouse BMVs (p ≤ 0.05, Figure 4(b)) while a single protein was downregulated (Figure 4(b)). Similarly, following ASH, thirteen proteins showed strongly increasing trends while only one protein showed a strong decreasing trend as compared to the AMH in the mouse BMVs (p ≤ 0.10, Figure 5). Interestingly, most of the proteins that were upregulated by ASH when compared to AMH also showed an increasing trend when compared to the control samples. However, due to variability among the samples, these observations did not reach statistical significance. Interestingly, all the upregulated proteins are nucleic-acid-binding proteins, mainly RNA-binding proteins involved in mRNA splicing and stability. Both significantly altered proteins and the proteins that showed a strong trend towards altered levels were uploaded to the IPA for the core analysis. The IPA analysis revealed two significantly upregulated pathways induced by ASH, namely the spliceosome cycle and microRNA biogenesis signaling pathways (Figure 6). This aligns with the fact that the top 5 significantly affected functions resulting from the proteomic changes all involve RNA post-transcriptional processing (Table 1). Network analysis reveals the possible upregulation of interleukin enhancer-binding factor 3 (ILF3), epidermal growth factor receptor (EGFR), and cyclin D1 (CCND1) signaling (Figure 6). This analysis also showed the downregulation of pathways like the mammalian target of rapamycin (MTOR), cell division protein kinase 6 (CDK6), and phosphatidylinositol-4,5-Bisphosphate 3-Kinase Catalytic Subunit Alpha (PI3KCA) (Figure 6). These networks indicate changes in cell growth, development, and organismal injury and survival (Table 1). Upstream molecule analysis revealed the possible activation of molecules like nuclear envelope pore membrane proteins (POM121/POM121C) and breast cancer gene 1 BRCA1 (Table 1).
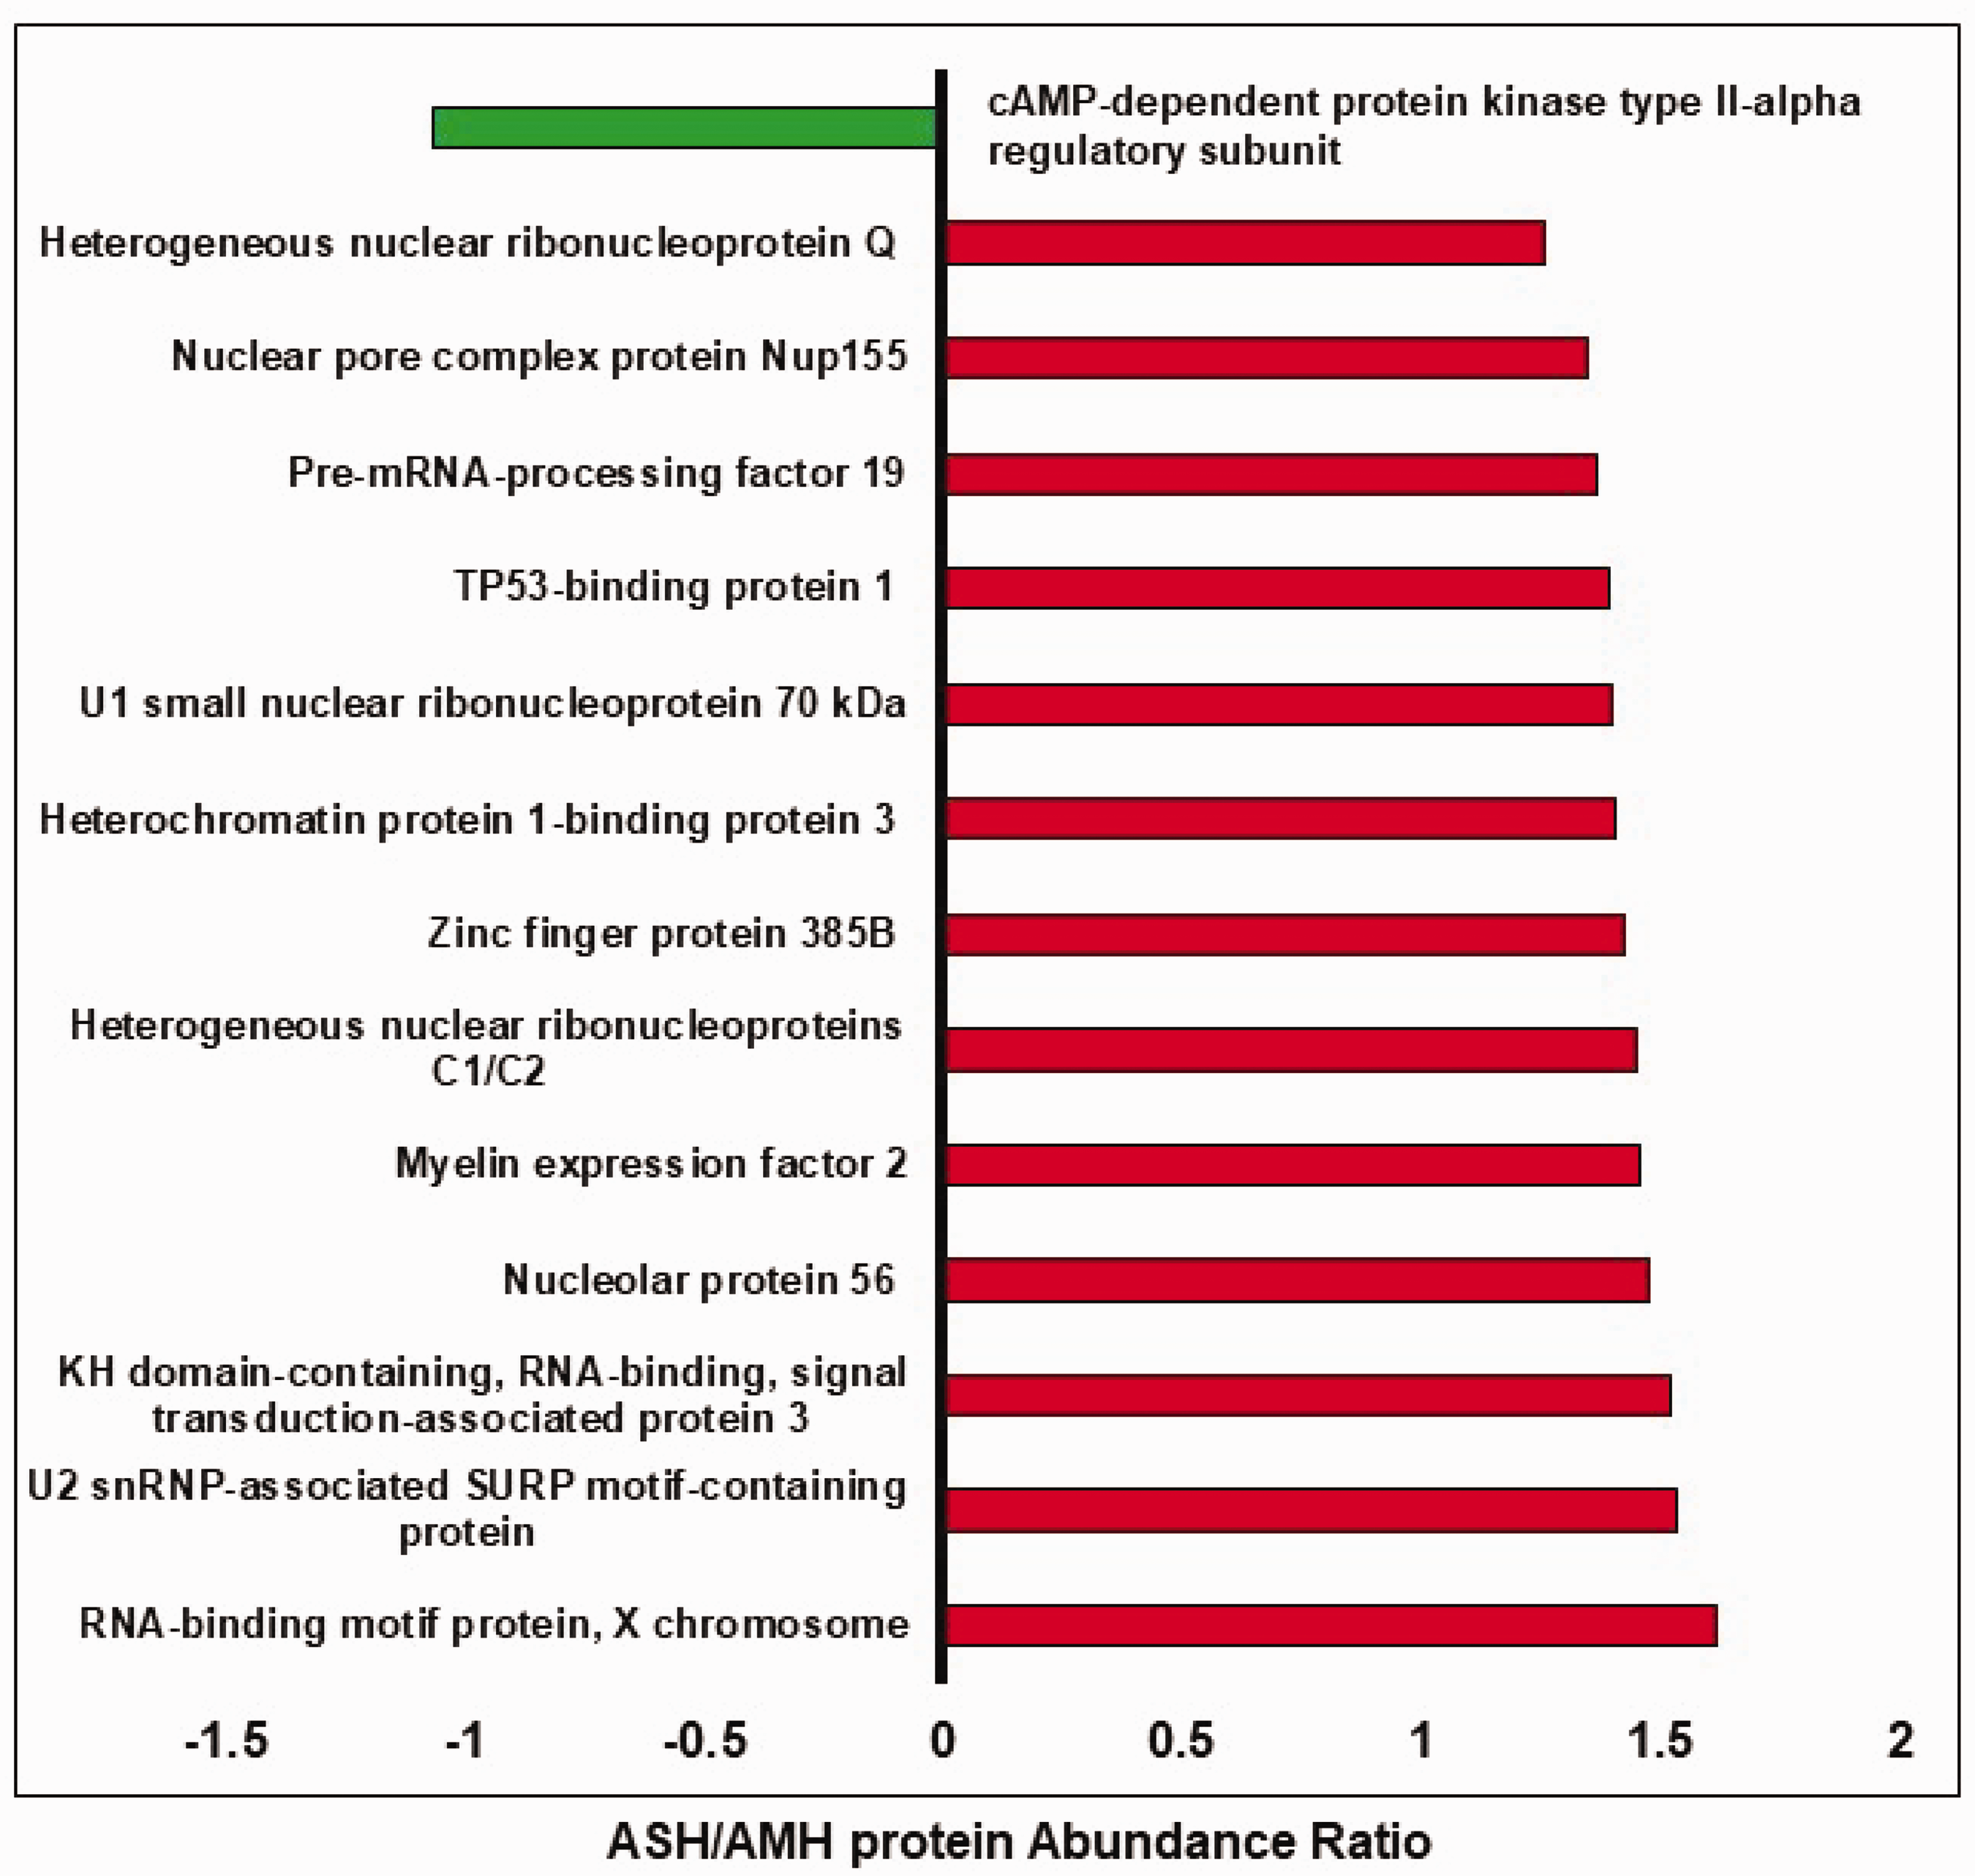
List of up-and down-regulated proteins (p ≤ 0.10) between Acute Severe and Mild Hypoglycemia (ASH & AMH) in mouse brain microvessels (BMVs). A single episode of ASH and AMH was induced in 2–4-month-old C57bl/6j mice after four hours of fasting by intraperitoneal injection of insulin (2 units/kg and 0.4 units/kg body weight respectively). Mice experienced a single ASH or AMH episode for at least 30 minutes (mean blood glucose values between 30-40 mg/dL for ASH& 70–90 mg/dL for AMH). After twenty-four hours BMVs were isolated and processed for TMT-based proteomics using LC/MS. The x-axis represents the protein abundance ratio between ASH and AMH groups. The Y-axis represents proteins that showed a strong trend towards increase or decrease (p ≤ 0.10). N = 5–6 mice/group.
Predicted molecular networks based on altered protein expression by Acute Severe Hypoglycemia (ASH) when compared to Acute Mild Hypoglycemia (AMH) in the brain microvasculature. Ingenuity pathway analysis (IPA) analysis was performed using the list of proteins significantly altered (p ≤ 0.05) and showed a strong trend (p ≤ 0.10) by ASH when compared to the AMH group. IPA analysis revealed two major networks. (a). Network 1. (b). Network 2.
Discussion
In the present study, for the first time, we report the effect of a single episode of severe and mild hypoglycemia on brain microvascular proteomics. The major observations from this study include, 1) Severe acute hypoglycemia significantly alters the BMV proteome compared to mild acute hypoglycemia 24 hours after the insult, 2) severe hypoglycemia extensively downregulates proteins involved in actin cytoskeleton maintenance critical for maintaining microvascular structure, permeability and angiogenesis, 3) severe hypoglycemia exclusively upregulates RNA-binding proteins involved in mRNA splicing and stability, and finally 4) multiple proteins dysregulated by severe hypoglycemia are associated with stroke injury and neurodegenerative diseases.
Downregulated proteins – Severe hypoglycemia
One of the significant observations is the downregulation of annexin proteins by severe hypoglycemia in BMVs. Annexins are calcium-binding cytosolic proteins involved in various cellular functions. 34 Annexins were shown to play a critical role in endothelial functions. Annexin2 acts as a coreceptor for tPA in endothelial cells thus critical for plasmin formation and fibrinolysis. 35 Furthermore, Annexin2 prevents neuroinflammation, and microvascular leak and is critical for cerebral angiogenesis.36,37 Similarly, Annexin 3 is a potential angiogenic mediator and Annexin 5 resists vascular inflammation and protects from endothelial dysfunction.38,39 Downregulation of Annexins in BMVs from mice subjected to a brief episode of severe hypoglycemia followed by restoration of normoglycemia for 24 hours suggests potential impairments of an endothelial phenotype related to angiogenesis, BBB, and fibrinolysis. Moreover, Annexin-binding proteins such as protein S100-A11 which are involved in endothelial membrane repair were downregulated by ASH. 40 These observations suggest that severe hypoglycemia in the BMVs promotes potential endothelial dysfunction by alteration of calcium signaling, membrane trafficking, and actin cytoskeleton modifications.
One of the major downregulated pathways by ASH in BMVs is the actin cytoskeleton dynamics. The majority of the downregulated proteins are actin-binding proteins regulating actin cytoskeleton polymerization/depolymerization. Actin filament dynamics are very critical in maintaining endothelial cell shape, migration, and proliferation thus regulating vascular structure and function. 41 Actin-binding proteins downregulated by ASH include myosin 10, Huntington-interacting protein 1 (HIP1), transgelin 1 and 2, gelsolin, Wiskott-Aldrich syndrome protein family member 2 (WASP2), Ankyrocorbin, Talin, and Tropomyosin alpha 4-chain (TPM4). Myosin 10, Talin, and Gelsolin were shown to be critical for maintaining BBB,42 –44 whereas HIP1 and transgelin proteins were shown to promote angiogenesis.45,46 In support of these observations, hypoglycemia was shown to impair actin alignment in vitro. 47 Microtubule-associated protein-4 (MAP4) is another downregulated structural protein involved in hypoxic-endothelial cell proliferation and migration. 48 Furthermore, proteins like integral transmembrane protein 2 A (ITM2A) and laminin subunit alpha-2 are basement membrane proteins that were downregulated in the BMVs by ASH. Interestingly, ITM2A is a brain EC-specific protein regulating transcytosis at BBB. 49
In addition to annexins and cytoskeletal proteins, ASH reduced the levels of other proteins that are well known to mediate angiogenesis and vascular permeability. Heat shock 70 kDa protein 12B (HSP12B) is an endothelial-cell specific chaperone involved in cell migration and angiogenesis. 50 Nicotinamide phosphoribosyltransferase (NAMPT) is the rate-limiting enzyme in the NAD salvage pathway and facilitates post-stroke angiogenesis. 51 Ras-interacting protein 1 (RASP1) critical regulator of vasculogenic and angiogenesis. 52 The down-regulation of HSP12B, NAMPT, and RASP1 provides additional support for the hypothesis derived from our proteomics data, suggesting that ASH reduces the angiogenic potential of the brain microvasculature.
Previous studies reported that hypoglycemia alters the fibrinolytic balance mainly toward thrombus formation. 53 In addition to other thrombus-promoting proteins like protein disulfide isomerase (PDI), VWF, a platelet activator, was reduced in the BMVs by ASH.54,55
Proteins such as Adaptor Related Protein Complex 1 Subunit Sigma 2 (AP1S2), Sulfonylurea receptor 2 (SUR2), and DnaJ homolog subfamily B member 6 (DNAJB6), which experienced down-regulation, have been shown to be associated with neurological disorders. AP1S2 is involved in protein sorting and is associated with intellectual disabilities. 56 SUR2, a gene product of the ABCC9 gene, is a subunit of the ATP-sensitive potassium (KATP) channel and plays an important role in channel regulation. KATP channels are critical to the functioning of the neurovascular unit and are involved in the pathogenesis of several neurological disorders including depression. 57 Similarly, DNAJB6 is a molecular chaperone involved in the pathology of neurodegenerative diseases like Parkinson’s and Huntington’s diseases. 58
Overall proteomic changes observed in BMVs 24 hours after the severe hypoglycemic insult indicate the downregulation of calcium-binding proteins majorly involved in the regulation of actin cytoskeleton, which is a critical regulator of endothelial cell shape, motility, and cell-cell interactions. At the functional level, these changes can impact BBB permeability and angiogenesis. Further studies are necessary to characterize these functional changes following recurrent ASH and the duration up to which these proteomic and functional changes remain after the insult. Importantly, as multiple proteins involved in endothelial function are downregulated by hypoglycemia, there is a high possibility that some of these proteins mediate the hypoglycemia-induced risk of stroke injury, cognitive defects, and neurodegenerative diseases.
Upregulated proteins – Severe hypoglycemia
Interestingly, all the upregulated proteins by ASH when compared to AMH are nuclear proteins including RNA-binding proteins (RBPs) that are involved in RNA splicing, transport, and stability. Though RBPs are significantly upregulated by ASH in comparison to AMH, a good number of these proteins also showed an increasing trend when compared to control euglycemic mice. The statistical differences in protein expression observed between ASH and AMH/control may be attributed to biological variations.
RNA splicing is fundamental cellular processing resulting in the generation variety of proteins from a single gene. Though it is a well-characterized process, its role in cerebrovascular disease pathologies has not been investigated until recently. Altered RNA splicing is reported in diabetic and stroke tissues. In addition, RNA splicing alterations have been found to mediate the accumulation and aggregation of insoluble proteins in neurodegenerative diseases.59 –61 Recent evidence proposes that RNA splicing mediates endothelial cell responses against hemodynamic changes by altering extracellular matrix (ECM) protein isoforms.62,63 Furthermore, alternate splicing was reported in endothelial cells in response to hypoxia.64,65 The function of several angiogenic growth factors like VEGF, neuropilins, and angiopoietin and proteins involved in the maintenance of endothelial structure have also been shown to be regulated by alternate splicing. 65 In the present study, ASH enhanced the expression of several RBPs involved in RNA splicing including hnRNPs, snRNPS, and splicing factors suggesting a possible increase in RNA splicing and stability in BMVs. These observations further suggest possible changes in the expression of several protein isoforms altering the endothelial cell function. Our study is the first to report the connection between hypoglycemia and RNA splicing in microvasculature.
Heterogenous nuclear ribonucleoproteins (hnRNPs) are the largest class of RBPs involved in RNA splicing, transport, and stability. 66 In this study, several hnRNPs were upregulated by severe hypoglycemia in BMVs. The function of hnRNPs has not been adequately studied in endothelial cells including cerebral microvascular endothelial cells. hnRNP D0 was shown to decrease VEGF expression, whereas hnRNP U was shown to promote coronary endothelial proliferation and migration.67,68 hnRNP K has been demonstrated to bind to endothelial uncoupling protein 2(UCP2) and reduce ROS production, 69 whereas hnRNP L is essential for endothelial cell survival under hypoxic conditions. 70 As there is no evidence in the literature describing the function of hnRNPs in brain endothelial cells, we postulate that the observed hnRNP expression changes indicate significant alteration of RNA metabolism including alternative splicing in BMVs.
Interestingly, recent evidence implicates the elevated expression of RBP proteins such as hnRNPs in the pathogenesis of neurodegenerative diseases. 71 Altered RNA splicing due to elevated RBPs was proposed to result in the accumulation of protein aggregates. U1 small nuclear ribonucleoprotein (U1 snRNP) was shown to accumulate in AD brains even at the early stages of the disease. 72 TAR DNA binding protein 43 (TDP43) aggregates were observed in several neurodegenerative diseases including amyotrophic lateral sclerosis (ALS), frontotemporal dementia (FTD), Alzheimer’s disease (AD), and limbic predominant age-related TDP-43 encephalopathy (LATE). 73 Similarly, other RBPs like FUS and Matrin 3 were shown to elevate in ALS in FTLD.74,75 CUGBP and Elav-like family member 2 (CELF2) were involved in several neurological diseases. 76 Interestingly many of these RBPs were shown to accumulate in ischemic stroke as stress granules, thus linking stroke and neurodegenerative disease pathologies (NDDs). 77 Majority of observations were made in neurons, except for TDP43 which was found to accumulate in endothelial cells leading to microvascular dysfunction during ischemic brain injury. 78 Several RBPs were elevated by severe hypoglycemia in the brain microvasculature suggesting a possible role of RBPs dysregulation in hypoglycemic injury. Furthermore, these changes may mechanistically contribute to the increased risk of stroke injury and NDD in hypoglycemic subjects.
IPA pathway analysis in ASH indicated that possible downregulation of VEGF, P38MAPK and CXCL8 signaling. Counteracting the insufficient VEGF signaling promotes healthy aging. 79 VEGF signaling is detrimental in acute stage of stroke and protective in later stages of stroke, 80 and it stalls brain capillaries and reduces cerebral blood flow in AD mice. 81 P38 MAPK kinase signaling mediates brain endothelial cell death during hypoxia-reoxygenation. 82 It also mediates hypoxia-induced neuroinflammation. 83 CXCL8 is potent proangiogenic chemokine and triggers blood-brain-barrier leakage.84,85 The silencing of CXCL8 has been demonstrated to provide protection against stroke injury; however, in contrast, it safeguards neurons from amyloid toxicity.86,87 Further, IPA analysis predicted increased interleukin enhancer binding factor 3 (ILF3) expression in severe ASH will inhibit the NFKB inhibitor epsilon (NFKBIE), chemokine ligand 2 (CCL2, also called as monocyte chemoattractant protein-1, MCP-1), fatty-acid-binding protein 5 (FABP5), prostaglandin E Receptor 4 (PTGER4) and Phospholipase A2 Group VII (PLA2G7). Decreased expression of NFKBIE will result in increased NF-kB signaling, a leading pathway involved in inflammation, and CCL2 is potent stimulator of angiogenesis 88 and brain inflammation. 89 FABP5 is critical for cognitive function. 90 PTGER4 mediates endothelial migration, barrier function and breakdown endothelial-pericyte interactions.91 –93 PLA2G7 is a critical regulator of longevity but its role in brain vasculature needs to be investigated. 94 Protein network analysis reveals ASH induces both vasculo-protective and vasculo-damaging pathways, but background pathology such as aging, AD, diabetes or stroke will decide the outcome of these altered signaling pathways.
Previous studies have reported an increased expression of the GLUT1 transporter, glucose oxidation towards lactate, and elevated microvascular permeability in response to hypoglycemia.95 –98 However, in the current study, we didn’t observe significant proteomic changes related to these processes. The discrepancy between the observations is mainly due to duration of hypoglycemia. Most of the studies induced chronic hypoglycemia for five to twelve days by insulin pellets or by grafting insulinoma tissue, whereas in the current study we induced a single episode of acute mild or severe hypoglycemia. Furthermore, our study is supported by the observation that acute hypoglycemia does not alter GLUT1 in rat brain microvessels. 98
Down-regulated proteins – Mild hypoglycemia
Interestingly, a single episode of AMH after 24 hours did not alter the BMV proteome significantly compared to ASH. Out of five proteins that were downregulated or showed a decreasing trend by AMH, 4 proteins were also downregulated by ASH, indicating that hypoglycemia induces specific proteomic changes in the brain microvasculature. Hemoglobin alpha is the only protein that was specifically downregulated in mild hypoglycemia. Hemoglobin alpha was demonstrated to be predominantly expressed in endothelial cells, particularly at the myoendothelial junction, where it scavenges the nitric oxide generated by eNOS. 99 Recent studies also showed that hemoglobin subunit alpha also generates NO under hypoxic conditions through nitrite reduction. 100 The lack of significant proteomic changes following AMH could be due to either a less altered proteome or a faster resolution within 24 hours.
The reason for determining the proteomic changes twenty-four hours after the hypoglycemic effect but not during hypoglycemic episode was to minimize the direct effect of the hypoglycemic insult and the changes in the circulatory or paracrine effects of counter-regulating hormones (like glucagon, epinephrine, and cortisol) and other signaling molecules. Interestingly, only a single inflammatory marker exhibited changes following a 24-hour acute hypoglycemic episode in healthy human subjects, 101 thus supporting our experimental design. Moreover, our unpublished data revealed that BMVs exhibit lower mitochondrial respiration even twenty-four hours after the hypoglycemic episode. Very few studies have reported the systemic local changes after the hypoglycemic episode. Some studies reported altered physiological responses twenty-four hours after the hypoglycemic episode 102 indicating possible induction of long-term systemic changes after a single hypoglycemic induction. Though the counter regulatory hormones/other secretory signals are predicted to return to normal levels after 24 hours, the effect of these hormones on BEC cell signaling pathways/proteome could be long-lasting. For example, cortisol is known to induce long-term gene expression changes. Elevated levels of glucagon, epinephrine, cortisol, and growth hormone following hypoglycemia can impact numerous pathways and lead to various changes in gene and protein expression, including those presented in the current study. As an example, glucocorticoids can decrease the VEGF and mTOR signaling as predicted in this study.103,104 Thus, the observed proteomic changes in BECs by acute hypoglycemia could be a cumulative effect of low glucose levels along with the peripheral signal/counterregulatory hormone changes. Furthermore, the impact of hypoglycemia cannot be overlooked as glucose levels directly regulate several cellular pathways. Moreover, hypoglycemia is independently associated with cardio and cerebrovascular events independent of insulin treatment.105 –108
Limitations
We chose a 24-hour time point to avoid the acute proteomic changes due to insulin and other counterregulatory hormones released to counter the insulin action and to investigate the long-term effects of acute hypoglycemia. A 24-hour recovery period is sufficient to allow systemic hormonal changes to return to baseline function. In addition, our recent data (unpublished) showed microvascular functional changes even after 24 hours of the hypoglycemic insult. However, continued action of counterregulatory hormones beyond 24 hours is possible and future studies will address the immediate and long-term actions of important counterregulatory hormones in response to hypoglycemia. Thus, our study was not designed to accurately identify proteomic changes in protein levels over a period. Furthermore, our proteomics method quantifies the protein abundance based on one unique peptide and cannot identify or characterize isoforms of many proteins.
Conclusions
We conclude that the brain microvascular proteome is susceptible to circulatory hypoglycemic changes. Furthermore, a brief episode of severe hypoglycemia imprints a proteomic signature that remains 24 hours after the insult. The ASH-induced altered proteome includes microvasculature programming characterized by diminished actin cytoskeleton dynamics and elevated RNA splicing. Future studies are needed to determine the functional significance of the proteomic changes in terms of their mechanistic role in the hypoglycemia-induced stroke risk and progression of neurodegenerative diseases in diabetic subjects.
Supplemental Material
sj-pdf-1-jcb-10.1177_0271678X231212961 - Supplemental material for Acute severe hypoglycemia alters mouse brain microvascular proteome
Supplemental material, sj-pdf-1-jcb-10.1177_0271678X231212961 for Acute severe hypoglycemia alters mouse brain microvascular proteome by Siva SVP Sakamuri, Venkata N Sure, Lokanatha Oruganti, William Wisen, Partha K Chandra, Ning Liu, Vivian A Fonseca, Xiaoying Wang, Jennifer Klein and Prasad VG Katakam in Journal of Cerebral Blood Flow & Metabolism
Footnotes
Funding
The author(s) disclosed receipt of the following financial support for the research, authorship, and/or publication of this article: This research project was supported by the National Institutes of Health: National Institute of Neurological Disorders and Stroke (NS094834 and NS114286 - P.V. Katakam; NS099539 - X. Wang), National Institute on Aging (AG074489 – P.V. Katakam), and National Institute of General Medical Sciences (NS094834 - P.V. Katakam). The content is solely the responsibility of the authors and does not necessarily represent the official views of the National Institutes of Health.
Acknowledgements
We thank Ms. Sufen Zheng for her technical help with the studies.
Declaration of conflicting interests
The author(s) declared no potential conflicts of interest with respect to the research, authorship, and/or publication of this article.
Authors’ contributions
S.S and P.V.K conceived and designed the experiments; S.S., V.S, L.O, and W.W, performed experiments; S.S., J.K, and P.V.K analyzed data, interpreted experimental results, and prepared figures; S.S, V.S, L.O, J.K, P.C, N.L, X.W, and P.V.K drafted the manuscript; S.S, V.S, L.O, J.K, P.C, N.L, X.W, V.F, and P.V.K edited and revised the manuscript and approved the final version of the manuscript.
References
Supplementary Material
Please find the following supplemental material available below.
For Open Access articles published under a Creative Commons License, all supplemental material carries the same license as the article it is associated with.
For non-Open Access articles published, all supplemental material carries a non-exclusive license, and permission requests for re-use of supplemental material or any part of supplemental material shall be sent directly to the copyright owner as specified in the copyright notice associated with the article.