
Abstract
The human brain undergoes metabolic adaptations in obesity, but the underlying mechanisms have remained largely unknown. We compared concentrations of often reported brain metabolites measured with magnetic resonance spectroscopy (1H-MRS, 3 T MRI) in the occipital lobe in subjects with obesity and lean controls under different metabolic conditions (fasting, insulin clamp, following weight loss). Brain glucose uptake (BGU) quantified with 18F-fluorodeoxyglucose positron emission tomography (18F-FDG-PET)) was also performed in a subset of subjects during clamp. In dataset A, 48 participants were studied during fasting with brain 1H-MRS, while in dataset B 21 participants underwent paired brain 1H-MRS acquisitions under fasting and clamp conditions. In dataset C 16 subjects underwent brain 18F-FDG-PET and 1H-MRS during clamp. In the fasting state, total N-acetylaspartate was lower in subjects with obesity, while brain myo-inositol increased in response to hyperinsulinemia similarly in both lean participants and subjects with obesity. During clamp, BGU correlated positively with brain glutamine/glutamate, total choline, and total creatine levels. Following weight loss, brain creatine levels were increased, whereas increases in other metabolites remained not significant. To conclude, insulin signaling and glucose metabolism are significantly coupled with several of the changes in brain metabolites that occur in obesity.
Keywords
Introduction
Both obesity and type 2 diabetes (T2D) have been linked with an increased risk for neurodegeneration and Alzheimer’s disease (AD).1 –3 While the prevalences of obesity and T2D are rapidly increasing, aging of the population is the greatest risk factor for neurodegeneration. 4 Thus, better understanding of brain physiology and the brain-specific pathophysiology of metabolic disorders is taking on a new urgency. However, the human brain remains the least accessible of organs, and in vivo attempts to study its physiology rely predominantly on neuroimaging.5 –13
In a compelling contrast to peripheral tissues, we have previously shown consistently that when studied with positron emission tomography (PET) using the glucose analogue tracer 18F-fluorodeoxyglucose (18F-FDG), 14 brain glucose uptake (GU) is increased in subjects with severe obesity or insulin resistance during hyperinsulinemic, euglycemic clamp. Surprisingly, under fasting conditions the brain GU rates do not differ between these subjects and healthy, lean controls, who in contrast show no acceleration in GU during hyperinsulinemic euglycemia. This finding has been later confirmed by others in both humans and animals.7,15 Alarmingly, this metabolic disruption seems to initiate early, already in subjects at risk or at the very early stages of metabolic syndrome. 16 In the largest cohort by far of 194 subjects studied with 18F-FDG-PET during hyperinsulinemic, euglycemic clamp, we showed that peripheral insulin sensitivity is highly correlated with body mass index (BMI), which is also the best single predictor of brain GU. 9 However, the molecular mechanisms that underlie this finding remain elusive.
Proton magnetic resonance spectroscopy (1H-MRS) is a neuroimaging method that quantifies metabolite concentrations in the tissue of interest, and it has been used in several previous studies to characterize changes occurring in the brain in obesity.17,18 However, in the brain measuring glucose concentration or metabolic fluxes is less candid due to low natural concentration of glucose in the brain and the overlap with more prominent spectral peaks, whereas 18F-FDG-PET can provide an explicit, direct quantitative assessment of glucose uptake in the tissue. Considering the poor accessibility of the human brain, both neuroimaging modalities are extremely useful as they provide complementary information.
Thus, to understand better the increased insulin-stimulated brain GU in severe obesity, we performed a series of brain 1H-MRS studies assessing concentrations of different metabolites often reported altered in obesity and insulin resistance: total N-acetyl-aspartate (NAA), myo-inositol, glutamine/glutamate (Glx), total creatine and total choline. We conducted the 1H-MRS studies under both fasting and hyperinsulinemic, euglycemic clamp conditions to determine the effects of obesity, as previously done by us and others to assess BGU,7,19 and tested whether during insulinized conditions the intracerebral concentrations of these metabolites associate with increased brain GU. The effect of weight loss on brain metabolites was also assessed with a 1H-MRS scan 1-year postoperatively in a subset of subjects with severe obesity.
Considering that some studies have suggested that astrocytes take up most of cerebral 18F-FDG, 20 we initially hypothesized that the increase in BGU would be associated with astrocytosis,21,22 and that in 1H-MRS this change would be measurable as an increase in the glial marker myo-inositol. 23 Additionally, we expected the increase in BGU to coincide with a decrease in NAA, a marker of neuronal viability, and insulin stimulation to affect the levels of glutamate/glutamine.24,25
Materials and methods
Study design
A total of 37 subjects with severe obesity (OBE) undergoing evaluation for bariatric surgery in the Department of Digestive Surgery and Urology, Turku University Hospital (Turku, Finland) were recruited for the studies, along with 27 age- and gender-matched healthy lean controls (CON) recruited by ads in local newspapers and the hospital website. In the first study (dataset A), effects of severe obesity on brain metabolites concentrations were evaluated by fasting brain 1H-MRS. Part of the subjects in dataset A also underwent the 1H-MRS studies during hyperinsulinemic, euglycemic clamp to investigate the effects of insulin (dataset B). Due to MRI equipment update, the association between brain 1H-MRS and 18F-FDG-PET-derived GU was only evaluated in a separate group of subjects (dataset C). The flowchart of the study is presented in Figure 1.
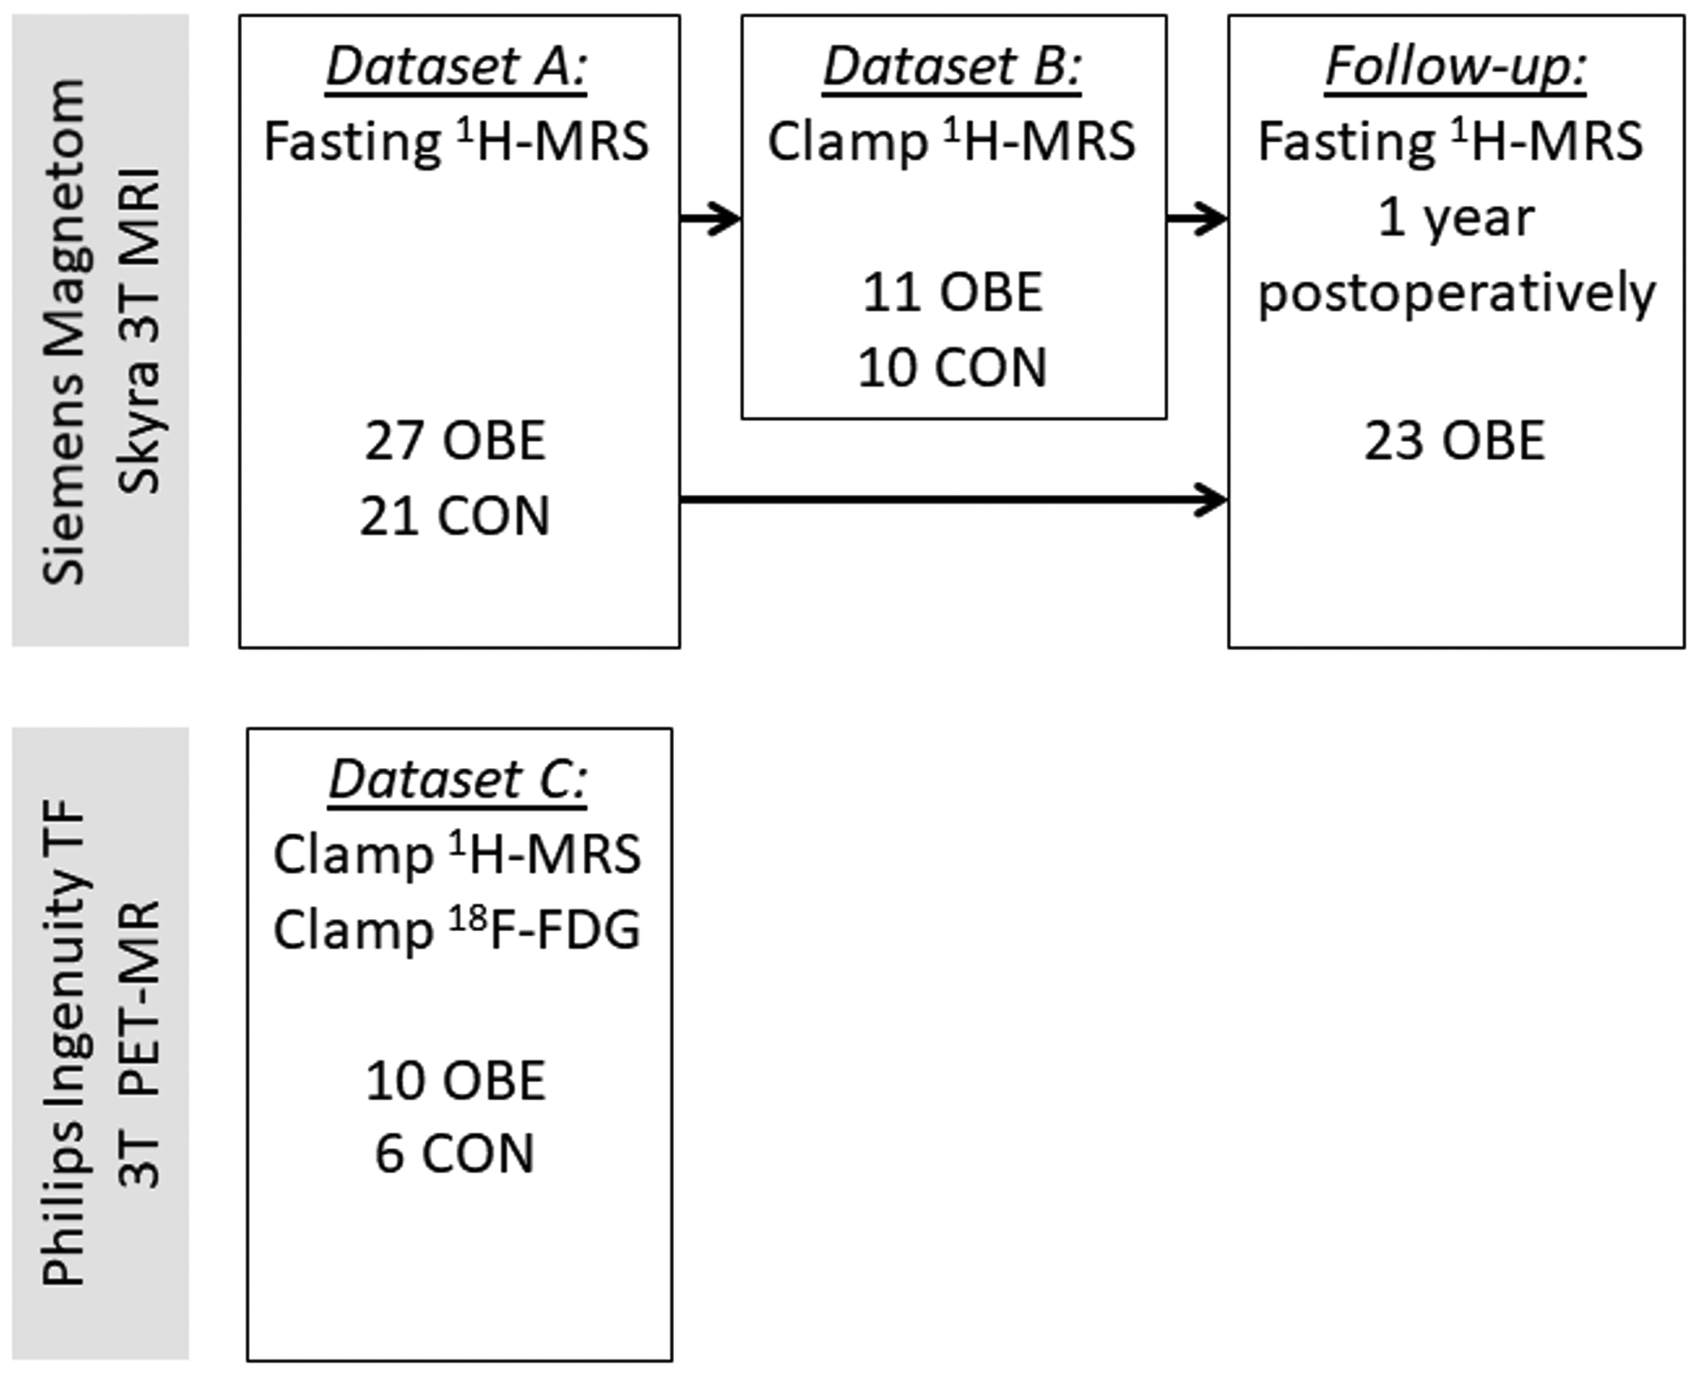
Study flowchart.
Studies were conducted before the OBE subjects started a 4‐week very‐low‐energy dietary regime prior to bariatric surgery. Strenuous physical activity was prohibited from the preceding evening and all antidiabetic drugs were withheld 72 h before the studies.
Participants
For dataset A, comprising of fasting 1H-MRS studies, 27 OBE and 21 CON subjects were recruited. Of these subjects, 11 OBE and 10 age- and sex-matched CON also participated in the insulin-stimulated 1H-MRS-studies (dataset B). A separate group of 16 subjects (10 OBE and 6 CON) underwent 1H-MRS and 18F-FDG-PET/CT studies during hyperinsulinemia (dataset C). 23 out of 27 patients of dataset A were re-studied ∼1 year following bariatric surgery.
All study participants were free of previous neurological disease (e.g., cognitive impairment, large vessel stroke, seizure disorder, Parkinson’s disease, clinically significant traumatic brain injury, multiple sclerosis, or previous brain infection/meningitis), and none of them had any major psychiatric illnesses (e.g., schizophrenia, bipolar disorder) or reported substance abuse. Subjects were also eligible to undergo magnetic resonance imaging. After giving written informed consent, all subjects underwent a screening visit where basic anthropometric and clinical measurements were obtained (body weight, height, waist and hip circumferences, blood pressure). Body fat mass percentage was measured with an air displacement plethysmograph (the Bod Pod system, software version 5.4.0, COSMED, Inc., Concord, CA, USA) after at least four hours of fasting. Blood tests comprised a standard (75 g) oral glucose tolerance test (OGTT) with frequent blood sampling at 0, 30, 60, 90 and 120 minutes for determination of glucose, insulin, and C‐peptide. For the CON group, previously diagnosed T2D or OGTT results indicating T2D were considered an exclusion criteria, while subjects with impaired glucose tolerance with or without impaired fasting glucose based on the ADA criteria 26 could be enrolled. In the OBE group subjects with T2D had been previously prescribed metformin and/or dapagliflozin, but no other treatments affecting glucose metabolism. To avoid possible confounding effects of gender in a small sample, only female participants were studied in dataset C, while both male and female subjects were enrolled in datasets A and B.
Brain 1H-MRS studies
Fasting studies (dataset A) were performed after an overnight fast. On visits studying the effects of insulin (dataset B), 1H-MRS studies were first performed during fasting, and then repeated 120 ± 10 min into hyperinsulinemic, euglycemic clamp, which was performed as previously described. 27 In brief, a primed-continuous infusion of insulin (Actrapid; Novo Nordisk, Copenhagen, Denmark) was given at a rate of 40 mU.m−2.min−1. During the clamp, a 20% glucose solution was infused at a rate designed to maintain euglycemia (∼5 mmol/L). Plasma glucose levels were measured every 5–10 min throughout the clamp, plasma insulin and serum free-fatty acid concentrations were taken at baseline and every 30 and 60 min, respectively. In the dataset evaluating potential correlations between brain metabolites and brain GU (dataset C), subjects first underwent an 18F-FDG-PET/CT scan (brain scanned ∼ 95 min into the clamp), and at ∼150 min into the clamp they were placed in the MRI scanner, and the brain 1H-MRS measurement was acquired thereafter.
Subjects were studied with either a Siemens Magnetom Skyra fit 3 T MRI scanner (Siemens Medical Solutions, Erlangen, Germany) with 20-channel Head/Neck Matrix coil (datasets A and B), or with a Philips Ingenuity TF 3 T PET-MR scanner (Philips Healthcare, Cleveland, OH, USA) with a 32-channel SENSE Head coil (dataset C). Subjects were positioned supine inside the MRI and the head was immobilized with foam inserts on top of a radiofrequency probe. After a brain morphology scan, 1H-MRS spectrum was measured from a 20x30x30 mm voxel in the center of the occipital lobe using PRESS sequence with 176 water-suppressed signal averages and 4 signal averages without water suppression. The occipital lobe was selected for reliable spectral acquisition and to enable result comparisons to previous reports.20,21 The voxel was placed in the center of the occipital lobe covering parts of both hemispheres, making sure that the margins of the voxel would not be close to the skull or the cerebellum (Figure 2). All voxel placements were performed by a single experimenter (K.K.). In the paired brain 1H-MRS screen shots of the first voxel placement were used as a reference for the voxel placement in the second scanning. The measurement lasted for 10 minutes with the sequence parameters repetition time = 3000 ms, echo time = 35 ms, bandwidth = 2000 Hz. Water suppression was performed using the CHESS method. The acquisition parameters of the 1H-MRS experiments are given in Table 1.
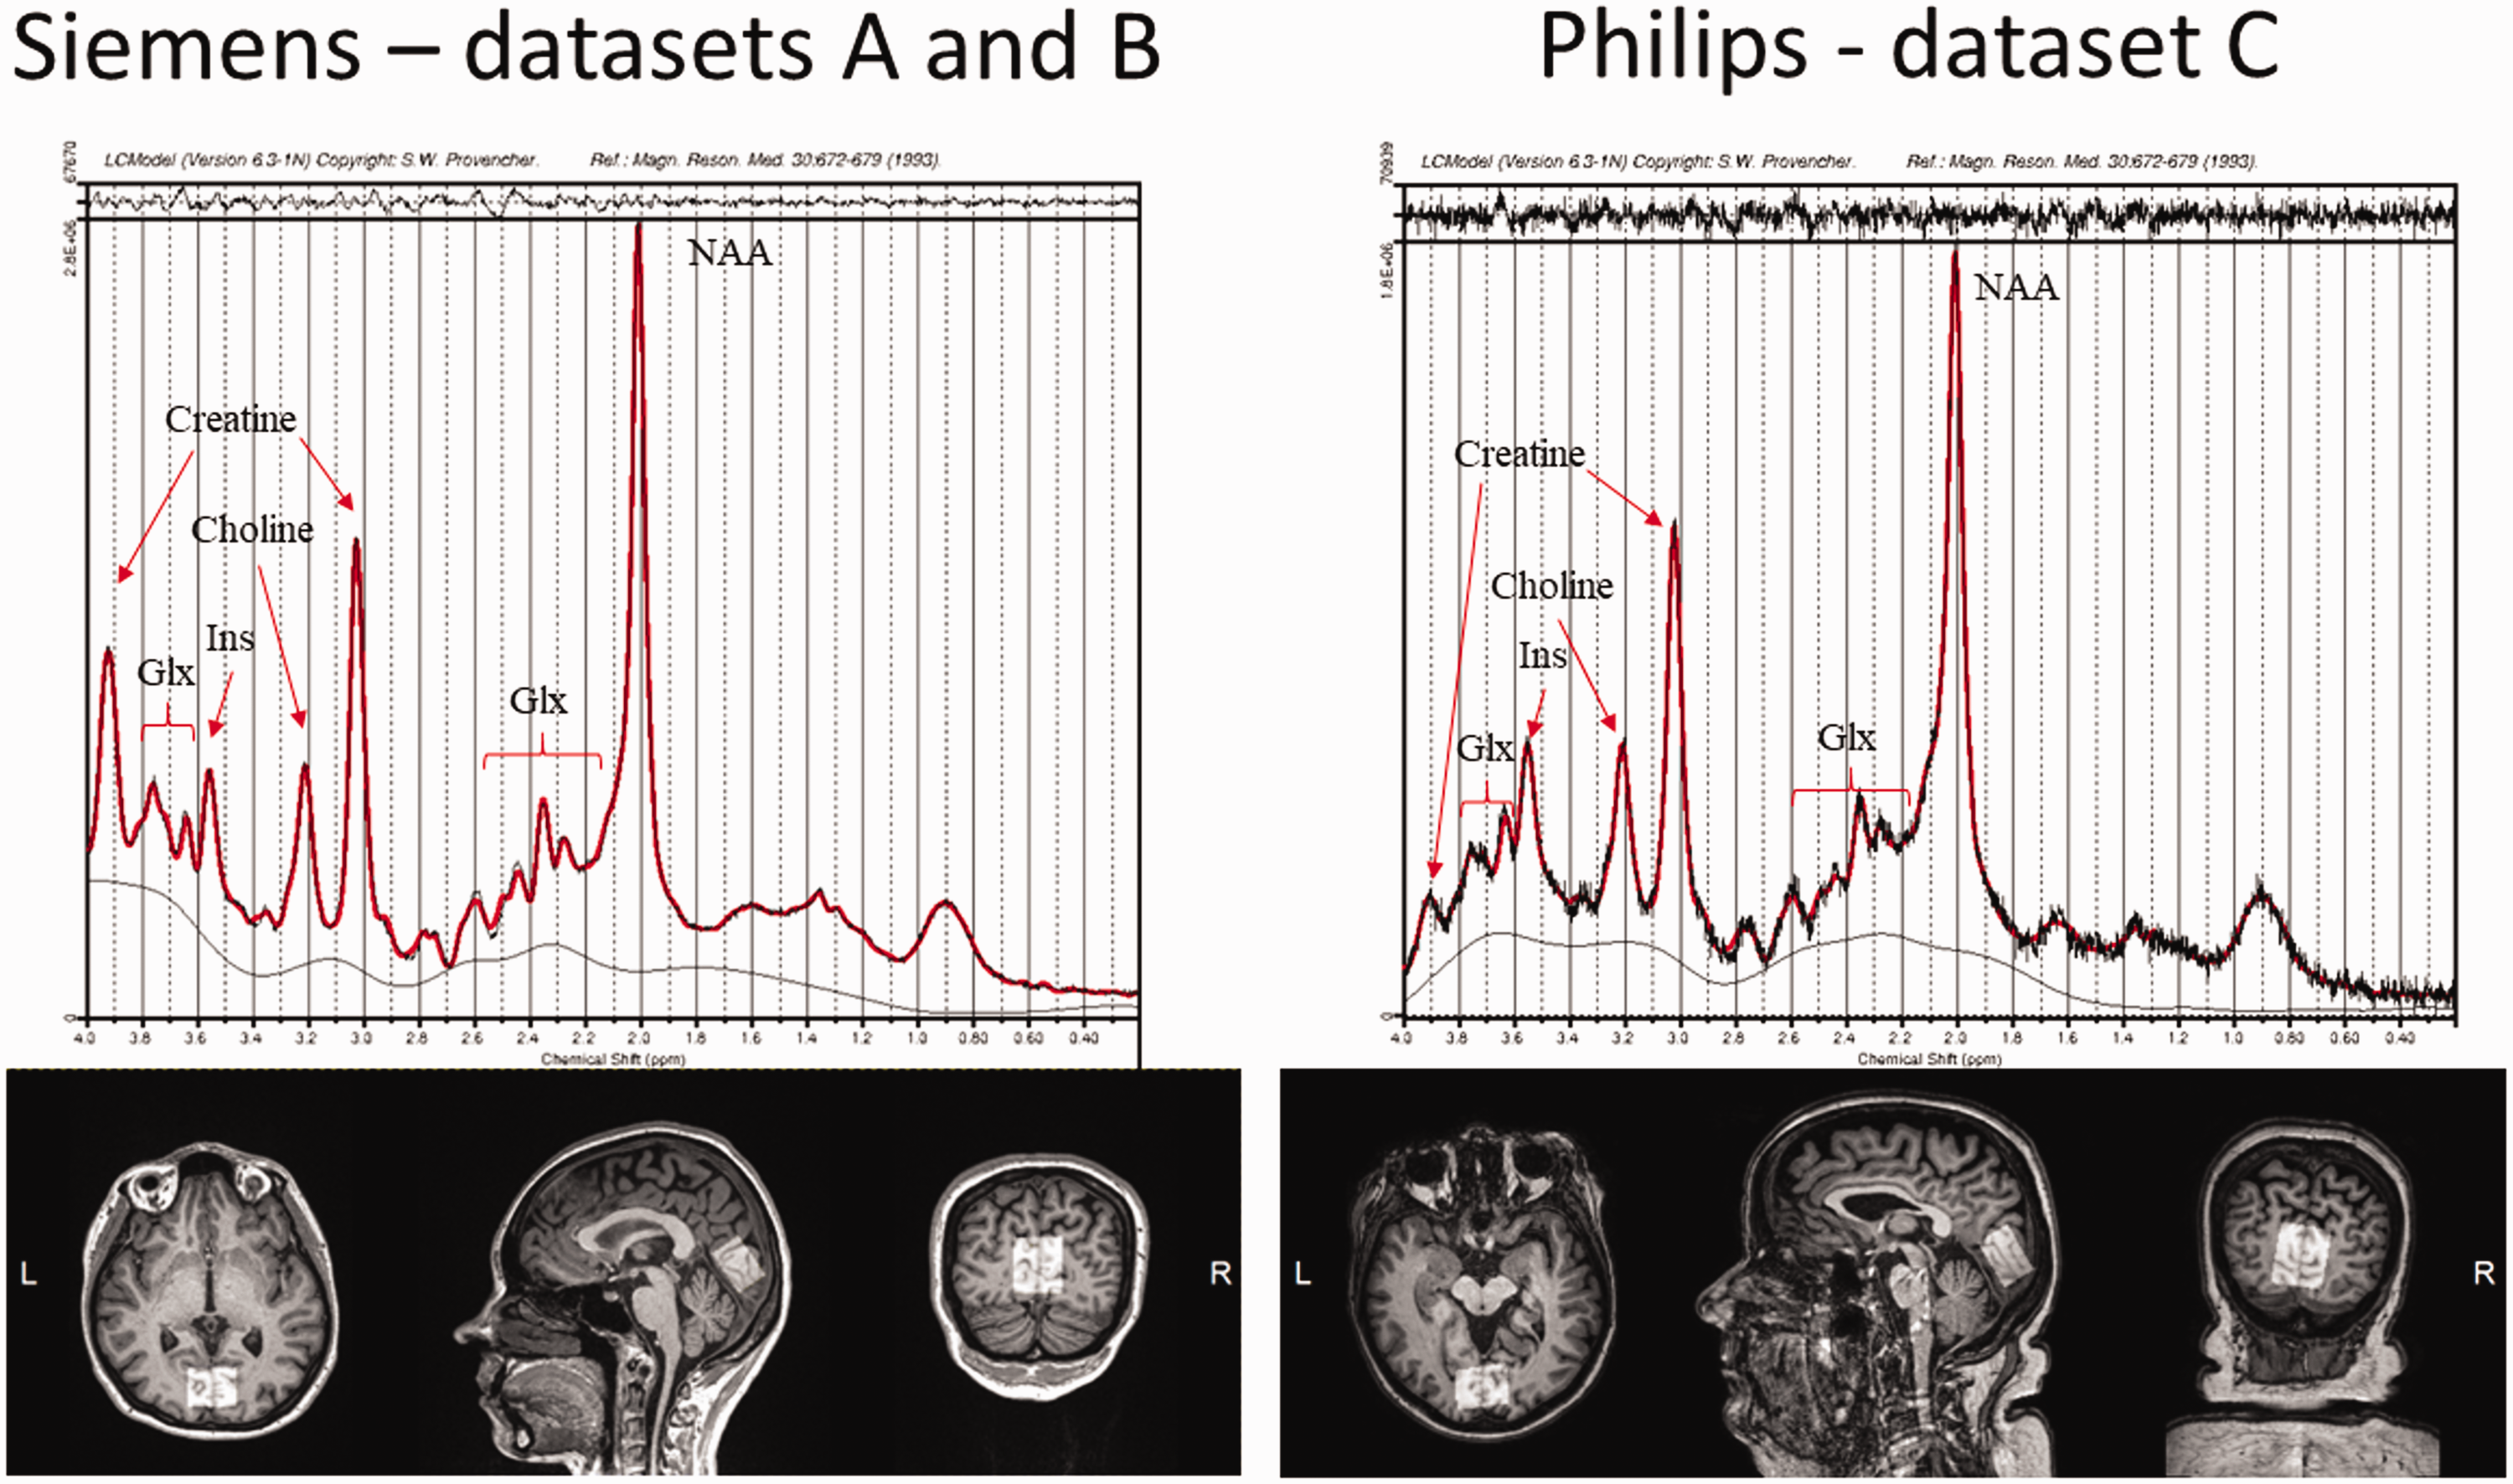
Voxel placement for 1H-MRS in the occipital lobe, and representative examples of fitted spectrums in the two scanners. Glx: glutamate/glutamine; Ins: myo-inositol; NAA: total N-acetyl-aspartate.
Acquisition parameters of the 1H-MRS.
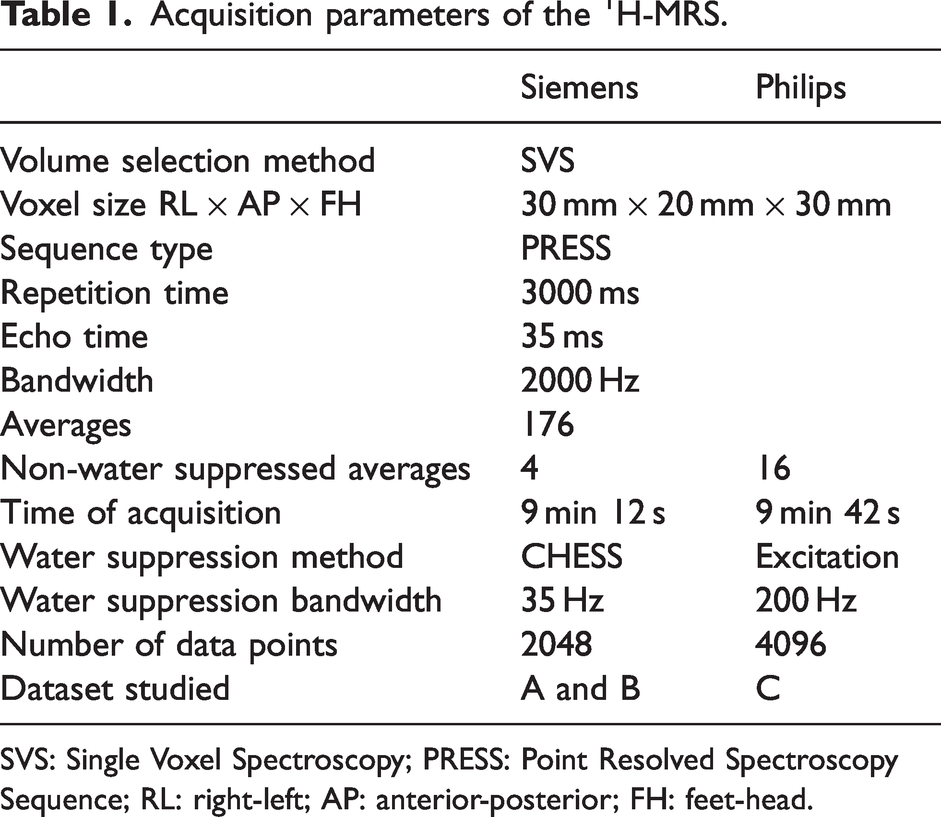
SVS: Single Voxel Spectroscopy; PRESS: Point Resolved Spectroscopy Sequence; RL: right-left; AP: anterior-posterior; FH: feet-head.
Quantification of 1H-MRS data
Eddy current corrected 1H-MRS data were analyzed using LCModel (Version 6.3-1 N), 30 and water scaling was performed to obtain metabolite concentrations in mM units. Therefore, in addition to the water suppressed spectrum, LCModel was given also a non-water-suppressed spectrum to scale the metabolite signals in relation to the water signal. The analysis window was set from 4.0 to 0.2 ppm. A simulated basis set including 21 model metabolite signals and 13 stimulated lipid and macromolecule signals was used. 31 After metabolite concentration values were produced with the default parameters of the LCModel software (assuming water concentration of 35880.0 mM), brain tissue fractions (grey matter, white matter, cerebrospinal fluid) were derived for more accurate estimation of the concentrations of water, and this was used as an internal reference. The tissue fractionation was performed with the use of Gannet software tool (Version 3.3.1) 32 as follows: first the acquired MRS voxel data was co-registered to the MRI image using the SMP12 software (https://www.fil.ion.ucl.ac.uk/spm/software/spm12/) and then segmented to fractions of three compartments: grey matter, white matter and cerebrospinal fluid. 33 Their respective water concentration was assumed to be 43300 mmol/L, 35880 mmol/L and 55556 mmol/L. 34 Thus, a more accurate estimate of the water concentration within the voxel was achieved by multiplying the concentration of water in each compartment by the fraction of each compartment and the metabolite concentrations were corrected to be in relation to this value. The T1/T2 relaxation corrections in different compartments to different metabolites was not performed due to uncertainties in relaxation times. However, as acquisition parameters were kept constant during the study, relaxation times were not expected to change.
Brain 18F-FDG-PET/CT protocol
To acquire insulin-stimulated brain GU (dataset C), a hyperinsulinemic, euglycemic clamp was started after an overnight fast and continued throughout the scan as described above. Subjects were placed into a GE Advance PET/CT camera (General Electric Medical Systems, Milwaukee, Wisconsin), and 70 ± 10 min into the clamp, 18F-FDG (187 ± 9 MBq) was injected intravenously followed by a 10-minute static acquisition of brain radioactivity at 95 ± 6 min into the clamp. All data were corrected for dead time, decay, and measured photon attenuation, and reconstructed using a Hann filter with a cut‐off frequency of 0.5 and a median root prior reconstruction method. Plasma radioactivity used for input function was measured from arterialized venous blood samples collected during the scan and analyzed using an automatic γ counter (Wizard 1480; Wallac, Turku, Finland).
Quantification of brain glucose uptake
Fractional uptake rate (FUR), 35 the quotient of tissue activity divided by the integral of plasma activity from injection until the middle of the selected frame, was calculated for each voxel separately. Next, voxelwise GU (µmol/kg/min) was calculated using the formula GU = (FUR × Cp)/(LC × tissue density) × 100, where Cp is the average plasma glucose concentration from the injection until the end of the brain scan, and LC is the lumped constant for the brain (set at 0.65). 36 Brain density was set at 1.04. 8 Summed PET images were spatially normalized to the 18F-FDG template in Montreal Neurological Institute space (MNI International Consortium for Brain Mapping) using statistical parametric mapping (SPM [SPM12; www.fil.ion.ucl.ac.uk/spm/]) running on Matlab for windows (version 9.1.0; Math Works, Natick, Massachusetts). Normalization variables were subsequently applied to corresponding parametric glucose metabolism images. Parametric images were smoothed at 10 mm full‐width at half‐maximum. Occipital lobe GU was obtained using two toolboxes for Matlab: WFU_PickAtlas (https://www.nitrc.org/projects/wfu_pickatlas) to generate the VOI mask of interest (http://www.talairach.org/daemon.html) and Marsbar (http://marsbar.sourceforge.net) to extract the GU values from the parametric images after applying the VOI mask.
Insulin-stimulated glucose disposal (M value)
The M value was calculated during the second hour of the clamp as a mean of three 20 min intervals and expressed per kg of fat-free mass (μmol. kgFFM−1. min−1), as this normalization has been shown to minimize differences due to sex, age, and body weight. 37
Analytical methods
Plasma glucose was measured in the laboratory of Turku PET Centre in duplicate using the glucose oxidase technique (Analox GM7 or GM9, Analox Instruments Ltd., London, UK). Glycosylated haemoglobin (HbA1c) and plasma insulin were measured with automated electrochemiluminescence immunoassay (Cobas 8000; Roche Diagnostics, Mannheim, Germany).
Statistical analysis
Data are presented as mean ± SD, or median [IQR] for non-normally distributed variables. Between groups comparisons were performed by t-test or Wilcoxon rank-sum test as appropriate. The Shapiro-Wilk test was used to assess normality. Comparisons between categorical variables was performed by the χ2 test. Correlations between brain metabolites and GU were analysed using Pearson’s r, and confounding effects age, BMI and M value were investigated using linear or semilog regression. Paired analyses (before vs after surgery) were performed with paired t-test. Analyses were done using JMP version 13.0 (SAS Institute, Cary, NC, USA). A p value ≤0.05 was considered statistically significant. Figures were created using ggplot package on R Studio. 38
Study approval
The protocol was approved by the Ethics Committee of the Hospital District of Southwestern Finland (ETMK 52/2018, NCT04343469), and the studies were performed according to the principles of the Declaration of Helsinki of 1975 (and as revised in 1983). All subjects gave written informed consent before any study procedures.
Results
Fasting brain 1H-MRS: effect of obesity and weight loss on brain metabolites (dataset A)
A total of 27 subjects with severe obesity (OBE) and 21 age- and sex-matched healthy, lean controls (CON) were evaluated in the fasting state. The two groups were well matched by age and sex. OBE subjects had impaired insulin sensitivity and glycemic control, along with higher fasting insulin and triglyceride levels, CRP and blood pressure (Table 2).
Anthropometric and biochemical characteristics and brain metabolites of the study participants in dataset A.
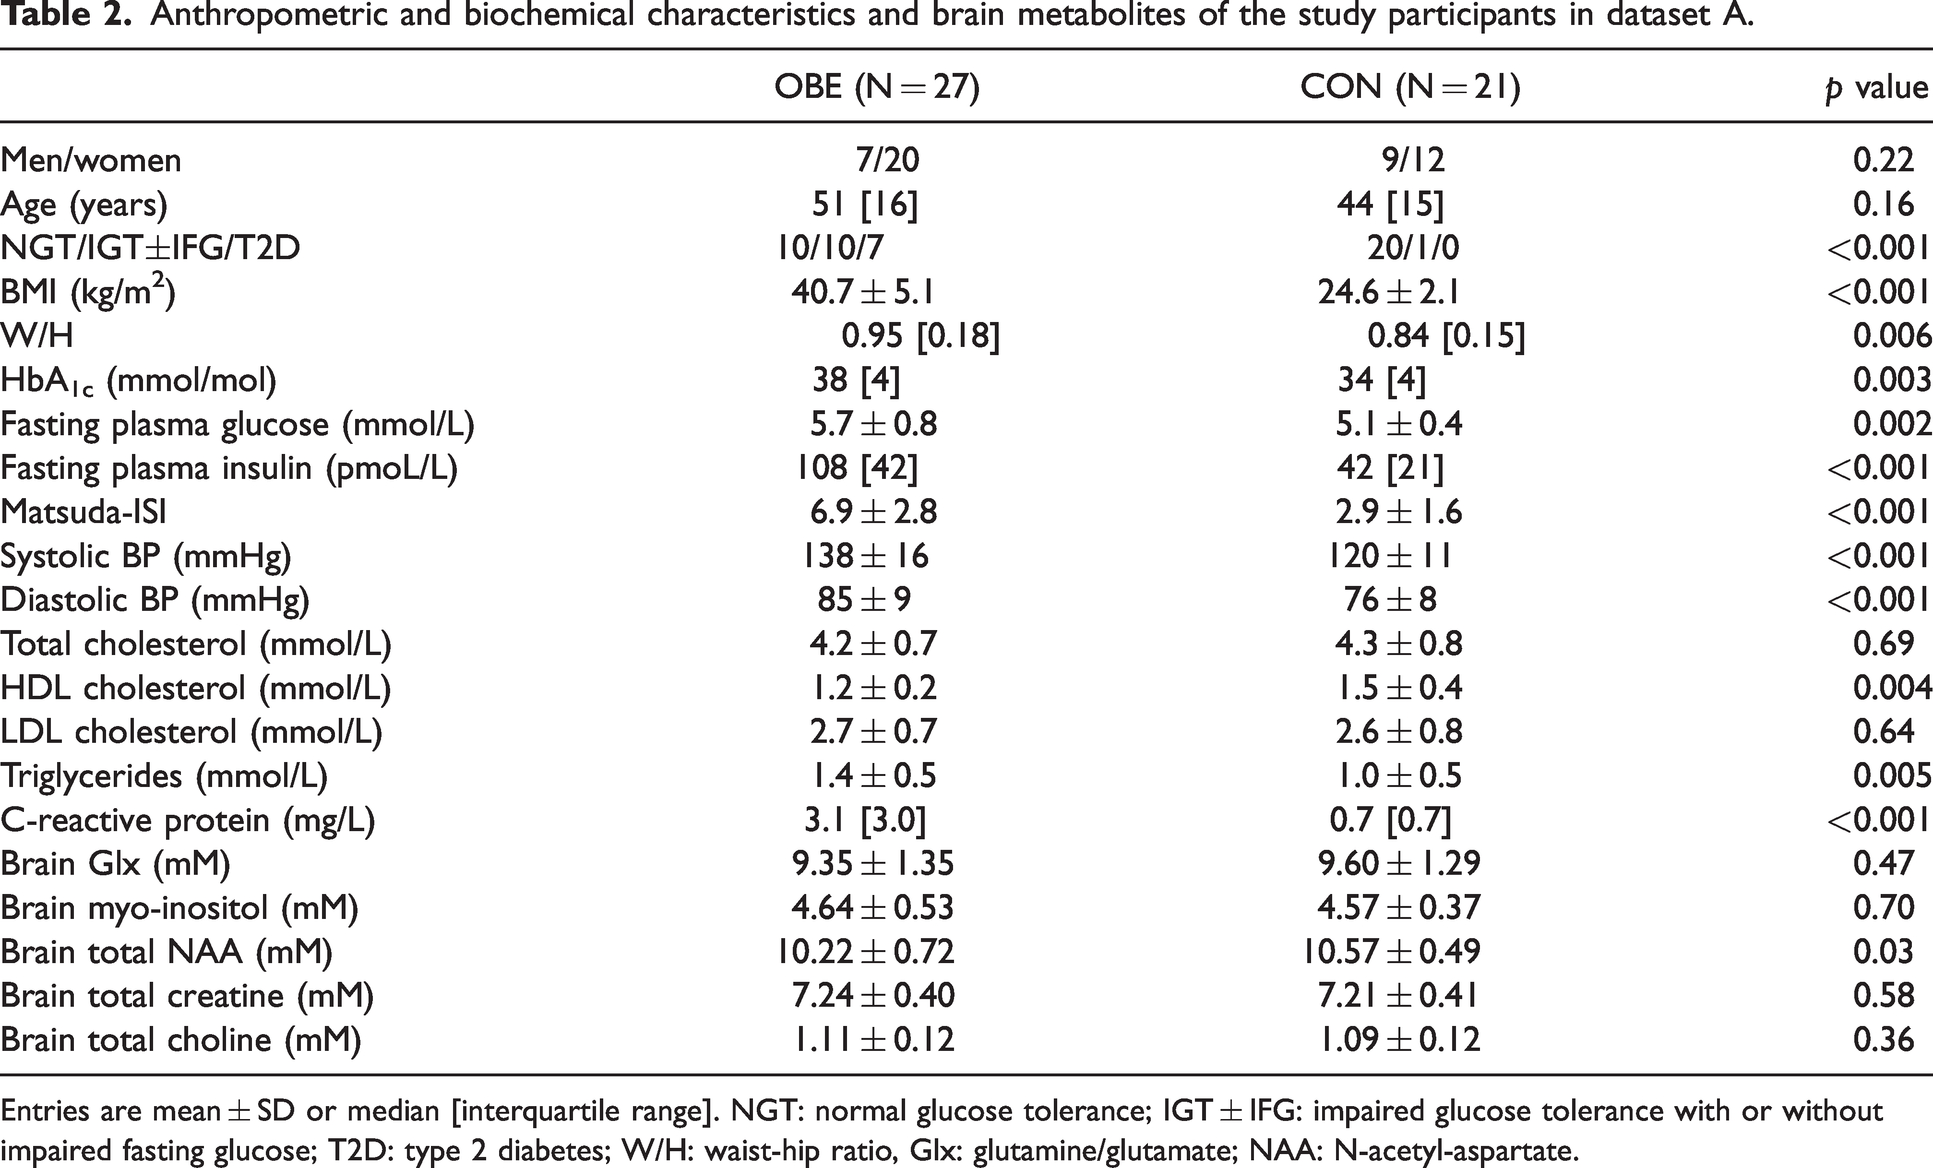
Entries are mean ± SD or median [interquartile range]. NGT: normal glucose tolerance; IGT ± IFG: impaired glucose tolerance with or without impaired fasting glucose; T2D: type 2 diabetes; W/H: waist-hip ratio, Glx: glutamine/glutamate; NAA: N-acetyl-aspartate.
Of the brain metabolites assessed with 1H-MRS, only total NAA concentrations were statistically different between the two groups, with the subjects in the OBE group having lower total NAA concentrations (p = 0.05) (Table 2). When analyzing the data of all subjects (N = 48), higher age (β=-0.32, p = 0.029) rather than BMI (p = 0.16) or peripheral insulin sensitivity (Matsuda-ISI, p = 0.55) was associated with lower total NAA.
23 subjects with obesity were re-studied one year following bariatric surgery. They had achieved significant weight loss, losing on average 9 units of BMI, and significantly improved their insulin sensitivity as shown by the increase in the Matsuda-ISI (2.99 ± 1.54 before surgery vs 5.96 ± 2.55 after surgery, p = 0.0006). All measured brain metabolites (total creatine, total choline, NAA, glutamine/glutamate [Glx]) showed a numerical increase following weight loss, but only total creatine concentration was significantly higher postoperatively (change 0.25 ± 0.32 mM, p = 0.001) (Figure 3(a) and Supplemental Table 1).
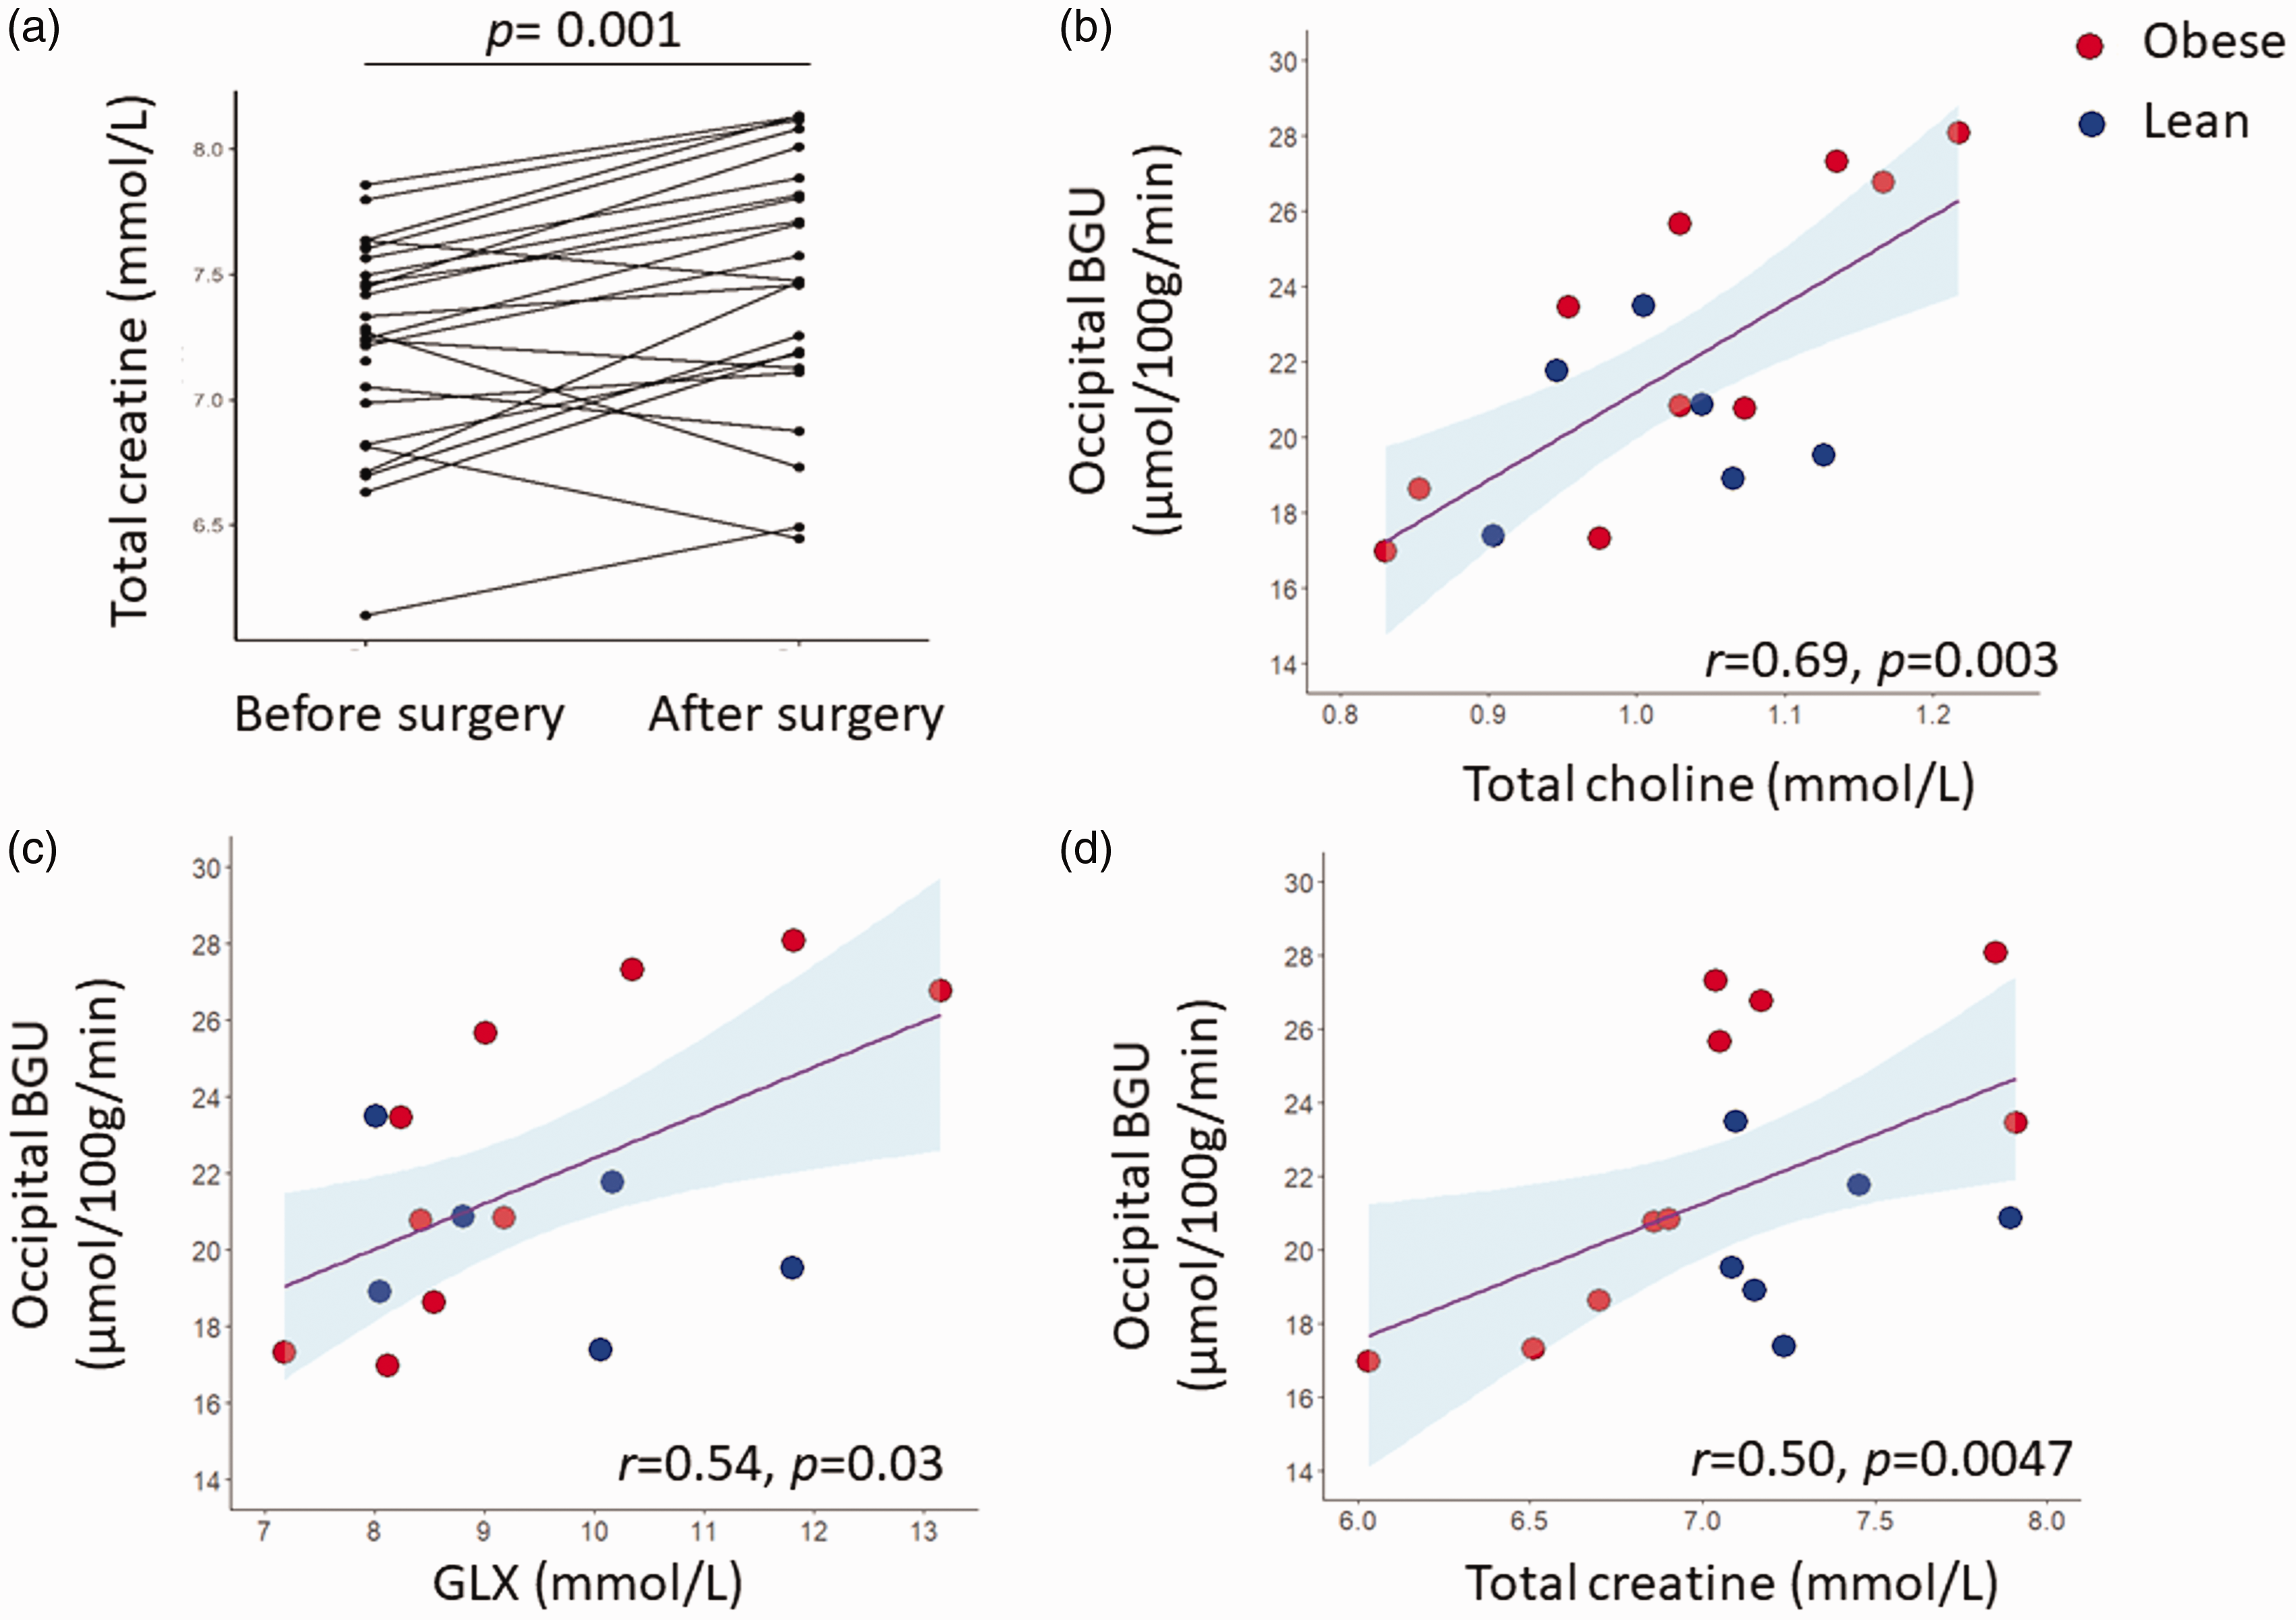
Total creatine levels were increased following weight loss (a). Under hyperinsulinemic, euglycemic clamp conditions, brain glucose uptake (GU) correlated positively glutamine/glutamate (Glx) (b), total choline (c), and total creatine (d) levels. The occipital region of interest was extracted from the brain glucose uptake data.
Paired brain 1H-MRS: effect of insulin on brain metabolites (dataset B)
The anthropometric and biochemical characteristics of the 11 OBE and 10 CON from dataset A to undergo the 1H-MRS studies also during hyperinsulinemic, euglycemic clamp (dataset B) were similar to the whole dataset A (data not shown). During the clamp studies, plasma insulin concentrations were raised quickly and were kept steady at 594 ± 103 pmol/L with no significant difference between OBE and CON groups. Especially in the OBE group plasma glucose was higher during fasting than under controlled euglycemia (Table 3), but plasma glucose levels or change in plasma glucose did not correlate with concentrations of brain metabolites or changes in their concentrations (p values above 0.34).
Comparison of the fasting and insulin clamp metabolite concentrations per group, and intervention (N = 21) (dataset B).
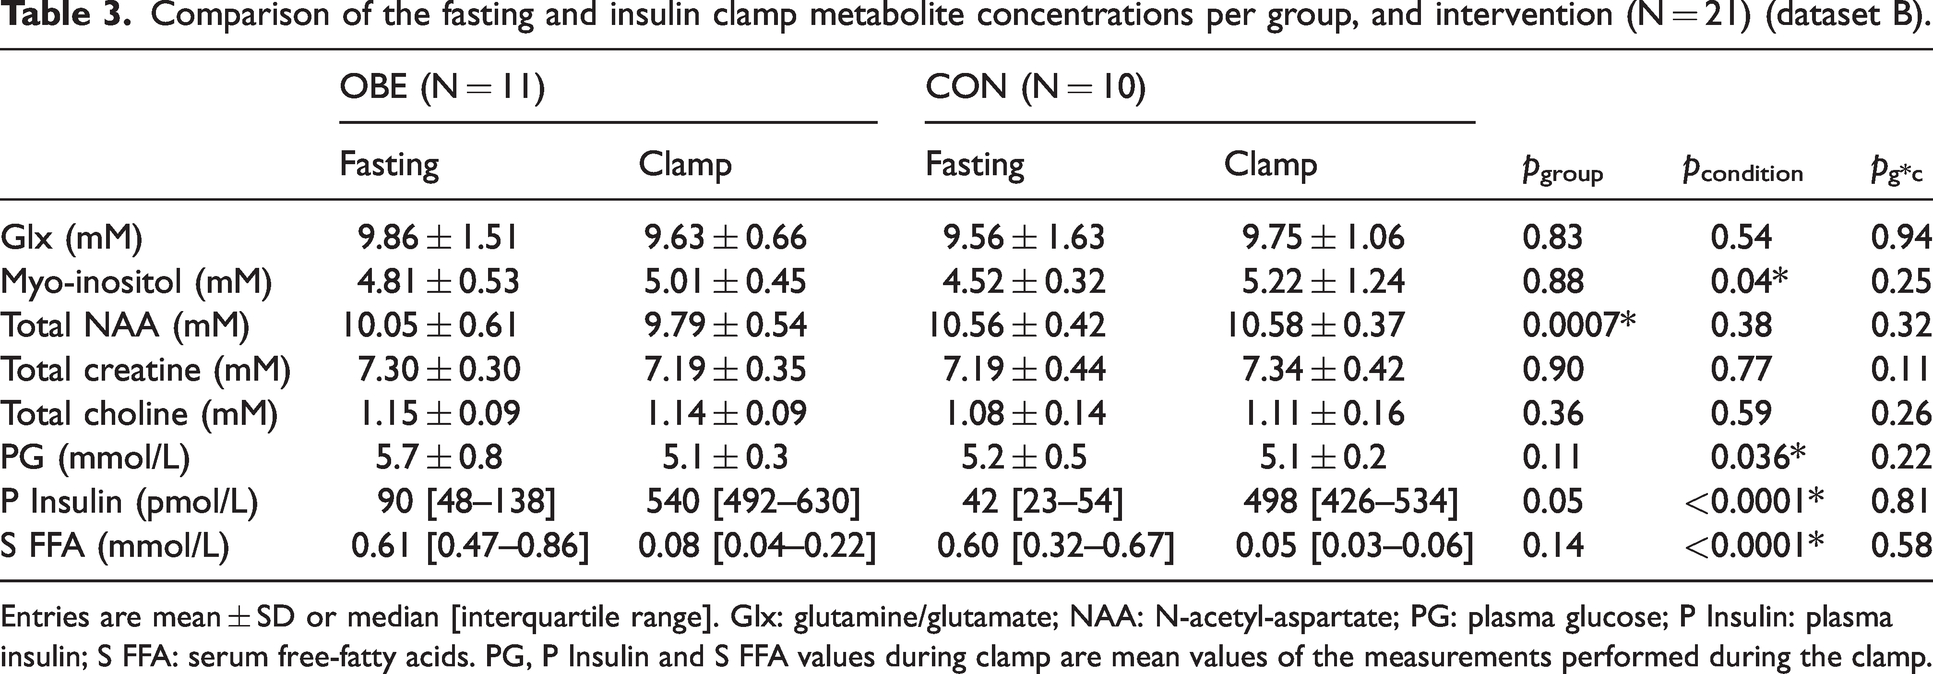
Entries are mean ± SD or median [interquartile range]. Glx: glutamine/glutamate; NAA: N-acetyl-aspartate; PG: plasma glucose; P Insulin: plasma insulin; S FFA: serum free-fatty acids. PG, P Insulin and S FFA values during clamp are mean values of the measurements performed during the clamp.
In the paired fasting and clamp comparison, myo-inositol was the only metabolite which was significantly affected by insulin, with a similar increase in both lean and obese individuals (Table 3). Total NAA, total choline and total creatine showed no significant changes in response to insulin (Table 3).
Associations between 18F-FDG-derived glucose uptake and 1H-MRS metabolites during hyperinsulinemia (dataset C)
The subject characteristics of Dataset C were similar to Dataset A and they are summarized in Supplemental Table 2, but only female subjects were included to diminish the possible confounding effect of sex in a small sample. In accordance with our previous studies, lower M-value/FFM (β = −0.74, p = 0.001) and younger age (β = −0.51, p = 0.042) predicted increased brain GU, whereas BMI had no significant effect (β = −0.41, p = 0.12).
During insulin-stimulation, brain GU correlated positively with Glx (r = 0.54, p = 0.032), total choline (r = 0.69, p = 0.003) and total creatine (r = 0.50, p = 0.047) concentrations (Figure 3(b) to (d)). These associations were driven by the OBE group (in the OBE: r = 0.79, p = 0.006, r = 0.83, p = 0.003, and r = 0.75, p = 0.01, for the association between BGU with GLX, total choline, total creatine respectively, whereas in the CON: r = −0.33, p = 0.5; r = 0.05, p = 0.9; r = 0.14, p = 0.8, for the association between BGU with GLX, total choline, total creatine respectively). Myo-inositol (r = 0.46, p = 0.07) and NAA (r = 0.35, p = 0.18) concentrations showed no statistically significant association with BGU.
Discussion
The strength of the current study is based on the novel approach combining two complementary methods, 18FDG-PET and 1H-MRS, to characterize the effects of obesity on brain glucose metabolism in humans in vivo. While it is not possible to establish causal relationships with the applied methods, the results highlight the role of insulin and glucose metabolism in alterations in brain metabolites often seen in obesity.
First, in the fasting state, we assessed whether there are any baseline differences between neurologically healthy subjects with obesity and their age and sex-matched lean controls. We found only total occipital NAA concentrations to be lower in subjects with obesity, which reproduces the findings from parietal, prefrontal and fontal cortex as well as hippocampus from previous studies in insulin resistant or obese subjects.37 –40 As NAA is synthesized almost exclusively in neurons in the brain, 41 and decreased concentrations have been associated with aging and several neurodegenerative diseases,42 –46 lower NAA concentrations have been attributed to neuronal damage in obesity. Additionally, neuronal damage has been suggested to manifest the concomitant reduction of white and gray matter volumes. 47
Apart from the difference in total NAA concentrations in the fasting state, the two groups had similar concentrations of the other brain metabolites assessed. This is in contrast to a study by Gazdinski et al., where the investigators reported also lower choline concentrations in frontal white matter (WM) with increasing BMI18. As the authors argued, the frontal WM myelinates later than the other lobes, thus the apparent discrepancy between our results and those of that study could be attributed to different characteristics of the examined lobes. A meta-analysis from Wu et al. reported that the myo-inositol/creatine levels were increased in the occipital lobe in subjects with T2D compared to healthy lean controls. 44 However, as the authors acknowledged their results should be interpreted carefully since there was heterogeneity in the studies included. In the currents study, we would attribute the lack of increased myo-inositol levels in the OBE group either to their good glycemic control, or to differences between the studied brain regions, or both.
We also performed paired brain 1H-MRS experiments to assess the acute effect of insulin on brain metabolites. While one previous study 24 found that insulin infusion resulted in an increase in frontal NAA/creatine and frontal and temporal Glx/creatine and a decrease in frontal choline/creatine and temporal choline/H2O and myo-inositol/H2O, in our data 2-hours of euglycemic hyperinsulinemia changed only brain myo-inositol concentrations, which were increased during the clamp similarly in lean and obese subjects (Table 3).
Myo-inositol is more concentrated in glial cells, 23 where it serves as a vital precursor to several intracellular second messengers downstream from the insulin receptor in the phosphoinositide 3-kinase/protein kinase B (AKT)-signaling arm. 48 As the brain has the capacity to convert D-glucose into myo-inositol, 49 the increase in the latter might occur in response to accumulation of intracellular glucose-6-phosphate. In contrast, brain myo-inositol concentration in the anterior cingulate cortex, but not the occipital cortex, has been shown to decrease when insulin is administered to younger healthy, lean subjects.24,29 The discrepancy with the current results could be explained with a different selection of region, as well as impaired insulin sensitivity and older age, as brain myo-inositol levels have been shown to increase with age and also early on in the development of cognitive impairment. 50 Therefore the current study does not yield definitive support for or against cortical astrocytosis in obesity; for one, myo-inositol is an indirect marker of supposed gliosis, and might not correlate with histological findings or neuroinflammation,51,52 and second, results from our study emphasize the importance of the cerebral metabolic milieu in interpreting 1H-MRS metabolite results.
A salient finding of the present study is that brain glucose uptake under insulin clamp was positively related to glutamine/glutamate (Glx), total creatine, and total choline levels in the occipital lobe. Glutamate is the major excitatory neurotransmitter; once released in the synapses it is quickly cleared by the astrocytes, and transformed in glutamine which is then cycled back to neurons. 53 Previous studies have shown that Glx increases in response to insulin stimulation 43 and to hyperglycemia in subjects with type 1 diabetes, independently of neuronal activity to induce enhanced glutamate-glutamine cycling. 25 The increase also occurs postprandially in rats and healthy human subjects, with the increase in glutamate synthesis possibly being mediated by the increase in plasma glucose. 54 While we observed no effect of severe obesity on fasting Glx levels or changes during hyperinsulinemic euglycemia, brain Glx correlated with insulin-stimulated brain GU. While increased intracellular glucose concentration in astrocytes might stimulate glutamate synthesis, enhanced glycolysis is also required to provide glutathione to maintain the redox status in association with upregulated glutathione/glutamine cycling. 51 Additionally, impaired further metabolism of glutamate and glutathione could result in their accumulation, as reported in db/db mice. 53
Choline, representing different choline-containing compounds, is considered a marker of membrane turnover. As the concentration of choline is higher in glial cells than neurons, 23 and 1H-MRS studies have demonstrated increased concentrations in different inflammatory states, 55 it is often considered also a sign of gliosis. In the current data, brain choline did not change in response to insulin but was associated with BGU. It could therefore be argued that increased glucose uptake reflects increased number of astrocytes or altered membrane phospholipid metabolism.
Finally, total brain creatine was also positively associated with BGU. Brain creatine levels have previously been shown to be increased in metabolic syndrome during fasting, 56 and in subjects with type 1 diabetes during hyperglycemia. 25 Because the 1H-MRS signal for total creatine represents both creatine and phosphocreatine, it is not possible to detect whether energy storing as phosphocreatine is increased in response to insulin-stimulation; however, the higher concentration seen in insulin resistance may imply an increased need for a readily available energy buffer for large fluctuations in energy needs, as seen in astrocytes. 57 Once again, even though creatine and phosphocreatine (i.e., total creatine) are found in all neural cells, their astrocytic concentration is twice that of neurons. 58
In our previous studies focusing on brain metabolism, we have shown that insulin-stimulated BGU is normalized already 6 months after bariatric surgery, 14 and therefore we expected to see changes in 1H-MRS metabolites possibly associated with glucose metabolism as well. Recently Bottari et al., reported a decrease in choline-containing compounds and myo-inositol one year after bariatric surgery, whereas levels of NAA, creatine or Glx remained unaffected. 59 This in contrast to our results only showing an increase in total creatine. However, as Bottari et al. did not report the condition the scans were performed in, it is difficult to make a comparison between the studies. An earlier study has shown that brain water content is increased in obesity, 60 and therefore it is plausible that the increase in brain metabolites following weight loss could be driven by a decrease in brain water content, which we were unfortunately unable to quantitate from the performed scans.
Taken together, this is the first study to link directly upregulated brain glucose uptake during euglycemic hyperinsulinemia with increased concentrations of glutamine/glutamate, total choline, and total creatine in humans in vivo. This supports the growing evidence in both animal models and humans of altered TCA cycling in the brain associated with obesity and insulin resistance,54,61,62 with the lower brain glucose concentrations of a previous 1H-MRS study possibly explained by a higher turnover of glucose into further metabolites. 28 While several of these findings might be attributed to astrocytosis, they do not confirm the existence of central inflammation per se. Rather, our results emphasize how understanding metabolic disruption is essential to further characterize these phenomena.
While the established and sensitive methodology used in the current study is a strength, it also poses some limitations due to the radiation burden and cost of the studies, which limit the possibility of repeat studies in the same subjects. The small sample sizes, and recruiting only female participants in dataset C, also limit the ability to generalize the results. Another important consideration is that because of the conventional 1H-MRS protocol applied, brain glucose concentrations could not be assessed. In this setting, the signal of brain glucose consists of multiple peaks that overlap with other metabolites. To overcome this problem, a recent elegant study assessing the effect of obesity and T2D on brain glucose concentrations applied hyperglycemic clamps to increase the brain glucose signal, and then subtracted the baseline brain glucose peaks from those of the hyperglycemic state. 28 Finally, from a technical point of view the water suppression method differed in the two scanner models. CHESS with a small bandwidth was used on Siemens while excitation method with a bandwidth of 200 Hz was used on Philips. On Siemens this could have led to a larger water residual while the broad bandwidth on Philips might have affected the amplitude of some of the metabolite signals close to water. Due to this reason, absolute values of metabolites concentrations from different scanners and datasets are not directly comparable.
To conclude, using a novel approach applying two complementary imaging modalities, we were able to show for the first time that during insulin-stimulation, cerebral glucose uptake is coupled with concentrations of glutamine/glutamate, choline, and creatine. Of the studied metabolites, myo-inositol was the only metabolite to show a consistent increase in concentration from fasting to hyperinsulinemia, and in a similar degree in lean and obese subjects. We hypothesize that the coordinated changes are driven by upregulated brain metabolism in response to insulin stimulation, but more studies in vivo in humans would be warranted to consolidate the present findings and to elucidate the mechanisms involved in central insulin resistance.
Footnotes
Funding
The author(s) disclosed receipt of the following financial support for the research, authorship, and/or publication of this article: The study was supported by the European Foundation for the Study of Diabetes (EFSD) (PN). ER reports funding from the Emil Aaltonen Foundation, the Finnish Cultural Foundation, the Paulo Foundation, the Maud Kuistilan Muistosäätiö, the Finnish Diabetes Foundation, the Finnish Medical Foundation, and from the Paavo Nurmi Foundation. LN reports funding from Sigrid Juselius Stiftelse and Academy of Finland (294897, 332225).
Acknowledgements
The authors would like to thank study Nurse Sanna Himanen, and lab technicians Johanna Kulmala and Sanna Suominen for their commitment and hard work for the completion of his study.
Declaration of conflicting interests
The author(s) declared no potential conflicts of interest with respect to the research, authorship, and/or publication of this article.
Authors’ contributions
E. R., K.K., L.P., E.S., S.L. performed the studies. E.R. and A.L.R. analyzed data and literature and drafted the manuscript. K.K. and J.I. analyzed the MRS data. J.F.J. checked the MRS data. M.B. and J.T. analyzed the brain 18F-FDG-PET data. P.S. recruited the subjects with obesity. J.R. produced radioactive isotopes. M.-J.H., E.F., J.F.J., L.N., P.N. reviewed the manuscript. All authors approved the final version of the manuscript. E.R. and P.N. conceived the study design. P.N. is the guarantor of this work and, as such, had full access to all the data in the study and takes responsibility for the integrity of the data and the accuracy of the data analysis. The order of the first authorship was determined by the longer participation in the study by E.R.
Supplementary material
Supplemental material for this article is available online.