
Abstract
The purpose of this study was to examine the relation between glucose metabolism and glutamate concentration in the human brain, in both the normal and diseased state. Regional values of glucose metabolism measured with 2-deoxy-2[F-18]fluoro-D-glucose positron emission tomography (FDG PET) studies and single-voxel proton magnetic resonance spectroscopy (1H MRS) measurements of the glutamate/glutamine/γ-aminobutyric acid (Glx) tissue concentration were determined in multiple brain regions in 11 patients (5 girls and 6 boys, mean age 7.5 years) with medically intractable partial epilepsy. FDG PET and 1H MRS studies were performed in the interictal state in seven patients and in the ictal/periictal state in four patients. Regions of interest were identified in epileptic cortex (determined by intracranial and/or scalp electroencephalography) and in contralateral normal brain regions. Lower glucose metabolism and lower Glx concentrations were found in the epileptic focus than in the contralateral normal cortex in all seven patients examined in the interictal state, whereas higher glucose metabolism and higher Glx concentrations were observed in the epileptic focus in the four patients who had ictal/periictal studies. Significant correlations were found between the values of cerebral glucose utilization and Glx concentration in epileptic brain region, in nonepileptic brain regions, and in epileptic and nonepileptic regions combined. These results demonstrate a significant relation between glucose metabolism and glutamate/glutamine concentration in normal and epileptic cerebral cortex. This relation is maintained in both the interictal and ictal states.
Keywords
Glutamate is the main excitatory neurotransmitter in the human brain and is believed to play an important role in the initiation, spread, and maintenance of epileptic activity (Meldrum, 1992). Glutamate receptors are located on glial and neuronal cells (Chapman, 1998; Stephens et al., 1993). Increases in the density of N-methyl-D-aspartate (NMDA), α-amino-3-hydroxy-5-methyl-isoxazole-4-propionic acid (AMPA), and kainate receptors (Brines et al., 1997; Geddes et al., 1990; Hosford et al., 1991), and an increased number of glutamate receptor subunits have been described in epilepsy (Mathern et al., 1997, 1998). The functions of glutamate metabotropic and NMDA receptors are modified in epilepsy (Akiyama et al., 1992; Al-Ghoul et al., 1997; Dietrich et al., 1999; Ehlers et al., 1996), and alterations in glutamate transporters also potentially can contribute to epileptogenesis (Akbar et al., 1997; Mathern et al., 1999; Tanaka et al., 1997).
There have been attempts to develop glutamate receptor tracers for in vivo functional imaging studies in humans. For example, (+)-3-[I-123]Iodo-MK-801 has been developed for imaging with single photon emission computed tomography (SPECT) (Owens et al., 1997), and (+)-3-[C-11]cyano-dizocilpine has been synthesized as a radiotracer for positron emission tomography (PET) (Sihver et al., 1998) for the in vivo assessment of NMDA receptors. However, further development of these and other potential ligands is still required.
A recently articulated hypothesis suggests that most of the signal derived from 2-deoxy-2[F-18]fluoro-glucose (FDG) uptake measured with PET is due to glutamate stimulation of glucose uptake by astrocytes (Magistretti et al., 1999; Magistretti and Pellerin, 1996). If this hypothesis is correct, the numerous FDG PET studies on patients with epilepsy in the literature might be reinterpreted in terms of glutamate neurotransmitter activity. The hypothesis regarding glutamate and glucose coupling is based on the observation that glutamate stimulated 2-deoxyglucose uptake and phosphorylation by astrocytes in primary culture (Magistretti et al., 1999; Magistretti and Pellerin, 1996). Glutamate uptake into the astrocytes by a glutamate transporter resulted in a concomitant stimulation of glucose uptake by means of a mechanism involving activation of the Na+/K+ ATPase, followed by an increase in lactate efflux from the astrocytes (Pellerin and Magistretti, 1994). Thus, Pellerin and Magistretti (1994) have proposed that this mechanism accounts for the coupling between neuronal activity and energy metabolism. Further data in support of this theory are derived from [C-13] magnetic resonance spectroscopy (MRS) studies in which cortical rates of oxidative glucose metabolism and glutamate neurotransmitter cycling were measured in rats under different degrees of anesthesia (Sibson et al., 1998). Sibson et al. estimated an approximately 1:1 stoichiometry between glutamate cycling and glucose metabolism, with glutamatergic synaptic activity accounting for more than 80% of total glucose oxidation under conditions of mild anesthesia. The magnitude of the stoichiometry reported between glutamate cycling is surprising when one considers the numerous other metabolic requirements for glucose, and this issue remains controversial in the neuroscience field. Most of the data supporting this hypothesis, however, were derived either from cultured astrocytes or anesthetized rodents, and therefore the applicability of these findings to humans remains to be established. Toward this goal, Gruetter et al. (1998) have proposed a model for the estimation of glutamate neurotransmission and glucose consumption based on preliminary single-voxel proton MRS (1H MRS) measurements at 4 Tesla in human brain after the infusion of 1-[13C]D-glucose.
The purpose of this study was to test the hypothesis of coupling between glutamate and glucose metabolism in humans with epilepsy by comparing regional values of glucose metabolism from FDG PET studies with 1H MRS measurements of the glutamate/glutamine/γ-aminobutyric acid (Glx) tissue concentration (Duncan, 1996; Frahm and Hanefeld, 1996; Moore, 1998). Comparisons of glucose utilization and glutamate/glutamine concentrations in patients with focal epilepsy allows measurements in the unstimulated interictal state and, in a few subjects, the stimulated ictal/periictal state, for both epileptic and normal cortex.
METHODS
Subjects
Eleven patients (5 girls and 6 boys, mean age 7.5 years, age range 0.3 to 20 years) with medically intractable partial epilepsy were included in the study (Table 1). As part of the presurgical evaluation, all patients underwent magnetic resonance imaging (MRI), quantitative 1H MRS, FDG PET, and prolonged video-electroencephalographic (EEG) recordings with scalp and sphenoidal electrodes. Intraoperative electrocorticography was performed in two patients, and three patients underwent chronic intracranial EEG monitoring. Ictal EEG recordings were obtained in all patients. We selected patients in whom the period between FDG PET and 1H MRS examination was less than 1 month, antiepileptic treatment was the same during both scans, and both scans were obtained for the same ictal state (i.e., either both scans were interictal [n = 7] or both scans were ictal/periictal [n = 4]). Antiepileptic treatment at the time of the FDG PET and 1H MRS examinations included mono- or polytherapy with carbamazepine (n = 3), clonazepam (n = 2), felbamate (n = 1), gabapentin (n = 2), lamotrigine (n = 2), phenobarbital (n = 1), phenytoin (n = 3), valproate (n = 7), and vigabatrin (n = 2). Studies were performed in accordance with the regulations of the Human Investigation Committee at Wayne State University.
Clinical data, EEG focus, MRI, histopathologic, and PET findings of 11 patients with partial epilepsy
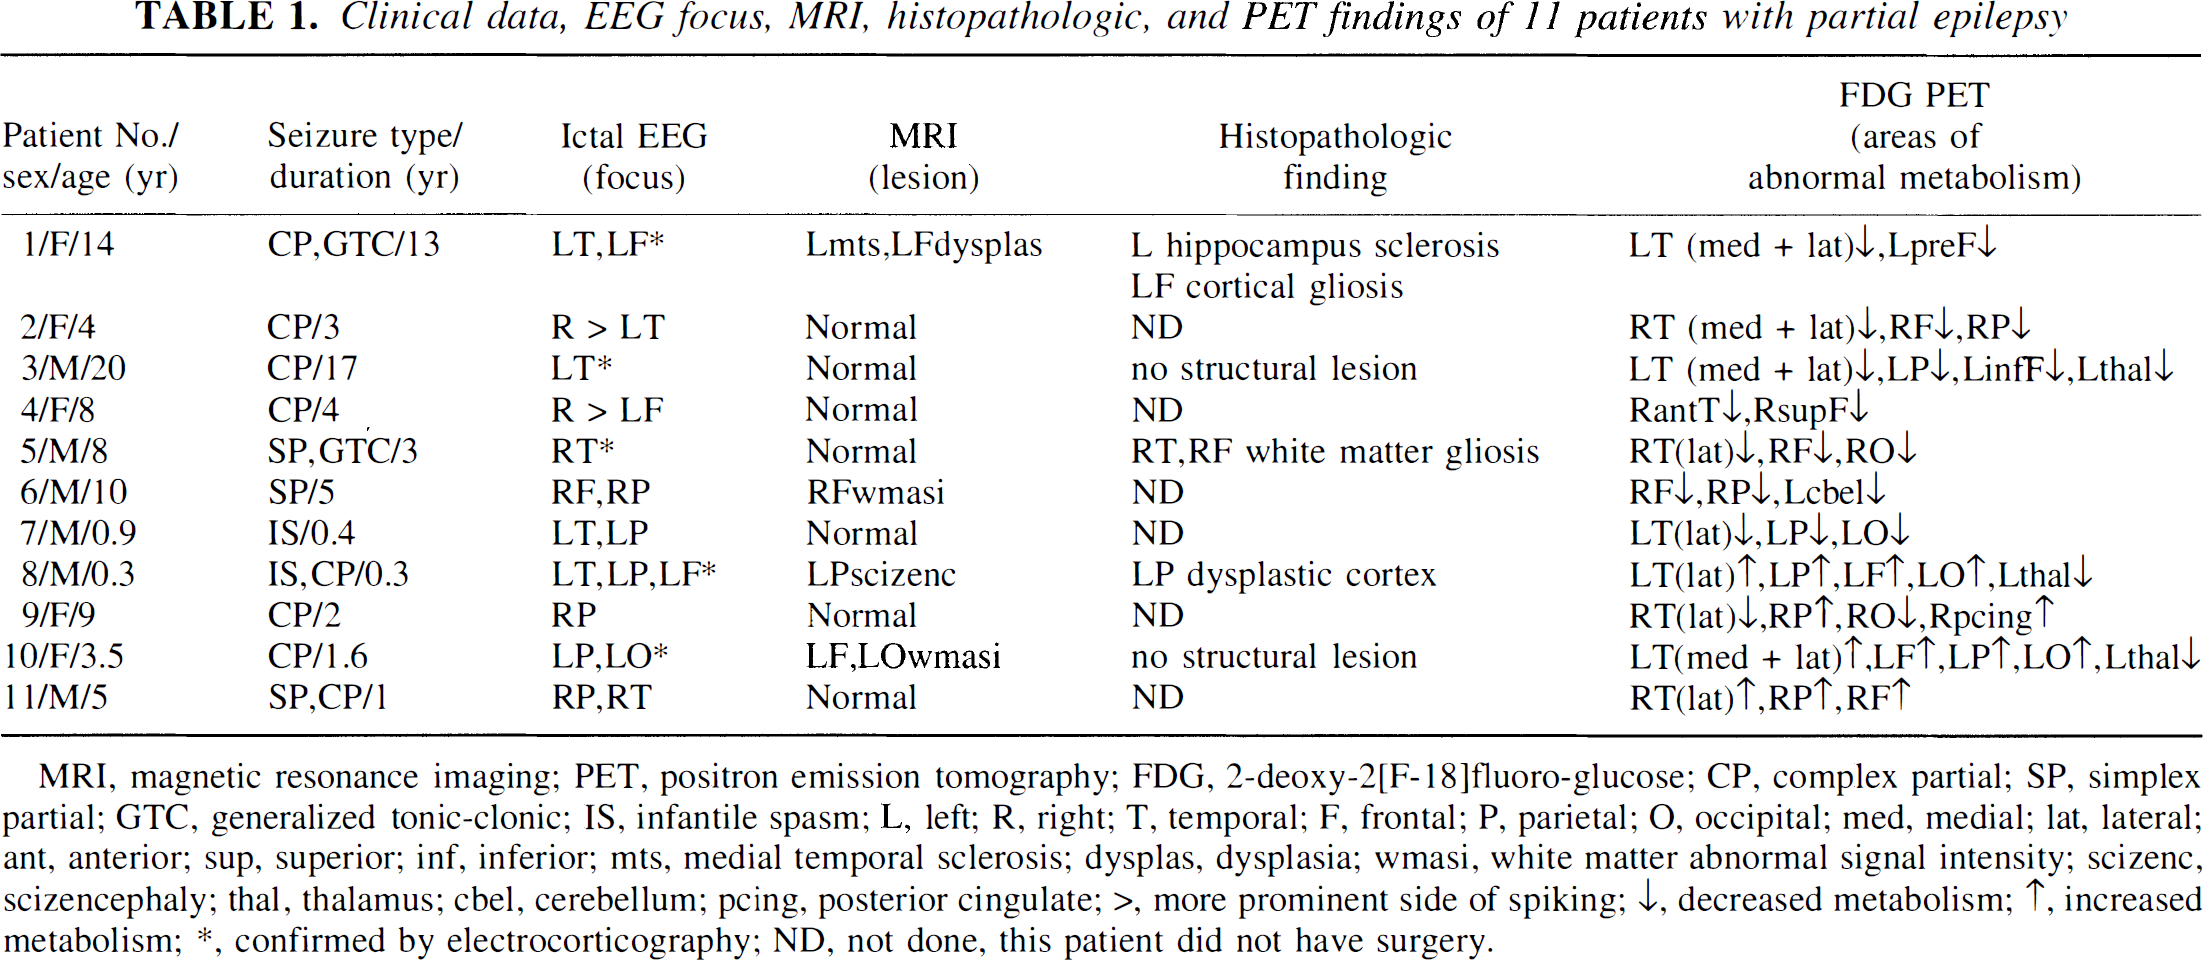
MRI, magnetic resonance imaging; PET, positron emission tomography; FDG, 2-deoxy-2[F-18]fluoro-glucose; CP, complex partial; SP, simplex partial; GTC, generalized tonic-clonic; IS, infantile spasm; L, left; R, right; T, temporal; F, frontal; P, parietal; O, occipital; med, medial; lat, lateral; ant, anterior; sup, superior; inf, inferior; mts, medial temporal sclerosis; dysplas, dysplasia; wmasi, white matter abnormal signal intensity; scizenc, scizencephaly; thal, thalamus; cbel, cerebellum; pcing, posterior cingulate; >, more prominent side of spiking; ↓, decreased metabolism; ↑, increased metabolism; ∗, confirmed by electrocorticography; ND, not done, this patient did not have surgery.
PET scanning protocol
Patients fasted for 4 hours before the PET studies. Scalp EEG electrodes were placed according to the International 10–20 System, and the EEG was monitored throughout the tracer uptake period. A venous line was established for injection of FDG (0.143 mCi/kg) produced using a Siemens RDS-11 cyclotron (Knoxville, TN, U.S.A.). External stimuli were minimized by dimming the lights and discouraging interaction so that studies reflected the resting awake state during the uptake period (0 to 30 minutes after injection). Sedation with intravenous nembutal or midazolam was used if necessary only after the tracer uptake period.
FDG PET studies were performed using a CTI/Siemens EXACT/HR whole-body positron tomograph (Siemens). This scanner has a 15-cm field of view and generates 47 image planes with a slice thickness of 3.125 mm. The reconstructed image in-plane resolution obtained is 6.5 ± 0.35 mm at full width at half maximum and 6.0 ± 0.49 mm in the axial direction for the FDG PET (reconstruction parameters: Shepp-Logan filter with 1.1 cycles/cm cutoff frequency and Hanning filter with 0.20 cycles/pixel cutoff frequency). Calculated attenuation correction was performed as previously described (Bergstrom et al., 1982).
MRI/MRS protocol
MRI and MRS examinations were performed on a GE 1.5 Tesla Signa 5.7 unit (GE Medical Systems, Milwaukee, WI, U.S.A.). Multiplanar MRI sequences were obtained in all cases, including a 124-slice (1.5-mm thickness) T1-weighted spoiled gradient echo (SPGR) sequence and a 21-plane axial T2-weighted sequence. Sedation with intravenous nembutal or midazolam was used if necessary.
During the 1H MRS examination, a stimulated echo acquisition mode (STEAM) pulse sequence (Frahm et al., 1987) was used to acquire spectra using the following acquisition parameters, which also included unsuppressed water reference scans for neurochemical quantitation: echo time = 30 milliseconds, modulation time = 13.7 milliseconds, repetition time = 2 seconds, 8-step phase cycle, 2,048 points, spectral width = 2,500 Hz, and 128 averages for a total acquisition time of approximately 5 minutes. In vivo spectra were acquired from approximately 8-cc regions of interest (ROIs) in the region of the seizure focus and symmetrically on the contralateral side such that they contained almost entirely gray matter and did not contain structural lesions, if present.
MRI/PET coregistration
Coregistration of FDG PET and MRI image volumes was performed as described previously, using a multipurpose three-dimensional registration technique (MPItool) developed by the Max Planck Institute in Cologne, Germany (Pietrzyk et al., 1990, 1994). The PET image volume was coregistered with the axial MRI volume using MPItool, and a new image volume was created with 21 image planes corresponding to the original MRI planes. Brain ROIs for the position of the MRS voxel were registered on the axial T2-weighted MRIs and then transferred to the coregistered FDG PET images.
PET image analysis
Regional values for tracer concentration were obtained by taking the average value for all planes in which the voxel was located. Regional values were then normalized to the concentration for the normal hemisphere (contralateral to the seizure focus), yielding a ratio of relative regional cerebral glucose utilization (rCGU). For the assessment of asymmetries in glucose metabolism, we used an asymmetry index (AI):

where AI and AC are the radioactivity concentrations (μCi/mL) for the defined brain regions on the side of the seizure focus and contralateral to the focus, respectively.
Quantitative MRS analysis
The Glx complex was identified in short-echo 1H MRS. The area under each of the resonances is proportional to the concentration of the specific neurochemical compound. Individual peak areas were fit using time domain analysis software (de Beer et al., 1992; van den Boogaart et al., 1994), and the concentrations of each compound are reported in arbitrary quantitative units as a ratio to brain water concentration (×104/water). This water referencing method has been used in the field for more than a decade and has been validated by several research groups (Barker et al., 1993; Christiansen et al., 1993; Frahm et al., 1990; Hennig et al., 1992; Hetherington et al., 1996; Klose, 1990; Soher et al., 1996; Thulborn and Ackermann, 1983). The analysis software is public domain (http://www.mrui.uab.es/mruiHomePage.html) and eliminates much of the subjectivity previously involved in determining spectral peak areas using older methods. The software performs an automated fit of the unsuppressed water peak to determine its peak area and also uses the phase of the water peak to apply an automated zero-order phase correction to the metabolite data. After this, the user enters a priori information regarding the neurochemical data to give the software starting values for its fitting process. The a priori information given includes the expected chemical shifts for each of the major chemical compounds appearing in the typical proton brain spectrum, as well as a starting linewidth, determined by the corresponding water linewidth. The chemical shift value for the Glx complex based on literature values is 2.3 (Barker et al., 1994; Frahm et al., 1989; Kreis et al., 1993; Michaelis et al., 1993; Narayana et al., 1989). The Glx resonance typically contains approximately equal amounts of glutamine and glutamate, with a broader underlying macromolecule component and a relatively small contribution from γ-amino-butyric acid (GABA). However, with the acquisition parameters used in this study (TE = 30 milliseconds PRESS sequence), the relative MR visibility of neurochemicals in the Glx resonance is more heavily weighted toward glutamate than glutamine because of relaxation and modulation effects (conservatively, a 60-to-40 ratio, assuming equal concentrations).
Statistical analysis
Statistical analysis was performed using StatView statistical package (BrainPower, Inc., Calabasas, CA, U.S.A.). Pearson's correlation was used to assess the correlation between the absolute values for Glx and relative rCGU values. The statistical significance of the correlations was calculated using an F test. P < 0.05 was considered to be significant.
RESULTS
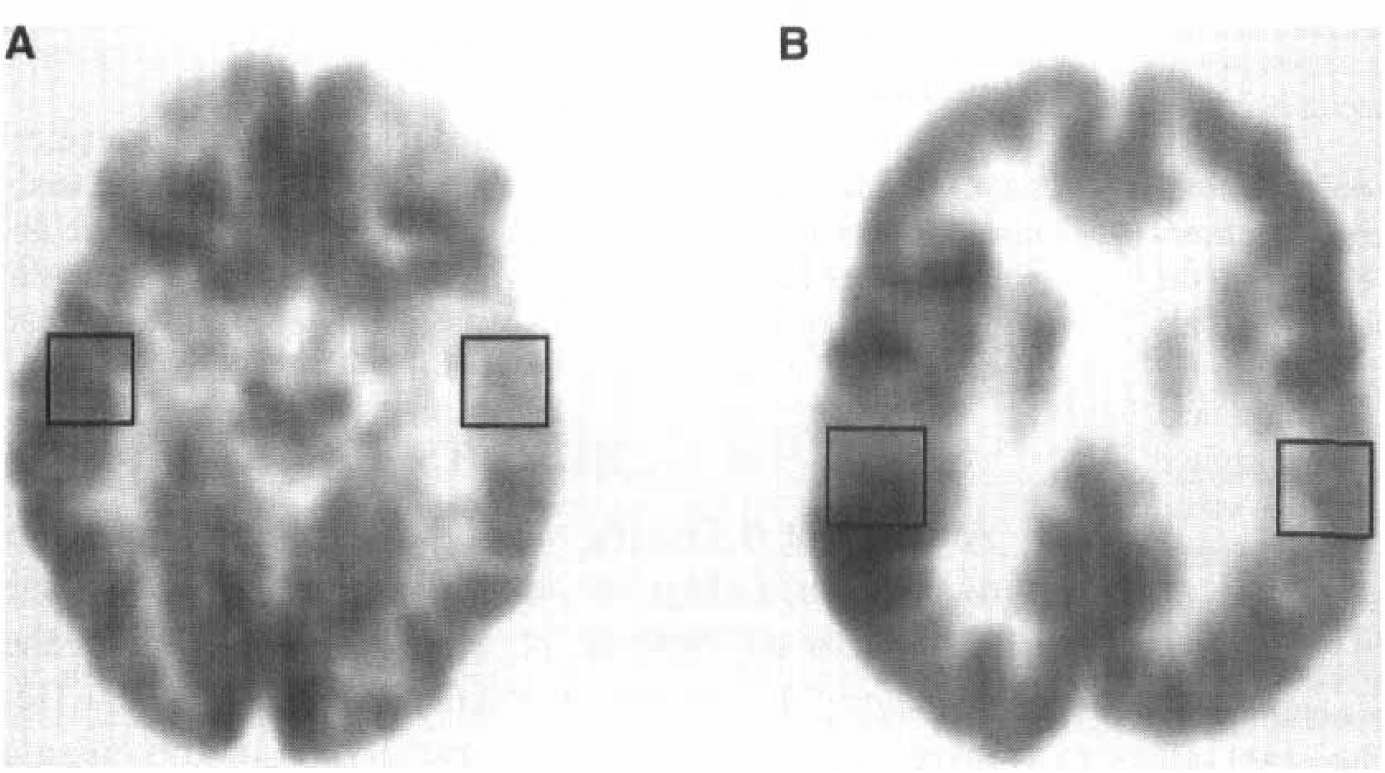
Analysis of rCGU for the region of the seizure focus showed a broad range of values, varying from a decrease of 23.8% to an increase of 16.9% compared with the contralateral homotopic normal region (Table 2). Decreased glucose metabolism was found in the seizure focus (as determined by intracranial and/or scalp EEG) in all seven patients examined in the interictal state (see Table 2, patients 1 to 7; Fig. 1A), whereas increased metabolism was observed in the four patients who had ictal studies (see Table 2, patients 8 to 11; see Fig. 1B). A summary of the qualitative (visual) assessment of glucose metabolism abnormalities is presented in Table 1. Quantitative values of rCGU in the epileptic focus and contralateral homotopic regions are given in Table 2.
Glx concentration, ratios of rCGU and FDG-PET asymmetry indices of 11 patients with partial epilepsy
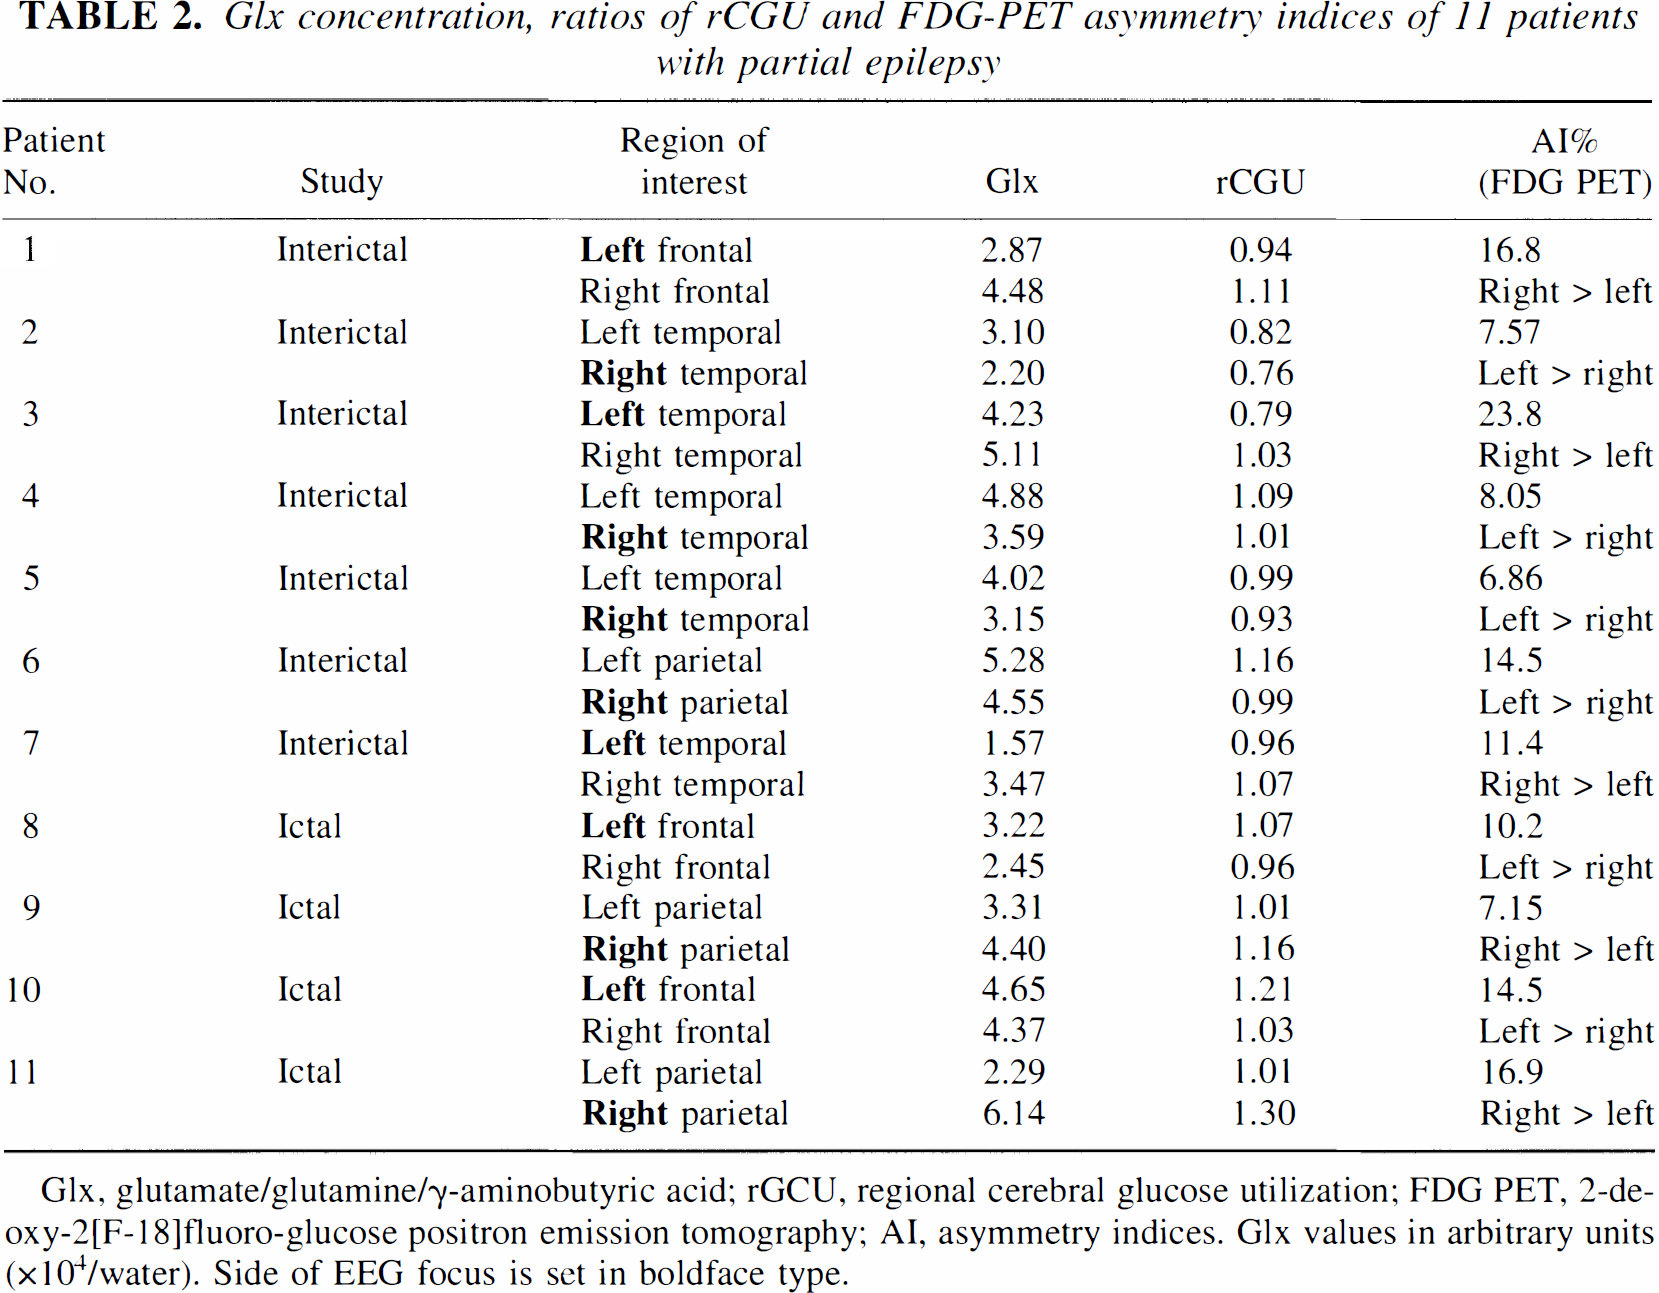
Glx, glutamate/glutamine/γ-aminobutyric acid; rGCU, regional cerebral glucose utilization; FDG PET, 2-deoxy-2[F-18]fluoro-glucose positron emission tomography; AI, asymmetry indices. Glx values in arbitrary units (×104/water). Side of EEG focus is set in boldface type.
(
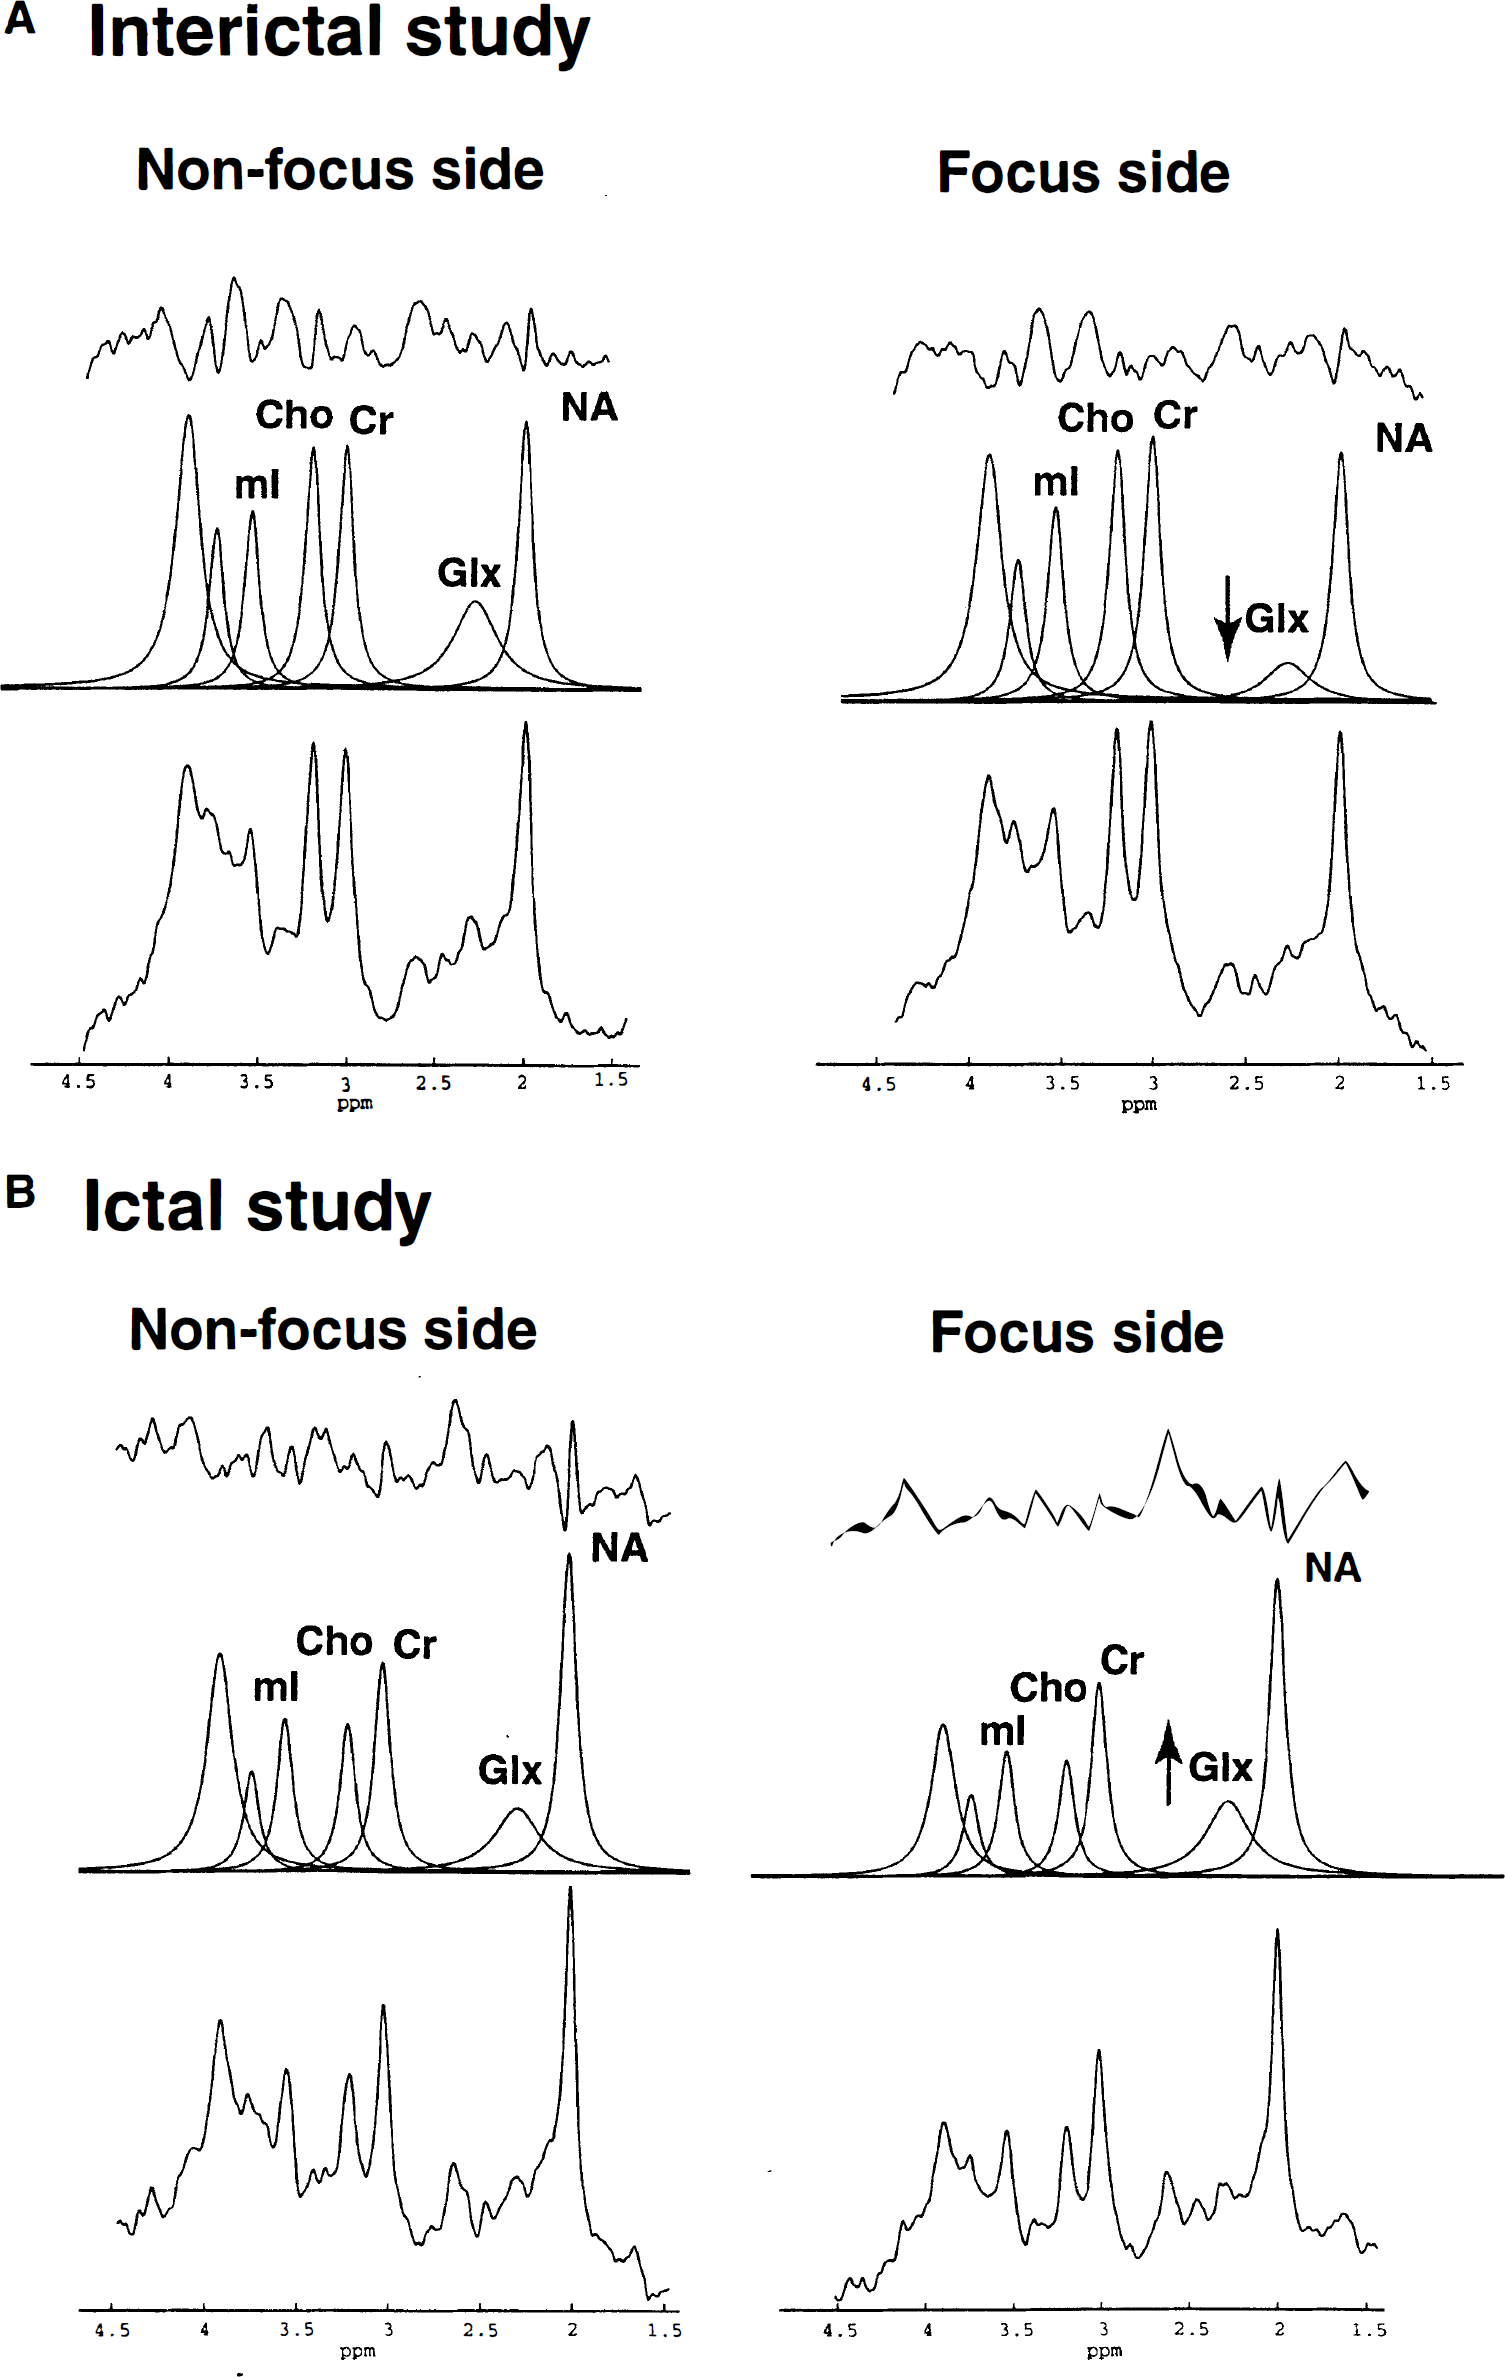
Similarly, decreased Glx concentration on the side of the epileptic focus relative to the contralateral side was found in all patients with interictal studies (see Table 2, Fig. 2A). In patients with ictal/periictal studies, there were higher Glx concentrations on the side of the EEG focus (see Table 2, Fig. 2B).
(
Significant correlations were found in the comparison of glucose metabolism with tissue concentration of glutamate/glutamine using ROIs in the epileptic cortex (r = 0.67, P = 0.021, y = −1.54 [±1.95] + 5.17 [±1.90]x; parameters [±SD]: y = Glx concentration, × = rCGU value), using contralateral homotopic ROIs (r = 0.60, P = 0.047, y = −3.51 [±3.12] + 7.22 [±3.04]x), and using the combined ROIs from focus and nonfocus regions (r = 0.64, P = 0.0009, y = −1.97 [±1.53] + 5 [±1.49]x; Fig. 3).
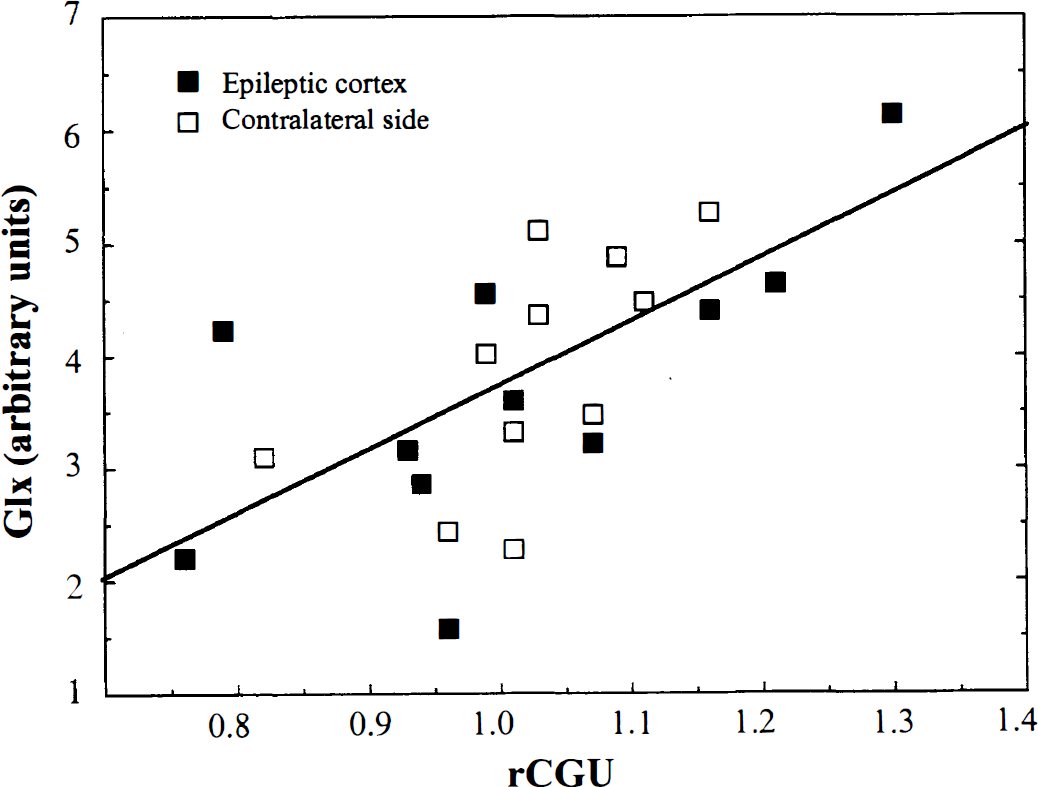
Correlation between glutamate/glutamine/γ-aminobutyric acid (Glx) concentration and relative cerebral glucose utilization (rCGU) in patients with partial epilepsy including epileptic focus regions of interest and contralateral, nonepileptic regions of interest (n = 22; r = 0.64, P = 0.0009). The data were obtained from seven patients in the interictal state and four patients in the ictal/periictal state.
DISCUSSION
Previous reports suggesting a relation between glucose consumption and glutamate cycling have studied cortical gray matter. Thus, we have attempted to identify volumes of interest that contain predominantly cortical gray matter. In normal tissue, the ratio of glutamate/glutamine measured with 1H MRS in gray versus white matter is approximately 1.5 (Frahm and Hanefeld, 1996). Although the ratio of 1.5 is less than the reported 1.9 ratio for parietal gray/white matter glucose utilization measured with FDG PET (Mazziotta et al., 1981), the volumes of interest used for MRS studies contain more “spillover” of white matter into gray matter and vice versa than typical ROIs drawn on PET scans.
By combining FDG PET with 1H MRS, it is possible to study the relation between cortical glucose metabolism and glutamate/glutamine concentration in humans under normal and pathologic conditions. Using this approach, we have found a significant positive linear correlation between cortical rCGU and the glutamate/glutamine concentration, both for the epileptic focus and for the contralateral homotopic cortex. In ROIs containing the epileptic focus, interictal glucose hypometabolism was associated with decreased Glx concentration, whereas ictal/periictal increased glucose metabolism was related to increased Glx concentration. This finding is consistent with the hypothesis suggesting a relation between glutamate cycling and glucose metabolism.
Several methodologic limitations of our study should be addressed. First, although both FDG PET and 1H MRS studies for a given patient were obtained in the same state (ictal or interictal), these were not obtained simultaneously. We have attempted to match the conditions between the two series, but even then the EEGs between the two scans almost certainly will be different. Second, the Glx resonance contains not only glutamate but also glutamine (approximately 40% of the peak), a broad underlying macromolecule component, and a small contribution from GABA. Thus, it is possible that the changes in Glx measured represent changes in glutamine rather than, or in addition to, changes in glutamate. Further, the Glx peak contains the entire tissue glutamate/glutamine pool, of which the released glutamate is only a small component (Sibson et al., 1998). Measurement of metabolic pools alone cannot be used to infer the activity of a metabolic reaction.
Enhanced glutamate release, contributing to the initiation of seizure activity, has been reported in microdialysis studies during seizures in patients with partial epilepsy (During and Spencer, 1993; Meldrum, 1993; Ronne-Engström et al., 1992), as well as in some animal models (Jarvie et al., 1990; Minamoto et al., 1992). An increased glutamate/glutamine level was also measured with MRS after status epilepticus in one patient with focal epilepsy (Fazekas et al., 1995). A lower Glx concentration has been shown ipsilateral to the seizure onset in patients with temporal lobe epilepsy and hippocampal sclerosis compared with normal controls (Woermann et al., 1999). These data suggest that the Glx concentration is lower in epileptogenic brain regions than in normal tissue, but it may increase with ictal activity.
Our data showing an increased Glx concentration with seizure activity are consistent with results of previous studies. The mechanism for a rapid increase in total tissue Glx during seizure activity, however, is unclear. We speculate that the increase may be the result of increased flux through the glutamate/glutamine synthesis cycle. Another possible mechanism that might contribute to a rapid increase in total tissue glutamate could be the release of glutamate through the cleavage of n-acetyl-aspartylglutamate (NAAG) (Coyle, 1997). NAAG is a neuropeptide that is released by neuronal depolarization and is converted to N-acetyl-aspartate (NAA) and glutamate by glutamate carboxypeptidase II (Coyle, 1997), an enzyme present on the extracellular surface of glia and neurons (Cassidy and Neale, 1993). Alterations in NAAG and the carboxypeptidase activity have been reported in several animal models of epilepsy. In genetically epilepsy-prone rats, the activity of this membrane-bound enzyme (Robinson et al., 1987) is increased in several brain regions, which increases the availability of NAA and glutamate in certain synapses of the brain (Meyerhoff et al., 1992). A kindling-induced increased NAAG level was observed in the entorhinal cortex (Meyerhoff et al., 1989). Further, the rapid turnover of NAAG shows that the conversion of NAA to NAAG can be an important modulator of synaptic activity (Tyson and Sutherland, 1998). However, NAAG concentrations are too small to account for the entire change in Glx measured in the present study. Nonetheless, it is possible that alteration of the synthesis, release, and catabolism of NAAG under certain conditions may play a role in the generation of epileptic activity.
In conclusion, our results demonstrate a significant relation between the tissue glutamate/glutamine concentration and glucose metabolism in human cortex. However, our data are correlational and cannot be used to support or refute the magnitude of the relation as previously described in animals (Sibson et al., 1998). These data add to the growing body of literature supporting the relation of glutamate metabolism to glucose metabolism in the cerebral cortex, and extend previous findings to humans with epilepsy.
Footnotes
Acknowledgments
The authors thank Galina Rabkin, CNMT, and Teresa Jones, CNMT, for their expert technical assistance in performing the PET studies, and Caroline Zajac-Benitez, BS, for her excellent technical assistance with MRS data analysis.