
Abstract
Type 2 diabetes (T2D) is associated with dyslipidemia and mild cognitive impairment. This study investigated the relationships between serum lipids metabolism, cognition, and functional connectivity (FC) within and between brain networks in T2D patients. The study included 102 T2D patients and 45 healthy controls who underwent functional magnetic resonance imaging, lipid profile tests, and cognitive assessments. Thirteen functional networks were identified using independent component analysis. The statistical analyses included multivariate analysis of covariance, partial correlation, canonical correlation, and mediation analyses. We found widely reduced between-network FCs in T2D, especially between the ventral sensorimotor network (SMN) and dorsal attention network (DAN) (p = 0.001) and between the ventral SMN and lateral visual network (VN) (p < 0.001). Moreover, lower between-network FCs were correlated with worse serum lipids metabolism and poorer cognitive performance (all p < 0.05). Importantly, between-network FCs mediated the relationship between lipid metabolism and cognition (β = −0.3136, 95% CI: −0.7660, −0.0186). Within-network analyses revealed altered FCs within the anterior default mode network, DAN, and lateral VN, each positively correlated with global cognition (all p < 0.01). Our results suggest the potential of improving cognitive function by regulating serum lipids in individuals with T2D.
Keywords
Introduction
Cognitive impairment is increasingly recognized as important comorbidity and complication of diabetes, affecting patients’ quality of life and diabetes management. 1 The global health issue of cognitive impairment in type 2 diabetes has grown as a result of the rising prevalence of diabetes and the aging population. Screening for cognitive impairment in elderly diabetic individuals is advised by current diabetes guidelines. 2 However, the mechanisms underlying diabetes-associated cognitive dysfunction remain obscure.
Patients with type 2 diabetes usually suffer from dyslipidemia. The prevalence of dyslipidemia among individuals with type 2 diabetes was 43.5% in 2013 and 2016 in the U.S., and 67.1% in 2011 in China.3,4 Lipid homeostasis is essential for nervous system development and maintenance because cholesterol is a major component of cell membranes and intracellular structures and a biosynthetic precursor for many bioactive chemicals. 5 Numerous longitudinal and cross-sectional studies have linked serum lipid patterns to cognition. Poorly managed blood cholesterol, including higher levels of triglyceride (TG), total cholesterol (TC), and low-density lipoprotein cholesterol (LDL-C), has been linked to impaired global cognition, recognition memory and inhibitory processing,6,7 while higher high-density lipoprotein cholesterol (HDL-C) levels have been linked to better executive function. 8 Some reports have also indicated that elevated TG, TC, and LDL-C in midlife are not only linked to worse cognitive performance at that stage but also a steeper loss in multiple cognitive domains (memory, executive function, attention, and processing speed) in late life.9,10
Brain activity can be mapped using the functional magnetic resonance imaging (fMRI) method. Multiple studies have explored aberrant default mode network (DMN) in patients with type 2 diabetes and their association with cognition. Among them, the majority of studies used seed-based analysis with the hippocampus11,12 or posterior cingulate cortex (PCC)13 –15 as the seeds to identify the DMN. Evidence from previous fMRI studies found that patients with type 2 diabetes have reduced functional connectivity (FC) within the DMN.16,17 Diabetic patients with poorly controlled cholesterol exhibit impaired attention and executive function and impaired FC between the hippocampus and middle frontal gyrus within the DMN may be involved in this process. 18
However, the seed-based approach may introduce potential selection bias because of the prespecified seed regions. In addition, prior work has been limited by only focusing on widely studied networks such as DMN while ignoring other networks, and the coordination among networks. In fact, the completion of cognitive activities requires the interaction and coordination of multiple brain regions and complex large-scale brain networks to process information.19,20 From the signal level, each functional network has a similar pattern of signal change during resting-state fMRI, and the synchrony of distinct but functionally coherent networks is the foundation of complex cognition and emotion. 21 The independent component analysis (ICA) method can be used in a data-driven format to explore the temporal correlations among different brain regions at rest, thus identifying functional networks from resting-state fMRI data. 22 Investigation of FC within and between functional networks has been widely used in neuroscience research23,24 and has largely improved our knowledge of brain network organization patterns in brain development and disease.25,26 Whether and how serum lipid metabolism is related to FC within and between large-scale functional networks in type 2 diabetes is still an open question.
Our study was therefore designed to investigate how serum lipid profiles and FC are related within and between large-scale functional networks in type 2 diabetes. We also identified the mediating role of FC in accounting for the relationships between lipid metabolism and cognitive performance.
Materials and methods
Participants
This study spanned January 2016 to May 2019. All participants were aged 40 to 75 years, with right-handedness, and more than six years of education. Patients with diabetes were recruited from the outpatient or inpatient services at the Department of Endocrinology of Drum Tower Hospital. Type 2 diabetes was diagnosed by the American Diabetes Association standards. Healthy controls were recruited from the nearby communities and pre-examined for normal glucose tolerance and cognition before enrollment. Montreal Cognitive Assessment (MoCA) scores below 26 indicated cognitive impairment. The Hamilton depression and anxiety scales were used to exclude subjects with possible depression and anxiety, and the score below 7 on the scale indicating a normal psychological state and the absence of depression and anxiety. Exclusion criteria included possible depression or anxiety status, a history of neurological or psychiatric disorders, thyroid dysfunction, cardiovascular disease, acute/subacute infarcts and microinfarcts, recent anemia, diabetic ketoacidosis, frequent hypoglycemic episodes, alcohol or drug abuse, steroid treatment, infections, or MRI contraindications. 147 participants were included in the final data analysis after matching for age, sex, education, smoking, and alcohol consumption. They were divided into type 2 diabetes with mild cognitive impairment (T2MCI, n = 40), type 2 diabetes without mild cognitive impairment (T2noMCI, n = 62) and healthy control (n = 45). The study was approved by the Ethics Committee of Drum Tower Hospital Affiliated to Nanjing University Medical School in accordance with the Helsinki Declaration and registered at Clinicaltrials.gov (NCT02738671). Written informed consent was provided by each participant.
Clinical evaluation and biochemical parameters
At enrollment, age, sex, education level, smoking habit, alcohol consumption, diabetic duration, and use of antihypertensive, lipid-lowering drugs was assessed by interview. Smoking habits were defined as “current smoker” (still smoking or had smoked within the past 6 months), others who had quit smoking for more than 6 months or who had never smoked were defined as “non-current smokers”. Alcohol drinking was categorized into “current user (any form of alcoholic drinks within the past 6 months)” and “non-current drinkers”. Standard physical examinations included body weight, height, blood pressure, waist circumference, and hip circumference. Body mass index (BMI) was calculated from body weight and height (kg/m2) and waist-hip ratio (WHR) was calculated as the ratio of waist circumference to hip circumference. In a central laboratory, serum TC, TG, HDL-C, LDL-C and hemoglobin A1c (HbA1c) were analyzed using fasting blood samples. Moreover, plasma glucose, insulin, and C-peptide levels were detected at fasting and 2 hours after a standard oral glucose tolerance test.
Cognitive assessments
A battery of cognitive assessments was conducted, including the MoCA scale (global cognition), 16-word Philadelphia Verbal Learning Test (declarative episodic memory and learning), Boston Naming Test (word fluency), Digit Span Test forward and backward (working memory), Trail-making Test A and B (processing speed) and Stroop Color and Word Test (executive function). Among these, Trail-making Test and Stroop Color and Word Test are timed tests for which higher scores indicate worse performance. Raw scores on individual tests were converted to z scores, using the mean and standard deviation of the entire cohort, and the z scores of component tests were averaged to yield composite scores of the cognitive domain. The Hamilton Depression and Anxiety Scale assessed psychological status. An expert neuropsychologist who was blinded to the group information performed all these assessments.
MRI acquisition
Participants were examined on a 3.0 T MR system (Achieva TX; Philips, Netherlands) with an 8-channel head coil. MRI scan protocols included the following: (1) 3 D T1 weighted imaging (TR/TE = 9.7/4.6 ms; flip angle 8°; field of view = 256 × 256 mm; thickness = 1 mm; voxel size = 1 × 1 × 1 mm); (2) echo-planar imaging (TR/TE = 2000/30 ms; flip angle 90°; field of view = 192 × 192 mm; thickness = 4 mm; gap = 0 mm; 35 slices; voxel size = 3 × 3 × 4 mm); (3) T2 weighted imaging (TR/TE = 2500/330 ms; flip angle 8°; field of view = 256 × 256 mm; thickness = 1 mm; voxel size = 1 × 1 × 1 mm); (4) fluid-attenuated inversion recovery (FLAIR) images (TR/TE = 4800/275 ms; inversion time = 1650 ms; field of view = 250 × 250 mm; slice thickness = 0.56 mm). Before the scan, participants were told to close their eyes, relax, stop thinking about anything, and avoid dozing off. An experienced radiologist visually examined all images to exclude participants with visible artifacts, lesions, or regional deformations from subsequent analyses.
Brain volume and cerebral microvascular changes
Brain segmentation was performed using the CAT12 toolbox (https://neuro-jena.github.io/cat/) to get the volume of gray matter (GM), white matter (WM) and cerebrospinal fluid (CSF). Brain volumes were corrected using the individual total intracranial volume (TIV). Diagnosis of cerebral microvascular changes was based on the neuroimaging standards for research into small vessel disease. 27 Lacunes were defined as CSF-filled cavities 3 to 15 mm in diameter, with a surrounding rim of FLAIR hyperintensity. Perivascular spaces (PVS) were defined as small, sharply delineated structures of cerebrospinal fluid intensity on imaging that followed the orientation of the perforating vessels, ran perpendicular to the brain surface and were <3 mm wide. White matter hyperintensity (WMH) was defined as obviously hyperintense areas relative to surrounding white matter on both FLAIR and T2-weighted images. The LST toolbox (https://www.applied-statistics.de/lst.html) was used to segment and calculate the volume of WMH. To adjust for the effects of head size and brain atrophy on lesion volume, we analyzed WMH burden by calculating the percentage of WMH volume/WM volume.
fMRI preprocessing
Preprocessing of fMRI data was performed using SPM12 Toolbox. The first ten volumes were removed to obtain a steady-state equilibrium. Then, the fMRI images were corrected for within-scan acquisition time differences and interscan head motion. Head motions were calculated by the Friston-24 parameter model and mean framewise displacement (FD). 28 Participants with excessive head motion (translation or rotation more than 2 mm or 2°) were excluded. Functional images were realigned to the mean functional image and coregistered to structural image. Structural images were used to create a study-specific group template using the DARTEL algorithm. 29 Then, functional images were normalized to Montreal Neurological Institute (MNI) space using this intermediate group template. Voxel size remained 3 × 3 × 3 mm during spatial normalization, and images were smoothed with a 6 mm Gaussian kernel.
Group ICA and postprocessing steps
The GIFT Toolbox was used to perform group ICA on the preprocessed data. The software automatically estimates 31 independent components (ICs) based on the minimum description length criteria. Two principal component analysis steps were carried out, including subject-level and group-level analyses. Then, data from all subjects were concatenated and independent group components were estimated. The Infomax approach was applied twenty times using the ICASSO method to assure estimation reliability. The resulting components were clustered to estimate their reliability, and components with an index > 0.8 were selected. Finally, participant-specific ICA spatial maps and corresponding time courses were computed by the back-reconstruction approach.
We manually identified 16 meaningful ICs from 31 ICs using the following criteria: peak activation coordinates were in gray matter; low spatial overlap with known vascular, ventricular, motion, and artifacts; and dominated by low-frequency fluctuations with a ratio of power < 0.1 Hz. Then, we characterized them into 13 functional networks according to the spatial correlation values between the ICs and priori network templates. As shown in Figure 2, these networks included the anterior and posterior DMN (aDMN and pDMN), left and right frontoparietal networks (lFPN and rFPN), salience network (SN), dorsal and ventral attention networks (DAN and VAN), dorsal and ventral sensorimotor networks (dSMN and vSMN), auditory network (AN), medial, lateral, and posterior visual network (mVN, lVN, and pVN). The time courses of selected ICs were postprocessed by following steps: detrending linear, quadratic, and cubic trends to reduce scanner drift; removing outliers (despiking along each time course); lowpass filtering with a cut-off frequency of 0.15 Hz; and regressing out movement parameters. Next, the symmetric between-network FC matrix of each participant was calculated using the Pearson correlation coefficients between time courses of 13 functional networks. To improve normality, we then transformed individual correlation matrices to Z scores using Fisher transformation. Within-network connectivity maps were calculated by extracting the mean time course inside each network and computing the Pearson correlation coefficients between that time course and the time course of all brain voxels within the network.
Statistical analysis
The statistical analyses were conducted using SPSS 26.0. Categorical variables were assessed using the X2 or Fisher’s exact test. Normal distribution was assessed via Shapiro–Wilk test and consecutive Q–Q plotting. One-way ANOVA and Kruskal-Wallis H test were used to compare demographic, biochemical variables, cognitive scores, brain volume and cerebral microvascular changes between groups. We used multivariate analysis of covariance (MANCOVA) to perform group comparisons in FC with age, sex, education and mean FD as covariates. For between-network analyses, the false discovery rate (FDR) (p < 0.05) correction was used for multiple comparisons. For within-network FCs, significance threshold correction was performed based on the family-wise error (FWE) method with a voxel level of p < 0.001 and a cluster level of p < 0.05. Next, we conducted partial correlation analyses to evaluate associations among within- and between-network FC, lipid profiles, and cognitive performance, with age, sex, education and FD as covariates. Canonical correlation analysis (CCA) was used to merge the association between seven altered between-network FCs and four lipid metabolism parameters to create lipid metabolism scores and FC scores. Finally, mediation analysis was performed using the PROCESS SPSS macro toolbox to determine if lipid metabolism affected cognition through between-network FC in type 2 diabetes. The 95% bias-corrected confidence intervals (CI) of the indirect effect were estimated on the basis of 5000 bootstrap samples.
Results
Demographic, clinical, and cognitive characteristics
In total, 102 patients with type 2 diabetes and 45 non-diabetes controls were included in this study. Details of the study inclusion and exclusion process are shown in the Figure 1. The three groups have no significant differences in age, sex, education, mean FD, and smoking and alcohol habits (Table 1). The diabetic patients had higher BMI, WHR, HbA1c, fasting and 2-h postprandial plasma glucose than controls. Meanwhile, the diabetic patients had lower 2-h postprandial C-peptide and HDL-C levels than healthy controls. The T2MCI patients had worse performance in cognitive assessments than the control group and T2noMCI group, not only in global cognition but also in different cognitive domains. There were no other significant differences in the other factors among the three groups.
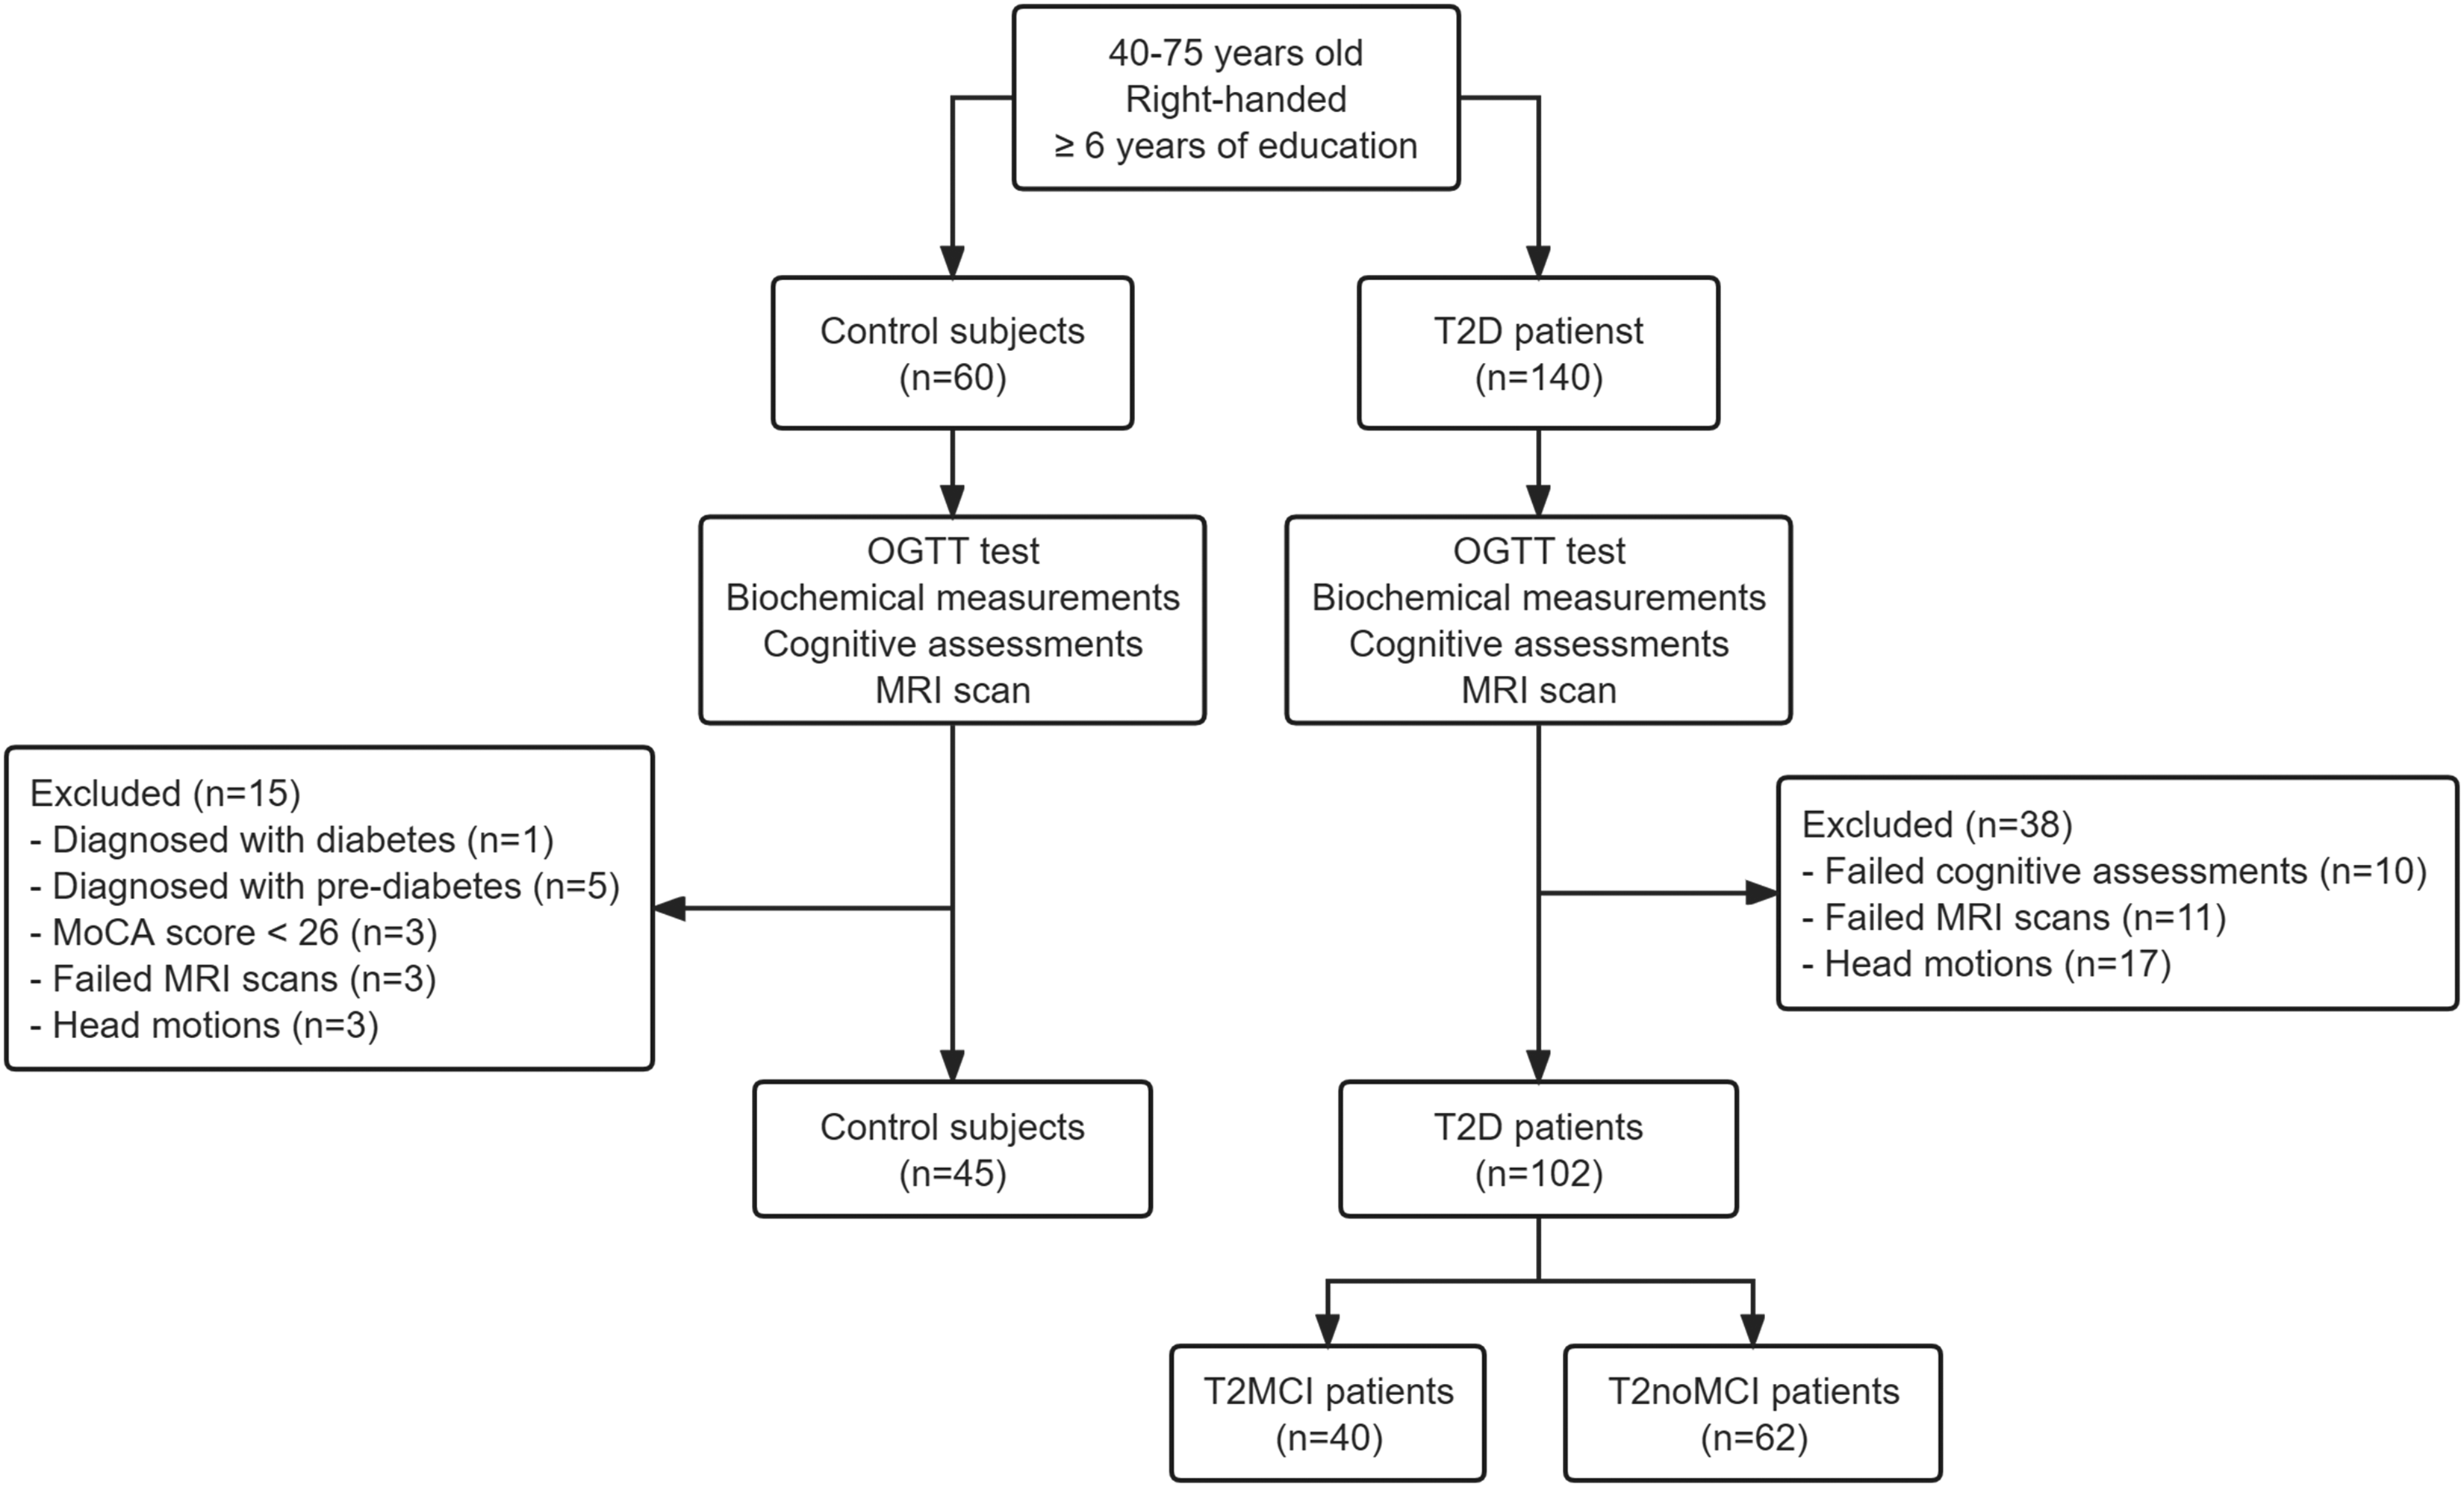
Flowchart from the initial screening to the final analysis. T2D: type 2 diabetes; OGTT: oral glucose tolerance test; MoCA: Montreal cognitive assessment.
Demographics and clinical characteristics of each group.
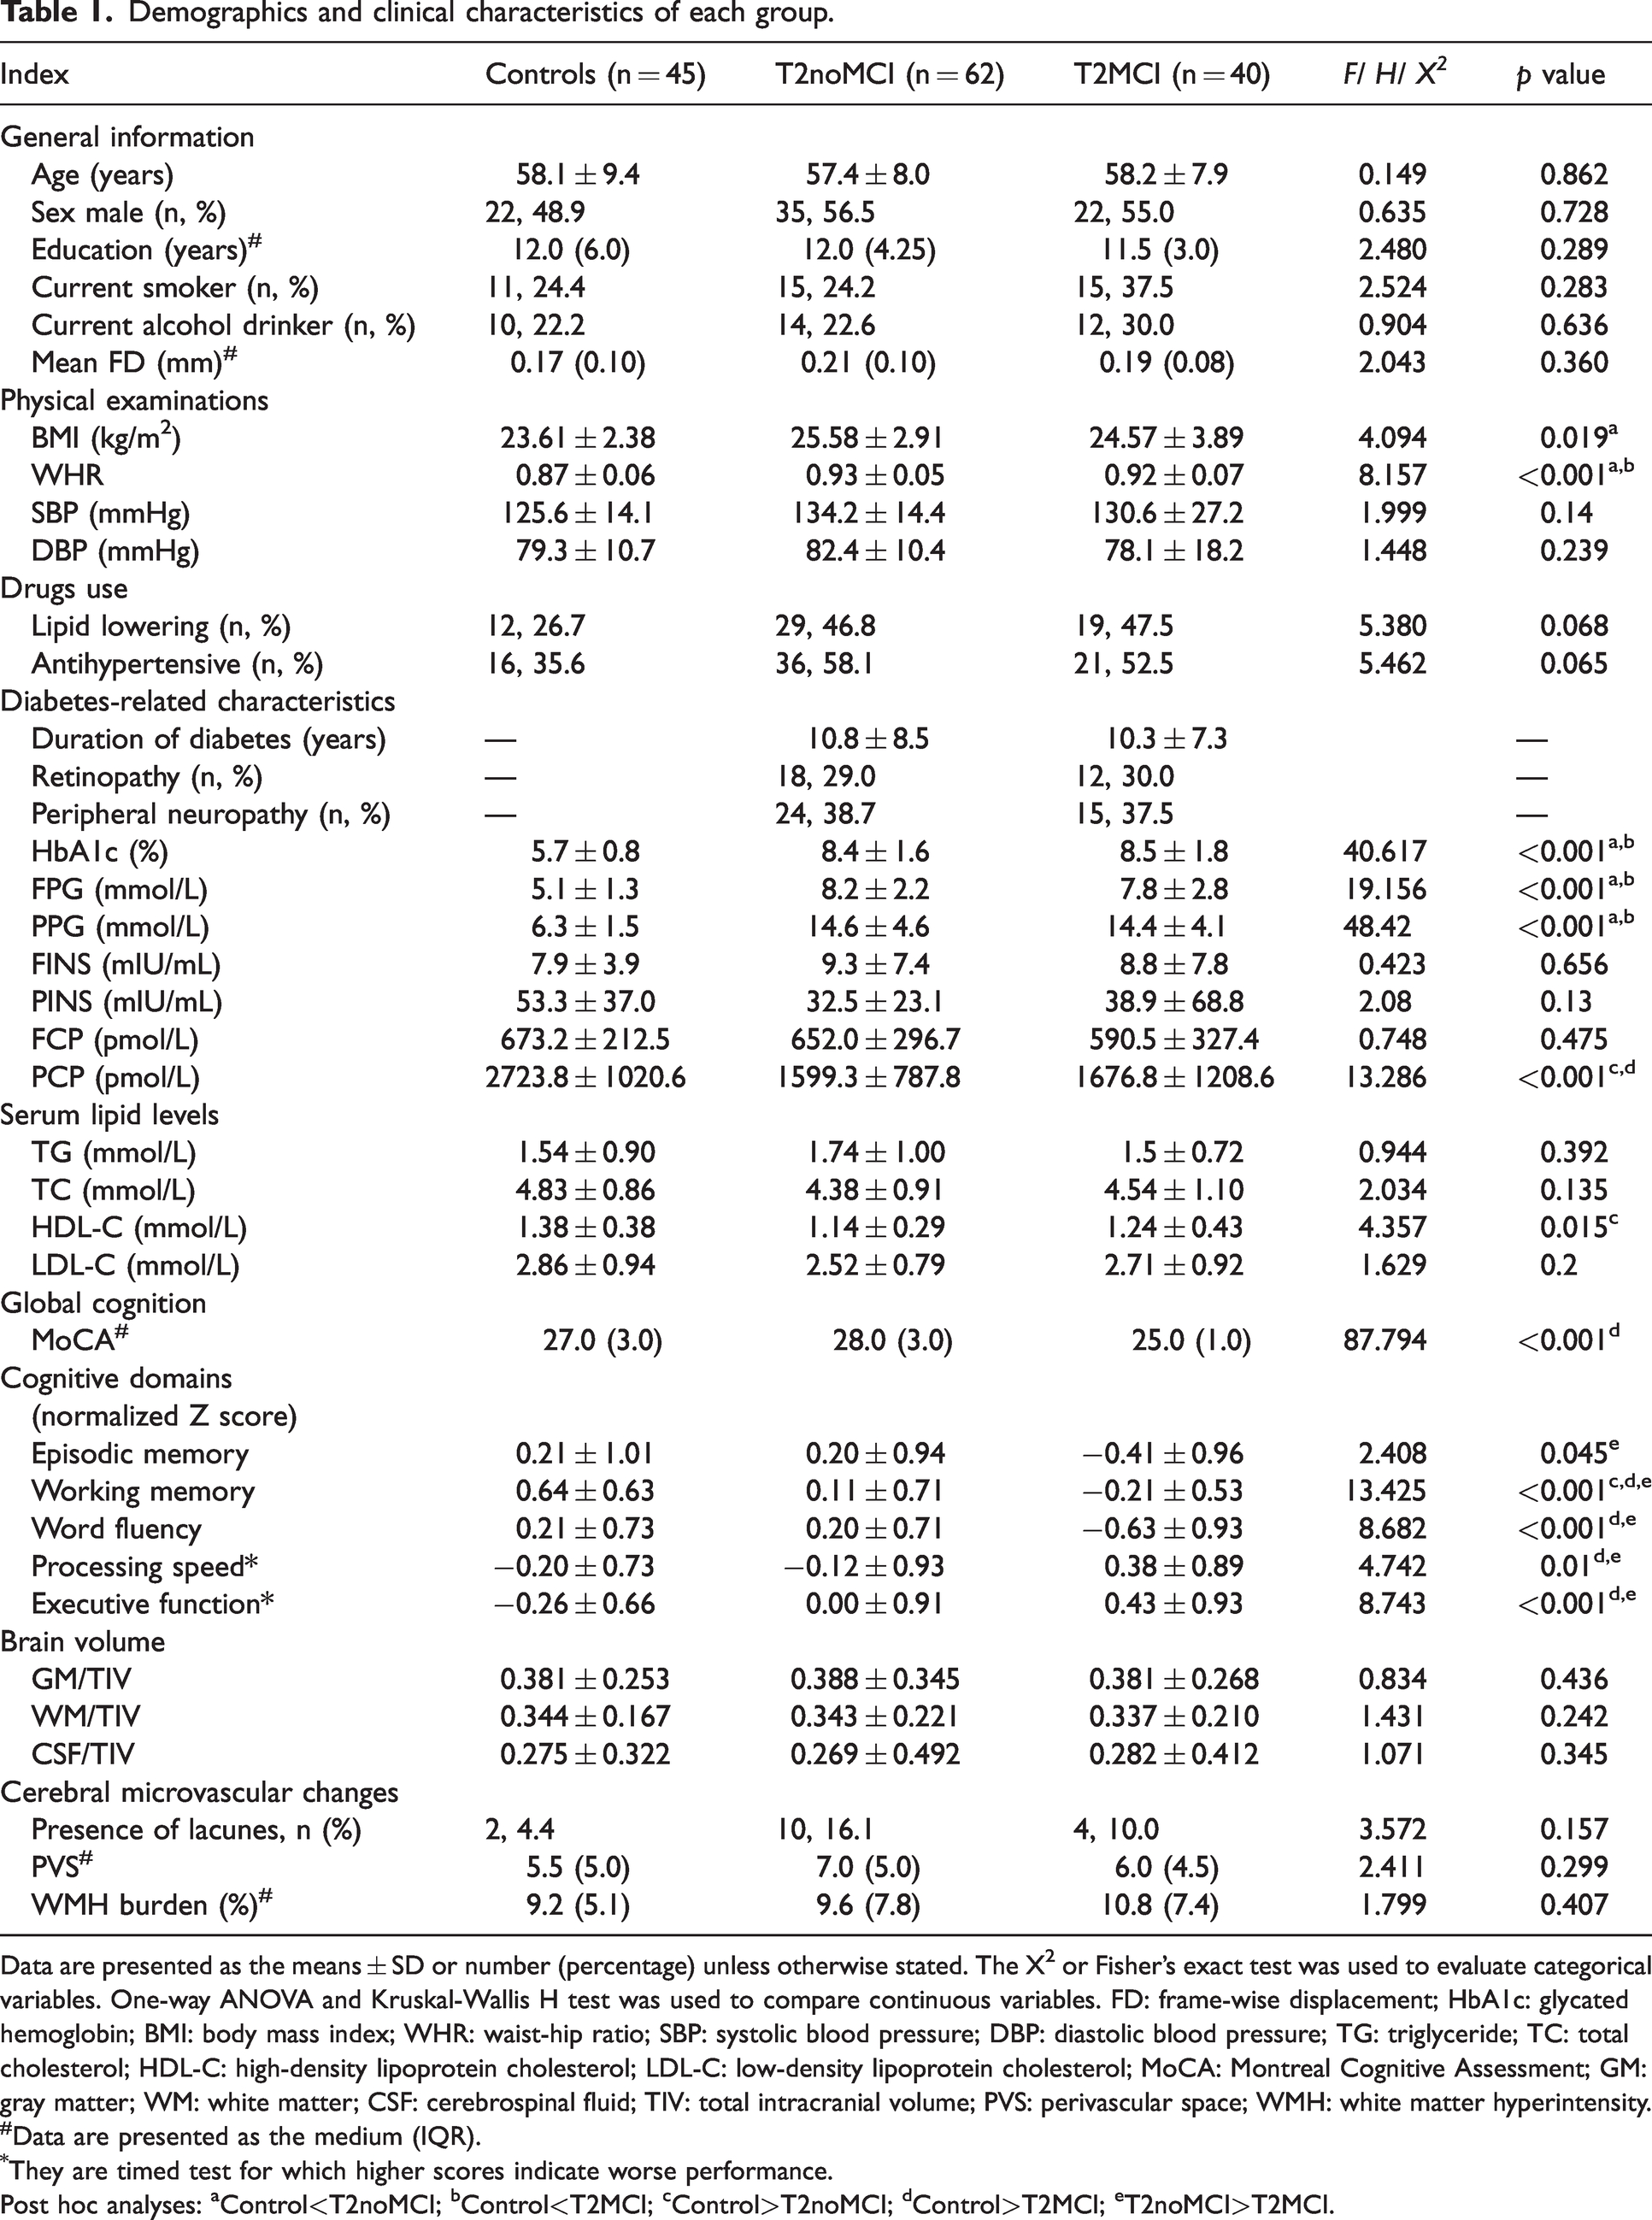
Data are presented as the means ± SD or number (percentage) unless otherwise stated. The X2 or Fisher’s exact test was used to evaluate categorical variables. One-way ANOVA and Kruskal-Wallis H test was used to compare continuous variables. FD: frame-wise displacement; HbA1c: glycated hemoglobin; BMI: body mass index; WHR: waist-hip ratio; SBP: systolic blood pressure; DBP: diastolic blood pressure; TG: triglyceride; TC: total cholesterol; HDL-C: high-density lipoprotein cholesterol; LDL-C: low-density lipoprotein cholesterol; MoCA: Montreal Cognitive Assessment; GM: gray matter; WM: white matter; CSF: cerebrospinal fluid; TIV: total intracranial volume; PVS: perivascular space; WMH: white matter hyperintensity.
Data are presented as the medium (IQR).
They are timed test for which higher scores indicate worse performance.
Post hoc analyses: aControl<T2noMCI; bControl<T2MCI; cControl>T2noMCI; dControl>T2MCI; eT2noMCI>T2MCI.
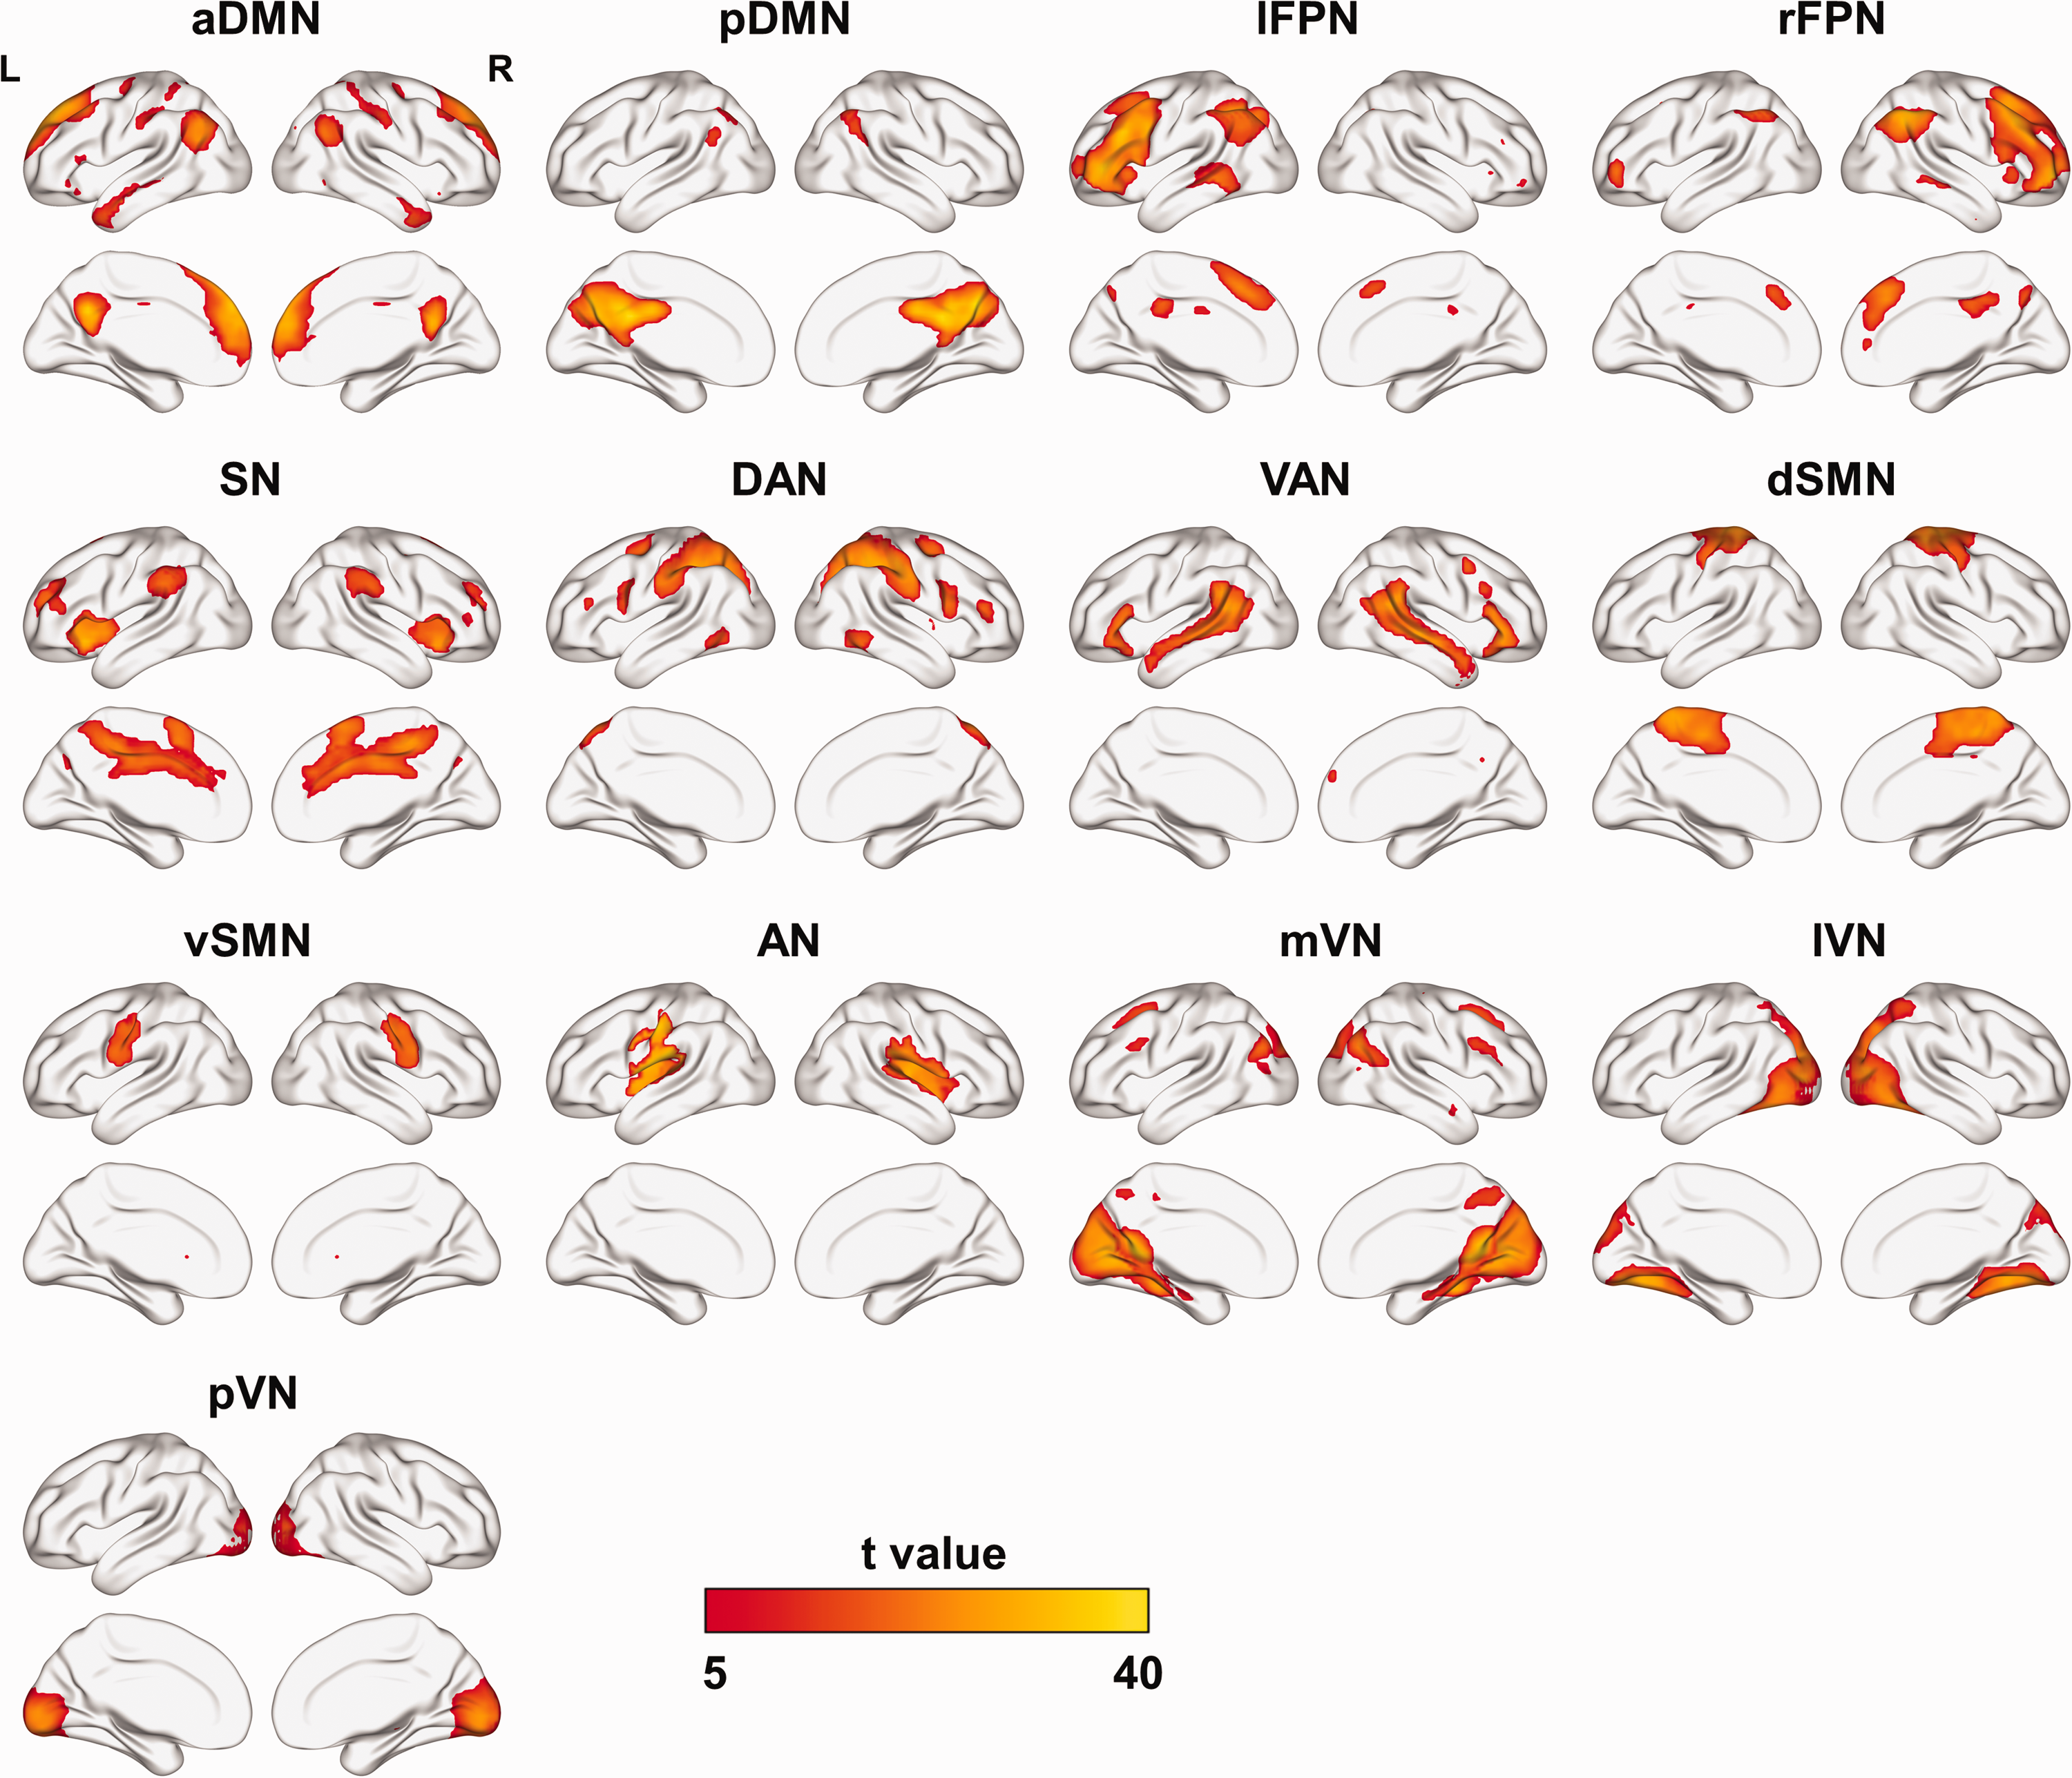
Spatial maps of thirteen functional networks. aDMN: anterior default mode network; pDMN: posterior default mode network; lFPN: left frontoparietal network; rFPN: right frontoparietal network; SN: salience network; DAN: dorsal attention network; VAN: ventral attention network; dSMN: dorsal sensorimotor network; vSMN: ventral sensorimotor network; AN: auditory network; mVN: medial visual network; lVN: lateral visual network; pVN: posterior visual network.
Brain volume and cerebral microvascular changes
There were no statistical differences in the volume of GM, WM, or CSF among the groups (Table 1). The WM/TIV ratio was associated with performance in multiple cognitive domains (processing speed: r = −0.209, p = 0.004; word fluency: r = 0.204, p = 0.046; executive function: r = −0.303, p = 0.003) and diabetes-related metabolic parameters in diabetic patients (HbA1c: r = −0.264, p = 0.009; postprandial plasma glucose: r = −0.244, p = 0.02; fasting C-peptide: r = 0.229, p = 0.028; postprandial C-peptide: r = 0.272, p = 0.009). However, there was no significant correlation between brain volume and serum lipid levels (p > 0.05). And through mediation analysis, we only found that WM/TIV ratio mediates the relationship between HbA1c and processing speed (β = 0.0373, 95% CI: 0.0035, 0.0832) and executive function (β = 0.0349, 95% CI: 0.0046, 0.0714). Details can be found in Supplementary Table S1 and Figure S1. As for cerebral microvascular changes, we found that there were no statistical differences in the presence of lacunes, count of PVS, or WMH burden among the groups (Table 1). For the correlation of cerebral microvascular changes with cognition, serum lipids, and diabetes-related characteristics, we only found that WMH burden was positively correlated with HbA1c (r = 0.228, p = 0.045) and negatively correlated with fasting insulin (r = −0.277, p = 0.02).
Between-network FC
Figure 3(a) shows the average between-network FC matrix of all participants. Overall, the healthy control group had a stronger FC pattern, while FC in diabetic patients was slightly weaker, especially in T2MCI group (Supplementary Figure S2). As shown in Figure 3(b), strong group differences were found from MANCOVA after FDR correction: FC between the DAN and vSMN (F = 7.53, p = 0.001), and between the vSMN and lVN (F = 10.46, p < 0.001). In addition, eleven FCs showed significant differences between groups but did not survive multiple comparisons correction. T2MCI patients showed significantly weaker between-network FC strengths than healthy controls as follows: aDMN-pDMN (p = 0.004); dSMN-vSMN (p = 0.004); aDMN-mVN (p = 0.002); pDMN-lFPN (p = 0.005); DAN-vSMN (p < 0.001); vSMN-lVN (p < 0.001); vSMN-pVN (p = 0.002); and AN-lVN (p = 0.003). All above FCs passed FDR correction. Meanwhile, some FCs were reduced in the T2MCI groups and T2noMCI group compared with the control group, as well as T2MCI group versus T2noMCI group, however, these differences did not achieve significance after correction.
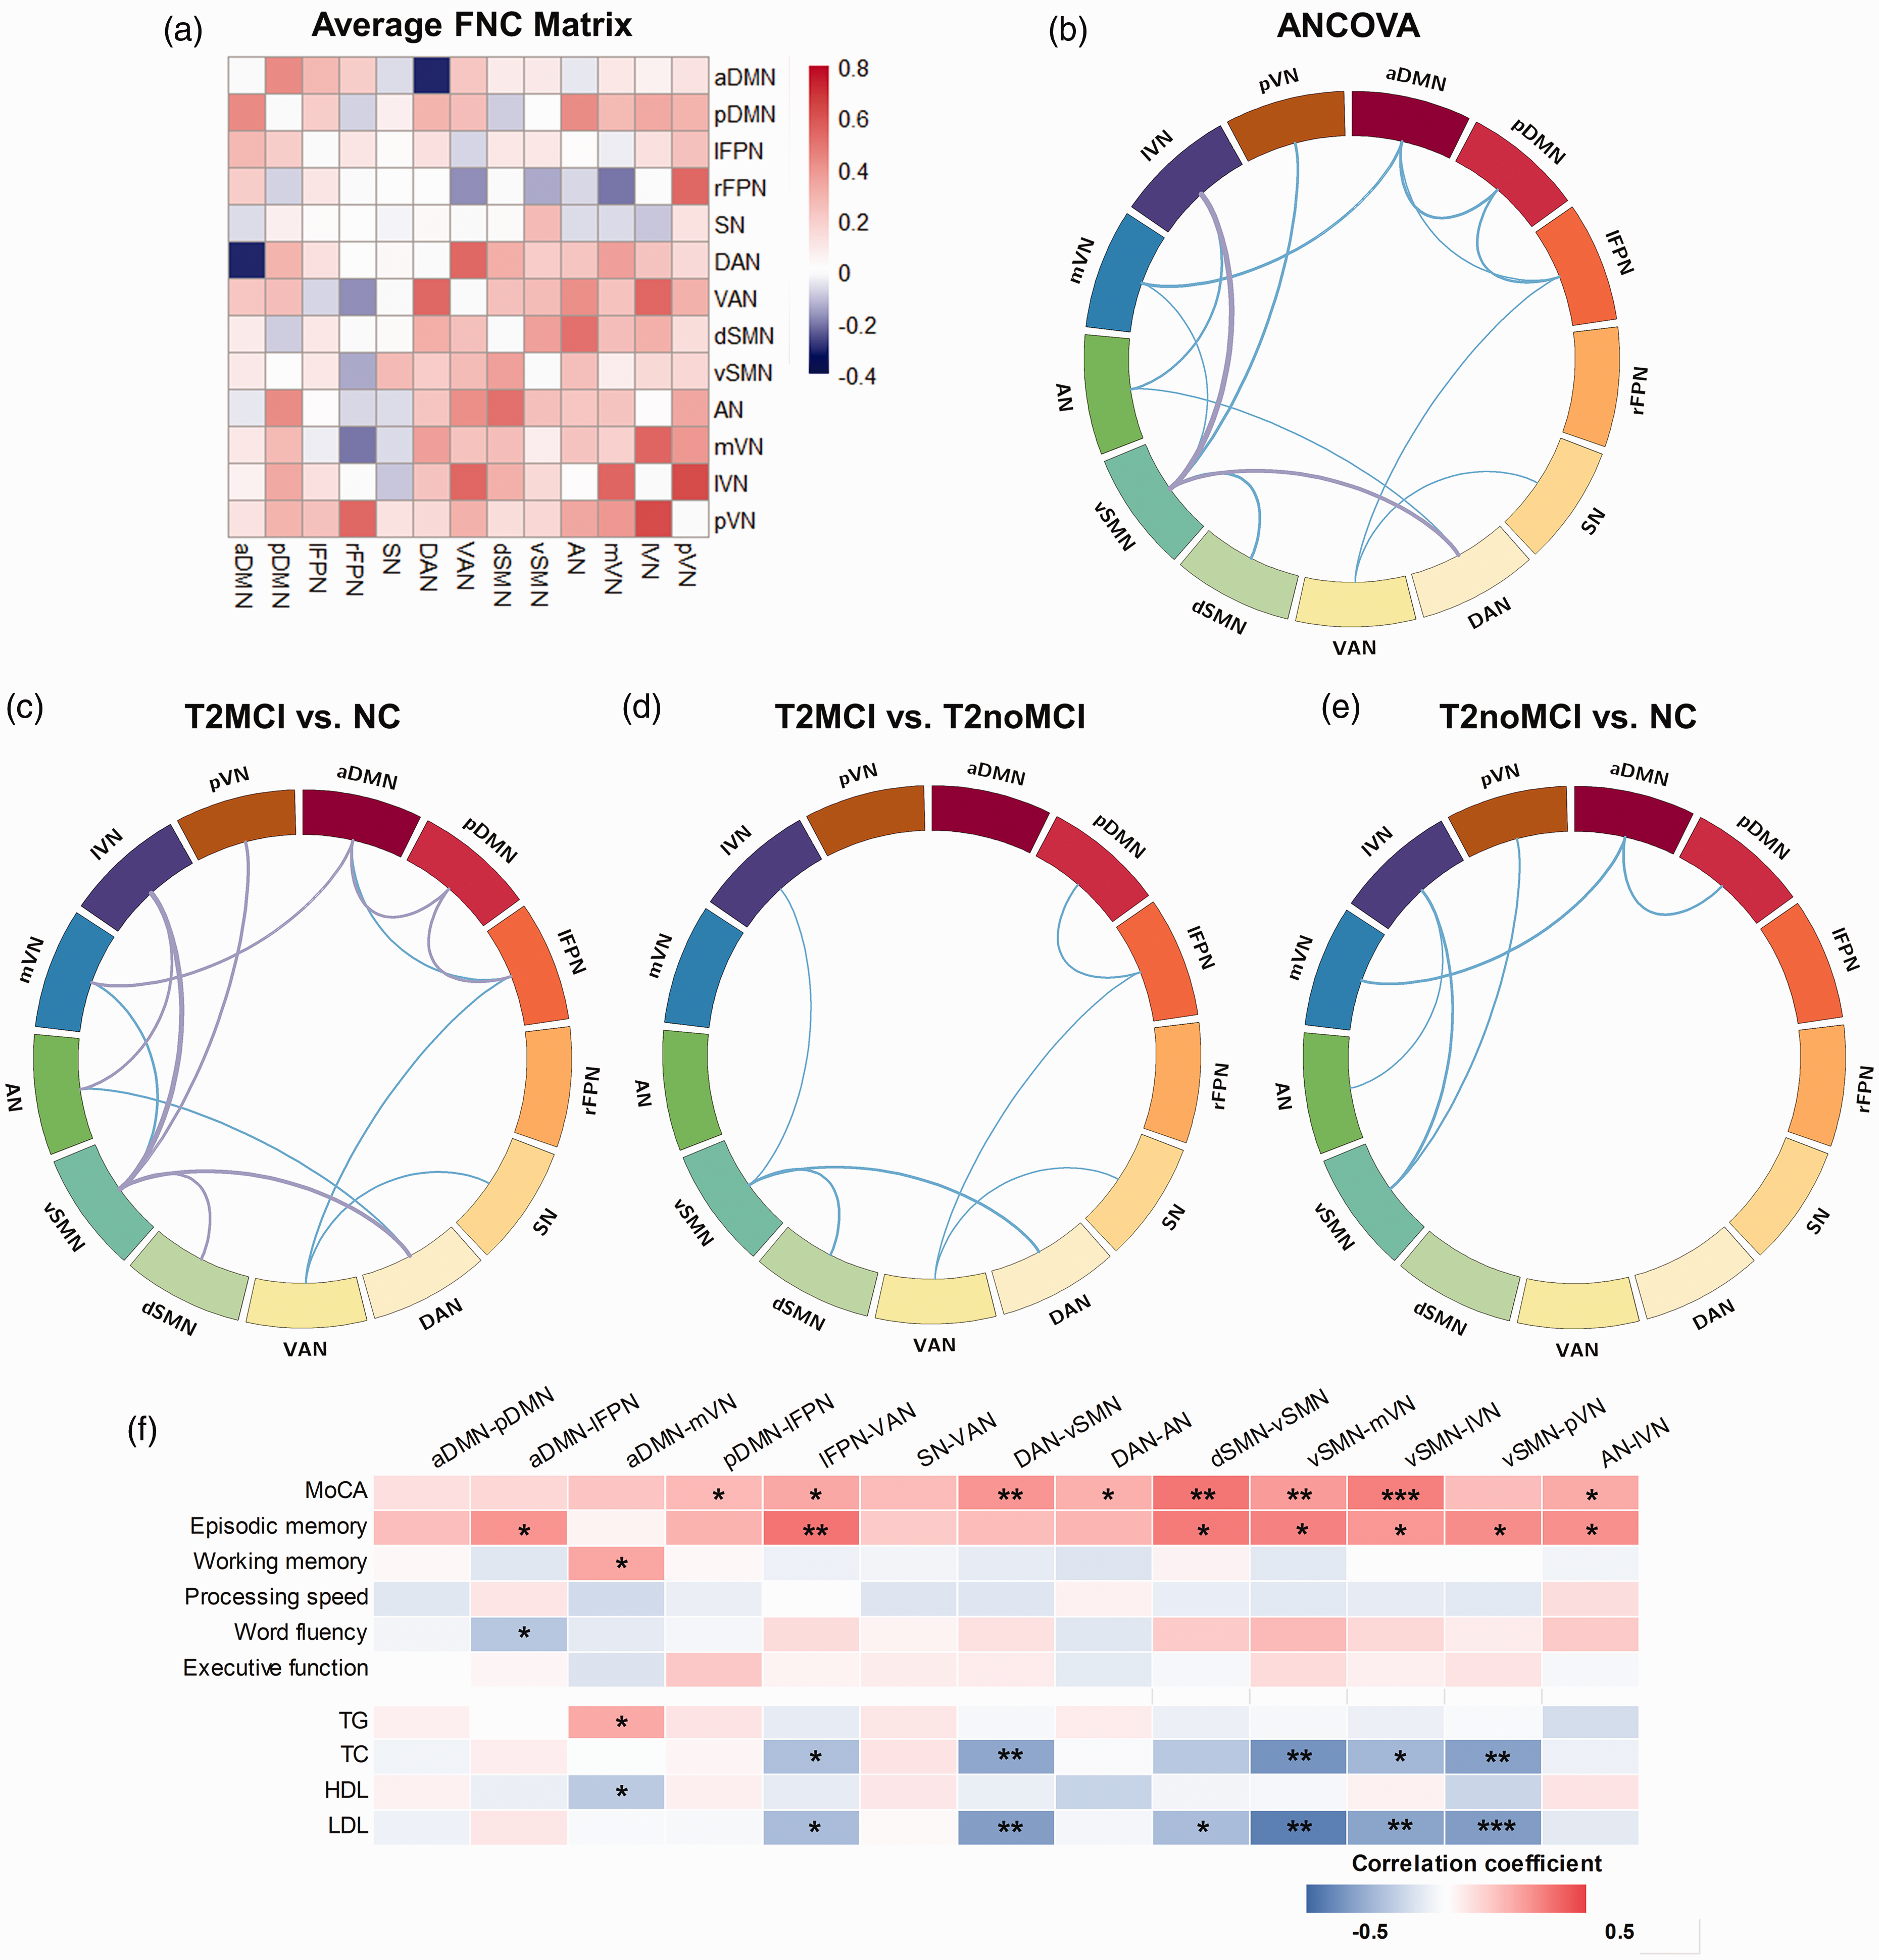
(a) Average between-network FC matrix. Hot colors represent positive FC, while cool colors represent negative FC. (b-e) Comparison of between-network FC among groups. Line thickness represents the size of the statistic value (F value or t value), with hot and cool colors representing enhanced and reduced FC respectively. Purple indicates survival after FDR correction. (f) Partial correlation heatmap among between-network FCs, cognitive assessments and lipid profiles in patients with type 2 diabetes, with age, sex, education and head motions as covariates. FC: functional connectivity; aDMN: anterior default mode network; pDMN: posterior default mode network; lFPN: left frontoparietal network; rFPN: right frontoparietal network; SN: salience network; DAN: dorsal attention network; VAN: ventral attention network; dSMN: dorsal sensorimotor network; vSMN: ventral sensorimotor network; AN: auditory network; mVN: medial visual network; lVN: lateral visual network; pVN: posterior visual network; MoCA: Montreal Cognitive Assessment; TG: triglyceride; TC: total cholesterol; HDL: high-density lipoprotein; LDL: low-density lipoprotein.
Within-network FC
Voxel-wise within-network FC analyses demonstrated significant group differences in the left posterior cingulate cortex (PCC) of the aDMN, right middle occipital gyrus (MOG) of the DAN, and right superior parietal lobe (SPL) of the lVN (Table 2 and Figure 4). Each of these within-network FC alterations was positively correlated with MoCA scores (L-PCC: r = 0.368, p < 0.001; R-MOG: r = 0.315, p = 0.002; R-SPL: r = 0.335, p = 0.001) in patients with type 2 diabetes (Figure 4(c)). However, significant partial correlation results were not found between any individual cognitive domains and within-network FC (all p > 0.05). As for lipid profiles, there were no significant correlations between within-network FC and lipid metabolism parameters (all p > 0.05).
Within-network FC differences among the groups.
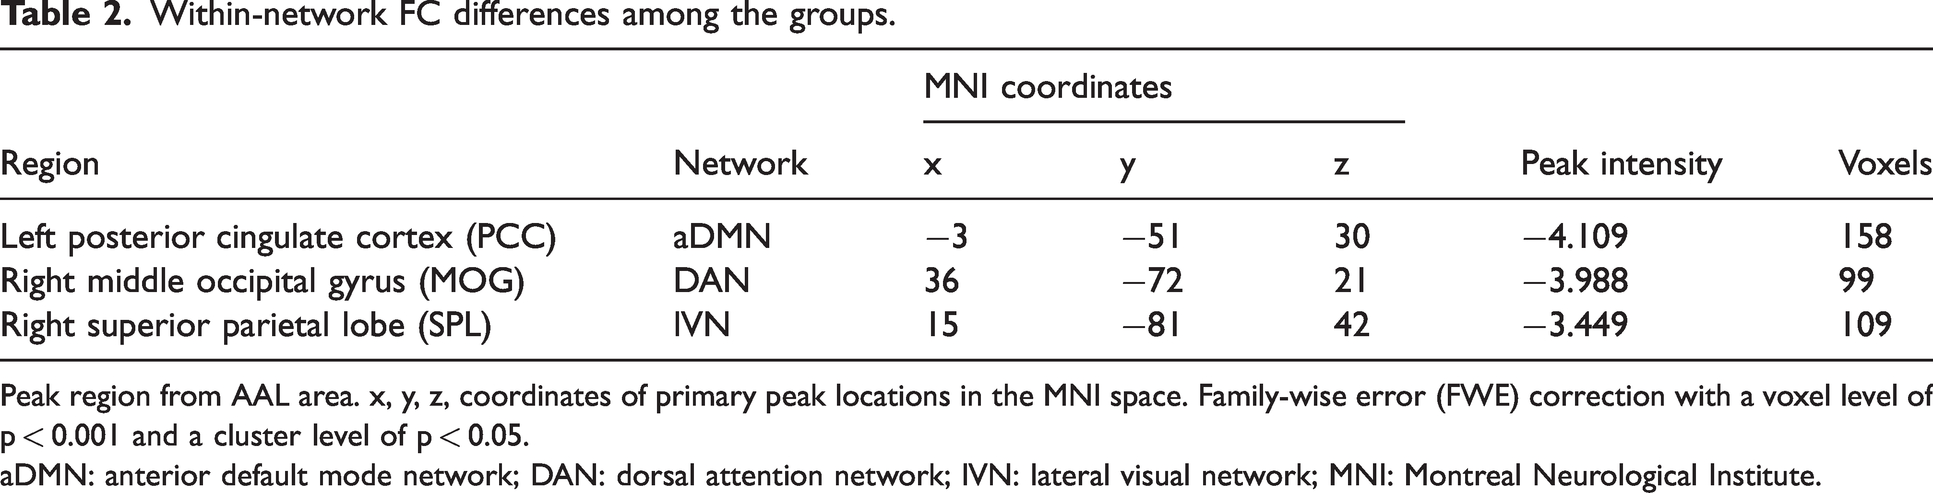
Peak region from AAL area. x, y, z, coordinates of primary peak locations in the MNI space. Family-wise error (FWE) correction with a voxel level of p < 0.001 and a cluster level of p < 0.05.
aDMN: anterior default mode network; DAN: dorsal attention network; lVN: lateral visual network; MNI: Montreal Neurological Institute.
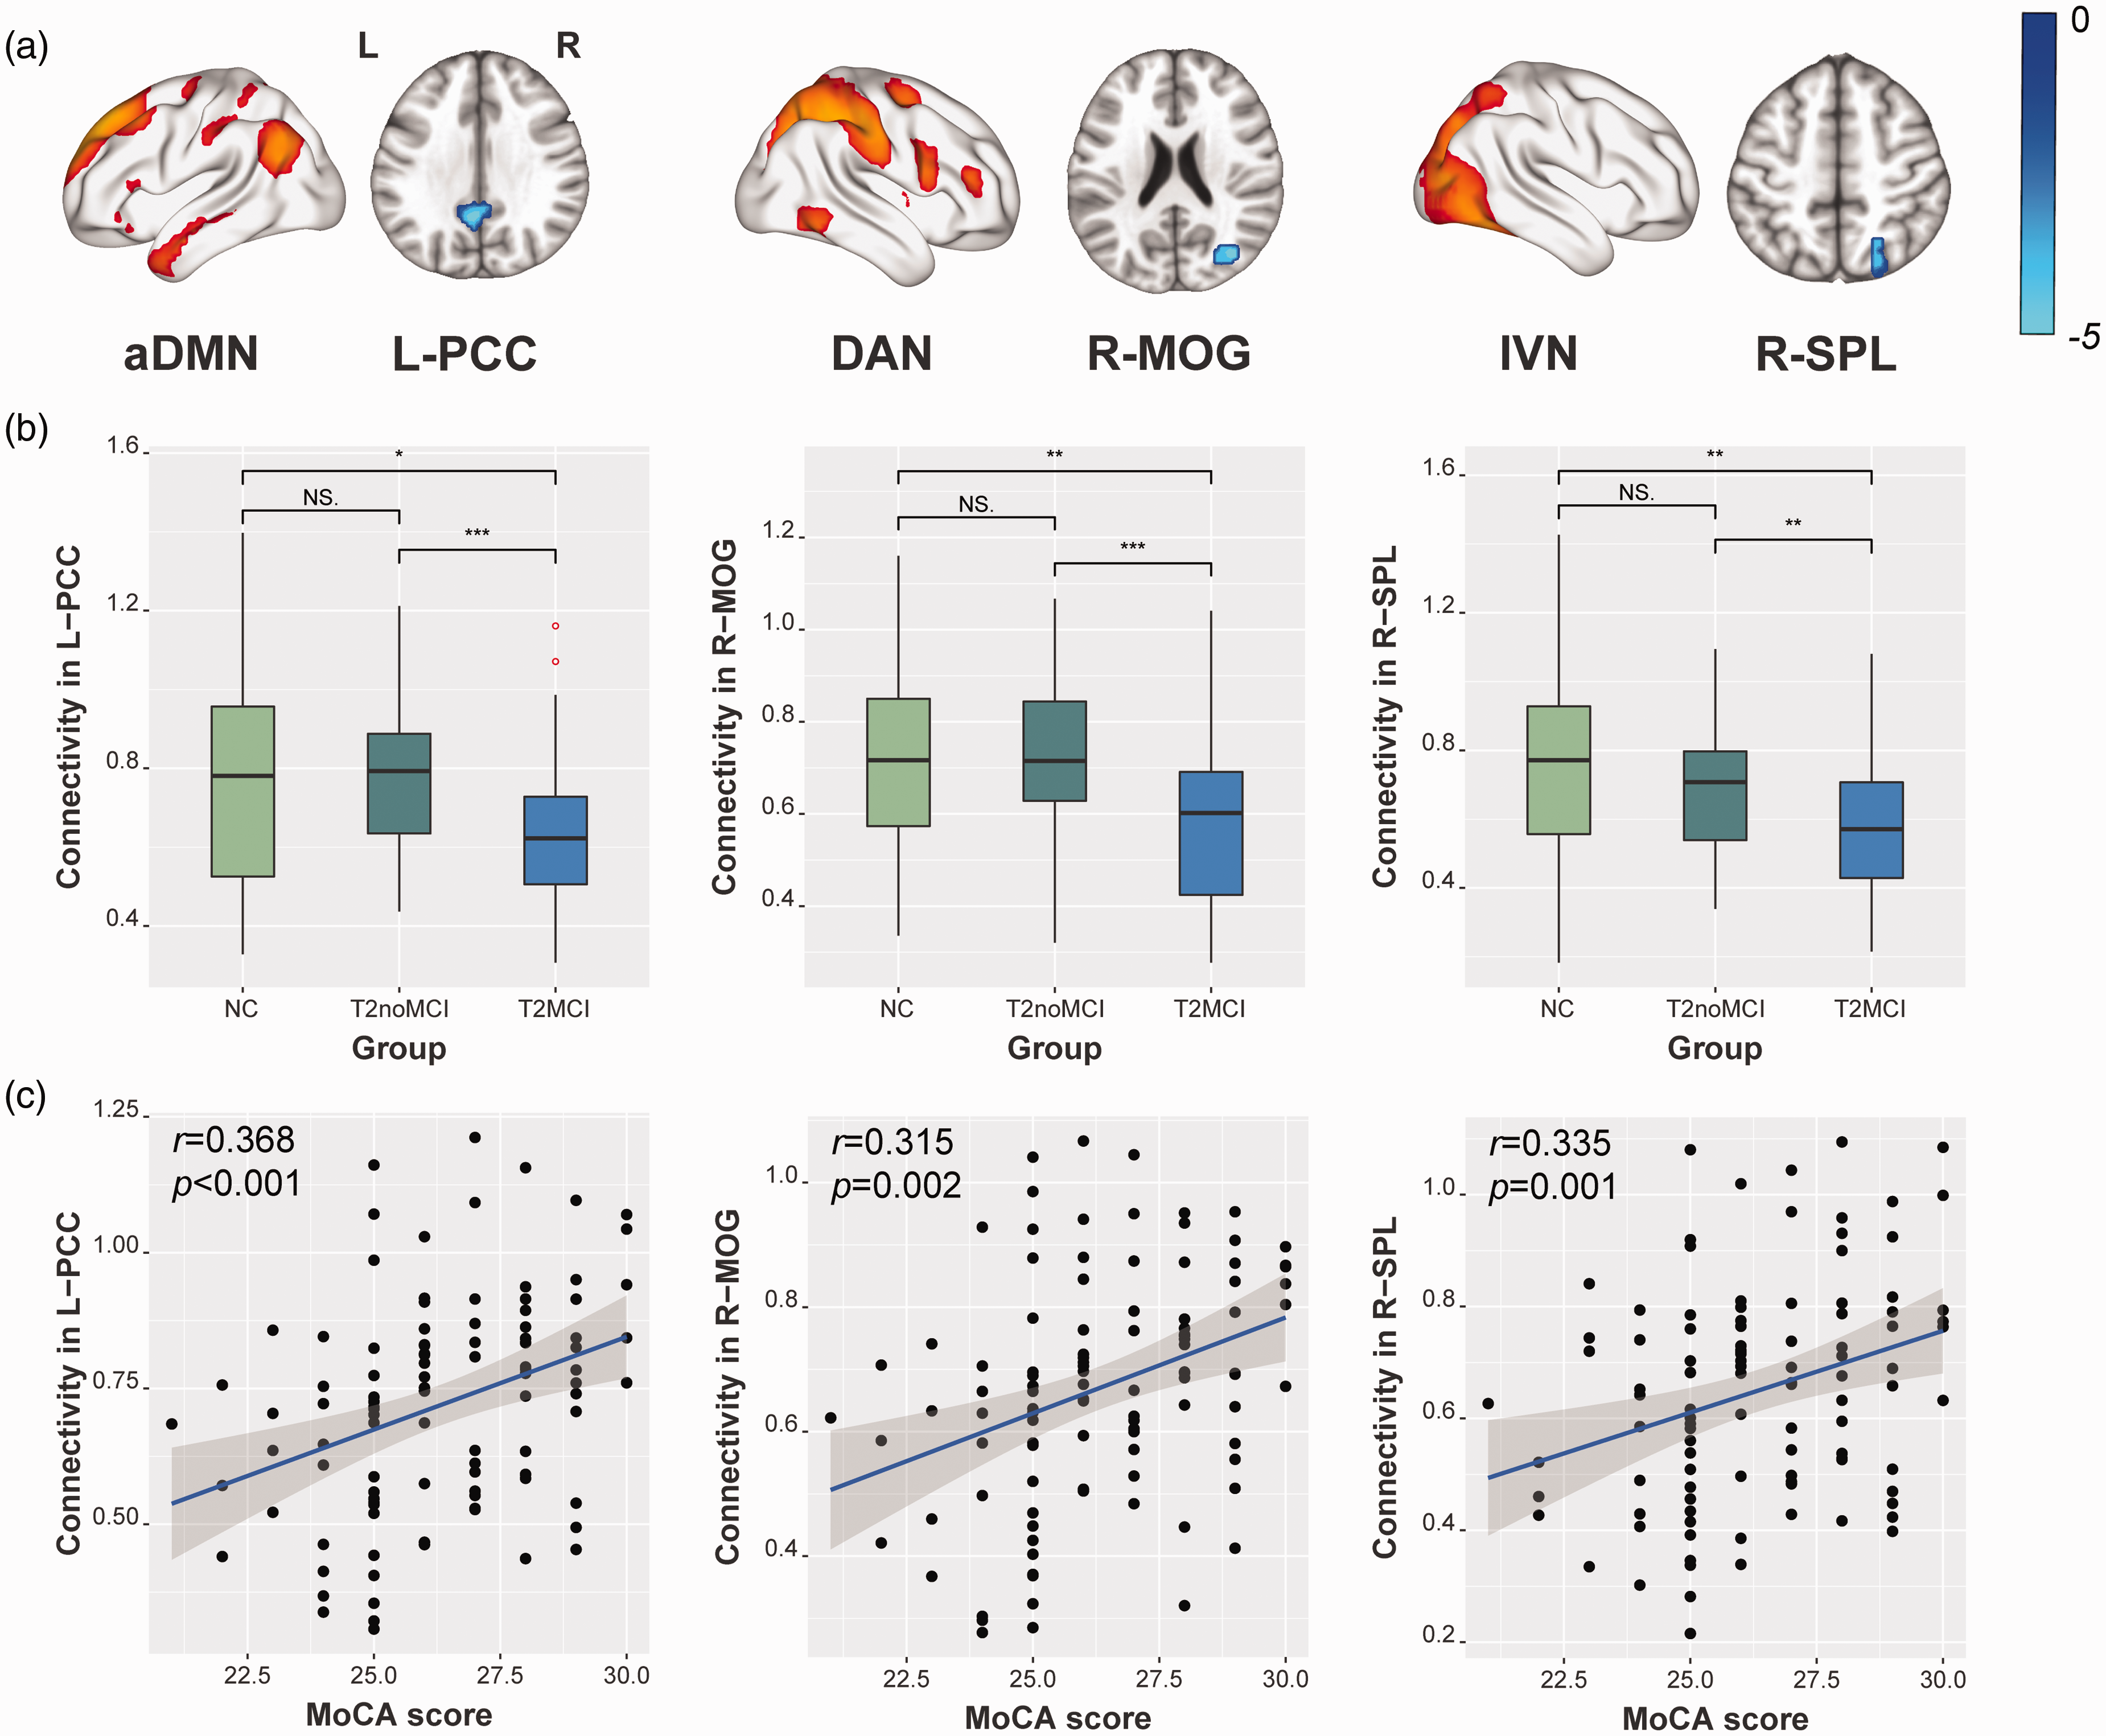
(a) Within-network FC alterations among the three groups. (b) Boxplot shows group comparisons in within-network FCs, significance threshold correction was performed based on FWE method with a voxel level of p < 0.001 and a cluster level of p < 0.05. (c) Scatter Plot shows partial correlations between the specific within-network FC alteration with MoCA scores in type 2 diabetes, with age, sex, education and head motions as covariates. aDMN: anterior default mode network; DAN: dorsal attention network; lVN: lateral visual network; PCC: post cingulate gyrus; MOG: middle occipital gyrus; SPL: superior parietal lobe; MoCA: Montreal Cognitive Assessment.
Associations among lipid metabolism, between-network FC, and cognition
Partial correlation analyses revealed significant positive correlations between cognitive assessment scores and between-network FCs in type 2 diabetes patients (Figure 3(f)). Specifically, MoCA score were positively correlated with between-network FCs: pDMN-lFPN (r = 0.205, p = 0.042), lFPN-VAN (r = 0.250, p = 0.012), DAN-vSMN (r = 0.297, p = 0.003), DAN-AN (r = 0.230, p = 0.022), dSMN-vSMN (r = 0.369, p < 0.001), vSMN-mVN (r = 0.283, p = 0.005), vSMN-lVN (r = 0.348, p < 0.001), and AN-lVN (r = 0.246, p = 0.014). As for individual cognitive domains, episodic memory was positively correlated with seven between-network FCs: aDMN-lFPN (r = 0.304, p = 0.038), lFPN-VAN (r = 0.373, p = 0.01), dSMN-vSMN (r = 0.359, p = 0.013), vSMN-mVN (r = 0.342, p = 0.019), vSMN-lVN (r = 0.295, p = 0.044), vSMN-pVN (r = 0.318, p = 0.029), and AN-lVN (r = 0.311, p = 0.033). Working memory was positively correlated with FC between the aDMN and mVN (r = 0.256, p = 0.011). Details can be found in Supplementary Table S2.
In terms of biochemical variables, we found that lipid profile parameters were highly correlated with between-network FCs in the diabetic patients ((Figure 3(f)). Specifically, serum TC levels were negatively correlated with five FCs: lFPN-VAN (r = −0.228, p = 0.026), DAN-vSMN (r = −0.306, p = 0.003), vSMN-mVN (r = 0.367, p < 0.001), vSMN-lVN (r = −0.255, p = 0.013), and vSMN-pVN (r = −0.324, p = 0.001). Likewise, LDL-C levels were negatively correlated with six FCs: lFPN-VAN (r = −0.240, p = 0.019), DAN-vSMN (r = −0.337, p = 0.001), dSMN-vSMN (r = −0.238, p = 0.02), vSMN-mVN (r = −0.428, p < 0.001), vSMN-lVN (r = −0.317, p = 0.002), and vSMN-pVN (r = −0.342, p = 0.001). HDL-C level was negatively correlated with FC between the aDMN and mVN (r = −0.214, p = 0.043). Serum TG level was positively correlated with FC between the aDMN and mVN (r = 0.247, p = 0.016). Details can be found in Supplementary Table S2.
Canonical correlation analysis and mediation analysis
A total of seven between-network FCs were combined with the levels of four lipid metabolism parameters for an integrated analysis. We performed CCA to investigate the correlation structure of the data. As shown in Figure 5(a), we found one pair of canonical correlation variables that revealed a clear correlation between lipid metabolism (X) and between-network FC (Y): the canonical correlation coefficient was 0.493 (F = 1.799, p = 0.009). Among the between-network FCs, connectivity between the vSMN and mVN was more important than others (Figure 5(b)); among the lipid metabolism parameters, LDL-C level was more important (Figure 5(c)). Then, we calculated between-network FC scores and lipid metabolism scores according to the nonnormalized canonical correlation coefficients. Details of the CCA can be seen in Supplementary Table S3. Furthermore, mediation analyses showed interesting and important results (Figure 5(d) and (e)). The relationship between lipid metabolism scores and MoCA scores was significantly mediated by between-network FC scores (β = −0.3136, 95% CI: −0.7660, −0.0186). The between-network FC scores also mediated the relationship between lipid metabolism scores and working memory (β = −0.5284, 95% CI: −1.0551, −0.1106).
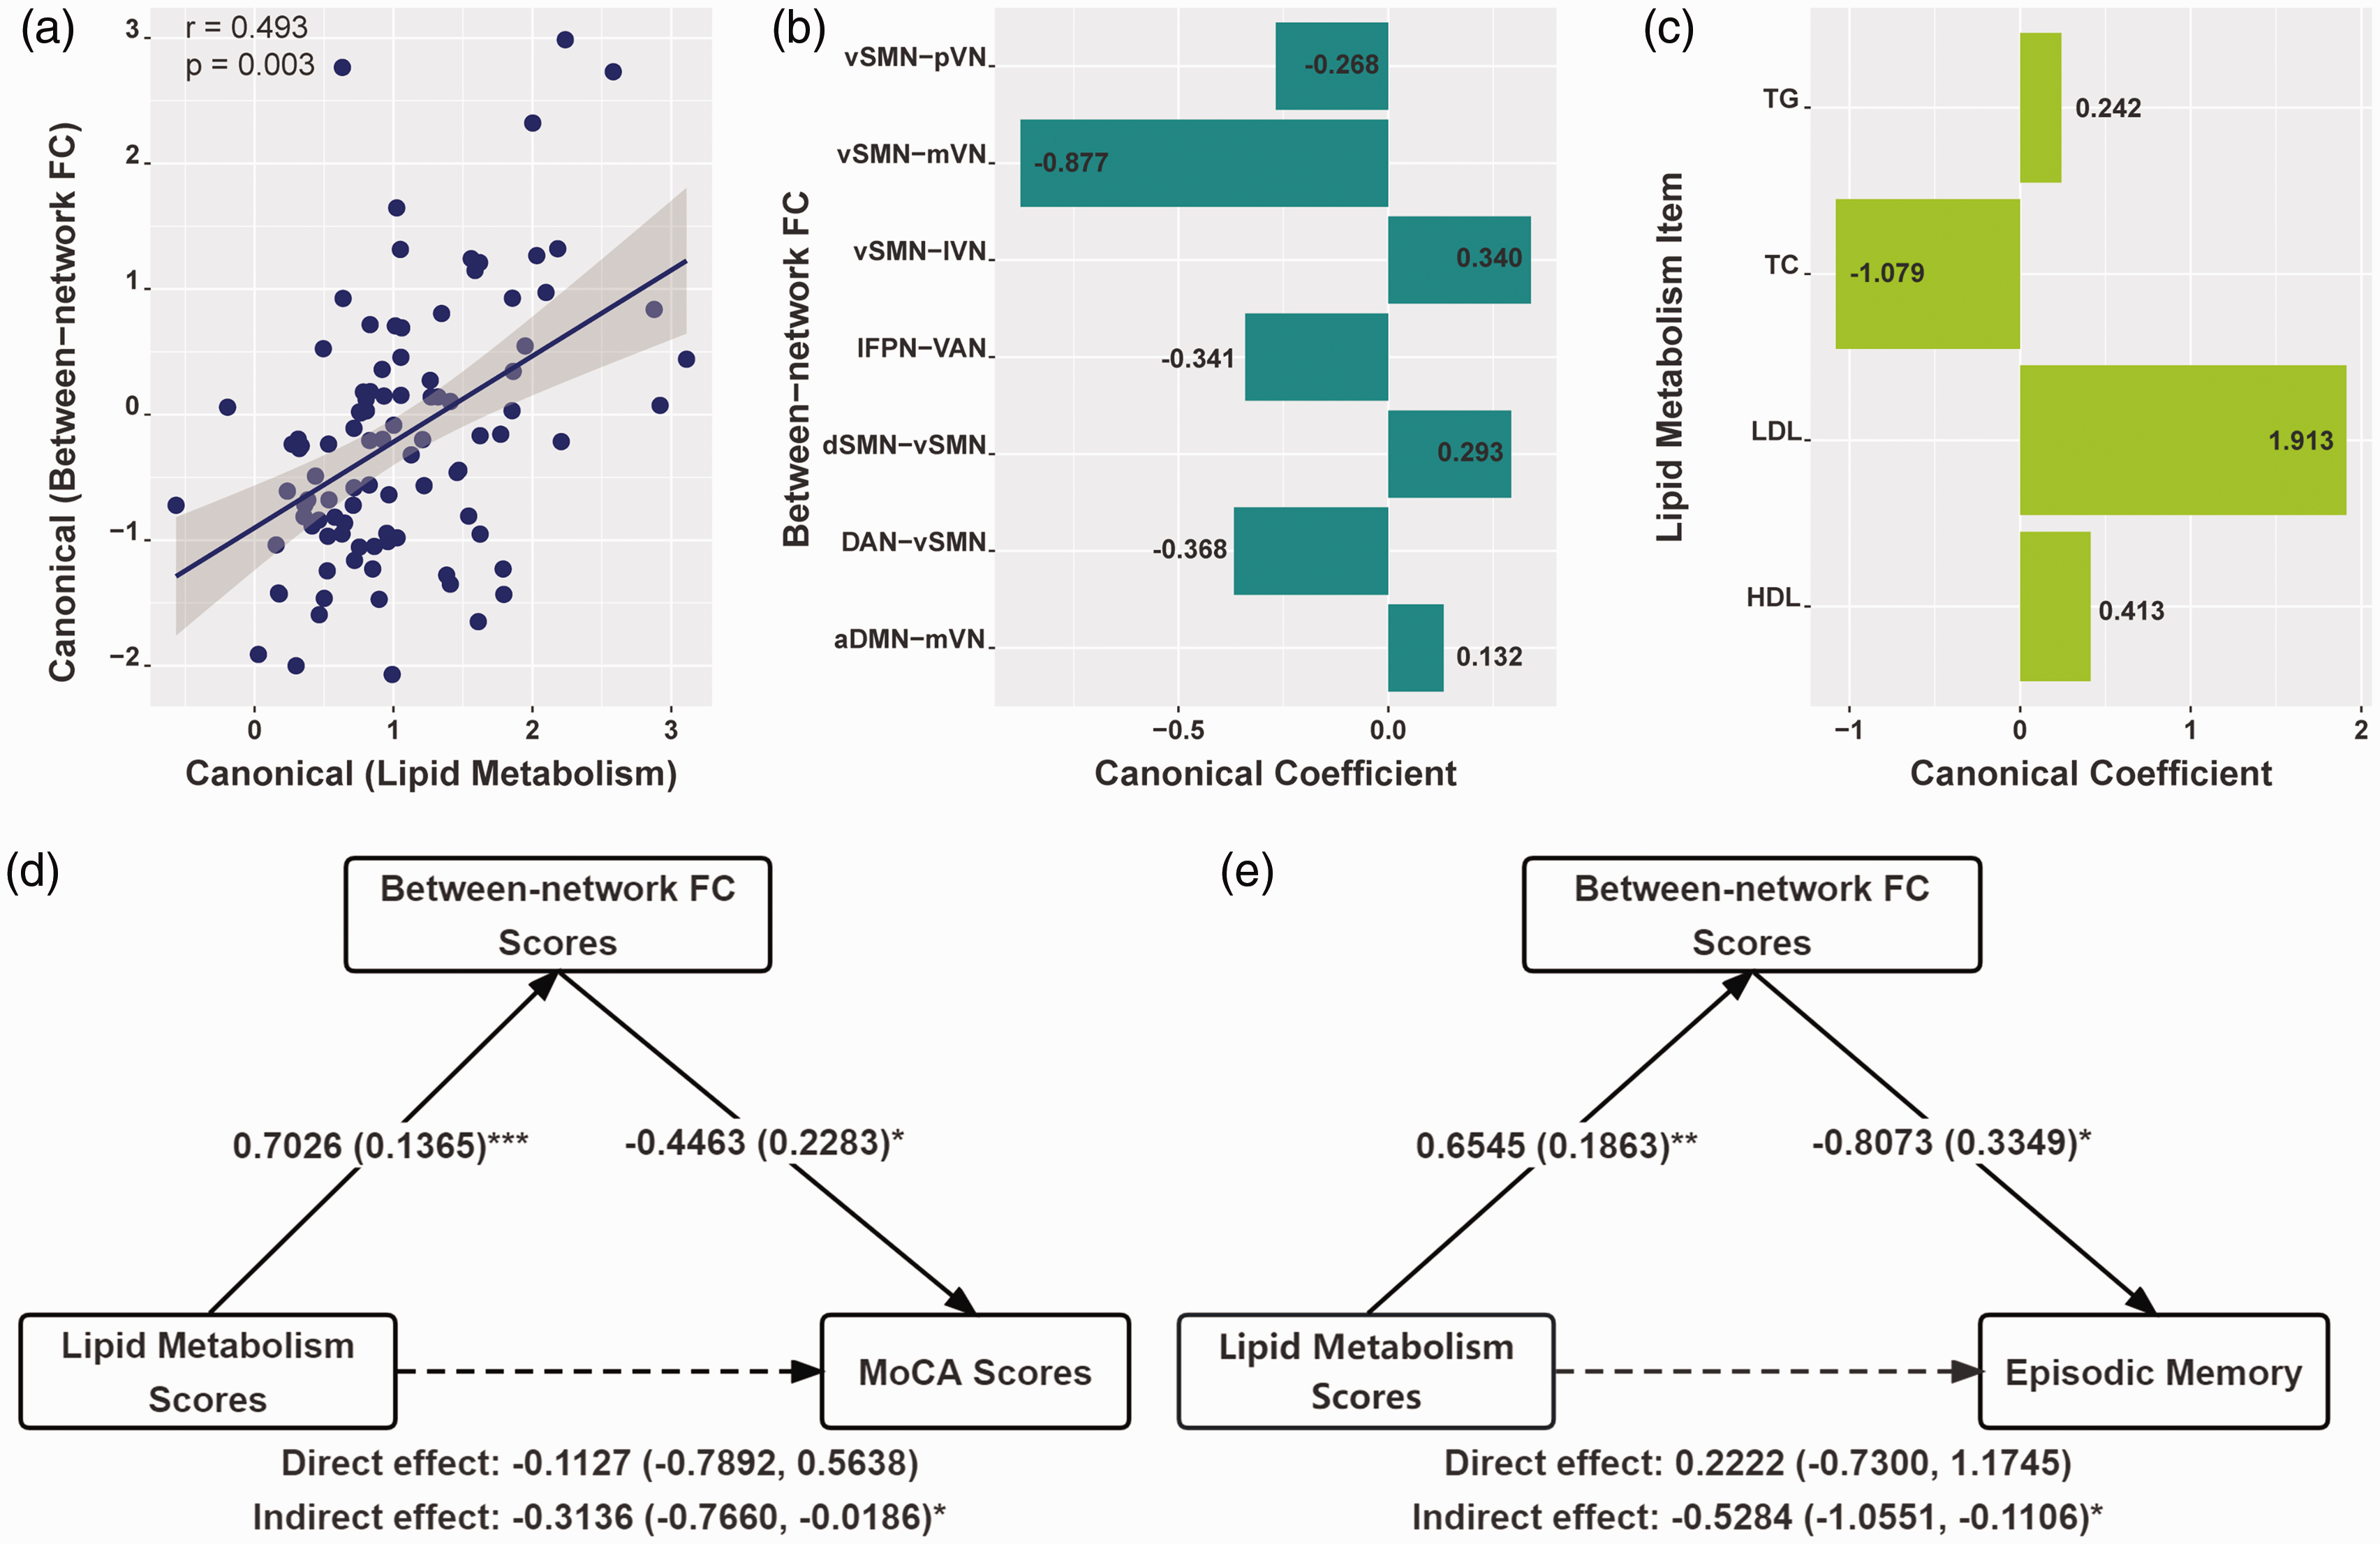
(a) Canonical correlation analysis to determine multivariate associations among seven between-network FCs and four lipid parameters. Scatter plot of canonical scores for the significant canonical correlation mode. (b) Canonical coefficients corresponding to the between-network FC. (c) Canonical coefficients corresponding to four lipid parameters. (d-e) Mediation analyses for the associations among between-network FC score, lipid metabolism score, and cognitive assessments in patients with type 2 diabetes. The standardized β-coefficient was derived from mediation models controlling for age, sex, and education. Values are standardized path coefficients with standard errors or 95% CIs in parentheses. *p < 0.05, ** p < 0.01, and *** p < 0.001 was considered significant. aDMN: anterior default mode network; lFPN: left frontoparietal network; DAN: dorsal attention network; VAN: ventral attention network; dSMN: dorsal sensorimotor network; vSMN: ventral sensorimotor network; mVN: medial visual network; lVN: lateral visual network; pVN: posterior visual network; TG: triglyceride; TC: total cholesterol; HDL: high-density lipoprotein; LDL: low-density lipoprotein; MoCA: Montreal Cognitive Assessment.
Discussion
This study provided new perspectives by investigating the relationships among lipid profile, large-scale functional network connectivity and cognition in patients with type 2 diabetes. We found that FCs between the sensorimotor, visual, and attention networks and within the default mode, attention, and visual networks changed significantly. The above changes strongly associated with global cognitive performance. Moreover, lipid profile parameters were correlated with some of the between-network FCs, which could serve as potential mediators of the associations between lipid metabolism and cognitive behaviors (especially global cognition and episodic memory).
The data-driven ICA approach can simultaneously extract different coherent resting networks and separate such effects from other instances of signal modulations. 30 Six studies have investigated functional brain network alterations in patients with type 2 diabetes using the ICA approach. Four of these studies focused only on the DMN and attention network, ignoring other functional networks.31 –34 The other two studies identified several networks but only focused on connectivity changes within networks.12,35 To our knowledge, our study was the first study to investigate the relationship between cognitive impairment and large-scale functional networks in type 2 diabetes in an unbiased and unselected fashion. We found reduced connectivity within the DMN and DAN, and the left PCC and right MOG are vulnerable areas to declined global cognition (Figure 4(a) and (b)). Although the brain regions are not exactly the same as previous seed-based research findings,12,31,32 although no significant results were found for individual cognitive domains, it still proved the association between within-network damage of DMN and cognitive decline in type 2 diabetes. Our conclusion is basically consistent with these prior studies, which is weaker FCs within these functional networks indicated reduced interplay of activated brain areas underlying cognitive functions.
The expansion of our study lies in the altered connectivity between networks. It has been confirmed that complex cognitive activities require coordination between distributed and large-scale networks of the brain. 36 We found widely disrupted FCs between the default mode (aDMN and pDMN), executive control (lFPN and DAN), and sensory cortex systems (dSMN, vSMN, AN, mVN, lVN, and pVN) in type 2 diabetes. The default mode system of the brain consists of the medial temporal, parietal, and prefrontal cortices, which are responsible for internally directed cognition.37,38 Among the main 13 pairs of between-network FC changes we found, 4 pairs had DMN involvement (approximately 1/3), and these FCs between the DMN and other networks were correlated with global cognition, episodic memory, and working memory. The above findings also support the importance of the DMN reported in past research from another perspective. The executive control system, located mainly in the dorsolateral prefrontal cortex, orbitofrontal and anterior cingulate cortex, plays an essential role in cognitive-control processes related to goal-directed behaviors. 39 The sensory cortex systems consist of widely distributed visual, auditory, and sensorimotor cortices which are mainly involved in sensorimotor processes. In our results, nearly half of between-network FC changes involved sensory cortex systems and were associated with global cognition, episodic memory, which has rarely been reported in previous studies on type 2 diabetes. However, one aging research has reported that sensorimotor and frontoparietal network connectivity are associated with subsequent maintenance of episodic memory in older adults. 40 Our results suggested that reduced FCs between functional networks were associated with poorer cognitive performance in type 2 diabetes patients, especially in memory.
Our findings confirmed prior studies that abnormal lipid profiles correlated with brain functional networks not only in healthy people but also in clinical patients.18,41,42 Overall, these studies suggest that serum TC, TG, and LDL-C are harmful, while HDL-C protects brain function and structure.43,44 Mediation analysis showed that some functional networks' between-network FCs mediated lipid metabolism's effects on global cognition and episodic memory. This expands our understanding of the relationship between lipid profile and cognition in type 2 diabetes and suggests that aggressive lipid management may protect brain networks and improve cognitive deficits. Xia et, al reported that type 2 diabetes with poorly controlled cholesterol had worse cognition, 18 supporting our CCA results. Systemic hyperlipidemia may damage neurons via inflammatory and other mechanisms, resulting in increases in serum cholesterol, inflammatory cytokines, and other amyloidogenic factors. 45 All current associations between serum lipid profile and FCs among large-scale brain networks emphasize the crucial role of lipid homeostasis in modulating network communication patterns in type 2 diabetes.
Our brain structural analysis showed no statistically significant differences in brain volume after correcting for TIV among the three groups, despite numerous studies showing increased risk for brain atrophy in diabetic patients. This suggests that the patients with type 2 diabetes in this study have not yet experienced significant brain atrophy. We found that WM/TIV ratio was associated with performance in several cognitive domains and diabetes-related metabolic parameters in diabetic patients, consistent with prior studies.46,47 However, brain volume did not correlate with serum lipid levels in our samples. And through mediation analysis, we only found that WM/TIV ratio mediates the relationship between HbA1c and processing speed and executive function. Overall, in type 2 diabetes, brain parenchymal atrophy is associated with glycemic and pancreatic function, while altered FC between brain networks is associated with serum lipid profiles. Both structural and functional alterations lead to cognitive impairment. Given the extensive literature on the association between glycemia, brain atrophy and cognition, our study highlights the potential significance of lipid metabolism management in the cognitive protection of diabetic patients.
The following limitations are noteworthy. First, the cross-sectional design of our study does not allow causal associations to be drawn. Identifying causality requires a longitudinal lipid-specific intervention study. Second, dietary and exercise habits are known to affect blood lipid levels, however, we did not collect relevant information about these habits, which prevented us from further examining the effect of lifestyle habits on our results. Third, diverse medication protocols, obesity, smoking and drinking habits, and duration may affect the functional network subtly. To test these potential effects on our current results, we included these variables as additional covariates in large-scale FC analyses between networks and partial correlation analyses. Then, we found that the main differences (vSMN-lVN and vSMN-DAN) in between-network connectivity across the groups, the correlation between FC alterations and cognition, and serum lipids remained unchanged (Supplementary Figure S3-S6), validating our findings. Given the high prevalence of systemic vascular abnormalities among diabetic patients, the last limitation is the possible unavoidable effects of cerebral microvascular dysfunction on cognition, 48 such as increased blood-brain barrier permeability, decreased neurovascular coupling, and decreased cerebral autoregulation and perfusion. Although all participants exhibited relatively mild and statistically insignificant microvascular changes, indicating a low risk of cerebrovascular disease and a healthy cerebrovascular status. The correlation between WMH burden and HbA1c and fasting insulin levels still suggests that chronic hyperglycemia exacerbates the progression of cerebral microangiopathy.
In conclusion, serum lipid levels can modulate large-scale between-network functional connectivity in type 2 diabetics, which may mediate the effect of lipid metabolism on cognitive performance (especially episodic memory). These findings enriched existing knowledge in type 2 diabetes regarding lipid metabolism-brain-cognition linkage from a large-scale functional network perspective. In diabetic patients, regulating serum lipids may improve cognitive function.
Supplemental Material
sj-pdf-1-jcb-10.1177_0271678X231204426 - Supplemental material for Large-scale functional network connectivity mediates the associations between lipids metabolism and cognition in type 2 diabetes
Supplemental material, sj-pdf-1-jcb-10.1177_0271678X231204426 for Large-scale functional network connectivity mediates the associations between lipids metabolism and cognition in type 2 diabetes by Wen Zhang, Linqing Fu, Yan Bi, Jiani Liu, Xin Li, Xin Zhang, Zhou Zhang, Yingwen Miao, Haiyan Cheng and Bing Zhang in Journal of Cerebral Blood Flow & Metabolism
Footnotes
Funding
The authors disclosed receipt of the following financial support for the research, authorship, and/or publication of this article: This work was supported by the Jiangsu Funding Program for Excellent Postdoctoral Talent [grant number 2022ZB694]; the funding for Clinical Trials from the Affiliated Drum Tower Hospital, Medical School of Nanjing University [grant number 2022-LCYJ-PY-15, 2022-LCYJ-MS-03]; the National Natural Science Foundation of China [grant number 82271965, 82302172] and the National Science and Technology Innovation 2030 - Major program of “Brain Science and Brain-Like Research” [grant number 2022ZD0211800].
Authors’ contributions
Data availability statement
Some or all datasets generated during and/or analyzed during the current study are not publicly available but are available from the corresponding author on reasonable request.
Declaration of conflicting interests
The author(s) declared no potential conflicts of interest with respect to the research, authorship, and/or publication of this article.
Supplementary material
Supplemental material for this article is available online.
References
Supplementary Material
Please find the following supplemental material available below.
For Open Access articles published under a Creative Commons License, all supplemental material carries the same license as the article it is associated with.
For non-Open Access articles published, all supplemental material carries a non-exclusive license, and permission requests for re-use of supplemental material or any part of supplemental material shall be sent directly to the copyright owner as specified in the copyright notice associated with the article.