
Abstract
For some positron emission tomography studies, radiotracer is administered as bolus plus continuous infusion (B/I) to achieve a state of equilibrium. This approach can reduce scanning time and simplify data analysis; however, the method must be validated and optimized for each tracer. This study aimed to validate a B/I method for in vivo quantification of synaptic density using radiotracers which target the synaptic vesicle glycoprotein 2 A: [11C]UCB-J and [18F]SynVesT-1. Observed mean standardized uptake values (SUV) in target tissue relative to that in plasma (CT/CP) or a reference tissue (SUVR-1) were calculated for 30-minute intervals across 120 or 150-minute dynamic scans and compared against one-tissue compartment (1TC) model estimates of volume of distribution (VT) and binding potential (BPND), respectively. We were unable to reliably achieve a state of equilibrium with [11C]UCB-J, and all 30-minute windows yielded overly large bias and/or variability for CT/CP and SUVR-1. With [18F]SynVesT-1, a 30-minute scan 90–120 minutes post-injection yielded CT/CP and SUVR-1 values that estimated their respective kinetic parameter with sufficient accuracy and precision (within 7
Keywords
Introduction
The synaptic vesicle glycoprotein 2 A (SV2A) is a highly conserved protein expressed ubiquitously and homogeneously in presynaptic vesicles throughout the brain. 1 Given this expression profile, along with the critical role SV2A plays in mediating synaptic vesicle trafficking, neurotransmitter release, and overall synaptic function, 2 positron emission tomography (PET) using radioligands that bind to SV2A provide in vivo measures of synaptic vesicle density, and by proxy, a surrogate for presynaptic terminal density. The radioligands [11C]UCB-J and [18F]SynVesT-1 bind with high affinity and specificity to the synaptic vesicle glycoprotein 2 A (SV2A),3 –5 and have proven to be invaluable tools for investigating relationships between synaptic density and brain function within the context of neuropsychiatric and neurodegenerative disease,6 –9 as well as synaptic changes associated with typical development and aging.10,11
Currently, PET studies utilizing [11C]UCB-J and [18F]SynVesT-1 feature a bolus injection of the radiotracer followed by 60 minutes of dynamic data acquisition and require arterial input function measurements for full dynamic modeling using the one-tissue compartment (1TC) model in order to quantify volume of distribution (VT).3,12 –14 However, this “gold standard” method of quantification for both radiotracers necessitates a relatively long scan duration, which may be prohibitive for some potential study participants or entire populations, and the arterial blood sampling with corresponding metabolite analyses makes this method less feasible and reproducible across study sites.3,14
As a possible alternative study design, the radiotracer could be delivered as a bolus plus continuous infusion (B/I) to experimentally establish radiotracer equilibrium between tissue and arterial plasma.15,16 The B/I approach requires the a priori determination of the infusion schedule, which is described by the parameter Kbol, which defines the magnitude of the bolus in units of minutes of infusion. For example, a Kbol value of 60 means the bolus component is equivalent to 60 minutes of infusion. Once it has been established that the B/I paradigm reliably produces a state of equilibrium, the total scan time can be greatly reduced and VT can be directly calculated as ratio of the radioligand concentration in tissue target region (CT) to that in arterial plasma (CP), since VT = CT/CP
The appropriate application of the B/I method requires that scanning and parameter estimation is performed during equilibrium and assumes similar behavior of the radioligand in the plasma across the study population such that equilibrium is established in all study subjects in the selected scan-time window. Therefore, the primary aims of the present study were to evaluate the ability of a B/I paradigm to reliably achieve a state of equilibrium for both [11C]UCB-J and [18F]SynVesT-1, and to then identify time windows post injection that provided the most reliable parameter estimates by calculating CT/CP (i.e., apparent VT) and SUVR-1 (i.e., apparent BPND) and comparing them with their 1TC model parameter counterparts. We additionally tested whether B/I ratios were able to identify group differences in regional SV2A density previously identified using full dynamic compartmental modeling. Overall, we hoped to identify and validate a simplified PET method for in vivo measurements of SV2A density which could aid in the ability to conduct larger (or multi-site) studies.
Materials and methods
Radiotracer synthesis
[11C]UCB-J 17 and [18F]SynVesT-1(also referred to as [18F]SDM-8) 5 were synthesized as previously described.
Radiotracer injection and data acquisition
Human subjects
All scanning procedures were approved and overseen by the Yale University Human Investigation Committee and the Yale University Radiation Safety Committee in accordance with the United States federal policy for the protection of human research subjects in Title 45 Part 46 of the Code of Federal Regulations (45 CFR 46). Written informed consent was obtained from all subjects prior to participation after complete explanation of study procedures.
In vivo B/I [11C]UCB-J studies
Data were analyzed from 10 [11C]UCB-J scans acquired from 5 male and 5 female healthy subjects (HS; mean age: 31.4 ± 9.5 years). Doses of 431 ± 176 MBq of [11C]UCB-J with high molar activity (162 ± 122 MBq/nmol) were delivered as B/I. A Kbol value of 150 minutes was selected based on simulations previously performed using the regional TACs from the five healthy control subjects evaluated with PET after bolus injection [11C]UCB-J. 3 Imaging data and arterial blood samples (for metabolite-corrected input function calculation) were collected for 120 minutes following the injection, as previously described. 3
[18F]SynVesT-1 simulations
Determination of the Kbol value for [18F]SynVesT-1 was based on the analysis of simulated time-activity curves (TACs) which used arterial input functions and kinetic parameters (K1 and k2) from bolus injection studies (n = 14). 14 In brief, using the equation of time response for B/I protocols 15 , TACs were simulated for the arterial input function, gray matter regions (frontal, temporal, parietal, and occipital cortices; caudate, putamen, thalamus, hippocampus, and cerebellum) and centrum semiovale (C.S.) by varying Kbol from 60 to 200 minutes in 10 minute increments. The ‘optimal’ Kbol value was determined to minimize the %VT bias of CT/CP at 45–60, 75–90, 90–105, and 105–120 minutes after tracer injection.
In vivo B/I [18F]SynVesT-1 studies
Data were analyzed from 11 [18F]SynVesT-1 scans acquired from 9 HS (8 males and 1 female) and 2 males with a diagnosis of major depressive disorder (mean age: 54.1 ± 7.7 years). Doses of 177 ± 12 MBq of [18F]SynVesT-1 with high molar activity (212 ± 90 MBq/nmol) were delivered as B/I with Kbol = 150 minutes. Imaging data and arterial blood samples (for metabolite-corrected input function calculation) were collected for 150 minutes following the injection. 14
Equilibrium ratio and 1TC parameter comparisons
For all PET scans, TACs, expressed as the standard uptake volume (SUV = [kBq/mL]/[MBq/kg]), were extracted from 10 regions of interest (ROIs) using subject-specific MRIs nonlinear transformed to the AAL MR template 18 : frontal, parietal, temporal, and occipital cortices; caudate, putamen, thalamus, hippocampus, amygdala, and cerebellum. The metabolite-corrected arterial input functions were generated as previously described and linearly interpolated to the PET frame times. 3 A TAC was also generated for a 2 mL volume of the C.S., a white matter region proposed as a useful estimate of non-displaceable uptake for radioligands targeting SV2A. 19
The 1TC model was applied to dynamic scan data in order to calculate ‘true’ VT and BPND values for [11C]UCB-J3 and [18F]SynVesT-1,
14
with CS used as the reference tissue for BPND estimations. For each ROI, the apparent VT was calculated for 30-minute overlapping time windows as the ratio of average (mean) radiotracer concentrations in tissue (CT) to metabolite-corrected plasma concentrations (CP). These regional CT/CP values were then used to calculate standardized uptake value ratios (SUVR) using C.S. as the reference region:
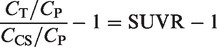
As a measurement of lack of achieving equilibrium, the percent difference between CT/CP and SUVR-1 values relative to full 1TC model estimates of VT and BPND, respectively, were calculated such that negative values represent an underestimation and positive values indicate an overestimation of the 1TC model parameters:

Statistical analyses
To assess whether a state of apparent equilibrium was reliably achieved by the B/I method for each subject, the six scan frames within each 30-minute window of the TAC for the arterial input function, gray matter regions (frontal, temporal, parietal, and occipital cortices; caudate, putamen, thalamus, hippocampus, and cerebellum) and C.S. were fit to a linear model to calculate slope (SUV/hour) and the slope as the percent of the mean SUV for the given 30-minute timeframe (%SUV/hour). The data were checked for statistical outliers using the Grubb’s extreme studentized deviant method. Date from one of the [18F]SynVesT-1 studies (healthy comparison, Male, age 45 years), specifically the amygdala %BPND values starting at the 80–110 min. window, were found to be significant outliers (two-tailed p < 0.05), and thus excluded from the analysis. Descriptive statistics provided throughout are arithmetic mean ± SD.
Results
Bolus/infusion [11C]UCB-J in healthy control subjects
The average TAC for [11C]UCB-J B/I studies conducted in 10 HS is shown in Figure 1. For each subject, we calculated the slope (SUV/hour) and the slope as a percent of the mean SUV (%SUV/hour) for each 30-minute time window (see Statistical analyses, Table 1). Slopes of the arterial input function were negative, with the smallest SUV slope at 90–120 minutes (−9.3 ± 11.2%SUV/hour). For each individual, an average TAC was calculated for gray matter regions (frontal, parietal, temporal, and occipital cortices; caudate, putamen, hippocampus, thalamus, and cerebellum). This “gray matter region” slope was positive at the 20–50 minute window (0.05 ± 9.9%SUV/hour), with negative slopes for the remainder of the scan, ranging from −4.2 ± 9.0%SUV/hour at 30–60 minutes, to −6.8 ± 7.2 slope as %mean at 80–110 minutes. It is further worth noting that by the 40–70 minute window, the %SUV/hour was negative for all individual regions included within the average “gray matter region”, with the exception of amygdala (which had a positive %SUV/hour until the final 90–120 minute window). This suggests that for most gray matter regions, the chosen Kbol was too large, i.e., the initial bolus overshot the equilibrium value. On average, the C.S. slope was smallest at 70–100 minutes (3.5 ± 30.2%SUV/hour); note that the inter-subject variability was very high, with individual subject slopes ranging from −32.5 to +54.0%SUV/hour. At 60–90 minutes, the average of the C.S. slope was nominally greater, but with substantially less inter-subject variability (−6.9 ± 16.8%SUV/hour), with individual values ranging from −27.9 to +17.7%SUV/hour. Note that statistical noise is a major contributor to the variability of C.S. slope values.
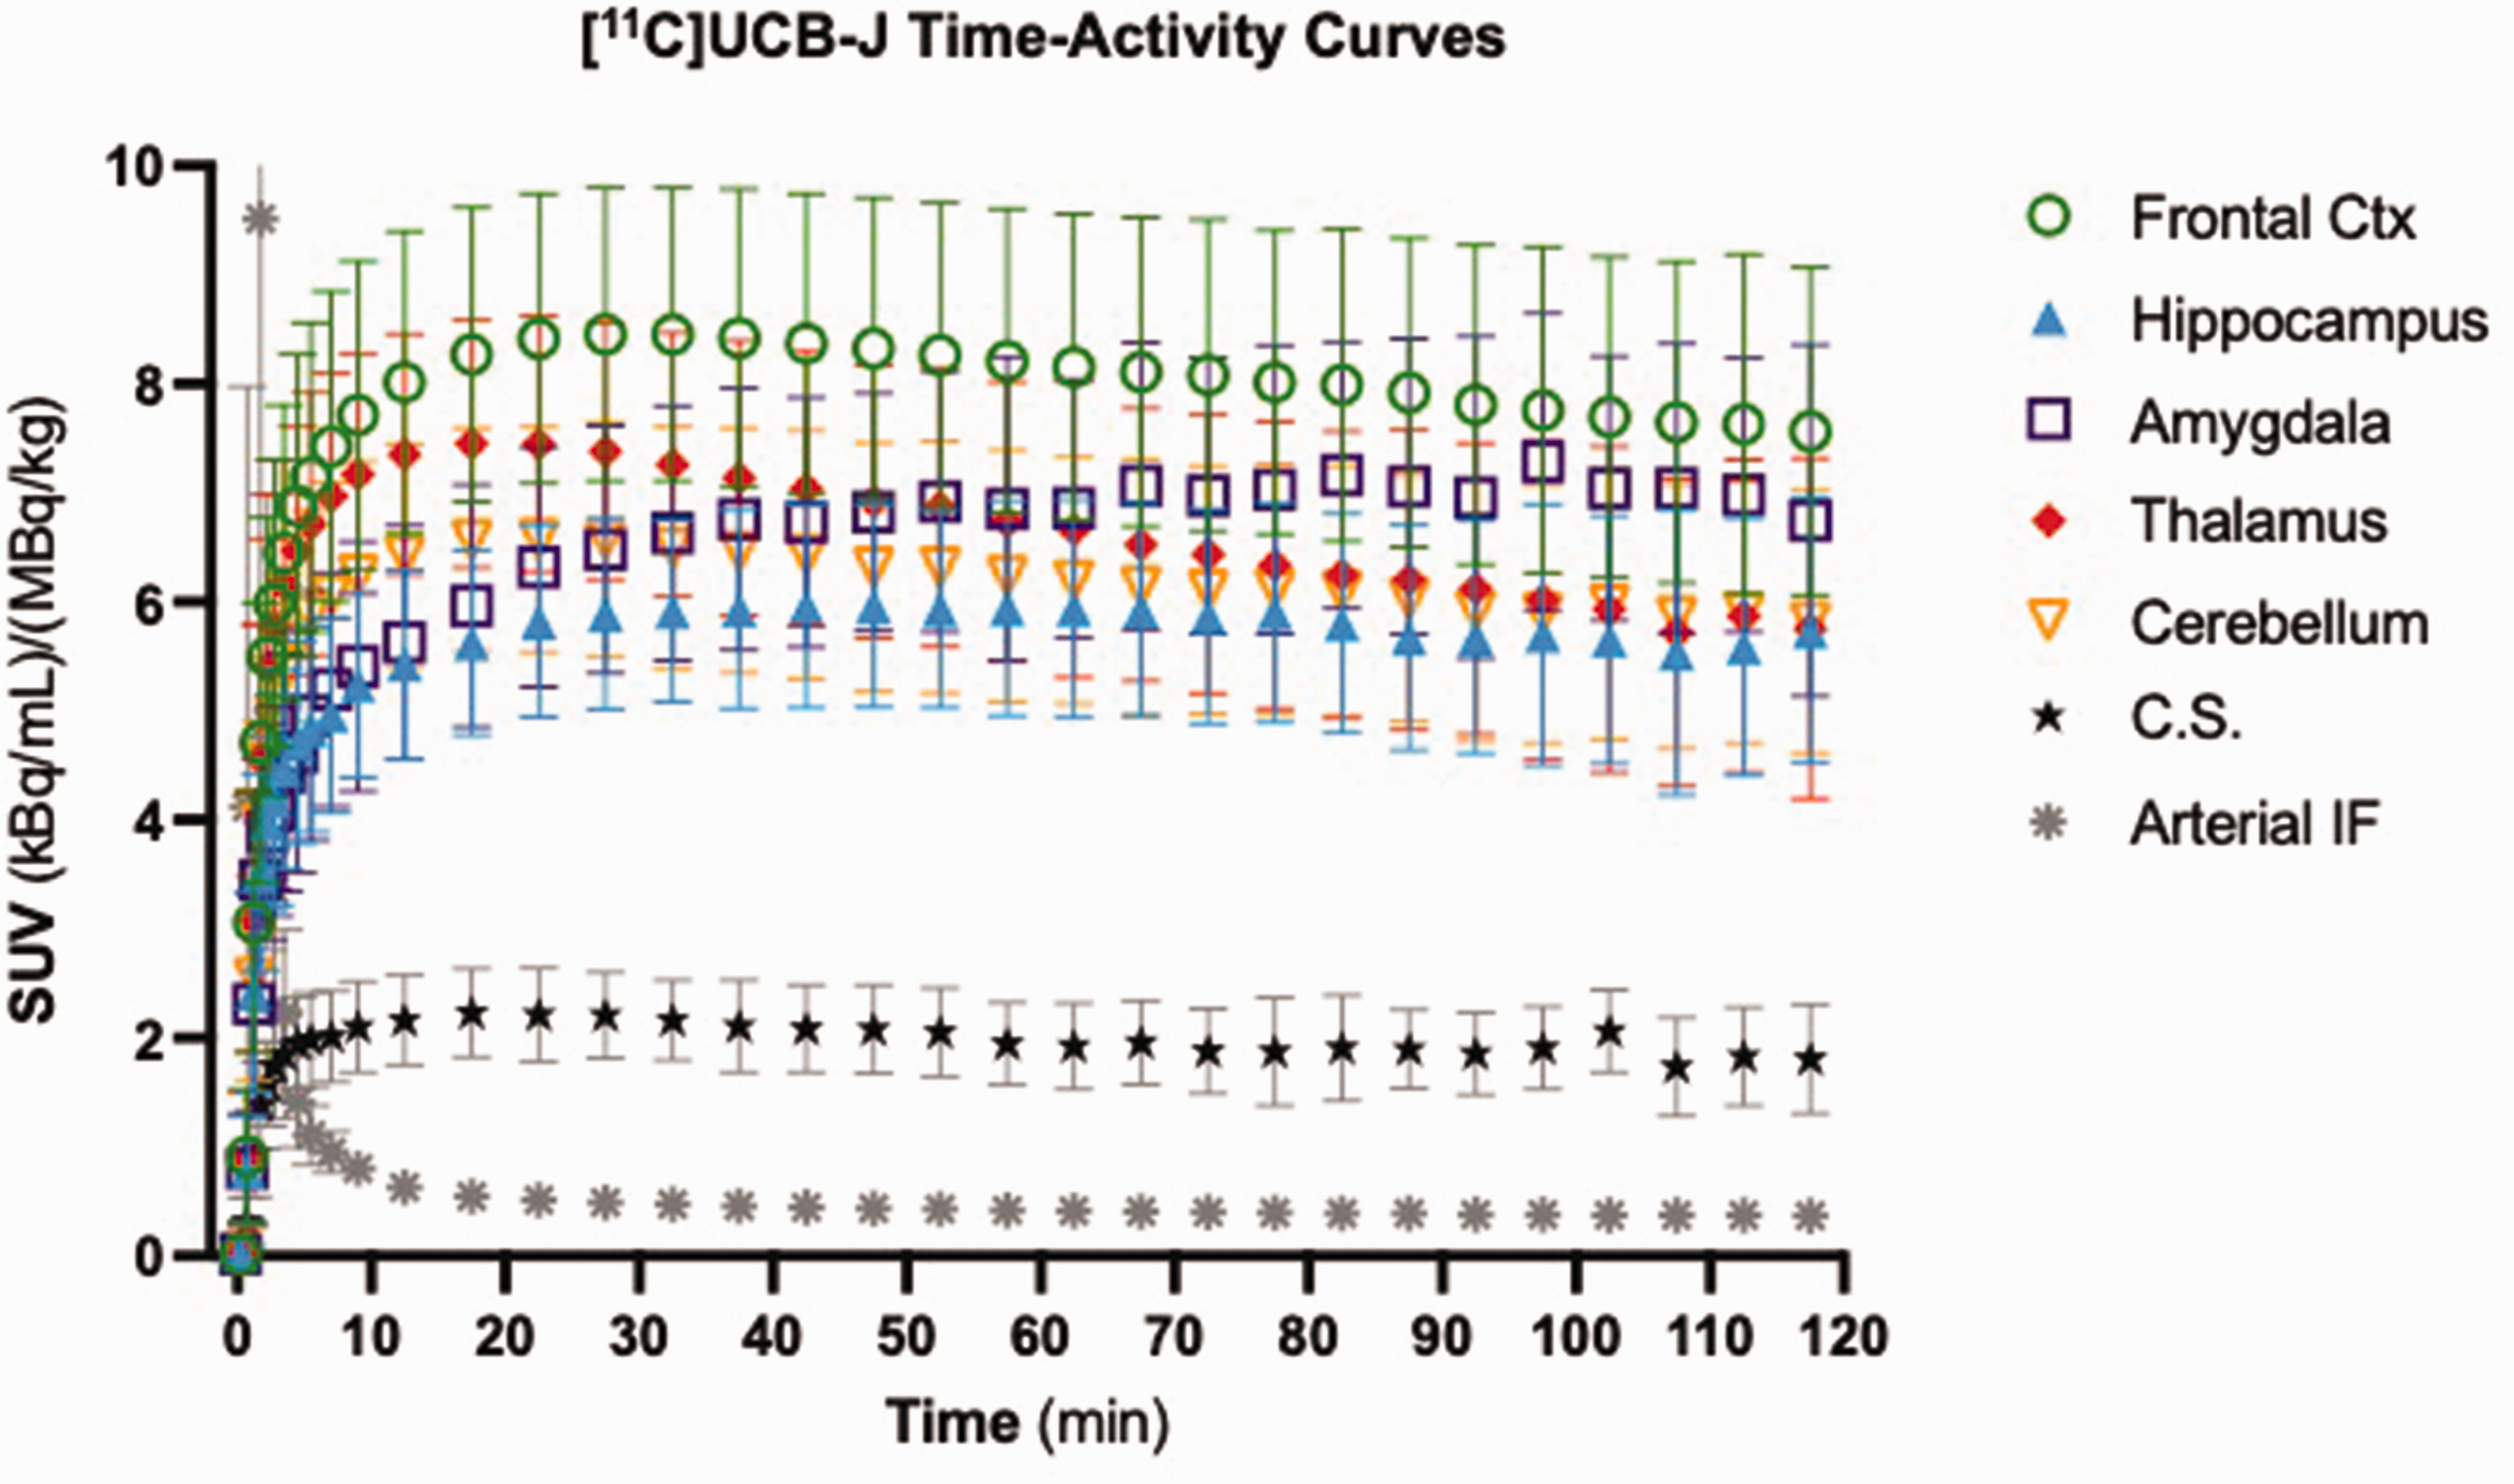
Population [11C]UCB-J time-activity curves. Standardized uptake values (SUV) with units of the measured radioactivity concentration in the tissue or plasma (arterial input function; kBq/mL) relative to the bodyweight-corrected total injected dose (MBq/kg) for 10 healthy subjects injected with a bolus/infusion of [11C]UCB-J (Kbol = 150). Data are presented as the mean
Population mean (n = 10) standardized uptake value (SUV) slopes for [11C]UCB-J B/I studies.
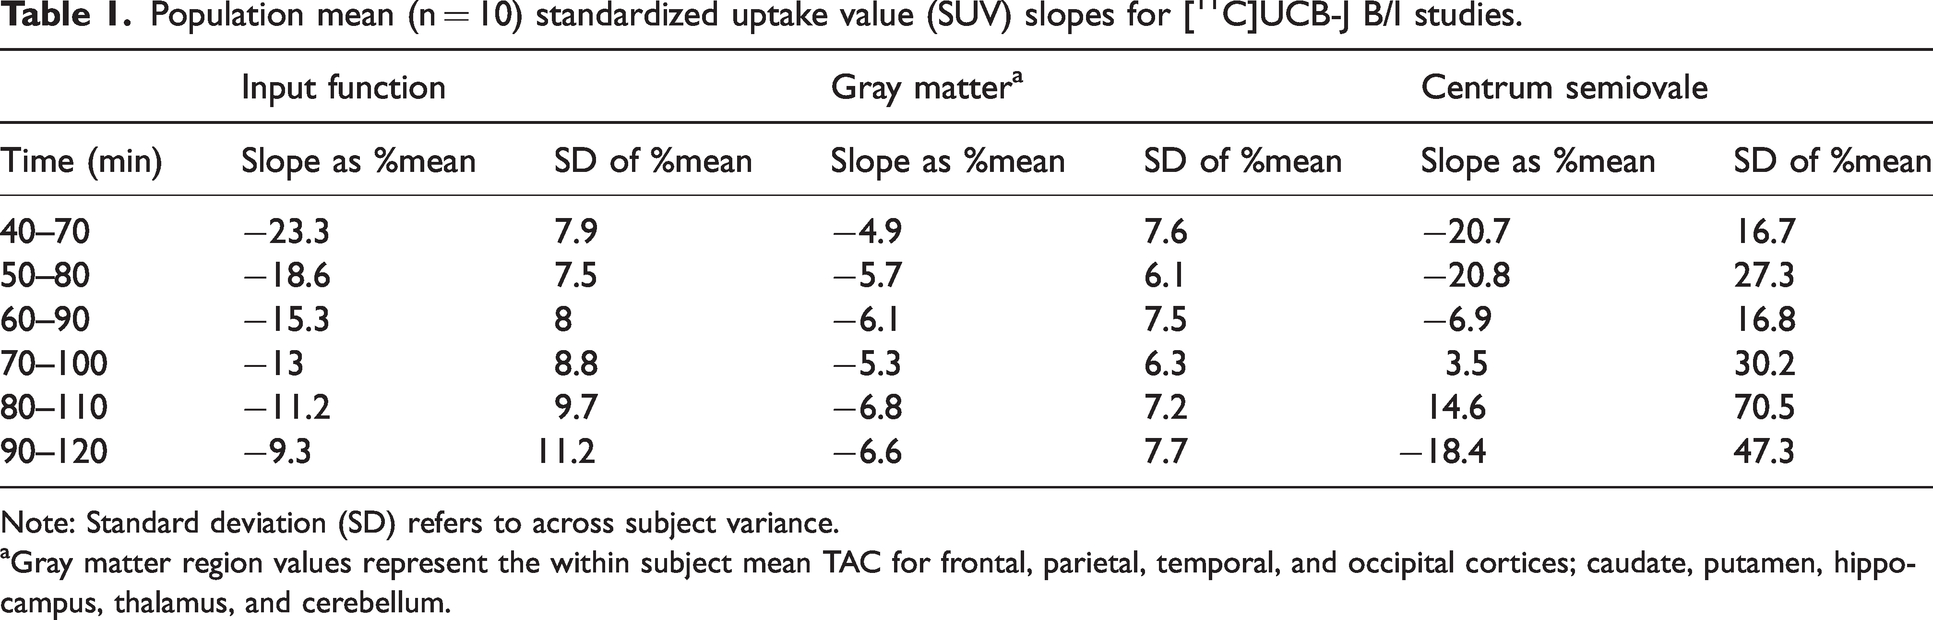
Note: Standard deviation (SD) refers to across subject variance.
Gray matter region values represent the within subject mean TAC for frontal, parietal, temporal, and occipital cortices; caudate, putamen, hippocampus, thalamus, and cerebellum.
For each subject, the ratio of radiotracer concentrations in tissue to metabolite-corrected plasma concentrations (CT/CP) was calculated for 30-minute overlapping time windows and are displayed in the supplement (Table S1, top). We found that CT/CP ratios continued to slowly increase for the total 120-minute scan duration for eight of ten ROIs, including all four cortical regions (Table S1). As time progressed, CT/CP overestimated the true VT value in all regions. This is expected given the overshoot in equilibrium (Table 1) so that TACs were clearing.
15
The time window with the smallest mean VT bias across subjects and ROIs was 20–50 minutes (Figure 2(a)), with misestimation ranging from −18.2
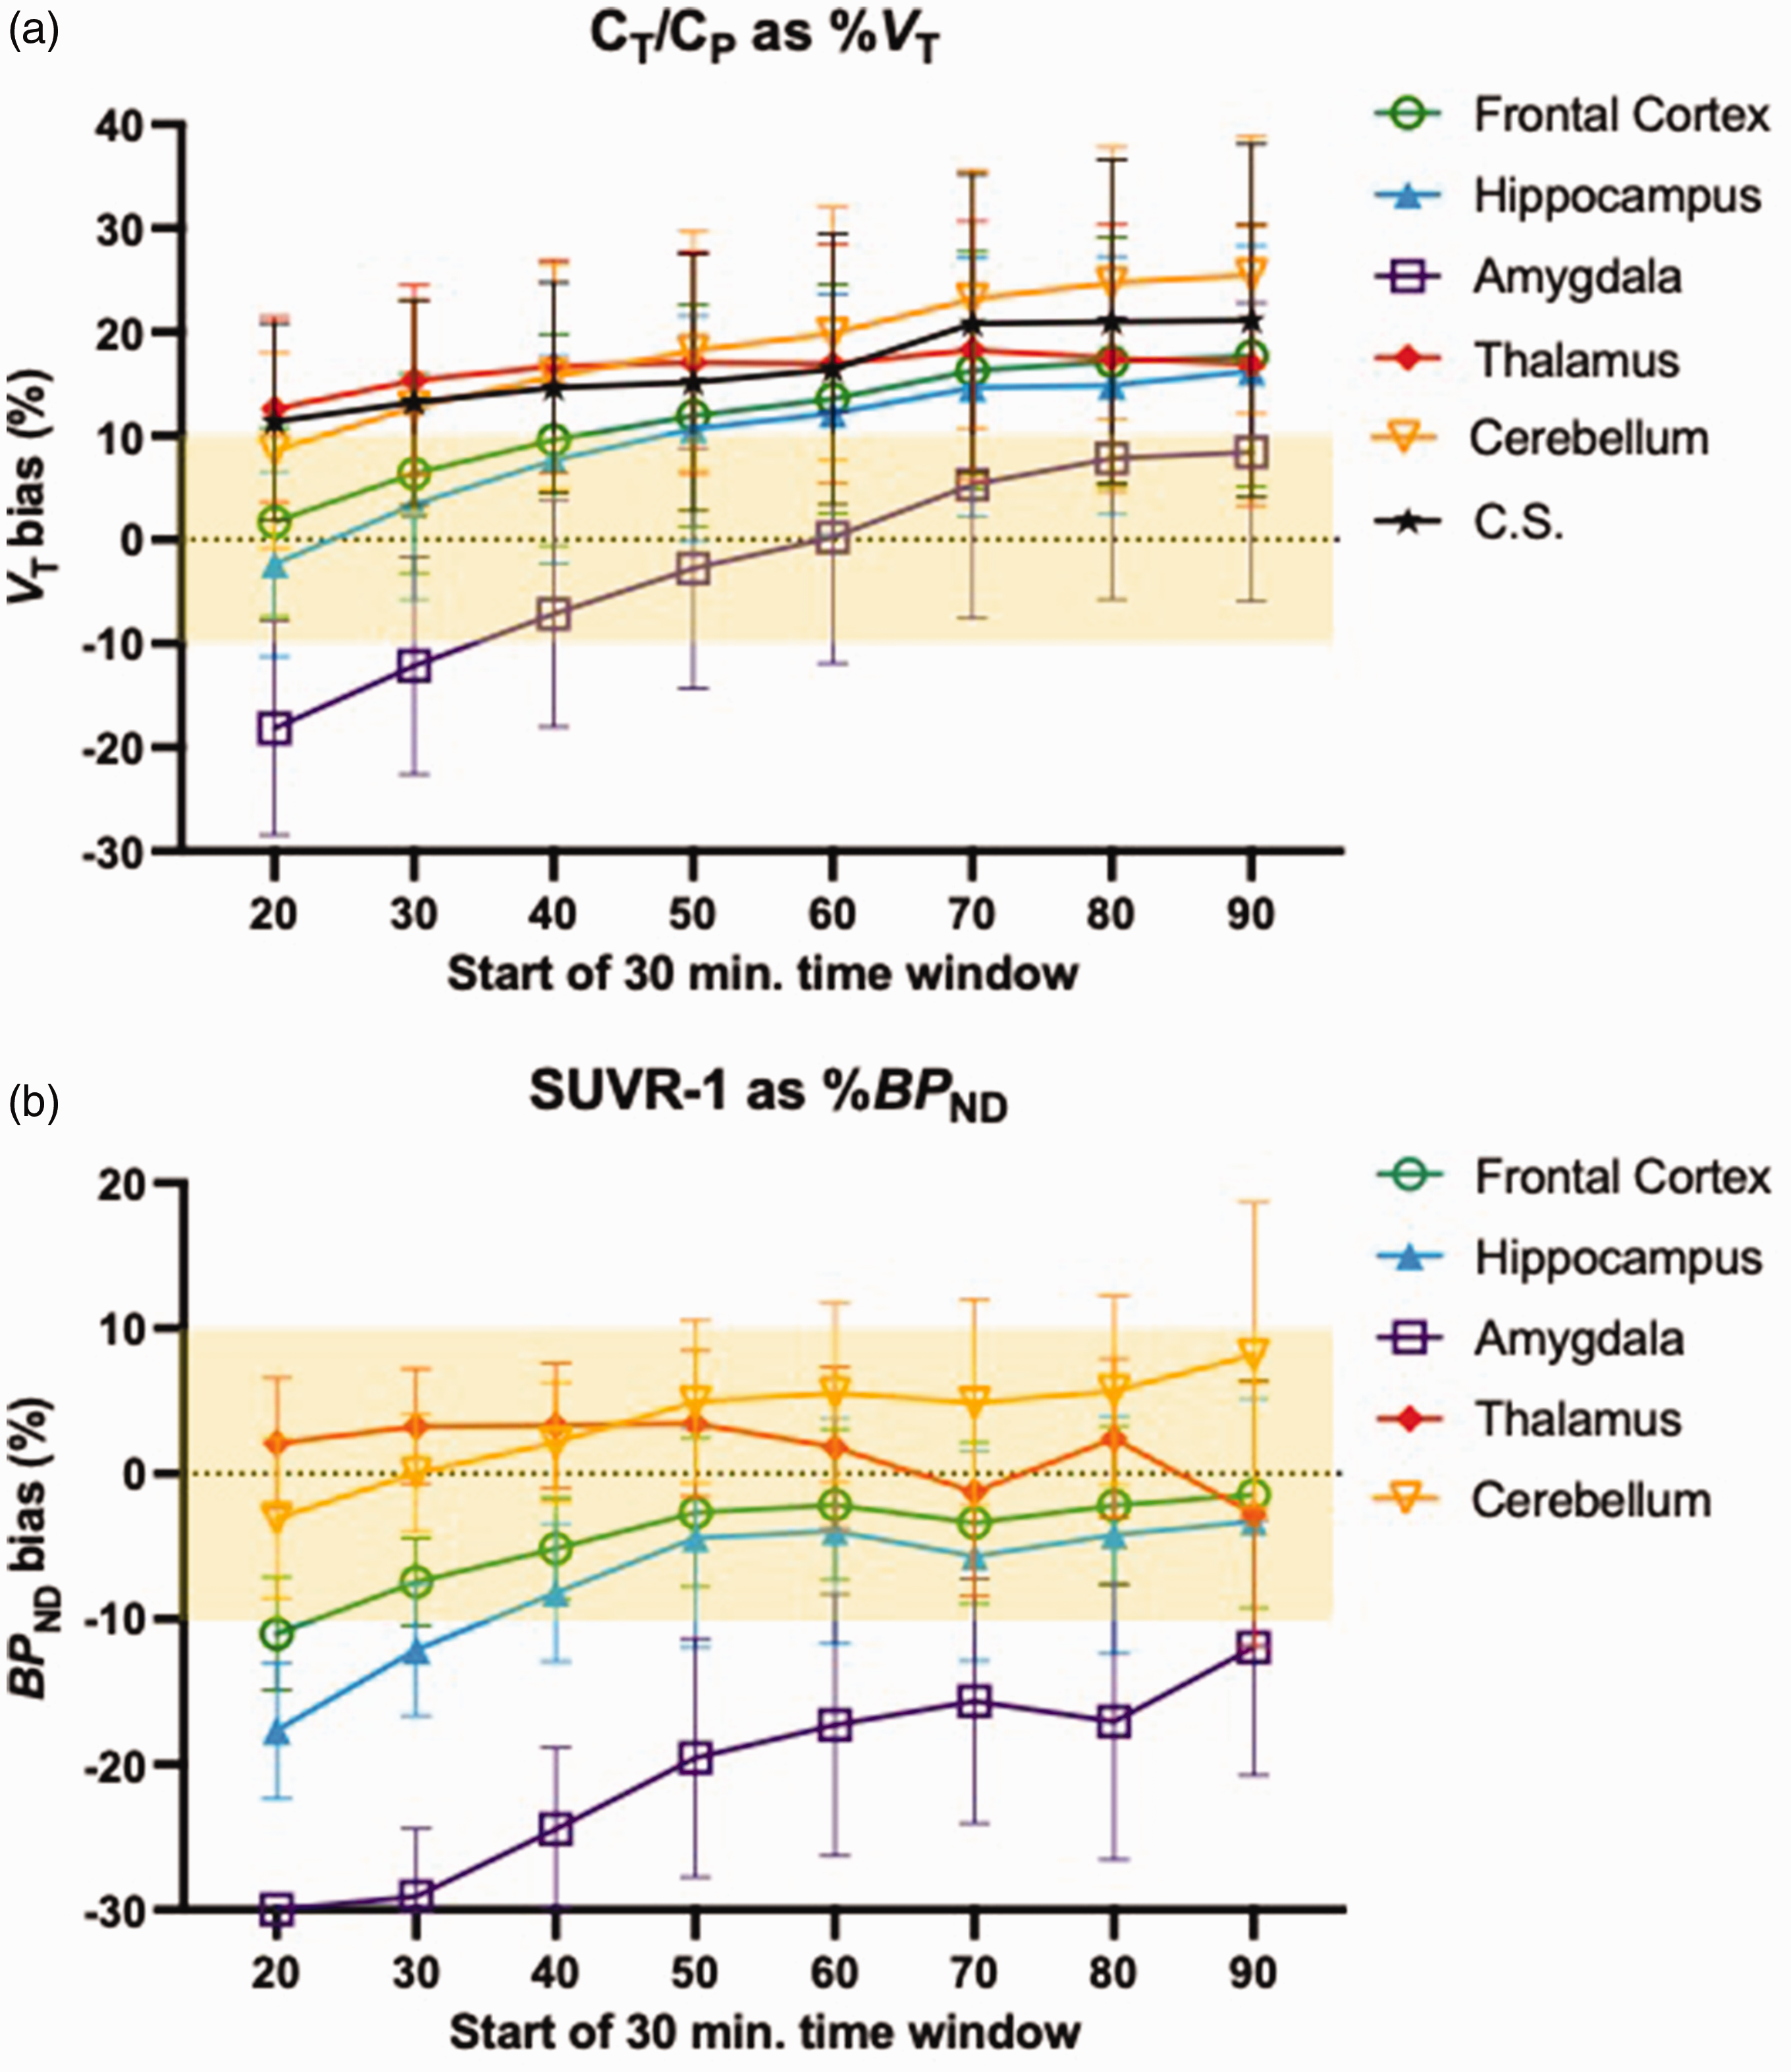
Equilibrium ratios versus 1TC model parameters for [11C]UCB-J. Population bias of [a] CT/CP values relative to 1TC model estimates of VT. and, [b] SUVR-1 values relative to 1TC model estimates of BPND from [11C]UCB-J B/I studies (Kbol = 150) performed in 10 healthy control subjects. Bias was calculated as the %1TC parameter such that positive values represent overestimations and negative values represent underestimations of the relevant 1TC parameter. Data are presented as the mean±SD. Abbreviations: centrum semiovale (C.S.).
Observed SUVR-1 values peaked at 60–90 minutes post-injection for all ROIs except the thalamus, which peaked at 50–80 minutes. The SUVR-1 values for all 30-minute windows and ROIs can be found in the supplement (Table S1, bottom). The time window with the smallest mean bias across ROIs and subjects was at 90–120 minutes (Figure 2(b)), with %BPND underestimation ranging from −12.0
[18F]SynVesT-1 simulations for kbol selection
Results of simulations predicting CT/CP %VT bias for various Kbol values in gray matter regions are provided in Fig. S1A, and for the C.S. white matter region in Fig. S1B. Higher Kbol values, i.e., larger bolus fractions, yielded higher TAC values and more positive bias. No Kbol value was ideal for both gray and white matter regions. Ultimately, Kbol = 150 min was selected based on the finding that this Kbol value resulted in the smallest %VT bias in the gray matter regions (0.5 ± 6.0%) at the earliest (i.e., 45–60 minute) timepoint.
Bolus/infusion [18F]SynVesT-1 studies
The average regional TACs from 11 B/I [18F]SynVesT-1 studies are presented in Figure 3. On average, TACs for the arterial input function, gray matter regions, and the C.S. had negative slopes for all timeframes, although these were smaller in magnitude than those of [11C]UCB-J (Table 2). The %mean slope for the arterial input ranged from −6.6 ± 9.3 to −7.7 ± 8.2%SUV/hour. The gray matter region slope never exceeded −4.2%SUV/hour and was less than −2.5%SUV/hour from 80 minutes on. The inter-regional variability (SD) ranged from ±4.4 at 60–90 min. to ±3.3%SUV/hour at 120–150 min. Based on the linear fit to the 6 scan values in each interval, the 70–100 and 120–150 min. windows provided the numerically smallest mean C.S. slope values, but with considerable inter-subject variability (−2.4 ± 13.8 and −2.4 ± 30.2%SUV/hour, respectively). In an effort to reduce noise effects on slope estimation, we also estimated the slope during each period from the fitted 1TC model curve. Indeed, this substantially reduced noise-induced inter-subject variability (Table 2 and Fig. S2), and using this approach, the slope for the same 70–100 min. window was 11.9 ± 5.0%SUV/hour, and for 120–150 min., 6.4 ± 5.1%SUV/hour.
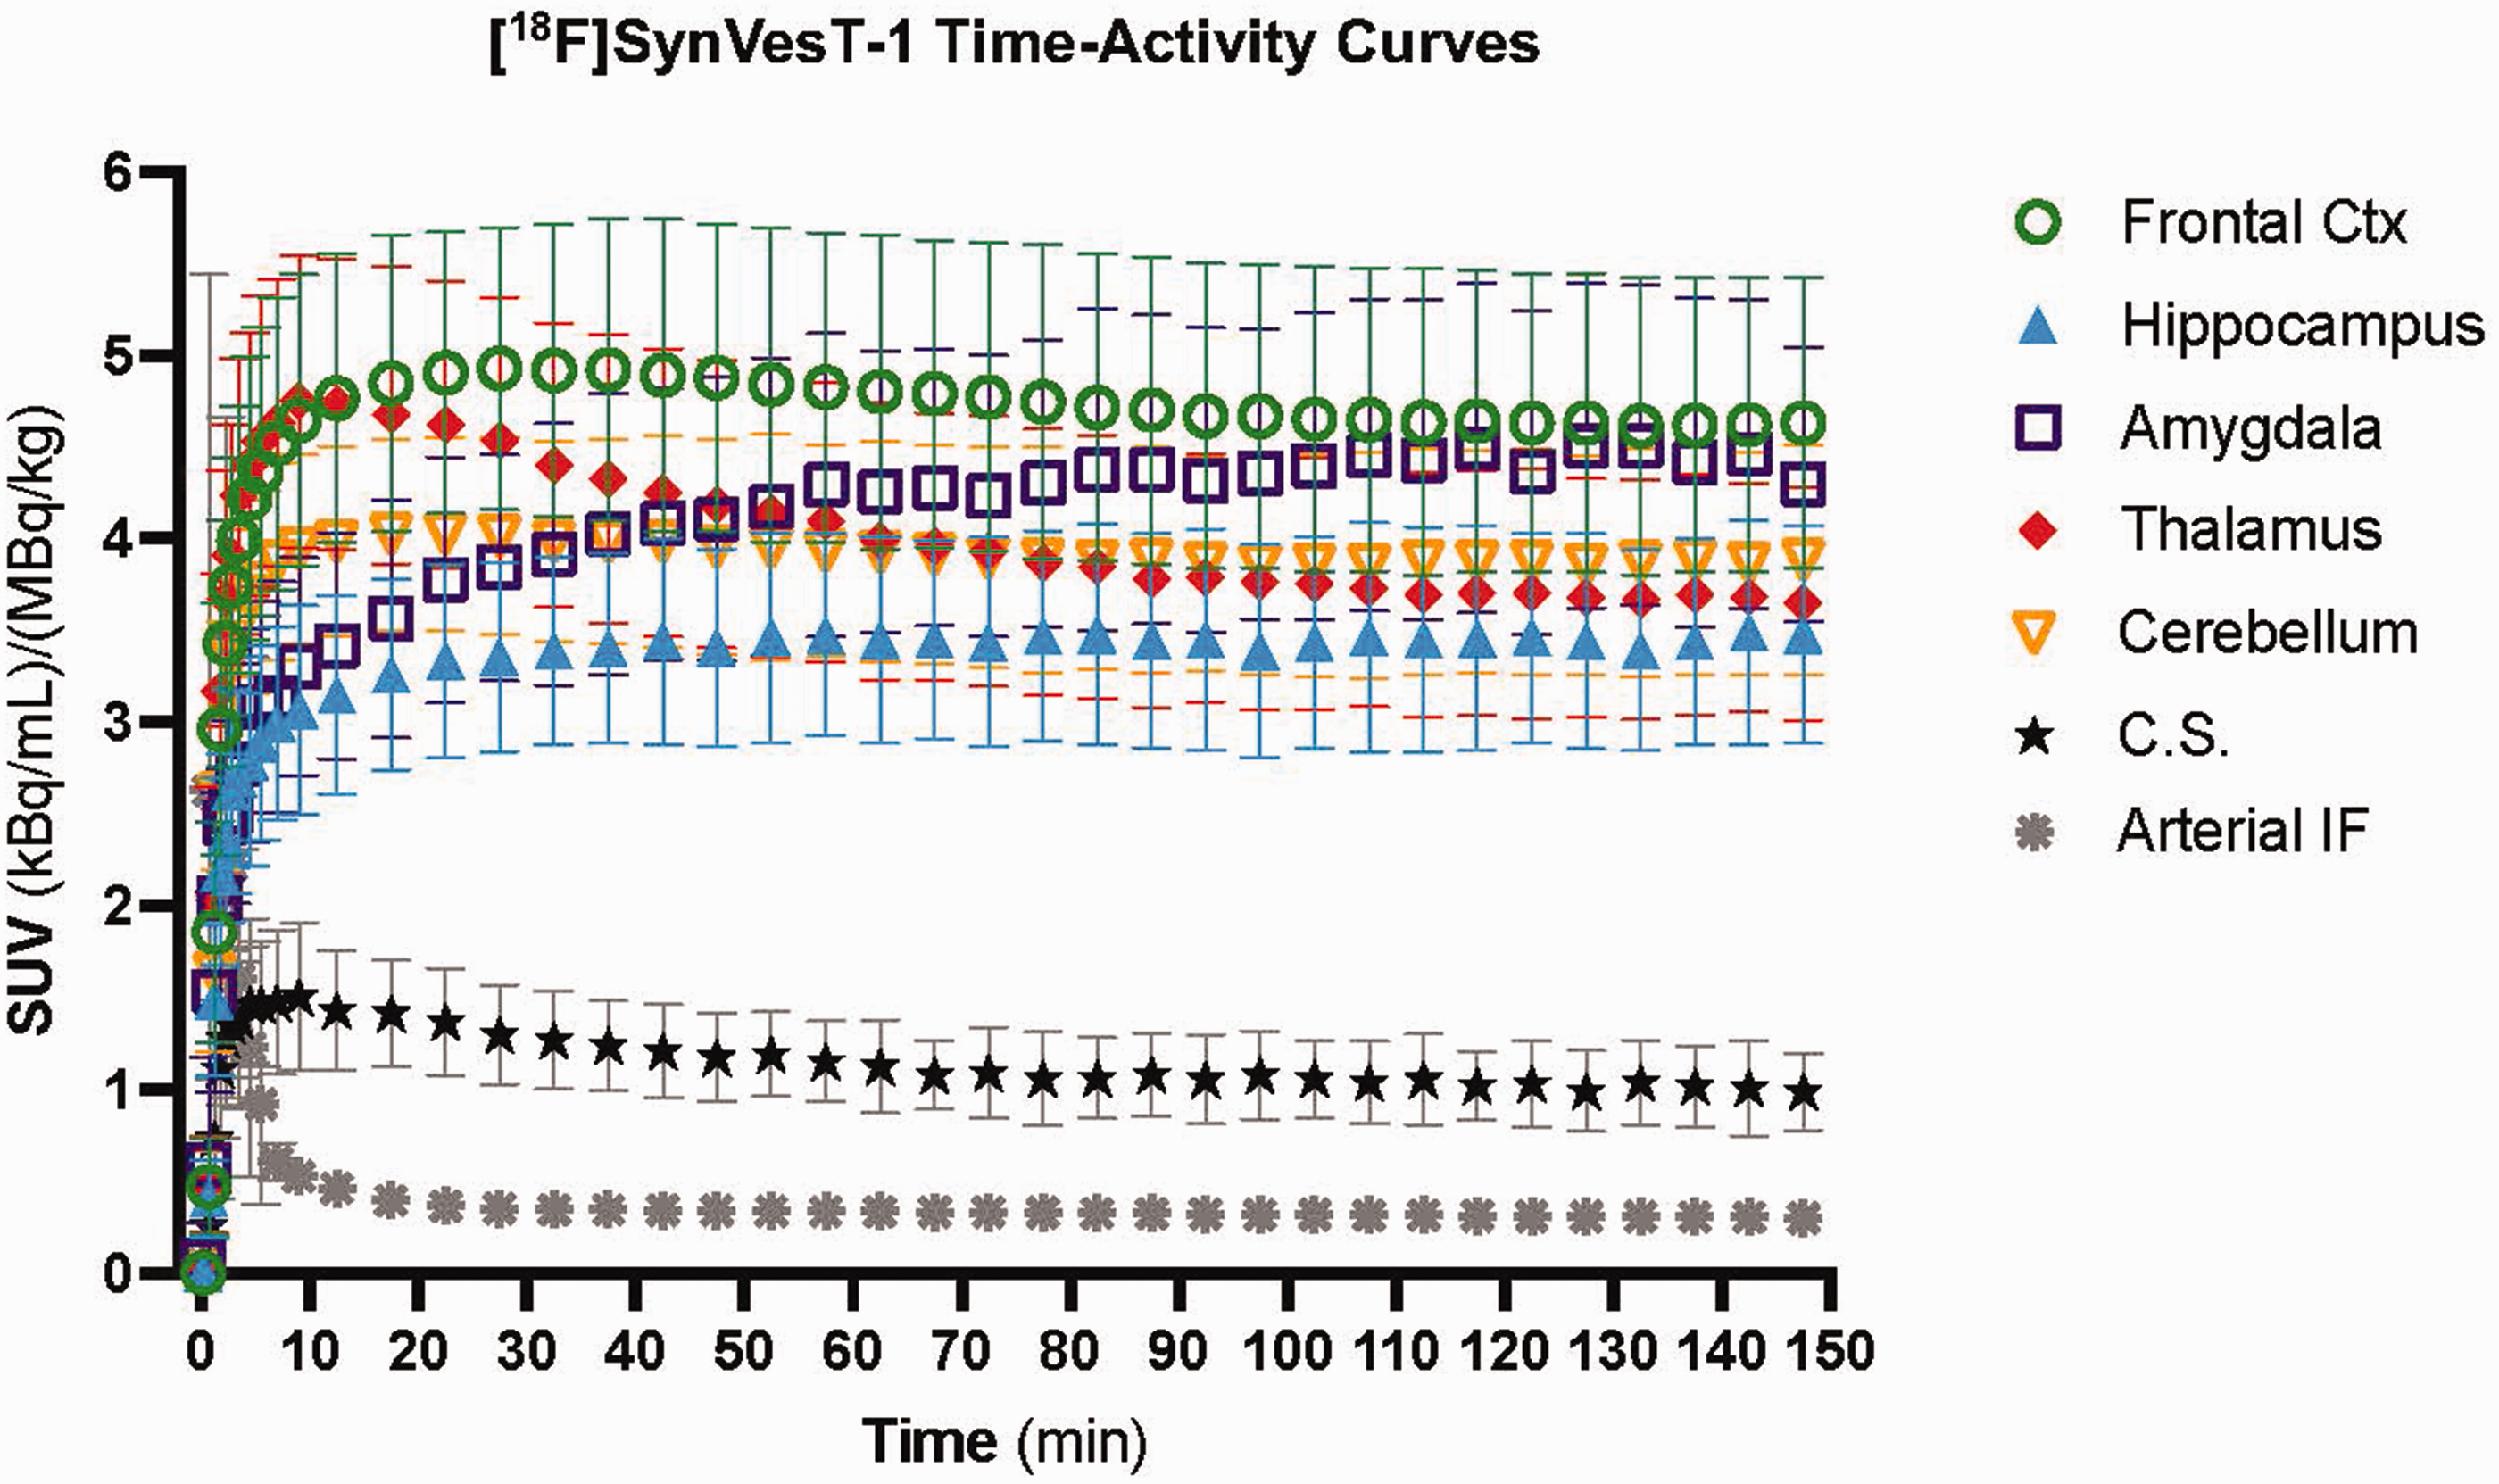
Population [18F]SynVesT-1 time-activity curves. Standardized uptake values (SUV) with units of the measured radioactivity concentration in the tissue or plasma (kBq/mL) relative to the bodyweight-corrected total injected dose (MBq/kg) for 11 subjects injected with a bolus/infusion of [11C]UCB-J (Kbol = 150). Data are presented as the mean
Population mean (n = 11) standardized uptake value (SUV) slopes for [18F]SynVesT-1 B/I studies.
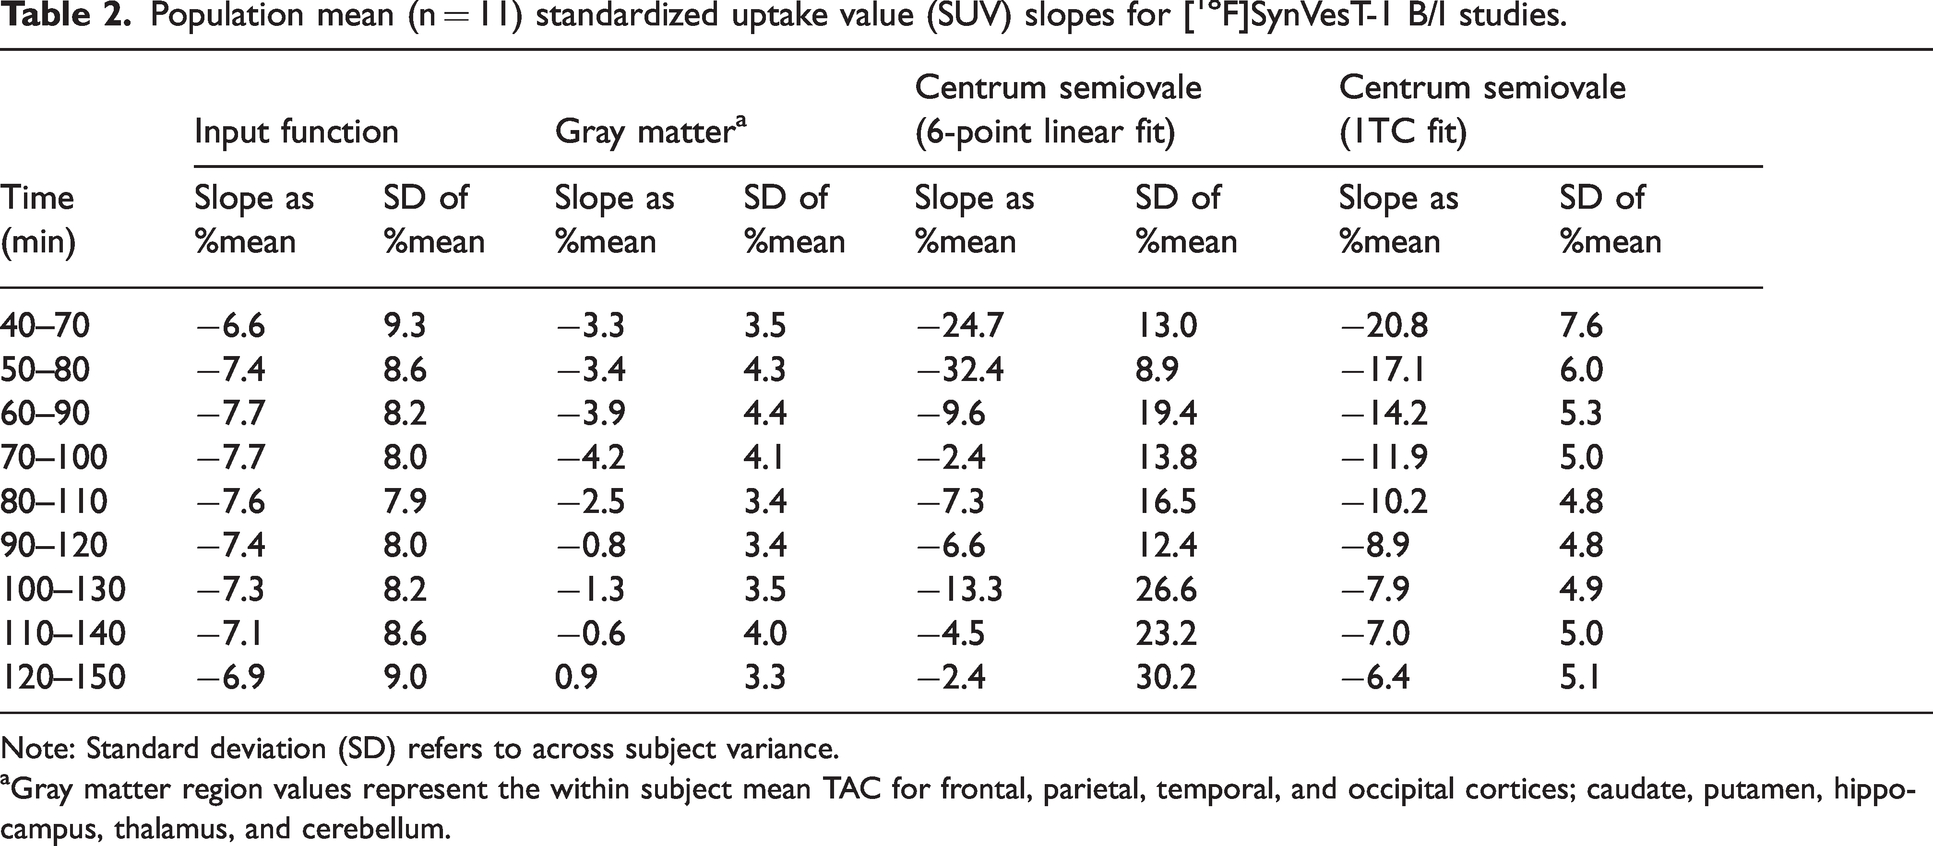
Note: Standard deviation (SD) refers to across subject variance.
Gray matter region values represent the within subject mean TAC for frontal, parietal, temporal, and occipital cortices; caudate, putamen, hippocampus, thalamus, and cerebellum.
As was done for [11C]UCB-J studies, CT/CP was calculated for 30-minute overlapping time windows for each subject (see Table S2, top). Notably, CT/CP ratios continued to slowly increase for the total 150-minute scan duration for all ten ROIs (Table S2). By the 40–70 minute time window, CT/CP ratios overestimated VT in the majority of ROIs (Figure 4(a)), consistent with the simulation results (Fig. S1A), although the % overestimation was much lower than that of [11C]UCB-J. The 40–70 minute window produced values with the smallest magnitude bias of the VT estimate when averaged across all ROI’s (−0.3
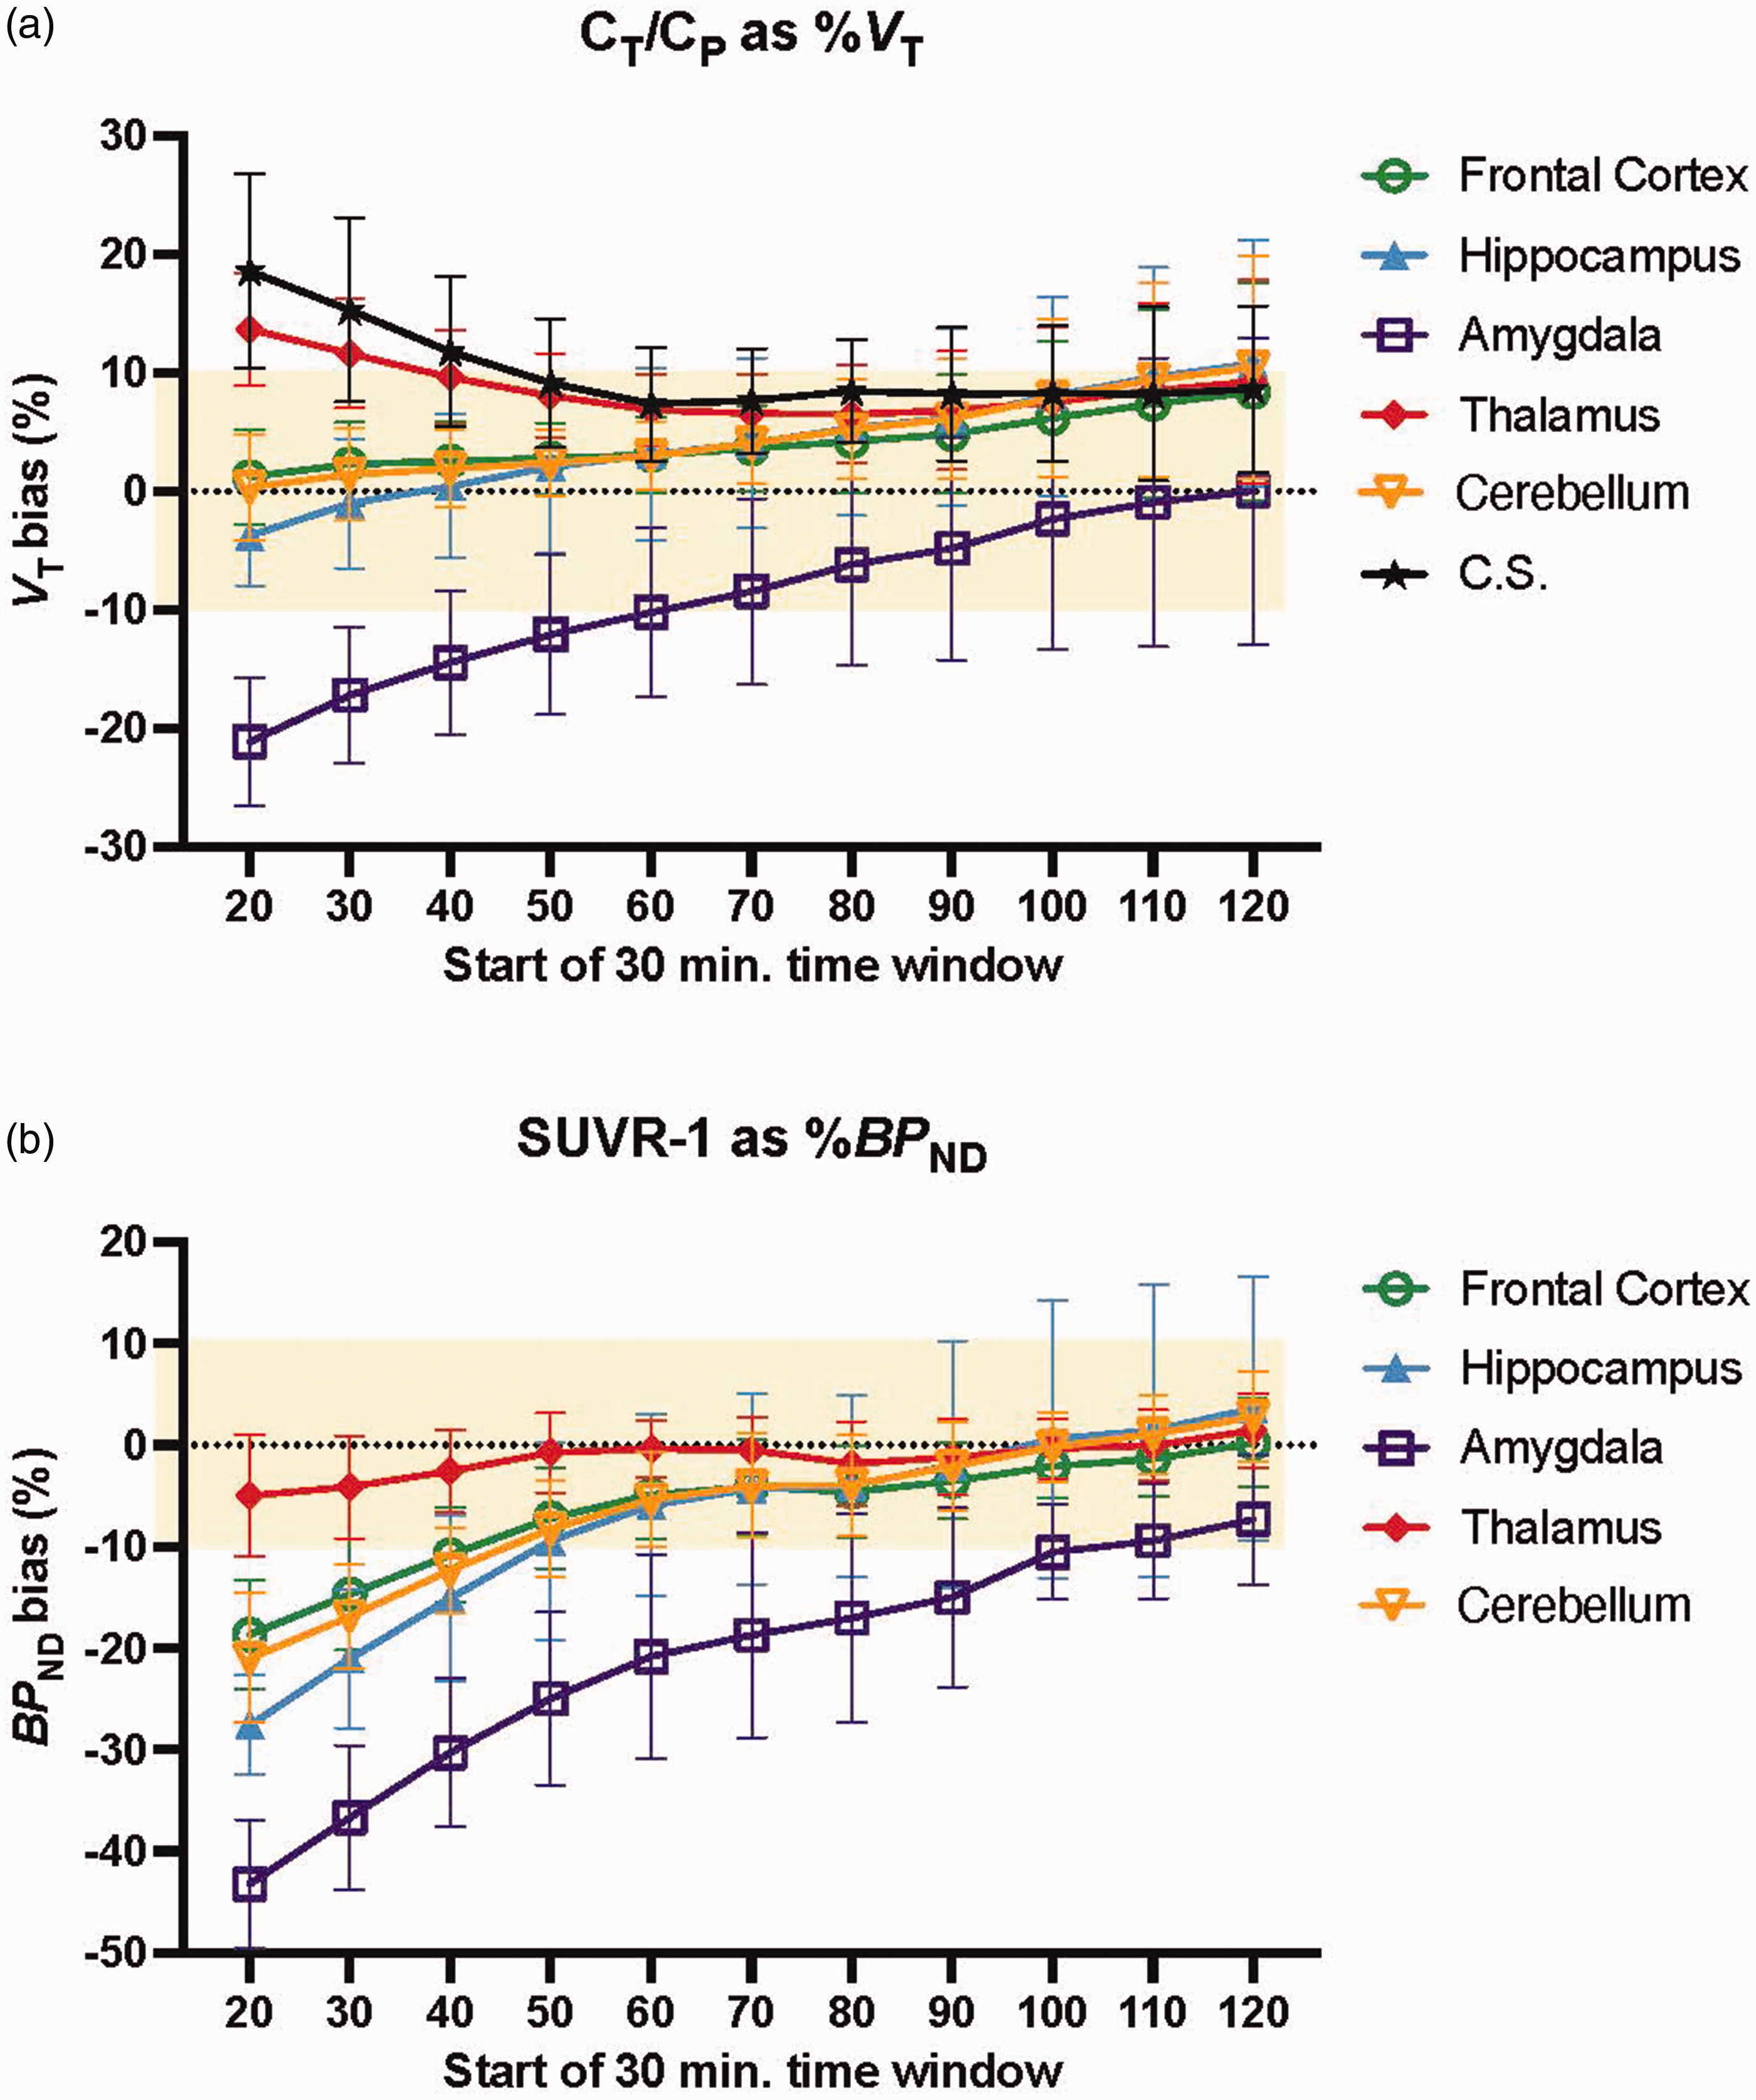
Equilibrium ratios versus 1TC model parameters for [18F]SynVesT-1. Population bias of [a] CT/CP values relative to 1TC model estimates of VT. and, [b] SUVR-1 values relative to 1TC model estimates of BPND from [18F]SynVesT-1 B/I studies (Kbol = 150) performed in 11 subjects. Bias was calculated as the %1TC parameter such that positive values represent overestimations and negative values represent underestimations of the relevant 1TC parameter. Data are presented as the mean±SD. Abbreviations: centrum semiovale (C.S.).
Observed SUVR-1 values continued to slowly rise thorough the entire 150-minute scan duration (for SUVR-1 values at each 30-minute for all ROIs, see Table S2, bottom). For the majority of the scan durations, SUVR-1 consistently underestimated BPND (Figure 4(b)). The 30-minute time window with the smallest average %BPND bias across ROIs was the final 30 minutes, that is 120–150 minutes post-injection (+0.8
Notably, starting at the 90–120 minute window and continuing through the remainder of the scan, in all regions except amygdala, the %BPND misestimation by SUVR-1 was less than 7% with an SD of less than
Discussion
When successfully applied, the advantage of the B/I method is that a state of equilibrium can be achieved. 15 At equilibrium, parameters (i.e., VT and BPND) can be estimated from plasma and tissue TACs directly, bypassing the need for modeling, with the additional benefit of requiring a shorter scan duration.15,21 However, different brain regions and each radiotracer displays unique kinetics and will reach equilibrium at different times (or not at all); thus, every new tracer and protocol must be validated. 22 Therefore, the overarching goal of these studies was to evaluate B/I methods of measuring synaptic density in vivo using radiotracers that target the presynaptic SV2A protein: [11C]UCB-J and [18F]SynVesT-1. To this end, we assessed B/I paradigms and aimed to identify time windows post injection which provided the most reliable parameter estimates using CT/CP (apparent VT) and SUVR-1 (apparent BPND).
Here, using a B/I delivery of [11C]UCB-J with Kbol = 150 min, CT/CP overestimated VT with increasing magnitude at later timepoints as a state of equilibrium is approached, although the magnitude of overestimation was smaller than that of bolus injections.15,20 Although SUVR-1 displayed smaller observed bias of BPND relative to CT/CP estimation of VT (as expected, given the cancellation of errors that occurs when dividing the target region by the reference tissue when calculating the SUVR), this B/I paradigm underestimated BPND (−3.4
Our group has recently reported on the development and utility of an 18F-labeled SV2A radiotracer, [18F]SynVesT-1 (also known as [18F]SDM-8), with comparable or improved imaging characteristics to that of [11C]UCB-J.5,14 There are a number of advantages of opting for an 18F over a 11C-labeled radiotracer. Their relatively long half-life (109.7 minutes for 18F vs. 20.4 minutes for 11C) allows for
A notable limitation of this work is the older (mean age of 54 years) and predominately male (90%) sample used for the [18F]SynVesT-1 studies. Furthermore, two individuals with major depressive disorder were included in our analysis of [18F]SynVesT-1; it is currently unknown how living with a chronic mood disorder could potentially impact tracer pharmacokinetics and pharmacodynamics in ways that would have biased the present findings. Therefore, it will be necessary to perform confirmation studies to ensure the B/I method is still valid in younger, female, or other clinical populations. Here it is also worth reiterating that SV2A PET acts as a surrogate (albeit, a well-defined and widely accepted surrogate) for historically postmortem measures of synaptic density.1 –4 However, an important caveat is that this method assumes that radiotracer affinity for SV2A is constant across the brain and across patient groups; this caveat also applies to virtually all PET tracers that bind to a brain protein. In addition, studies focused on a specific region of interest may want to reconsider the timing of the scan window, as not all brain regions display the same tracer uptake kinetics and therefore achieve a state of equilibrium at different times. Similarly, in cases where either VT or BPND, but not both parameters, is the desired outcome measure, the scan window could be shifted earlier (for CT/CP estimates of VT) or later (for SUVR-1 estimates of BPND). As a further consideration, investigators who desire to use VT as the outcome measure, blood sampling will still be required. However, we have previously demonstrated that less-invasive venous plasma can be used as a reliable estimate of the input function for other 18F-labled tracers, 21 a possibility we are actively perusing for SynVesT-1.
In summary, using a B/I approach with [11C]UCB-J, we were unsuccessful at consistently achieving a state of equilibrium across subjects, thus we were unable to identify a timeframe post injection when we could accurately and precisely estimate both VT and BPND. However, switching to the fluorinated SV2A tracer, [18F]SynVesT-1 the B/I method employed here could be used to closely estimate 1TC parameters; Specifically, using a 30-minute scan duration 90–120 minutes post [18F]SynVestT-1 injection produced CT/CP values that estimated VT and SUVR-1 values that estimated BPND 7
Supplemental Material
sj-pdf-1-jcb-10.1177_0271678X231200423 - Supplemental material for Evaluating infusion methods and simplified quantification of synaptic density in vivo with [11C]UCB-J and [18F]SynVesT-1 PET
Supplemental material, sj-pdf-1-jcb-10.1177_0271678X231200423 for Evaluating infusion methods and simplified quantification of synaptic density in vivo with [11C]UCB-J and [18F]SynVesT-1 PET by Ruth H Asch, Mika Naganawa, Nabeel Nabulsi, Yiyun Huan, Irina Esterlis and Richard E Carson in Journal of Cerebral Blood Flow & Metabolism
Footnotes
Authors’ contributions
R.H.A . prepared the first full draft of the manuscript. R.H.A . and M.N. were responsible for data analysis and interpretation. N.N. and Y.H. provided oversight of radiochemistry production and quality control. R.E.C. advised data analysis and interpretation. R.E.C. and I.E. were responsible for the study conception and design and provided critical feedback during manuscript preparation.
Acknowledgements
The authors would like to recognize the support and expertise provided by the Yale PET center staff. We also wish to thank the individuals who participated in these studies.
Declaration of conflicting interests
The author(s) declared the following potential conflicts of interest with respect to the research, authorship, and/or publication of this article: The radioligand 18F-SynVesT-1 is contained in the US patent US1151875482 and Y.H., N.N., and R.E.C. are listed as inventors.
Funding
The author(s) disclosed receipt of the following financial support for the research, authorship, and/or publication of this article: Financial support for this work was provided by R01NS094253 (R.E.C), R01AG052560, R01AG065474 (I.E.), and T32MH014276 (R.H.A.).
References
Supplementary Material
Please find the following supplemental material available below.
For Open Access articles published under a Creative Commons License, all supplemental material carries the same license as the article it is associated with.
For non-Open Access articles published, all supplemental material carries a non-exclusive license, and permission requests for re-use of supplemental material or any part of supplemental material shall be sent directly to the copyright owner as specified in the copyright notice associated with the article.