
Abstract
The aim of this study was to define the accuracy of 99mTc-ethyl cysteinate dimer-single photon emission computed tomography (99mTc-ECD-SPECT) in distinguishing transient ischemic attack from completed ischemic stroke at early stages after the onset of symptoms. In a prospective study we examined 82 patients within 6 hours after the onset of symptoms (neurologic deficit caused by middle cerebral artery ischemia) using both 99mTc-ECD-SPECT and computed tomography (CT). The follow-up was based on Scandinavian Stroke Scale (SSS) 24 hours and 5–7 days, as well as on CT 7 days, after the event. SPECT evaluation was performed both visually and using semiquantitative region-of-interest (ROI) analysis. According to visual SPECT analysis, on admission 59 of 82 patients had activity deficits in the symptomatic hemisphere. After 7 days, all these patients had neurologic symptoms (SSS 28 ± 12 points), caused by a cerebral infarction as evidenced with CT. Twenty-three of 82 patients displayed no early activity deficit despite clinical symptoms. None of these patients had neurologic symptoms after 7 days (indicating transient ischemic attack or prolonged reversible ischemic neurologic deficit). In the semiquantitative SPECT analysis, all patients had abnormal count densities in the respective ROI (activity <90% compared with the contralateral side). All patients with transient ischemia (n = 23) had count rate densities more than 70% of the respective contralateral ROI, whereas all patients with subsequent infarction (n = 59) had values < 70%. Use of 99mTc-ECD-SPECT allows transient ischemia to be distinguished from ischemic infarction using relative regional activity thresholds within the first 6 hours after onset of symptoms.
The consideration of new and aggressive therapies in patients with acute focal cerebral ischemia calls for reliable diagnostic information within a short therapeutic window. Within this period the following specific information is required: whether the symptoms are caused by stroke, where the stroke is located, and what subtype of stroke it is (Brass, 1997). Moreover, prognostication of the course of stroke is urgently required because it may range from complete neurologic restitution after a few hours (hereafter referred to as transient ischemic attack, [TIA]) to brain death within the following 3 to 5 days (“malignant” middle cerebral artery infarction). About a quarter of all patients who are admitted to hospital with acute focal cerebral ischemia do not need any specific (e.g., thrombolytic) therapy, as they spontaneously recover (Rothrock et al., 1995). Previously, however, it has not been possible to classify symptoms as TIA or minor stroke within the first few hours after the onset of symptoms, either clinically or by using computed tomography (CT). The accuracy of clinical diagnosis on admission ranges from 38% to 89% (von Arbin et al., 1981; Bamford, 1992).
Although acute CT is useful for distinguishing ischemia from intracerebral hemorrhage and other pathologic findings (e.g., brain tumor), it fails to identify ischemia within the first 3 hours after the onset of symptoms, and within a 3- to 6-hour period CT may show indirect signs of evolving infarction in the territory of the middle cerebral artery. Within the first 3 to 6 hours after cerebral ischemia, CT has a mean sensitivity of 82% for hemispheric infarcts (von Kummer et al., 1996). The use of magnetic resonance imaging (MRI) provided 7% to 20% false-negative results in acute stroke depending on the size of the infarcted area and the field strength (Alberts et al., 1992). Mohr et al. (1995) found no difference in diagnostic accuracy between MRI and CT within the first 4 hours after the onset of symptoms. Data of large prospective studies based on more recent MR techniques, such as diffusion-perfusion studies, MR angiography, flow imaging, and spectroscopy, are not yet available, although recent results suggested superiority of diffusion-perfusion MRI (Warach et al., 1996) or MRI with fluid-attenuated inversion recovery (FLAIR) sequences (Brant-Zawadzki et al., 1996) over conventional MRI in the early diagnosis of evolving cerebral infarction. Positron emission tomography (PET) examinations are difficult to schedule and have so far been limited to a small number of centers (Baron et al., 1989; Heiss, 1996; Bakker and Pauwels, 1997).
Some of the above questions may be answered by single photon emission computed tomography (SPECT). Immediately after the onset of ischemia, SPECT may show the location, size, and extent of decreased or fully impeded cerebral blood flow (Hanson et al., 1993; Laloux et al., 1995; Masdeu and Brass, 1995). Like routine CT, SPECT scans can be visually analyzed quickly and simply; any focal perfusion deficits present can be recognized, and their size and localization can be described (Alexandrov et al., 1996a).
State-of-the-art cameras produce high-quality images within 10 to 20 minutes at a spatial resolution of 7 mm. The sensitivity and specificity of SPECT have been reported to range from 86% to 98% within the first few hours after infarction (Yeh et al., 1986; Brass et al., 1994; Weir et al., 1997), albeit with a number of limitations (unblinded interpretation, retrospective analysis, small number of patients; Brass et al., 1994). Although the potential benefit of SPECT examinations for clinical trials and therapy decisions has been emphasized, no prospective studies on the role of SPECT within 6 hours after the onset of symptoms have so far been reported (Alexandrov et al., 1996b).
99mTc-HMPAO and 99mTc-ECD are newer radiopharmaceuticals for SPECT imaging of local cerebral blood flow (Ell et al., 1985; Léveillé et al., 1989). However, previous studies using SPECT for early diagnosis of cerebral ischemia were exclusively carried out using 99m Tc-HMPAO (Giubilei et al., 1990; Shimosegawa et al., 1994; Alexandrov et al., 1995). Because 99mTc-ECD cerebral uptake has been shown to be dependent not only on perfusion but also on the metabolic state of brain tissue (Shishido et al., 1995; Jacquier-Sarlin et al., 1996), the objective of the present study was to test the usefulness of 99m Tc-ECD-SPECT for the acute diagnosis of cerebral ischemia in the territory of the middle cerebral artery. The particular question was whether it is possible to distinguish patients with transient cerebral ischemia from those with completed infarction within the first 6 hours after the onset of symptoms.
PATIENTS AND METHODS
Between January 1996 and April 1997 227 patients with ischemic stroke were admitted to our Neuro Critical Care Unit. From this cohort, 82 patients (53 men, 29 women) who met the following inclusion and exclusion criteria were enrolled in this prospective study. Inclusion criteria were age 18 to 80 years; sudden onset of a focal neurologic deficit in the territory of the middle cerebral artery (MCA); first stroke; a Scandinavian Stroke Scale (SSS) at the time of injection of 99mTc-ECD below 40 points; and SPECT examination within 6 hours after the onset of symptoms. Exclusion criteria were coma; rapid improvement of the symptoms by the time of SPECT examination; abnormal CT not consistent with focal ischemia in the MCA territory (e.g., intracerebral hemorrhage, vascular encephalopathy); vertebrobasilar stroke. Patients were treated after early CT and SPECT imaging. Sixty-eight patients received solely heparin intravenously as a means of early secondary prevention (doubling of the partial thromboplastin time) for at least 24 hours, and generally until the safe exclusion of a cardiac embolism source. The last 14 patients were part of an ongoing double-blinded, placebo-controlled trial and were treated randomly with recombinant tissue plasminogen activator or placebo. The study was approved by the local ethics committee.
99mTc-ECD-SPECT
Resting patients with their eyes open were injected with 400 MBq 99mTc-ethyl cysteinate dimer (ECD) in a quiet, dimly lit room. After injection of the radiopharmaceutical, the subjects were kept in the same condition for an additional 5-minute period. Imaging was begun 10 to 15 minutes after the injection. Photons were registered using a brain-dedicated SPECT camera (Ceraspect, DSI, Walham, MA, U.S.A.) with three rotating parallel hole-collimators. The spatial resolution obtained with the system is about 7 mm. Within 20 minutes (360° rotation, 120 projections) 1 to 1.5 million counts were collected in a 128 × 128 × 64 matrix. The data were reconstructed by standard filtered back-projection using a two-dimensional Butterworth filter (cutoff 0.95, order 10). Images were corrected for attenuation by Chang's first-order method (attenuation coefficient, μ = 0.15 cm−1). For reorientation the transversal slices were inclined 15° to the canthomeatal line, corresponding to Talairach and Tournoux's stereotactic system of coordinates (Talairach and Tournoux, 1988). The addition of four contiguous slices each resulted in a slice thickness of 6.8 mm (corresponding to the system's spatial resolution).
The SPECT data were analyzed (1) visually and (2) semiquantitatively using region of interest (ROI) analysis.
Visual analysis. Tomograms were visually analyzed (H.B., S.H., J.B.) immediately after activity registration. This analysis was based on brain slices in three plane orientations (coronal, sagittal, transversal). Images were classified as showing either symmetrical tracer uptake or focal deficits in an area corresponding to the neurologic deficit. The investigators were aware of the lateralization of the neurologic deficit, but were not aware of the degree of the clinical symptoms (Scandinavian Stroke Scale) on admission or on day 7.
Semiquantitative ROI analysis. For semiquantitative ROI analysis, 5 transversal and 3 coronal slices were selected at predefined distances from the commissura anterior to commissura posterior (CA-CP) line (transversal slices: Talairach coordinates = −20 mm, +1 mm, +8 mm, +21 mm, +34 mm) and from the line perpendicular to the aforementioned CA-CP line cutting the commissura anterior (coronal slices: Talairach coordinates = +5 mm, −16 mm, −37 mm), respectively. In these 8 slices, 88 ROI were generated using a commercial program (Cerespect, DSI) and were assigned to anatomic structures using the stereotactic atlas (Talairach and Tournoux, 1988). Count densities of ROI of the symptomatic hemisphere were related to those of the corresponding contralateral regions and classified as “abnormal” if a deficit exceeded 10% (ratio ⩽0.90) in agreement with widely accepted standards (Podreka et al., 1987; Hanson et al., 1993). In line with Hanson et al. (1993), we also used the “SPECT graded scale”-a measure of the intensity and spatial extent of activity deficits. Each ROI was given a score of 0 to 9, where 0 indicated a ratio ⩾0.91; 1 a ratio of 0.81 to 0.9 (corresponding to 81% to 90% activity compared with the contralateral side); 2 a ratio of 0.71 to 0.8, and so forth. The scores for all individual ROI were added up to produce the SPECT graded scale.
Computed tomography
Nonenhanced cranial CT scans were obtained (Siemens, Somatom Plus S, Erlangen, Germany) immediately after admission within 6 hours of the onset of symptoms. Slice thickness was 5 mm. A second CT scan was carried out after 24 to 36 hours, and a third after 7 ± 2 days. Patients with normal second CT and no neurologic deficits after 24 hours did not undergo third CT.
Clinical investigations and follow-up
The Scandinavian Stroke Scale (46 points maximum; without “gait”) was determined immediately before the injection of 99mTc-ECD, 24 ± 2 hours after the onset of symptoms, and after 7 ± 1 days.
Two groups were formed: patients with spontaneous full recovery (SSS = 46 points) within 24 hours (by definition classified as TIA) or 7 days (PRIND, prolonged reversible ischemic neurologic deficit) (according to the National Institute of Neurological Disorders and Stroke 1990), and patients with sustained neurologic deficit (SSS < 46 points) after 7 days.
Statistical analysis
Clinical data and SPECT findings of both groups were compared using the Mann-Whitney U test, as well as Student's t test for unpaired data with the level of significance at 0.05. Intraobserver variability of visual SPECT analysis was calculated using the Kendall-W test after repeated analysis of 40 studies. Interobserver variability of visual analysis was calculated using Kendall-W test after comparing the scores of the three independent observers. Relative risk of cerebral infarction was calculated for visual SPECT analysis, quantitative SPECT analysis (number of abnormal ROI, maximal activity ratio, and SPECT graded scale), and SSS on admission after defining cutoff values for the parameters with help of corresponding scatter plots. To identify independent parameters for differentiation between TIA or PRIND and completed infarction, logistic regression was performed by stepwise forward selection of variables with Wald's test using the statistical software SPSS.
RESULTS
Clinical and computed tomography findings
The patients' average age was 63 ± 11 years, and the mean Scandinavian Stroke Scale on admission was 31 ± 8 points (10 to 39 points). In 38 of 82 patients baseline CT showed early signs of infarction.
After 24 hours, 16 patients had no symptoms (indicating TIA). Another 7 patients were free of symptoms after 7 days (indicating PRIND). The remaining 59 patients displayed neurologic deficits after 7 days with a mean SSS of 28 ± 12 (0 to 43) points. In all 59 patients CT exhibited ischemic infarctions in the territory of the MCA on day 1 and day 7. Of the 23 patients with TIA or PRIND, however, only 1 patient had a CT showing a lacunar infarction.
The SSS recorded on admission was revealed to be lower in patients who later evolved completed infarction than in those with TIA or PRIND, on average (Table 1). All patients with TIA or PRIND had an SSS of more than 30 points on admission. In the group with infarction, however, 30 patients had an SSS of more than 30 points as well (Fig. 1). In only 16 of these 30 patients did the CT show early signs of infarction.
Comparison of clinical, CT, and SPECT findings in patients with completed stroke versus patients with TIA/PRIND
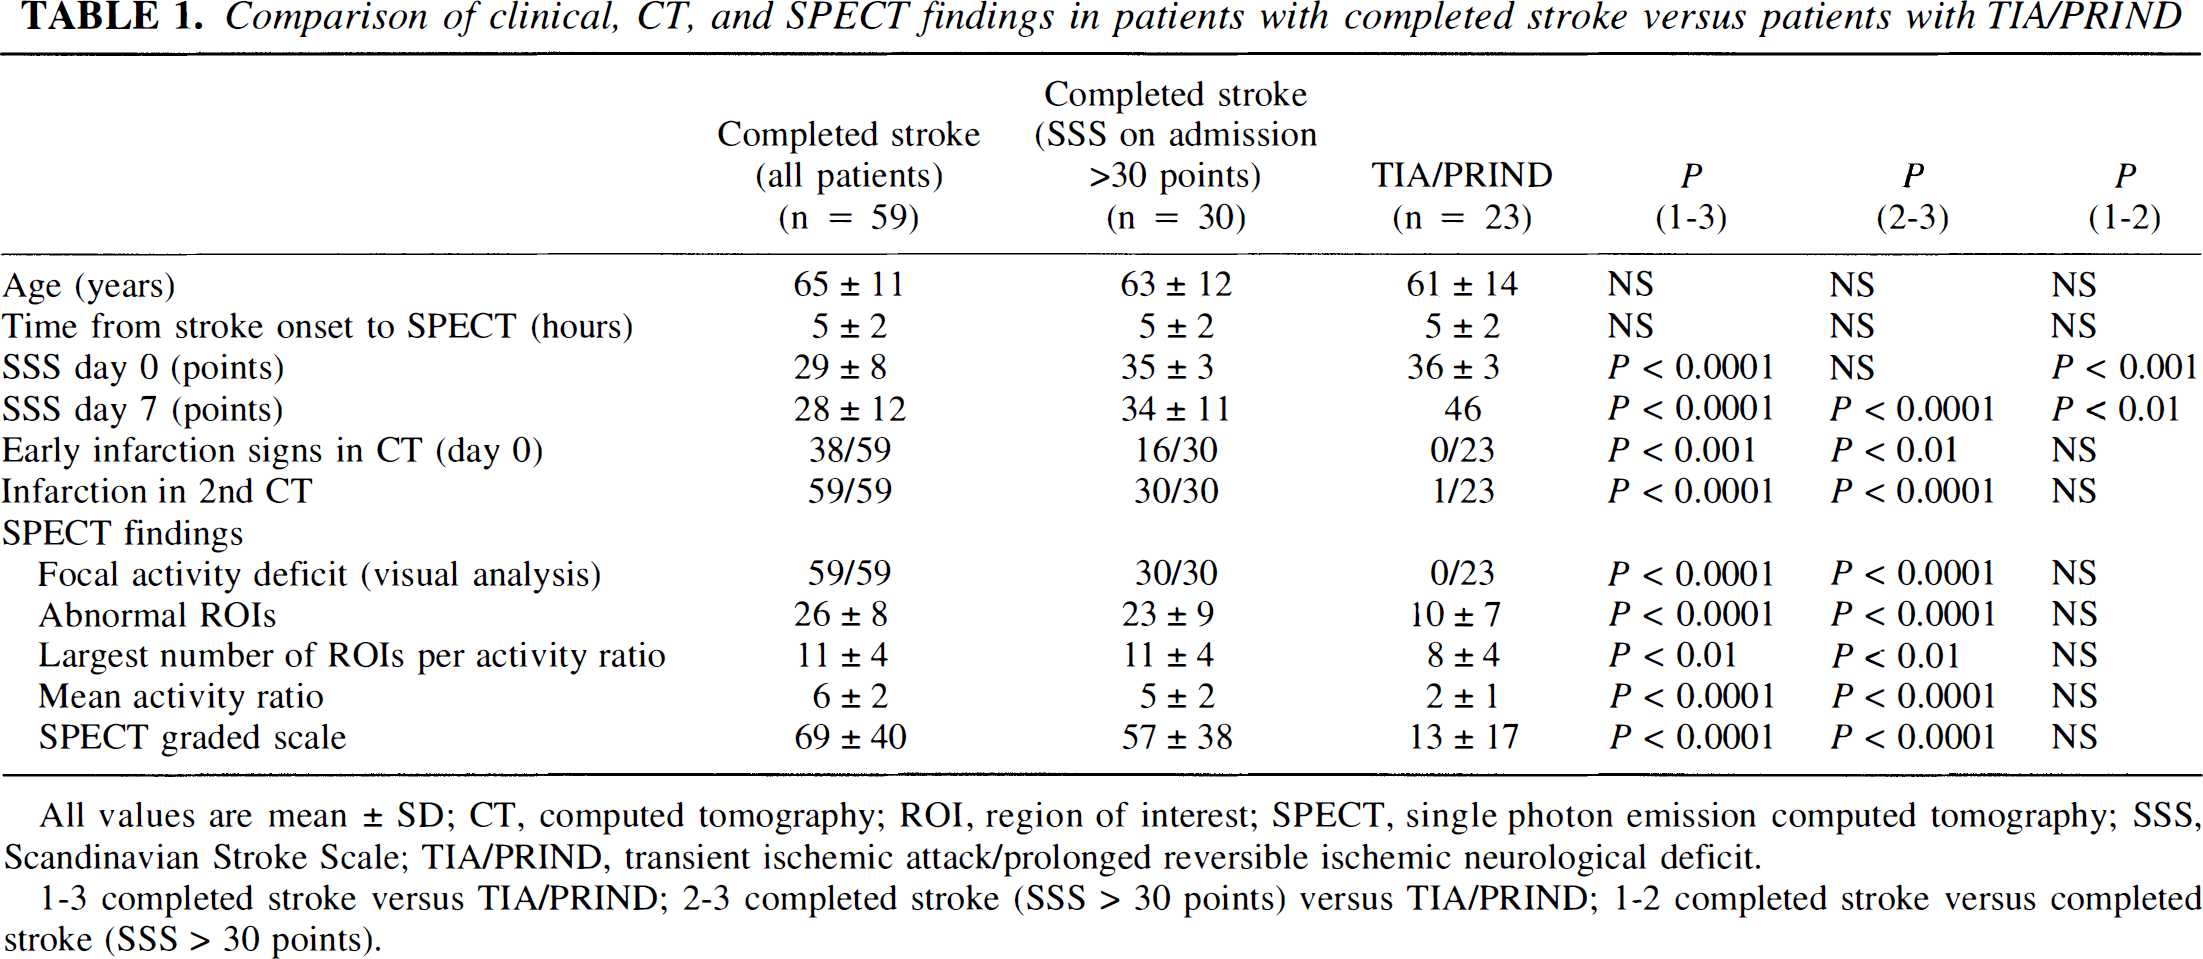
All values are mean ± SD; CT, computed tomography; ROI, region of interest; SPECT, single photon emission computed tomography; SSS, Scandinavian Stroke Scale; TIA/PRIND, transient ischemic attack/prolonged reversible ischemic neurological deficit.
1–3 completed stroke versus TIA/PRIND; 2–3 completed stroke (SSS > 30 points) versus TIA/PRIND; 1–2 completed stroke versus completed stroke (SSS > 30 points).
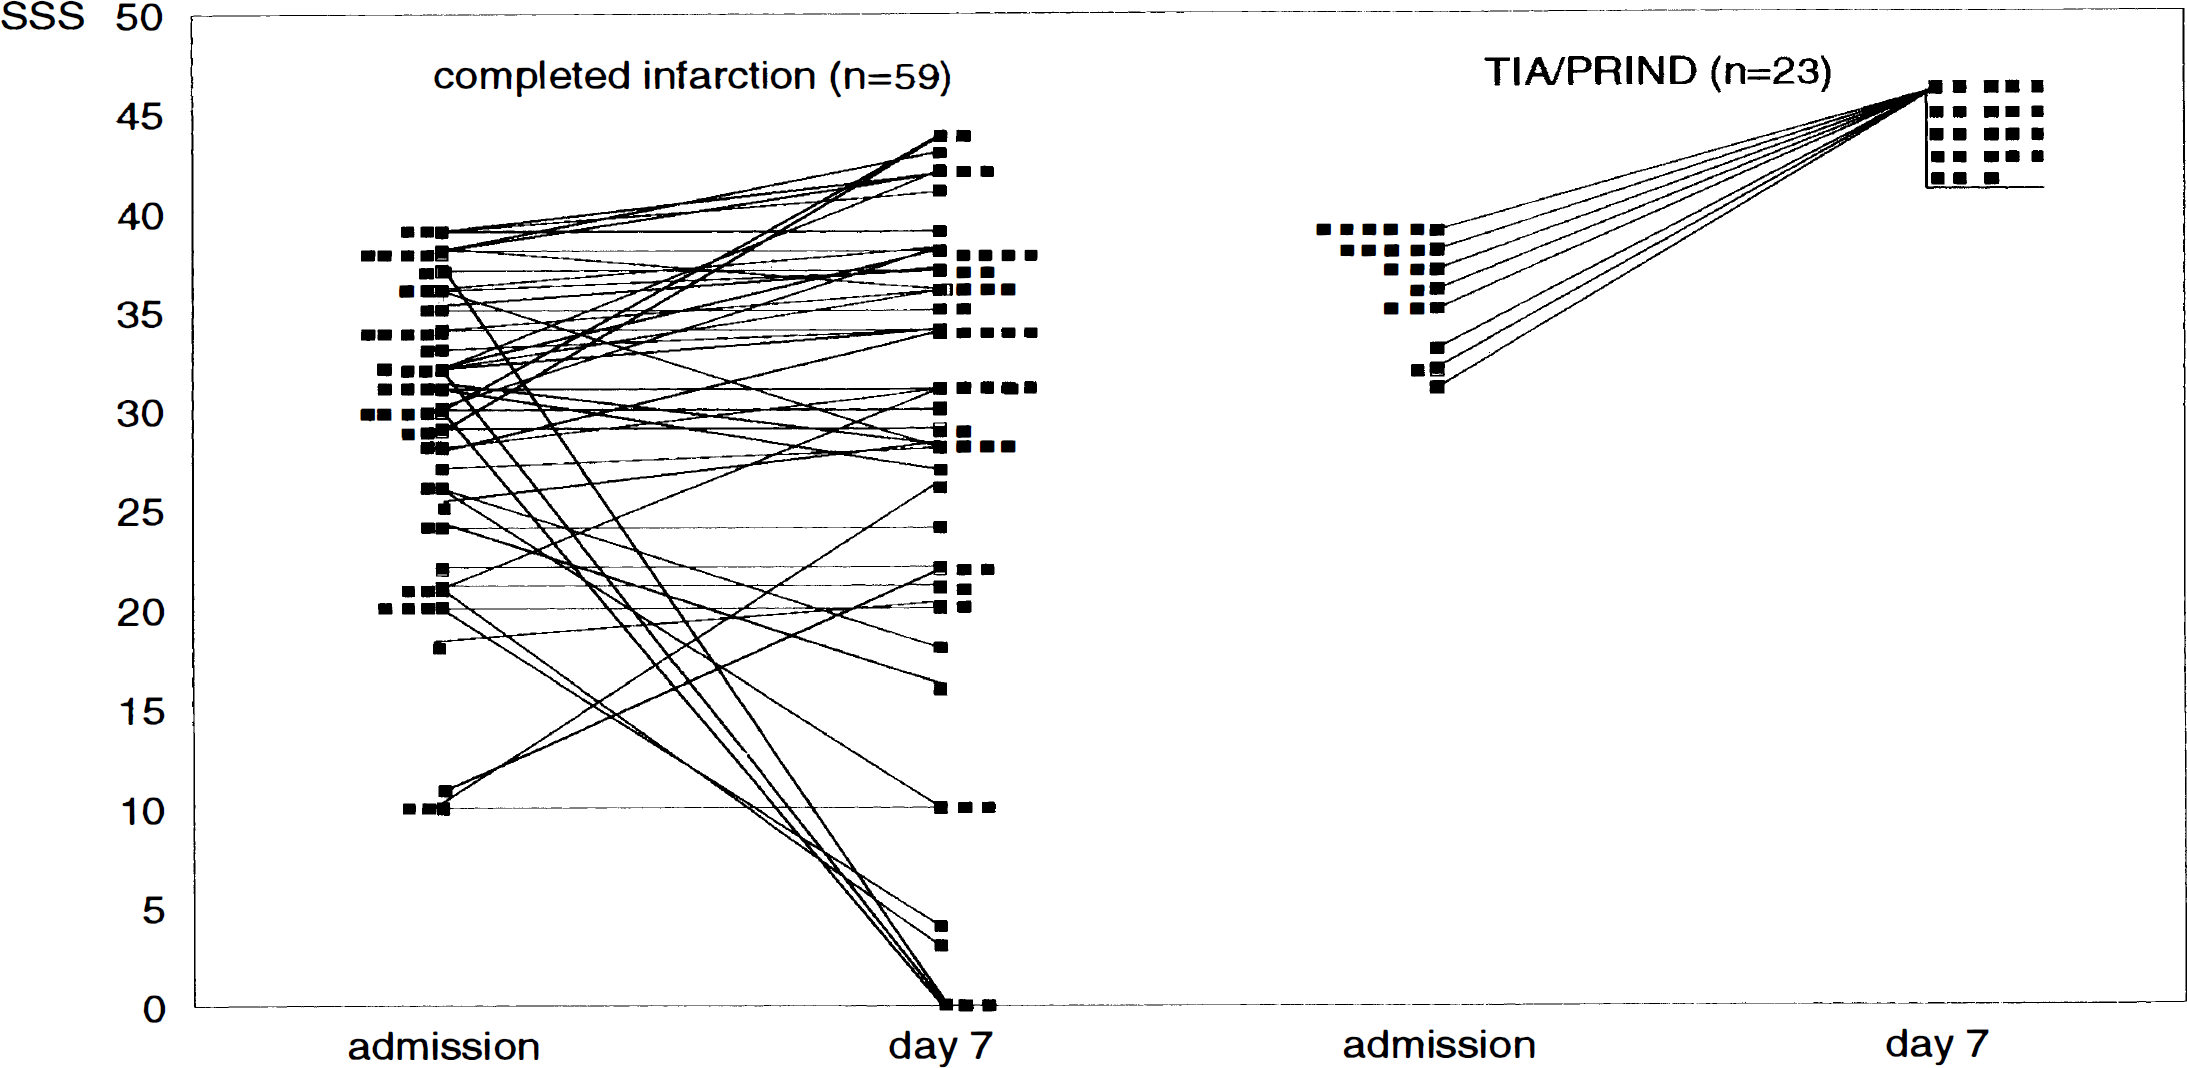
Comparison of the clinical findings (SSS) on admission and day 7 in patients with completed stroke and patients with transient ischemic attack or prolonged reversible ischemic neurologic deficit (TIA or PRIND). PRIND, prolonged reversible ischemic neurologic deficit; SSS, Scandinavian Stroke Score; TIA, transient ischemic attack.
SPECT findings
All 82 patients who were enrolled in this study had technically successful SPECT scans. In case of patient movement, scanning was briefly stopped and restarted to avoid artifacts. SPECT examinations were carried out 5 ± 2 (1 to 6) hours after onset of symptoms on average. In 59 of 82 patients visual analysis revealed focal activity deficits in the territory of the MCA consistent with the clinical symptoms. In all 59 patients with focal activity deficit, this deficit sustained in the MCA territory and was paralleled by CT signs of MCA infarctions as well as by neurologic deficits (SSS <46 points) after 7 days (Fig. 2). Of the 23 patients with no visible activity deficit, only 1 patient developed a lacunar infarction. All 23 patients were symptom-free after 7 days. Interobserver variability of the visual SPECT analysis equaled 2.0% (w = 0.97, P < 0.001); intraobserver variability of the visual scoring (n = 40) equaled 3.4% (w = 0.95, P = 0.003). Table 2 shows the relative risk values (95% confidence intervals) for completed infarction regarding age, sex, SSS on admission, and the above SPECT parameters. Logistic regression was performed to identify parameters that were independently able to predict cerebral infarction. Apart from visual and quantitative SPECT analysis, only SSS on admission had significant predictive value for completed infarction.
Relative risk values for completed stroke regarding age, gender, SSS on admission and the above SPECT parameters
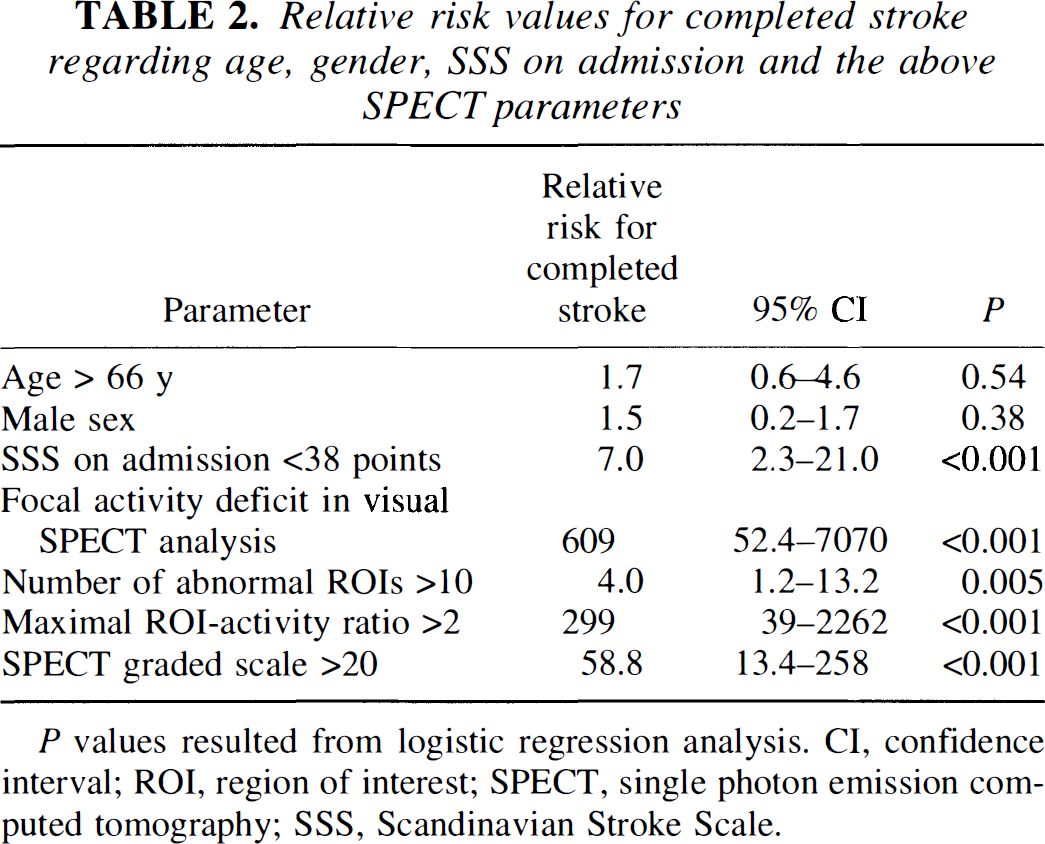
P values resulted from logistic regression analysis. CI, confidence interval; ROI, region of interest; SPECT, single photon emission computed tomography; SSS, Scandinavian Stroke Scale.
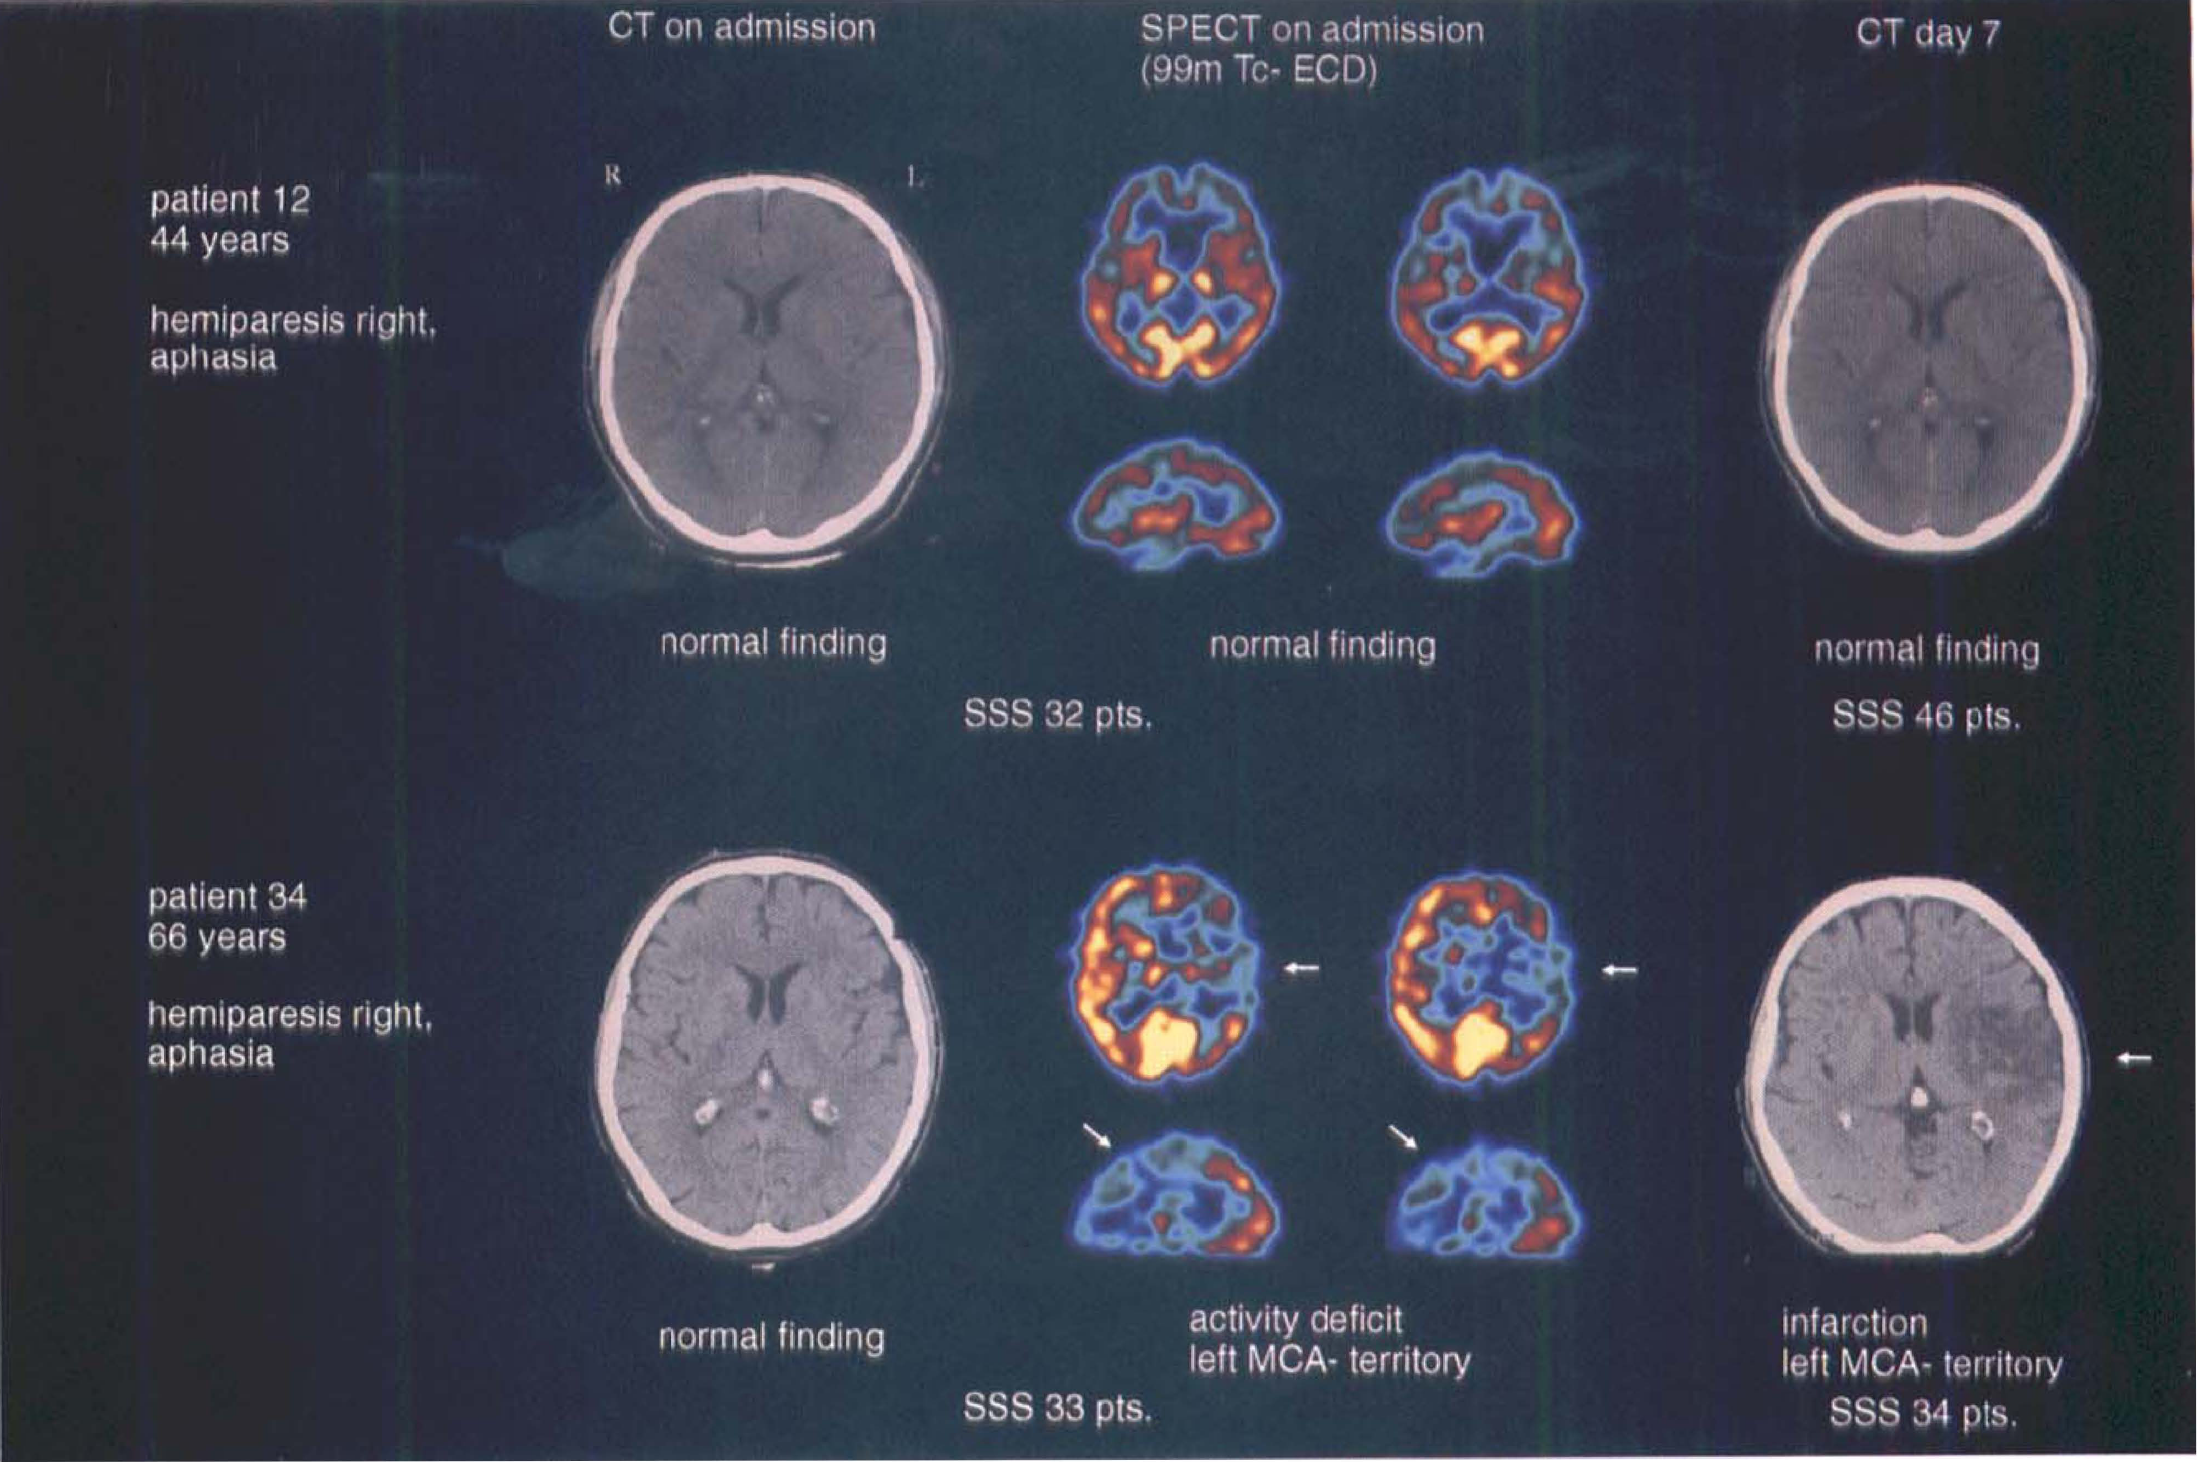
Comparison of CT and SPECT images of a patient with completed stroke and a patient with TIA. CT, computed tomography; MCA, middle cerebral artery; SSS, Scandinavian Stroke Score; SPECT, single photon emission computed tomography; TIA, transient ischemic attack.
In all patients computer-based SPECT analysis showed abnormal count densities in ROI corresponding with the individual neurologic deficits. Comparing both groups the number of abnormal ROI and the largest number of abnormal ROI per activity ratio were significantly different (Table 1).
All patients with transient ischemia had count densities in the respective ROI of more than 70%, whereas all patients with subsequent completed infarction had values less than 70% (Fig. 3). Only one patient in the TIA or PRIND group had a abnormal ROI with an activity level of 3 (corresponding to 61% to 70% activity). This patient later showed in CT a lacunar infarction.
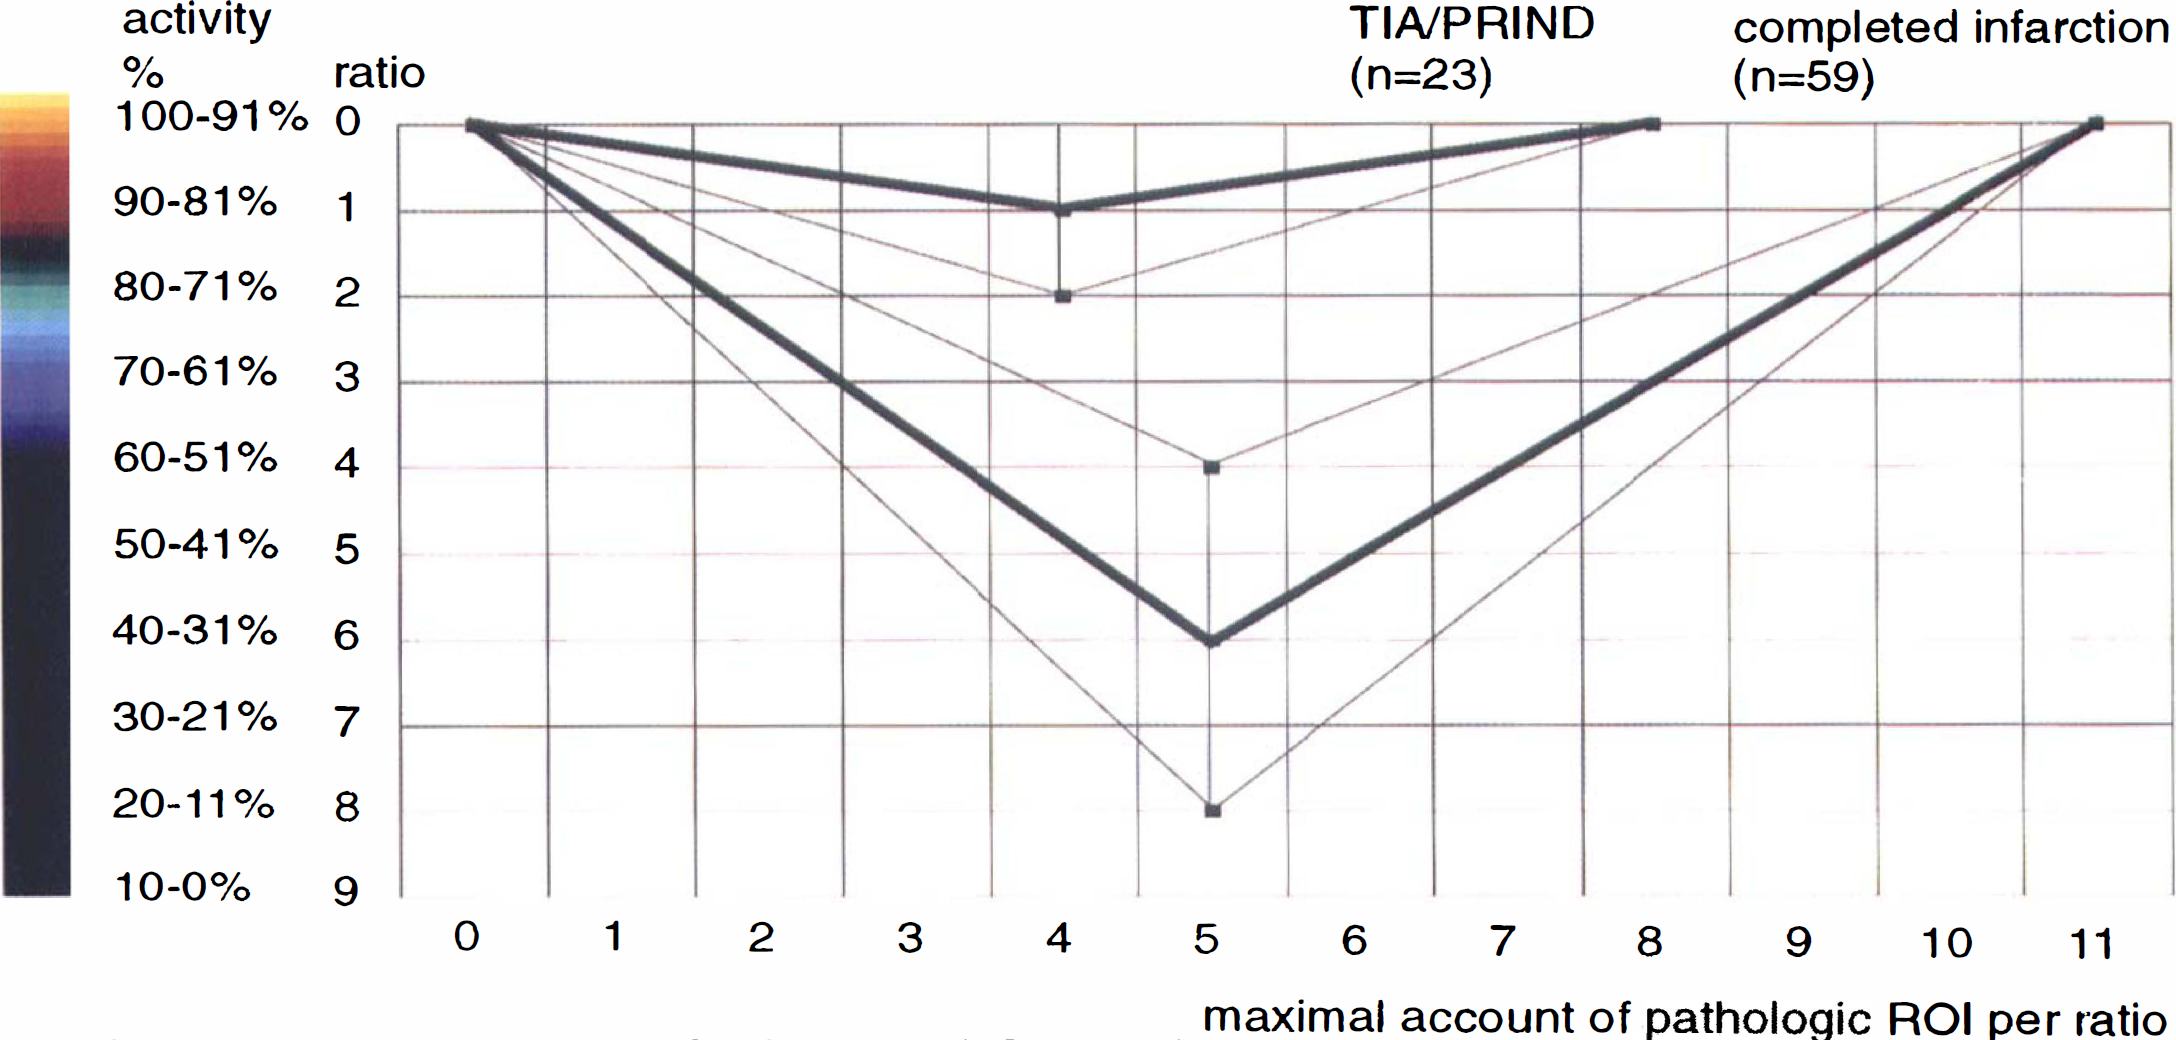
Comparison of the semiquantitative SPECT analysis (ROI analysis) in patients with completed stroke versus patients with TIA or PRIND. activity, activity in comparision to the contralateral side; PRIND, prolonged reversible ischemic neurologic deficit; ROI, region of interest; SPECT, single photon emission computed tomography; TIA, transient ischemic attack.
The average SPECT graded scale calculated was more than 5 times higher in the group of completed infarction than in the TIA or PRIND group (69 versus 13). Fifty-five of 59 patients with completed infarction and only 2 of 23 patients with TIA or PRIND had a SPECT graded scale exceeding 20. When comparing the SPECT findings of 30 patients with completed stroke who, like the patients with TIA or PRIND, had on admission an SSS of more than 30 points, equally clear division was apparent between the two groups in all SPECT parameters examined (Table 1).
Fourteen of the 82 patients were part of an ongoing double-blind trial with recombinant tissue plasminogen activator. Of these 14 patients, 4 had transient ischemia, whereas 10 suffered completed stroke. All 4 patients with transient ischemia had no visible activity deficit in SPECT examination and count densities in the respective ROI of more than 70%. To discount the possible effect of thrombolytic therapy, we reanalyzed our data without this subgroup of 14 patients. The analysis of 68 patients (Table 3) who had not undergone possible thrombolytic therapy exhibited the same clinical, CT, and SPECT findings when comparing patients with transient ischemia and completed stroke with the entire group of 82 patients.
Comparison of clinical, CT, and SPECT findings in patients with completed stroke versus patients with TIA/PRIND (excluding patients who underwent thrombolytic therapy)
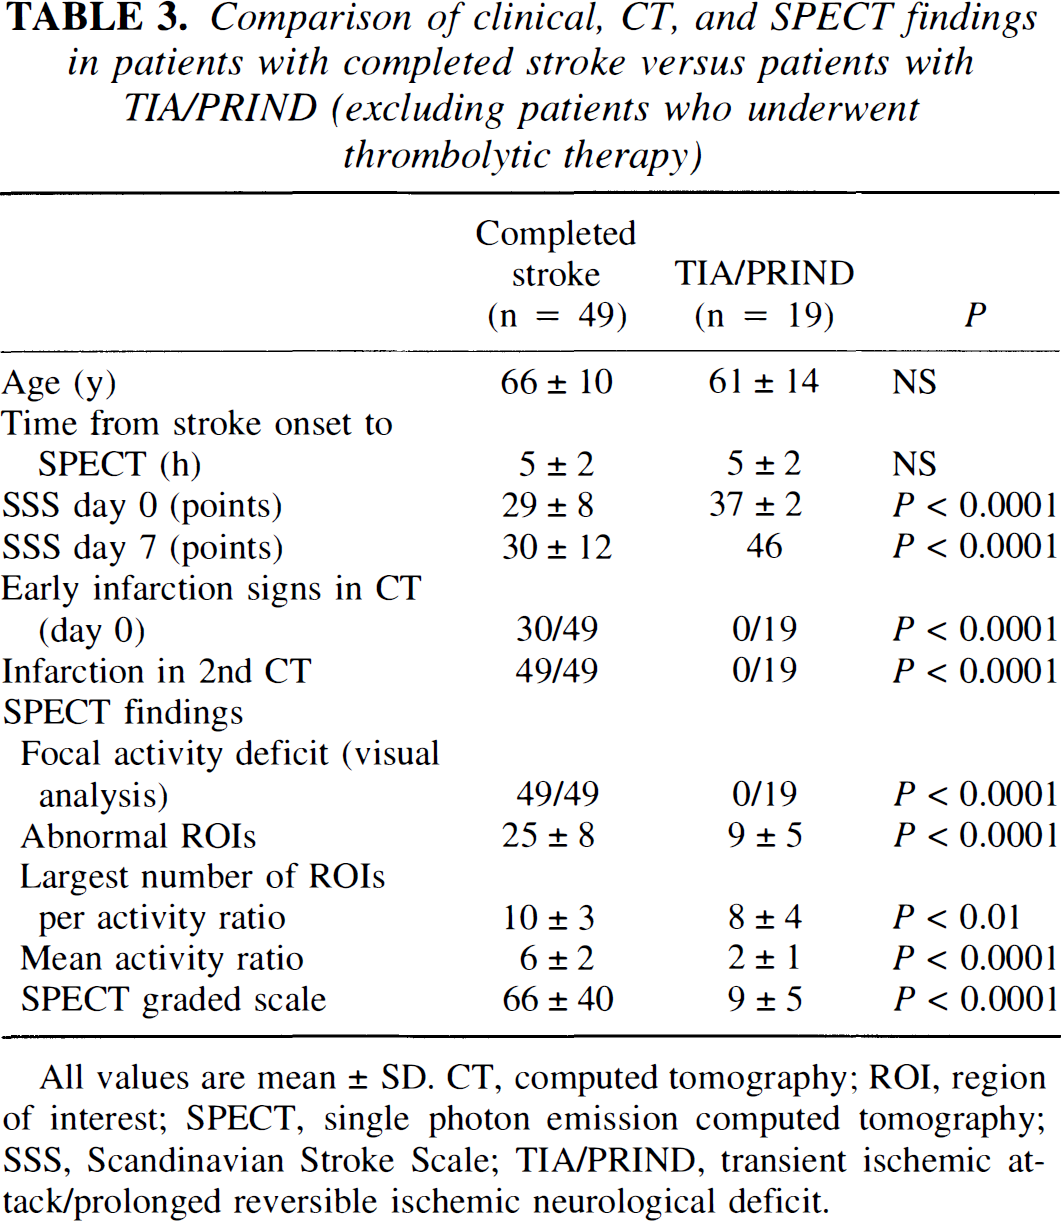
All values are mean ± SD. CT, computed tomography; ROI, region of interest; SPECT, single photon emission computed tomography; SSS, Scandinavian Stroke Scale; TIA/PRIND, transient ischemic attack/prolonged reversible ischemic neurological deficit.
DISCUSSION
This prospective study was designed to define the accuracy of SPECT in the differentiation between transient ischemia and evolving cerebral infarction within the territory of the MCA as early as 6 hours or less after onset of symptoms. All patients in the study were recruited in agreement with the inclusion and exclusion criteria used for the ECASS-1 study (Hacke et al., 1995) and other stroke trials using the same time-window of 6 hours. At the time of SPECT imaging, all patients had moderate to severe neurologic deficits (SSS <40 points). On average, patients evolving completed infarction had significantly less points on the SSS than those with TIA or PRIND. The range of scores of the first group, however, was extremely large. Therefore, about every second patient who developed completed infarction had an SSS score within the range of TIA or PRIND patients, i.e., more than 30 points. Because about 2 of 3 patients enrolled in the study by using the above criteria had SSS more than 30 points, the same proportion of individuals who were candidates for thrombolysis were not able to be classified regarding their prognosis using clinical scales. Within the same early period after the onset of symptoms, the presence of early infarction signs on CT was always predictive of completed stroke. In more than 50% of the patients such signs were absent. The absence of early infarction signs, however, had no predictive value for TIA or PRIND or completed infarction.
Visual interpretation of 99mTc-ECD-SPECT separated these two groups within the first 6 hours after the onset of symptoms. In all patients with activity deficits, CT after a delay of 5 days showed infarction, whereas all patients without visible activity deficit had transient ischemia without subsequent lesions evidenced by CT.
One of the aims of this study was to establish criteria for the above classification, which required quantitative image assessment. Using ROI analysis we found that even the group of patients with TIA or PRIND had abnormalities in their cortical activity distribution. Using an activity threshold of 70% (referring to the activity of the contralateral region as 100%), however, group separation was as effective as by visual interpretation. This corresponds to the results of a study by Bogousslavsky et al. (1990), who pointed out that a reduction in cerebral blood flow of more than 30% within a few days after the onset of neurologic deficits was likely to be associated with subsequent infarction.
Whereas in our study the extent of activity deficits alone (number of abnormal ROI) was not predictive for the subsequent outcome, the SPECT graded scale as a combination of the size and the severity of activity was found to be an excellent discriminator between the two groups.
Comparing the results of this present study with studies previously published is difficult owing to the differences in the study design and tracers used. A study on a group of patients of similar size and using SPECT within the same short time-window after onset of neurologic deficits has not yet been reported. Alexandrov et al. (1995) examined 18 patients with stroke and 12 patients with TIA using 99m Tc-HMPAO-SPECT. However, only 4 of these 12 patients still had clinical symptoms at the time of examination. In combination with transcranial Doppler sonography, they correctly prognosticated 10 of 12 patients with TIA or minor stroke. Of 31 patients with focal cerebral ischemia, Shimosegawa et al. (1994) observed 5 patients without a visible activity deficit in 99mTc-HMPAO-SPECT who did not develop stroke according to CT or clinical outcome. Reversible and irreversible structural brain damage in their series was separated when a threshold of 40% activity reduction was used compared with the healthy side. Giubilei et al. (1990) examined 32 patients within 6 hours with 99mTc-HMPAO-SPECT. All patients with an asymmetry index (affected versus contralateral area) of less than 60% had a poor prognosis; patients with an asymmetry index of more than 60% had a good outcome. After 6 hours, the prognostic value of 99mTc-HMPAO-SPECT deteriorated owing to postischemic hyperemia (absolute or relative luxury perfusion).
Hartmann (1985) examined 20 patients with TIA using the 133Xe inhalation technique. In 14 patients regional CBF was determined during the presentation of clinical symptoms. He found a significantly reduced mean CBF in the affected hemisphere compared with the contralateral side and with a control group with a similar risk profile. The flow in affected areas was on average reduced by 25.1% ± 11.7%. However, all CBF levels were above the level where electrical function is affected, and none of the patients developed an infarction according to follow-up CT. Three of the 20 patients with TIA had arteriosclerosis with narrowing and 2 of the 20 patients had occlusion of the internal carotid artery. Of our 23 patients with TIA or PRIND, 1 patient had occlusion and 2 patients had hemodynamically relevant stenoses of the internal carotid artery. We found no visible activity deficit in these patients either. This contrasts with Laloux et al. (1996), who in 3 of 8 patients with severe carotid artery occlusive lesions in the 99mTc-HMPAO-SPECT performed within a mean time interval of 18 hours and 4 days after TIA found a persistent perfusion defect. One reason for this could be the different tracers, although 99mTc-HMPAO better reflects the perfusion, so that in patients with carotid artery occlusive disease a chronic regional hemodynamic insufficiency could be the cause of persisting hypoperfusion. However, the collateral flow is sufficient to protect the brain tissue from infarction, but not to restore normal regional CBF. Examination with 99mTc-ECD, which probably better reflects the metabolic status of the brain tissue, ought therefore (as was to be seen in our patients) not to highlight perfusion deficits as the brain tissue is intact.
Using PET examinations, Marchal et al. (1996) showed that cerebral areas with early postischemic hyperperfusion and low oxygen extraction fraction (OEF) were able to recover. In the hyperperfused areas the CMRo2 was preserved or even significantly increased, reflecting stimulation of protein synthesis and protein phosphorylation, which is associated with tissue viability. The cause of hyperperfusion was assumed to be the reperfusion of a prior penumbra, a mechanism which Baird et al. (1995) showed to be “spectacular shrinking deficit” using SPECT. By contrast, ischemic penumbral tissue was characterized by a very high OEF, low CMRo2, and a low CBF. However, the ultimately infarcted penumbra showed in contrast to the subsequently recovered penumbra lower CBF and CMRo2 values, indicating that reperfusion occurred too late or that irreversible tissue damage had already set in (Furlan et al., 1996).
Against this pathophysiologic background it is apparent that merely distinguishing between TIA and PRIND or RRIND (rapid reversible ischemic neurologic deficit) is insignificant. This type of temporal classification is per se retrospective and not pathophysiologically orientated, and ought therefore to be ignored.
Different from the studies quoted dealing with acute SPECT in cerebral ischemia, in this present study 99mTc-ECD was administered instead of 99mTc-HMPAO. Though both agents represent the new generation of radiopharmaceuticals for local cerebral blood flow imaging with SPECT (Holman et al., 1989; Léveillé et al., 1992; Walovitch et al., 1991), 99mTc-ECD cerebral uptake has been evidenced to be codetermined by the metabolic status of brain tissue. Shishido et al. (1995) reported that 99mTc-ECD uptake was correlated to the cerebral metabolic rate of oxygen (CMRo2) as determined with PET and that the correlation between 99mTc-ECD uptake and CBF was less significant. The results of Shishido et al. are paralleled by those of a combined SPECT and PET study by Ishizu et al. (1996). Jacquier-Sarlin et al. (1996) pointed out that the presence of cytosolic esterase, which is related with viability of cells, is essential for the retention of 99mTc-ECD in brain tissue. Because of this causality, luxury perfusion obviously does not increase 99mTc-ECD uptake, whereas increased 99mTc-HMPAO uptake reflects local blood flow. Therefore, disintegration of brain tissue may remain undiscovered with 99mTc-HMPAO, whereas 99m Tc-ECD has been suggested to reveal the degree of brain lesions by compromised activity retention (Nakagawara et al., 1994; Lassen and Sperling, 1994; Devous, 1995). Accordingly, in none of the patients of this present study was local 99mTc-ECD activity increased within a brain area corresponding to the neurologic deficit. This result obtained in a relatively large number of patients lends further support to the suggestion that evolving cerebral infarction may not be masked by luxury perfusion when 99mTc-ECD is used.
Precisely what therapeutic implications the findings of our study could have currently remain open. If (as appears to be the case) 99mTc-ECD reflects not so much perfusion as metabolism, it is probably not the ideal tracer for screening patients for thrombolytic therapy as this aims to improve perfusion. Moreover, the question must be asked whether a visible activity deficit is always an expression of tissue necrosis and thus whether these patients are even to be excluded from thrombolytic therapy. The few patients included in our study who received thrombolytic therapy “blind” for us showed no difference from the other patients. Moreover, in none of our patients did we observe a correlative for the “spectacular shrinking deficit” as described by Baird et al. (1995) concerning some of their patients. Only a study with a larger number of patients treated with thrombolysis accompanied by follow-up examinations with 99m Tc-ECD-SPECT will be able to definitively answer these questions.
In conclusion, brain SPECT with 99mTc-ECD within a short time interval after the onset of neurologic deficits is extremely accurate in differentiating between TIA or PRIND and evolving completed infarction. This examination is rapid and can be assessed on a visual interpretation basis as well as using quantitative criteria of regional activity uptake. Its proper place in the acute stroke protocol is immediately after CT (to exclude cerebral hemorrhage). Performed less than 6 hours after onset of symptoms it may have an impact on patient management-and possibly also on the decision to apply specific stroke therapies, e.g., thrombolysis.