
Abstract
Quantification of vascularization volume can provide valuable information for diagnosis and prognosis in vascular pathologies. It can be adapted to inform the surgical management of gliomas, aggressive brain tumors characterized by exuberant sprouting of new blood vessels (neoangiogenesis). Filtered ultrafast Doppler data can provide two main parameters: vascularization index (VI) and fractional moving blood volume (FMBV) that clinically reflect tumor micro vascularization. Current protocols lack robust, automatic, and repeatable filtering methods. We present a filtrating method called Multi-layered Adaptive Neoangiogenesis Intra-Operative Quantification (MANIOQ). First, an adaptive clutter filtering is implemented, based on singular value decomposition (SVD) and hierarchical clustering. Second a method for noise equalization is applied, based on the subtraction of a weighted noise profile. Finally, an in vivo analysis of the periphery of the B-mode hyper signal area allows to measure the vascular infiltration extent of the brain tumors. Ninety ultrasound acquisitions were processed from 23 patients. Compared to reference methods in the literature, MANIOQ provides a more robust tissue filtering, and noise equalization allows for the first time to keep axial and lateral gain compensation (TGC and LGC). MANIOQ opens the way to an intra-operative clinical analysis of gliomas micro vascularization.
Keywords
Introduction
Gliomas are characterized by exuberant neoangiogenesis, a key event in tumor growth1,2 and their diffusely infiltrating nature. 3 Currently, neoangiogenesis is evaluated either by using perfusion MRI sequences, or histologic assessment of tumor tissues obtained by biopsy during surgery. Both these techniques have deficiencies. MRI, realized with the skull closed allows for a 3D analysis but the spatial resolution is of the order of mm which do not make possible to visualize small vessels. Histological analysis, marked by biopsy tissue sampling errors, is affected by outcomes that are not always representative of the whole tumor. Gliomas are heterogeneous tumors and intratumoral vascularization spots are easily missed by biopsy sampling. Intraoperative Doppler ultrasound is a promising method for more precise evaluation of neoangiogenesis.
In addition, the opening of the skull causes a displacement of the brain within the cranial cavity. It is therefore essential for the surgeon to have a real time imaging tool. Ultrasound imaging is ergonomic and therefore particularly suitable for real-time imaging. Thus, it has been shown that the B-mode imaging allows a more accurate resection, confirmed on post-operative MRI examination. 4 However, neuronavigation MRI and B-mode ultrasound imaging do not allow the surgeon to delimit tumoral vascular infiltration. High echogenicity does not necessarily imply high blood perfusion. Quantifying vascularization by ultrasensitive Doppler would help the neurosurgeon to better delimit vascular infiltration of the tumor in the brain, in order to allow a more accurate resection.
Recent advances in medical ultrasound imaging have led to the considerable development of Doppler signal filtering. 5 These filtration methods benefit from the fact that ultrasound data are acquired simultaneously in whole imaging planes during ultrafast ultrasound plane wave imaging with a high temporal resolution (>1 kHz), which lead to the conservation of spatio-temporal coherence of tissue scatters. In order to quantify the vascular volume in a repeatable and non-operator dependent way, we have developed a new adaptive clutter filtering and a new noise equalization method.
In the field of clutter filtering, Pham et al. proposed an inverse problem solving consisting in separating the Doppler data into a low rank matrix and a sparse matrix. 6 Demene et al. 7 proposed SVD clutter rejection of ultrasonic data acquired at an ultrafast frame rate. Thereafter to address the issue of optimally estimating the boundary between the tissue and the blood flow subspace, Baranger et al. 8 proposed SVD adaptive thresholding. Assuming that tissue and blood subspaces are represented by two juxtaposed symmetrical squares on spatial singular vectors modulus correlation matrix, called spatial similarity matrix, three subspaces were automatically delimited, representing tissue, blood and noise. This square recognition, suppose that blood and tissue subspaces are represented by squares. However, in most clinical cases the blood subspace takes an ovoid shape. In addition, in some acquisitions, blood and tissue subspaces can have a significant correlation and the boundary between the two subspaces is ambiguous. These conditions can lead square recognition failure. Consequently, we developed a new automatic clutter filtering technique using hierarchical clustering instead of square recognition.
After clutter filtering, obtained images are corrupted by background noise that increases in depth and laterally. This spatial noise profile (NP) is related to the use of time-gain compensation (TGC) and lateral gain compensation (LGC). In our study these gains were applied thanks to the Aixplorer ultrasound machine adaptive implemented method. 9 To estimate NP, different methods have been proposed. Bayat et al. 10 used top-hat filtering method. Huang et al. 11 experimentally measured noise-induced bias by collecting noise signals with the ultrasound transmission turned off. Nayak et al. 12 developed a spatial correlation filter (STC) that separates noise and flow components. Finally, Song et al. 13 proposed an smoothing method based on last singular spatial vector of SVD. In all these methods,10–13 noise equalized images were obtained by dividing data by NP. Therefore, because noise is related to TGC and LGC, this division is affecting TGC and LGC, and may underestimates signal in depth and laterally. Thus, instead of this NP division (NPD), we propose a weighted noise profile subtraction (WNPS) that preserve TGC and LGC.
After noise equalization, it is possible to quantify the vascular volume. Huang et al., 14 in a proof-of-concept study with contrast-free ultrasound on chicken embryo tumor model of renal cell carcinoma, have shown that two quantitative parameters (vascularization index VI, and fractional moving blood volume FMBV) can be extracted from ultrafast ultrasound vascularization images, and allow the quantification of neoangiogenesis. FMBV comes from a normalization by the maximum of image pixel value and a decibel compression. 15 The decibel display is interesting because it increases the dynamic dedicated to the smallest vessels, allowing an increased sensitivity to neoangiogenesis visualization. Also, this quantification corresponds to a practical aspect since the levels in dB correspond to the color level displayed on the ultrasound machines. However, because linear scaling between blood volume and decibel compression is approximative we propose FMBV quantification based on the linear emergence of the Doppler signal moduli above the noise level, and keep decibel compression for the images display only.
In order to quantify both the tumor neoangiogenesis and the tumoral infiltration we defined several regions of interest (ROI) based on the B-mode, amplitude Doppler images, and anatomical analysis. By measuring FMBV and VI in these ROIs we aim to measure the tumoral blood volume and the infiltrative character of the tumor.
MANIOQ is designed for a robust and adaptive quantification of vascularization volume. It was developed within the framework of a clinical study called ELASTOGLI. The remainder of this paper is organized as follows. Data acquisition, filtering and quantification process appear in Section II. In Section III, we present qualitative outputs of MANIOQ filtered data which are compared with Baranger et al. 8 adaptive thresholding and noise equalization by noise profile division.10–13 In Section IV, MANIOQ clinical outcomes are presented and discussed. Six supplementary materials are also available, for more details on MANIOQ processing and results.
Material and methods
Clinical protocol and data acquisition
We developed our quantification method and evaluated filtered data SNR for the 23 enrolled patients and 89 ultrasound Doppler acquisitions of ELASTOGLI cohort. This interventional, prospective, and monocentric study is part of the ongoing ELASTOGLI clinical study at the University Hospital of Tours (UHT). The study was registered on clinical trial.gov (ntC03970499) and was approved by French ethics committee (CPP Île-de-France IDF1-2018-ND42-cat.2). The study was conducted in accordance with the declaration of Helsinki. All patients gave their written informed consent and underwent surgery for a brain tumor by craniotomy (additional information concerning the clinical trial at the CHRU of Tours can be found https://clinicaltrials.gov/ct2/show/NCT03970499). Ultrasound imaging was performed by a neurosurgeon, I.Z, using an ultrafast ultrasound scanner (Aixplorer v12, Supersonic Imagine, Aix-en-Provence, France) equipped with a linear array transducer (SL 10-2; Supersonic Imagine, center frequency 5.6 MHz, pitch 0.2 mm, 192 elements, bandwidth 80%). Ultrasound doppler data were obtained after opening of the meninges but before any cortical incision. All the data were acquired prospectively as part of the ELASTOGLI protocol. We then developed our MANIOQ algorithm on these data. Dedicated ultrafast sequences, as described below, were developed with J.-L. G using the sonicLab software. Radiofrequency (RF) data were acquired with a 5.6 MHz transmit center frequency. We choose a 3-angles (
MANIOQ process
MANIOQ synoptic appears in Figure 1. Abreviations summary is provided in supplementary materials VI. Filtering parameters are kept constant for all the cohort and filtering procedure is entirely automatic.
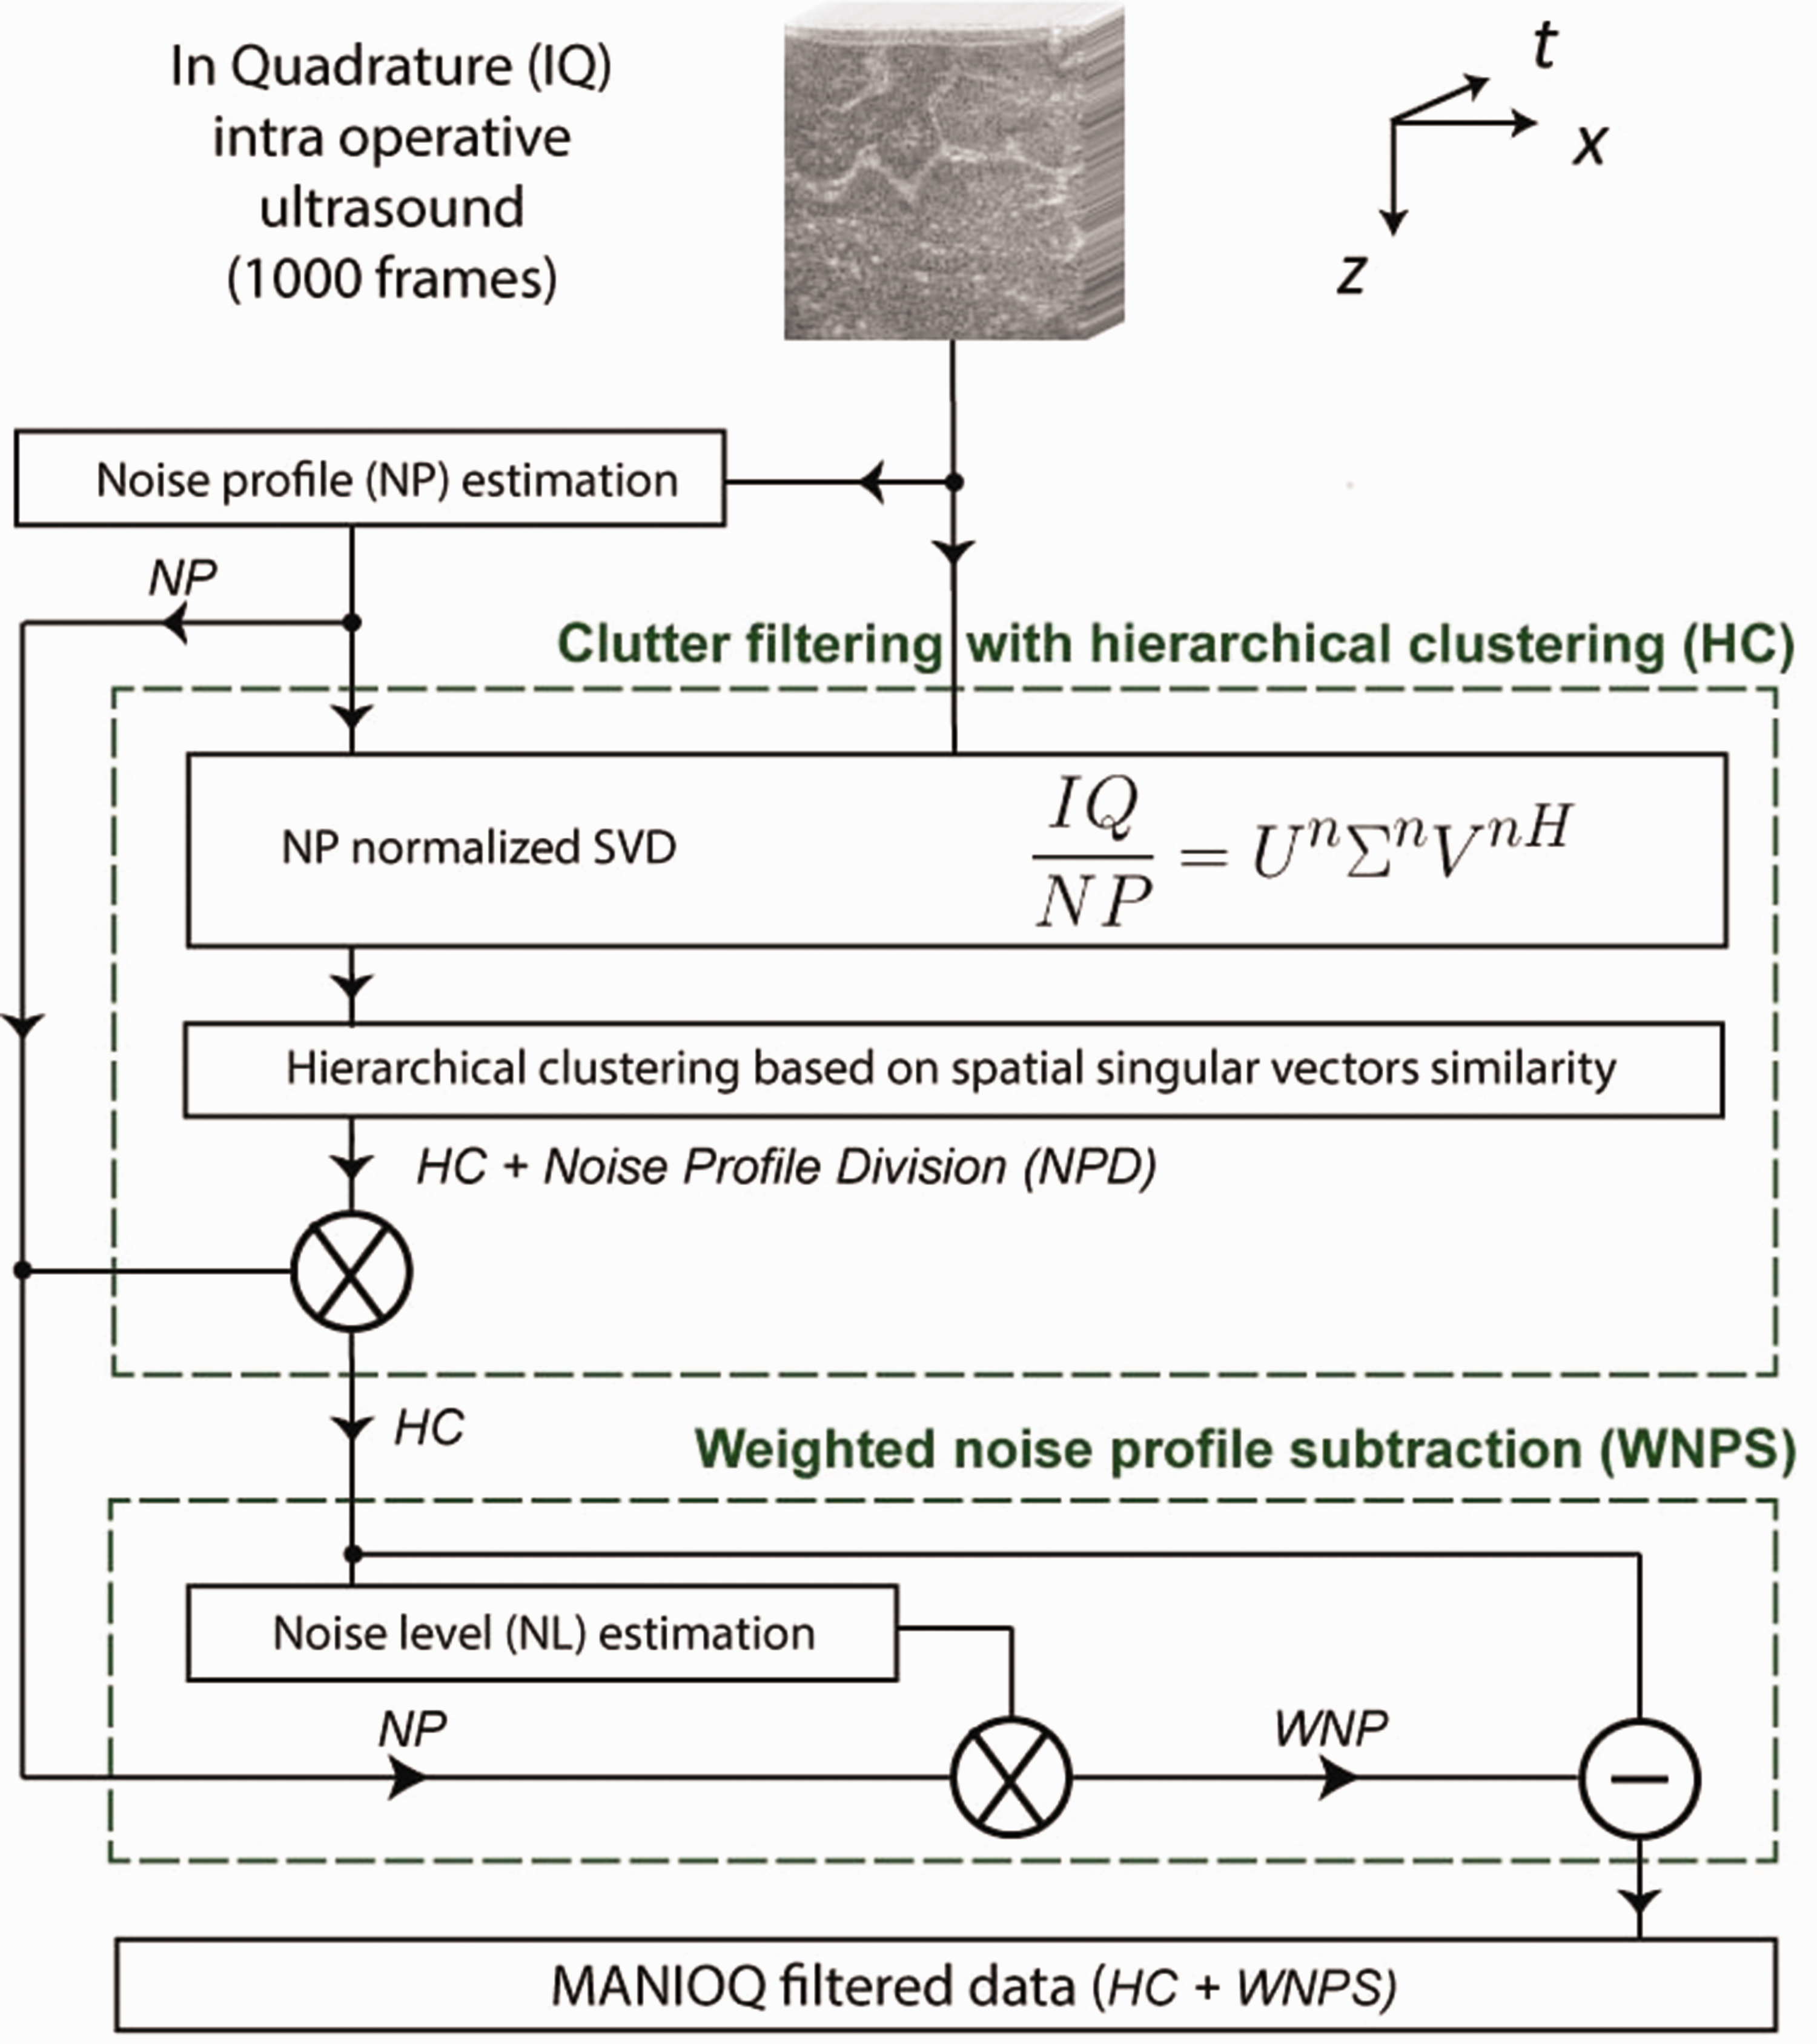
MANIOQ Doppler filtering synoptic.
Use of amplitude doppler instead of power doppler
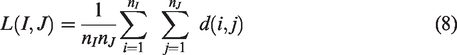
Power doppler (PD) and amplitude doppler (AD) are numerically defined, as:
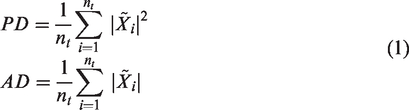
By developing
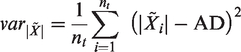
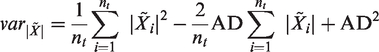

The PD pixel value is AD2 added to the moduli time variance
Noise profile (NP) estimation
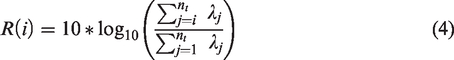
Following Song et al.,
13
we developed NP estimation based on singular value decomposition (SVD). SVD was defined as:

(a)
Clutter filtering
For clutter filtering we used SVD
7
and to automatically choose the singular values to be filtered as representative of the tissue we used the similarity of the spatial singular vectors moduli.
8
To avoid NP influence, we have previously divided IQ by NP:

The blood subspace is usually larger than the tissue subspace in the spatial similarity matrix and constituted of singular values of higher rank. We evaluated
Hierarchical clustering is an iterative procedure. First, each singular spatial vector is associated with an individual cluster. At each iteration the two closest clusters merge and a linkage distance
In order to determine the right number of clusters for analysis we used Thorndike method:
17
among the fifty last merging the maximum of the distance L increased defined the right number of clusters. If this number is higher than two, to determine if a cluster is associated with tissue or RBC, we defined two reference clusters. The one that contains the first singular value is considered as tissue reference, and the one containing the index
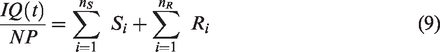
(a) Oligodendroglioma, grade II and (b) Astrocytoma, grade III. Two methods were tested for adaptive clutter filtering: (1) Adaptive threshold,
8
on the top left is spatial similarity matrix with noise threshold indicated by black lines, on a bottom left is a zoom into the
Noise equalization
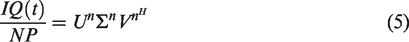
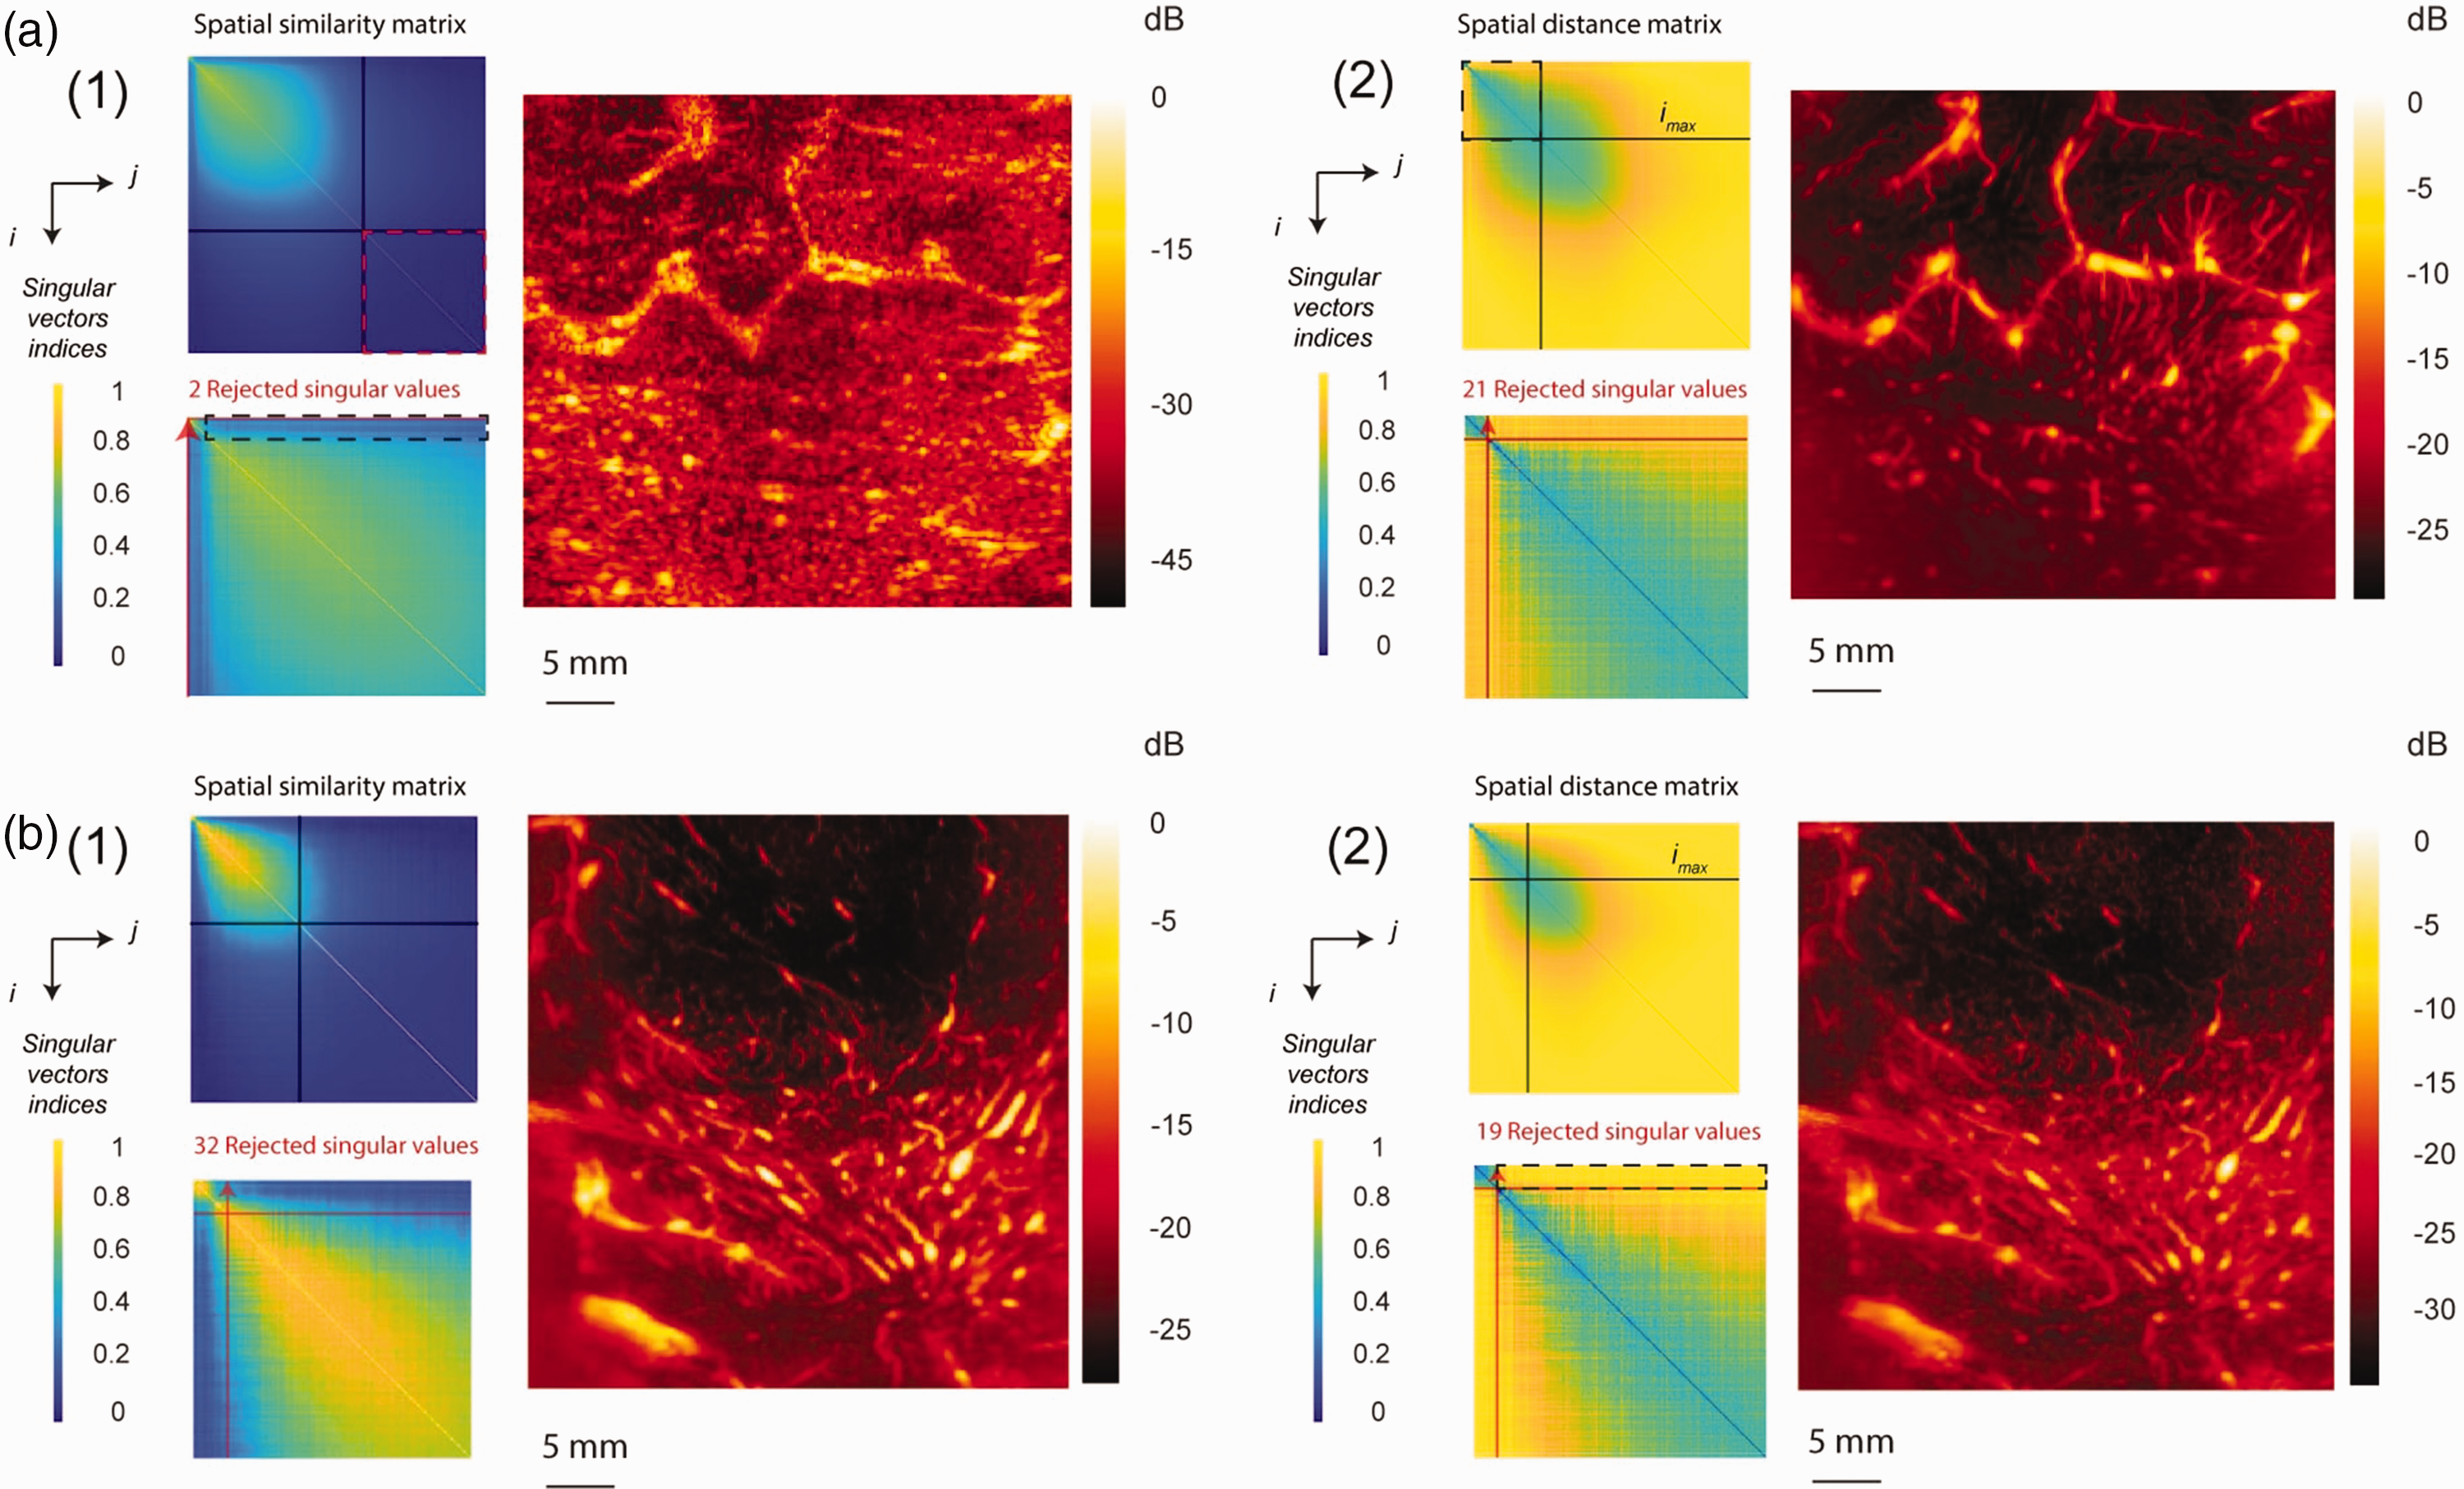
Once the clutter is filtered, background of AD is exposed to background noise profile. To equalize background noise, previous work used noise profile division (NPD).10–13 This consists of dividing the ultrasound data by NP. This division changes the amplitude of the pixels in the image since it divides the background and edges of the image by a large value, while the near field is slightly decreased. This disturbs the TGC and LGC of the final image. To avoid this issue, we propose to replace NPD by weighted noise profile subtraction (WNPS). To evaluate a weighted noise profile (WNP), we first measured noise level (NL). We assumed that background noise was due to electronic measurement noise and followed a normal random distribution. Consequently, after beamforming IQ noise is a bivariate normal random variable (i.e Rayleigh distribution). We selected a representative sample of noise by selecting pixels with lower signal to noise ratio in RBC clusters sum
(a) We select a representative sample of the measurement noise by selecting pixels with lower amplitude in the amplitude Doppler of selected clusters sum
Obtained Rayleigh distribution scale parameter is called

Consecutively, the weighted noise profile

The term −1 is added so that
Finally, WNPS is evaluated as follows:
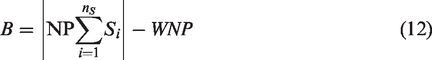
B is MANIOQ filtered data that will be used for quantification process.
Knowing that standard error of a mean is equal to its standard deviation divided by the square root of the number of samples, and that the variance of a Rayleigh distribution is defined as
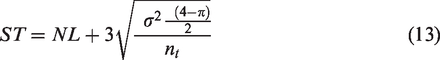
All pixels strictly lower than ST in
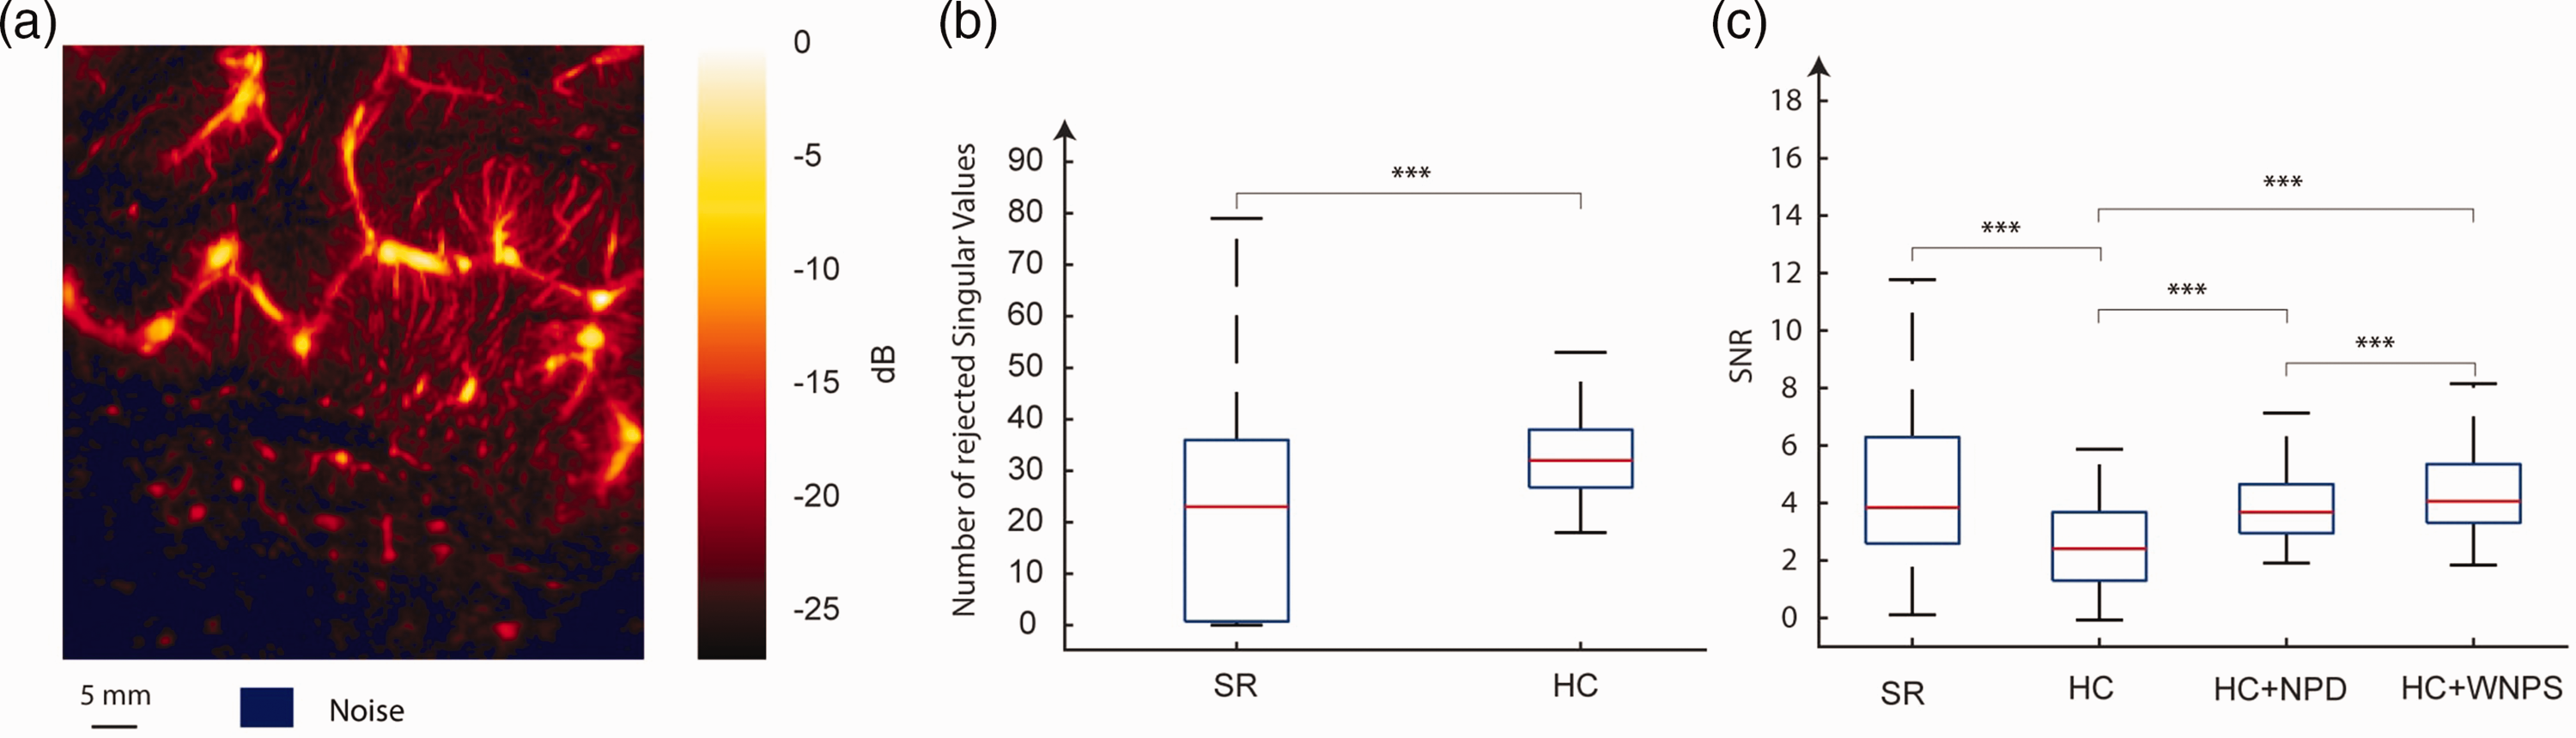
(a) Amplitude doppler of case study, oligodendroglioma of grade 2 with noise segmentation (b) The number of singular values filtered by hierarchical clustering (HC) and adaptive thresholding (AT) for ELASTOGLI cohort and (c) SNR obtained for adaptive thresholding (AT), hierarchical clustering (HC), hierarchical clustering followed by noise profile division (HC + NPD, corresponds to results just before multiplication in HC box Figure 1), and weighted noise profile division (HC + WNPD, MANIOQ filtered data Figure 1). On each box, the central mark indicates the median, and the bottom and top edges of the box indicate the 25th and 75th percentiles, respectively. The whiskers extend to the most extreme data points.
WNPS solution was compared with NPD solution which is
Quality evaluation
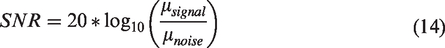
To evaluate quality of Doppler filtering the number of filtered singular values during clutter filtering was compared with square recognition method and then signal-to-noise-ratio (SNR) was evaluated after hierarchical clustering (HC), square recognition (SR), HC + NPD and HC + WNPS. SNR was defined as follows:
Multi-layered neoangiogenesis quantification
Regions of interest (ROI) segmentation
Tumoral hyper-echogenic structure on B-mode image, 18 was manually segmented. Sulci, cerebral areas close to the tumor but “anatomically unconnected” (i.e. cerebral parenchyma adjacent to the tumor but separated from it by a sulcus), and artifacts (post-cystic reinforcement zone, attenuated zones behind calcifications) were manually segmented using both B-mode and Amplitude Doppler images. Sulci were excluded from quantification because they contain brain large blood vessels, distinct from neoangiogenesis. Necrosis areas, which are avascular, were manually segmented from AD images and excluded. A percentage of necrosis was evaluated. Finally, artifacts and anatomically unconnected areas were also excluded from quantification.
To measure eventual neoangiogenesis infiltration, and its extent close to hyper-signal B-mode tumoral structure,
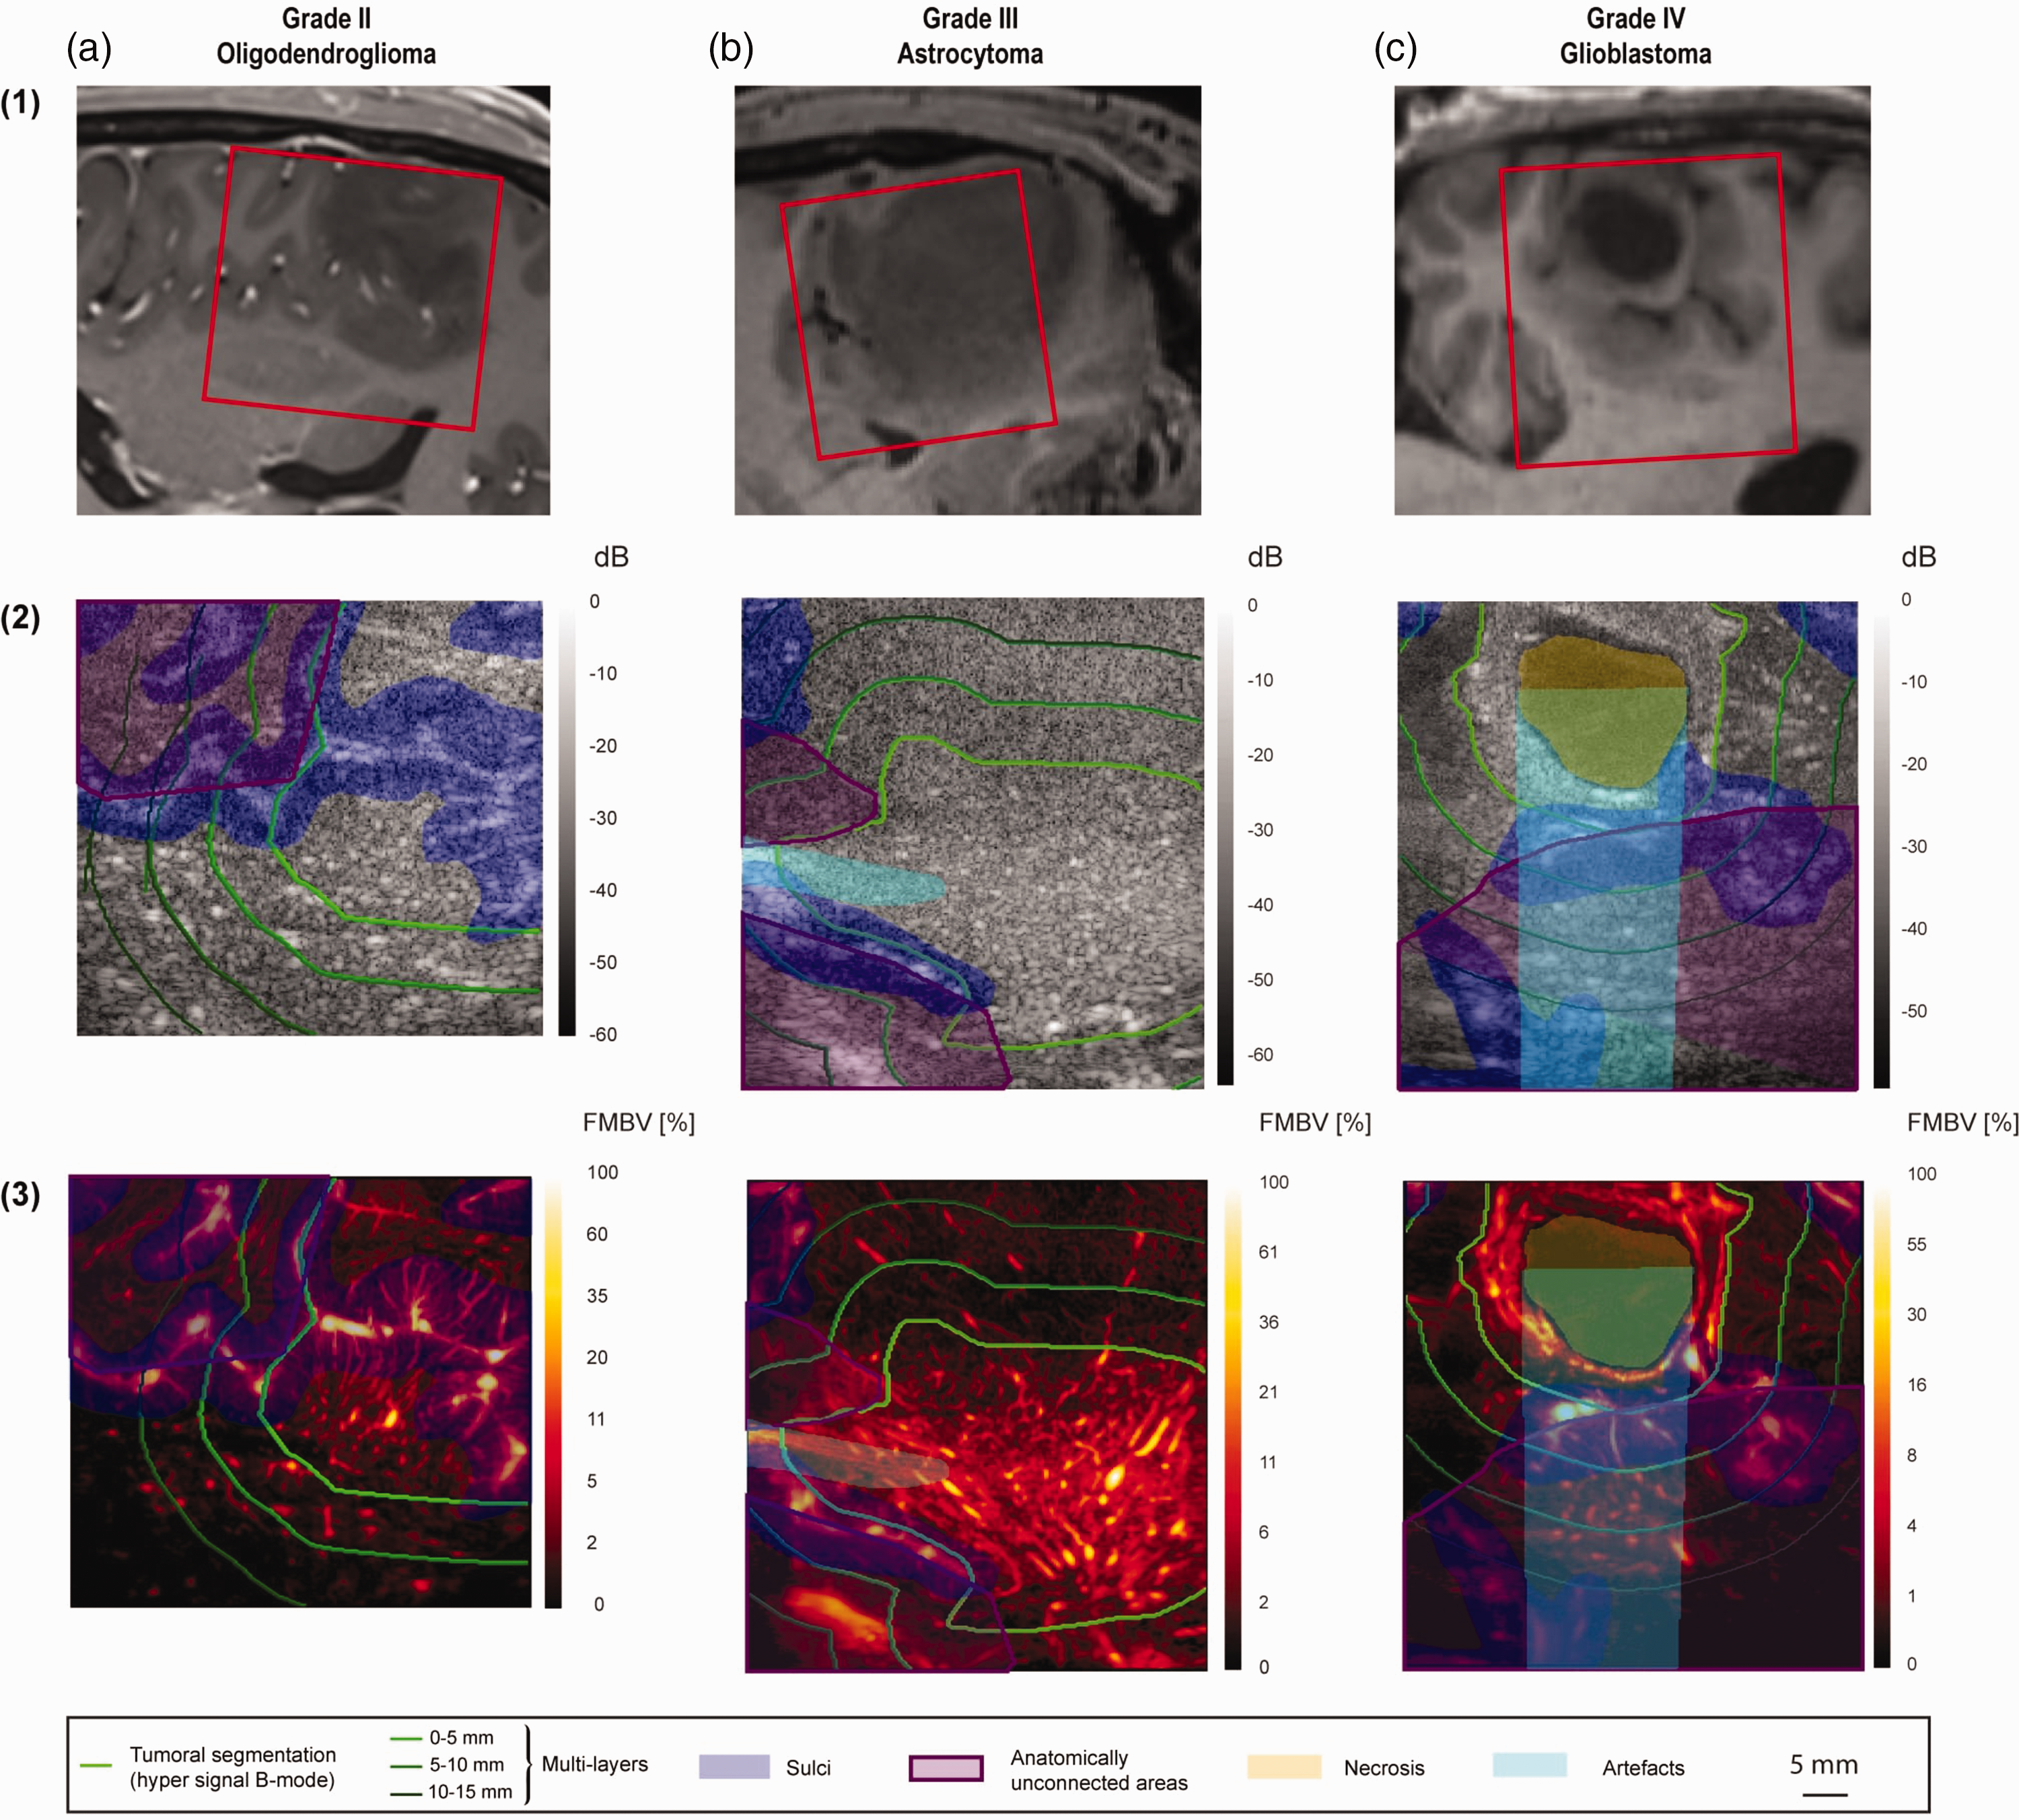
(a) Oligodendroglioma, grade II. (b) Astrocytoma, grade III and (c) Glioblastoma, grade IV. Line (1): T1 weighted MRI slices in the same plane as ultrasound. The acquired ultrasound field-of-view is framed in red. We segmented manually tumoral hyper-echogenic structure on B-mode imaging 18 (Line 2), and sulci using both B-mode (Line 2) imaging and Amplitude Doppler (Line 3). Tumoral hyper-echogenic structure on B-mode imaging (Line 2), was manually segmented. Sulci, cerebral areas close to the tumor but “anatomically unconnected” (i.e. cerebral parenchyma adjacent to the tumor but separated from it by a sulcus), and artifacts (post-cystic reinforcement zone, attenuated zones behind calcifications) were manually segmented using both B-mode (Line 2) and Amplitude Doppler images (Line 3). Sulci were excluded from quantification because they contain brain large blood vessels, distinct from neoangiogenesis. Necrosis areas, which are avascular, were manually segmented from AD and excluded. A percentage of necrosis was evaluated. Artifacts and anatomically unconnected areas were also excluded from quantification.
Quantitative metrics
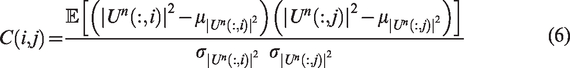
Two quantitative metrics were derived from MANIOQ filtered Doppler data. Firstly, Fractional Moving Blood Volume (FMBV) was defined as for each pixel of AD as:
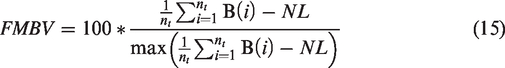
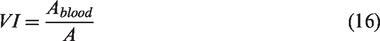
The subtraction of NL allows to evaluate only the emergence of the signal compared to the noise level without being dependent of NL value. FMBV of a pixel measures the proportion of pixel volume that is filled by blood. It is a relative measurement with respect to the strongest pixel of the amplitude Doppler (see equation (15) denominator) which is considered to represent a pixel filled with blood. The FMBV of a ROI was evaluated as the mean value of FMBV pixels. Second, Vascular Index (VI) of a ROI was defined as:
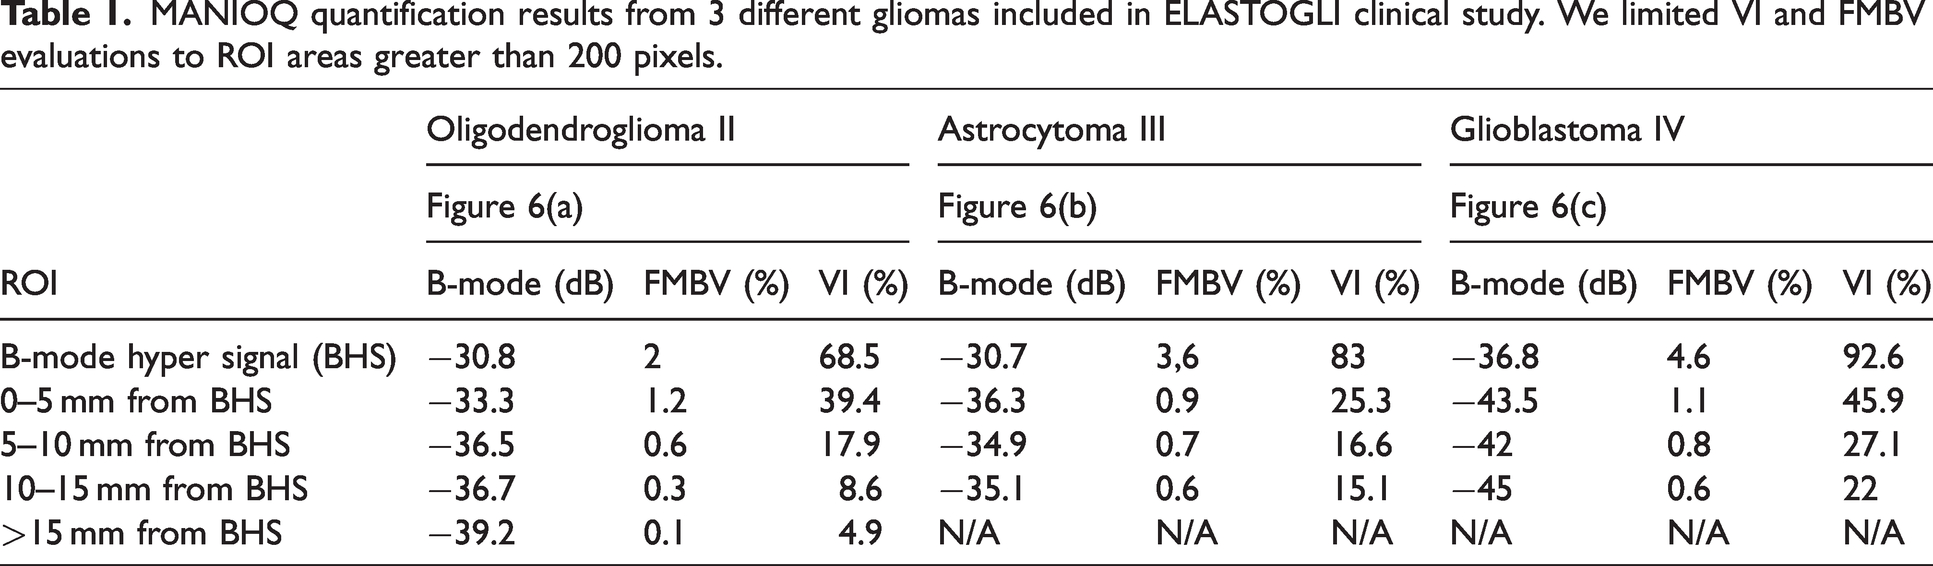
Additionally, the mean intensity of B-mode in each ROI was derived from non-filtered Doppler data as a reference comparison. When the number of pixels in the ROI was less than 200 pixels, the estimation of VI and FMBV was not performed (presence of N/A on the last row of Table 1 for grades 3 and 4).
MANIOQ quantification results from 3 different gliomas included in ELASTOGLI clinical study. We limited VI and FMBV evaluations to ROI areas greater than 200 pixels.
Results
Quality metrics
Two other acquisitions obtained for two other patients are presented in Figure 6(b) and (c). These are two gliomas of higher grade than the case study, respectively, a grade III astrocytoma and a grade IV glioblastoma.
Clutter filtering
For all the 89 acquisitions, the number of singular values filtered by hierarchical clustering (HC) and square recognition (SR) is illustrated in Figure 5(b). The median number of singular values filtered was significantly lower using SR (23 singular values, IQR = 34) than HC method (32 singular values, IQR = 11).
SNR
Obtained SNR among 89 acquisitions of the cohort for 4 evaluated solutions, square recognition (SR), hierarchical clustering (HC), hierarchical clustering followed by noise profile division (HC + NPD, see Figure 1) and weighted noise profile subtraction (HC + WNPS, see Figure 1), are displayed in Figure 5(c). The maximum median SNR obtained among the four tested solutions was after WNPS (corresponding to the MANIOQ final filtered data). The obtained median SNR were 3.9 dB after SR, 2.4 dB after HC, 4 dB after NPD and 4.2 dB after WNPS. There were a significant increase using SR, HC + NPD and HC + WNPS instead of HC (+1,5 dB, +1,6 dB and +1,8dB, p < 0.001) and HC + WNPS instead of HC + NPD (+0,2 dB, p < 0.001). There was no significant SNR difference using SR instead of HC + NPD (p = 0.11) or HC + WNPS (p = 0.52).
Quantitative metrics
Regions of interest (ROI) segmentation
MANIOQ segmentation method is applied on the two other cases of higher grade gliomas and results are presented in Figure 6(b) and (c). This segmentation shows the hyper echogenic B-mode area, the three peripheral layers of 5 mm thickness, and the non-anatomically connected areas. On glioblastoma Figure 6(c), a grade 4 tumor, a necro-cystic zone with posterior enhancement can be seen. These posterior enhancement areas are due to lower US attenuation in the necro-cystic liquid than in the glioma structure. The amplitude of the Doppler signal is then modified which biases the quantification of the perfusion.
B-mode, FMBV and VI multi-layered quantification
Obtained mean intensity of B-mode, VI and FMBV are displayed in Table 1 for the three gliomas analyzed in this manuscript. These three tumors have different grades from 2 to 4 for comparison. The perfusion images are shown Figure 6, Line 3. Measurement of the FMBV and VI allowed us to identify a tumor hyper-vascularization in B-mode hyper signal areas (BHS area) with a FMBV quantification superior to 2% whatever the grade, and a VI superior to 68.5%. Moreover, these FMBV and VI in the BHS region increase with the grade. Concerning the quantification in the 5 mm layers, we observe a rapid decrease of the vascularization for each case according to the distance to the BHS.
Discussion
This article deals with filtering of ultrafast Doppler data and quantification of tumor micro-vascularization. It discusses two aspect of Doppler filtering: adaptive clutter filtering and noise equalization. For clutter filtering we proposed to use the similarity of spatial singular vectors
8
and hierarchical clustering (HC) and compared our results with square recognition (SR).
8
We have noticed two main issues in SR. First one was when only very few singular values were rejected (see Figure 3(a,1)). We found that these cases occurred when the average correlation between the tissue subspace and the blood subspace was large (see the corresponding area in black dotted rectangle Figure 3(a,1)) compared to the average magnitude of the lower right region of spatial similarity matrix (see red dotted square Figure 3(a,1)). In these cases, SR perceives a large square in the upper left region of the spatial similarity matrix (delimited by black lines Figure 3(a,1)) and consequently underestimates the tissue square (see red arrow Figure 3(a,1) on the edges of the matrix). The MANIOQ clutter filtering overcomes this issue using only the first
The other issue of SR that we noticed happens because the shape of the blood space is elliptical. It may neglect the left top of the elliptical shape to maximize the resemblance to a square, leading to over-estimated blood threshold (see red arrow Figure 3(b,1)). Comparatively, HC uses the distances between each spatial singular vector in each subspace instead of shape recognition (see the area corresponding to these distances in black dotted rectangle Figure 3(b,2)). It consequently allows to keep the top left part of RBC elliptical shape (see Figure 3(a,2) and (b,2)). This precise fit to blood elliptical subspace allows an important gain in amplitude doppler dynamic as well as apparition of additional small vessels (see Figure 3(b,2)). These differences in both amplitude doppler can be explained because the top of the ellipse corresponds to the highest energy blood singular values, as well as slow blood flow velocities corresponding to small vessels. The under- or overestimation issues of the blood threshold by square recognition leads to a high varying number of filtered singular values (i.e interquartile range (IQR) of 34 for square recognition while hierarchical clustering filters have an IQR of 11, see Figure 5(b)). Finally, HC's ability to avoid large residual tissue speckle by accurately identifying and removing the tissue subspace allowed us to obtain robust perfusion quantitative metrics (VI and FMVB).
For the two techniques of clutter filtering we compared, we have decided to conserve the high singular values, in order to increase the sensitivity of the filtering. Although filtering the high singular values allows to increase the SNR 8 because it filters noisy SVD subspaces that have a low space-time coherence, we found that these subspaces still contained residual vascularization (see Figure 2(b)).
An interesting property of HC is that it does not necessarily follows the initial order of the singular values, it can reject the n-th singular value while keeping the previous one. Therefore, it could be interesting for contrast Doppler imaging where the echogenicity of the micro-bubbles is higher than the echogenicity of RBCs, and consequently the singular values of the tissue might have higher indices than singular values of micro-bubbles.
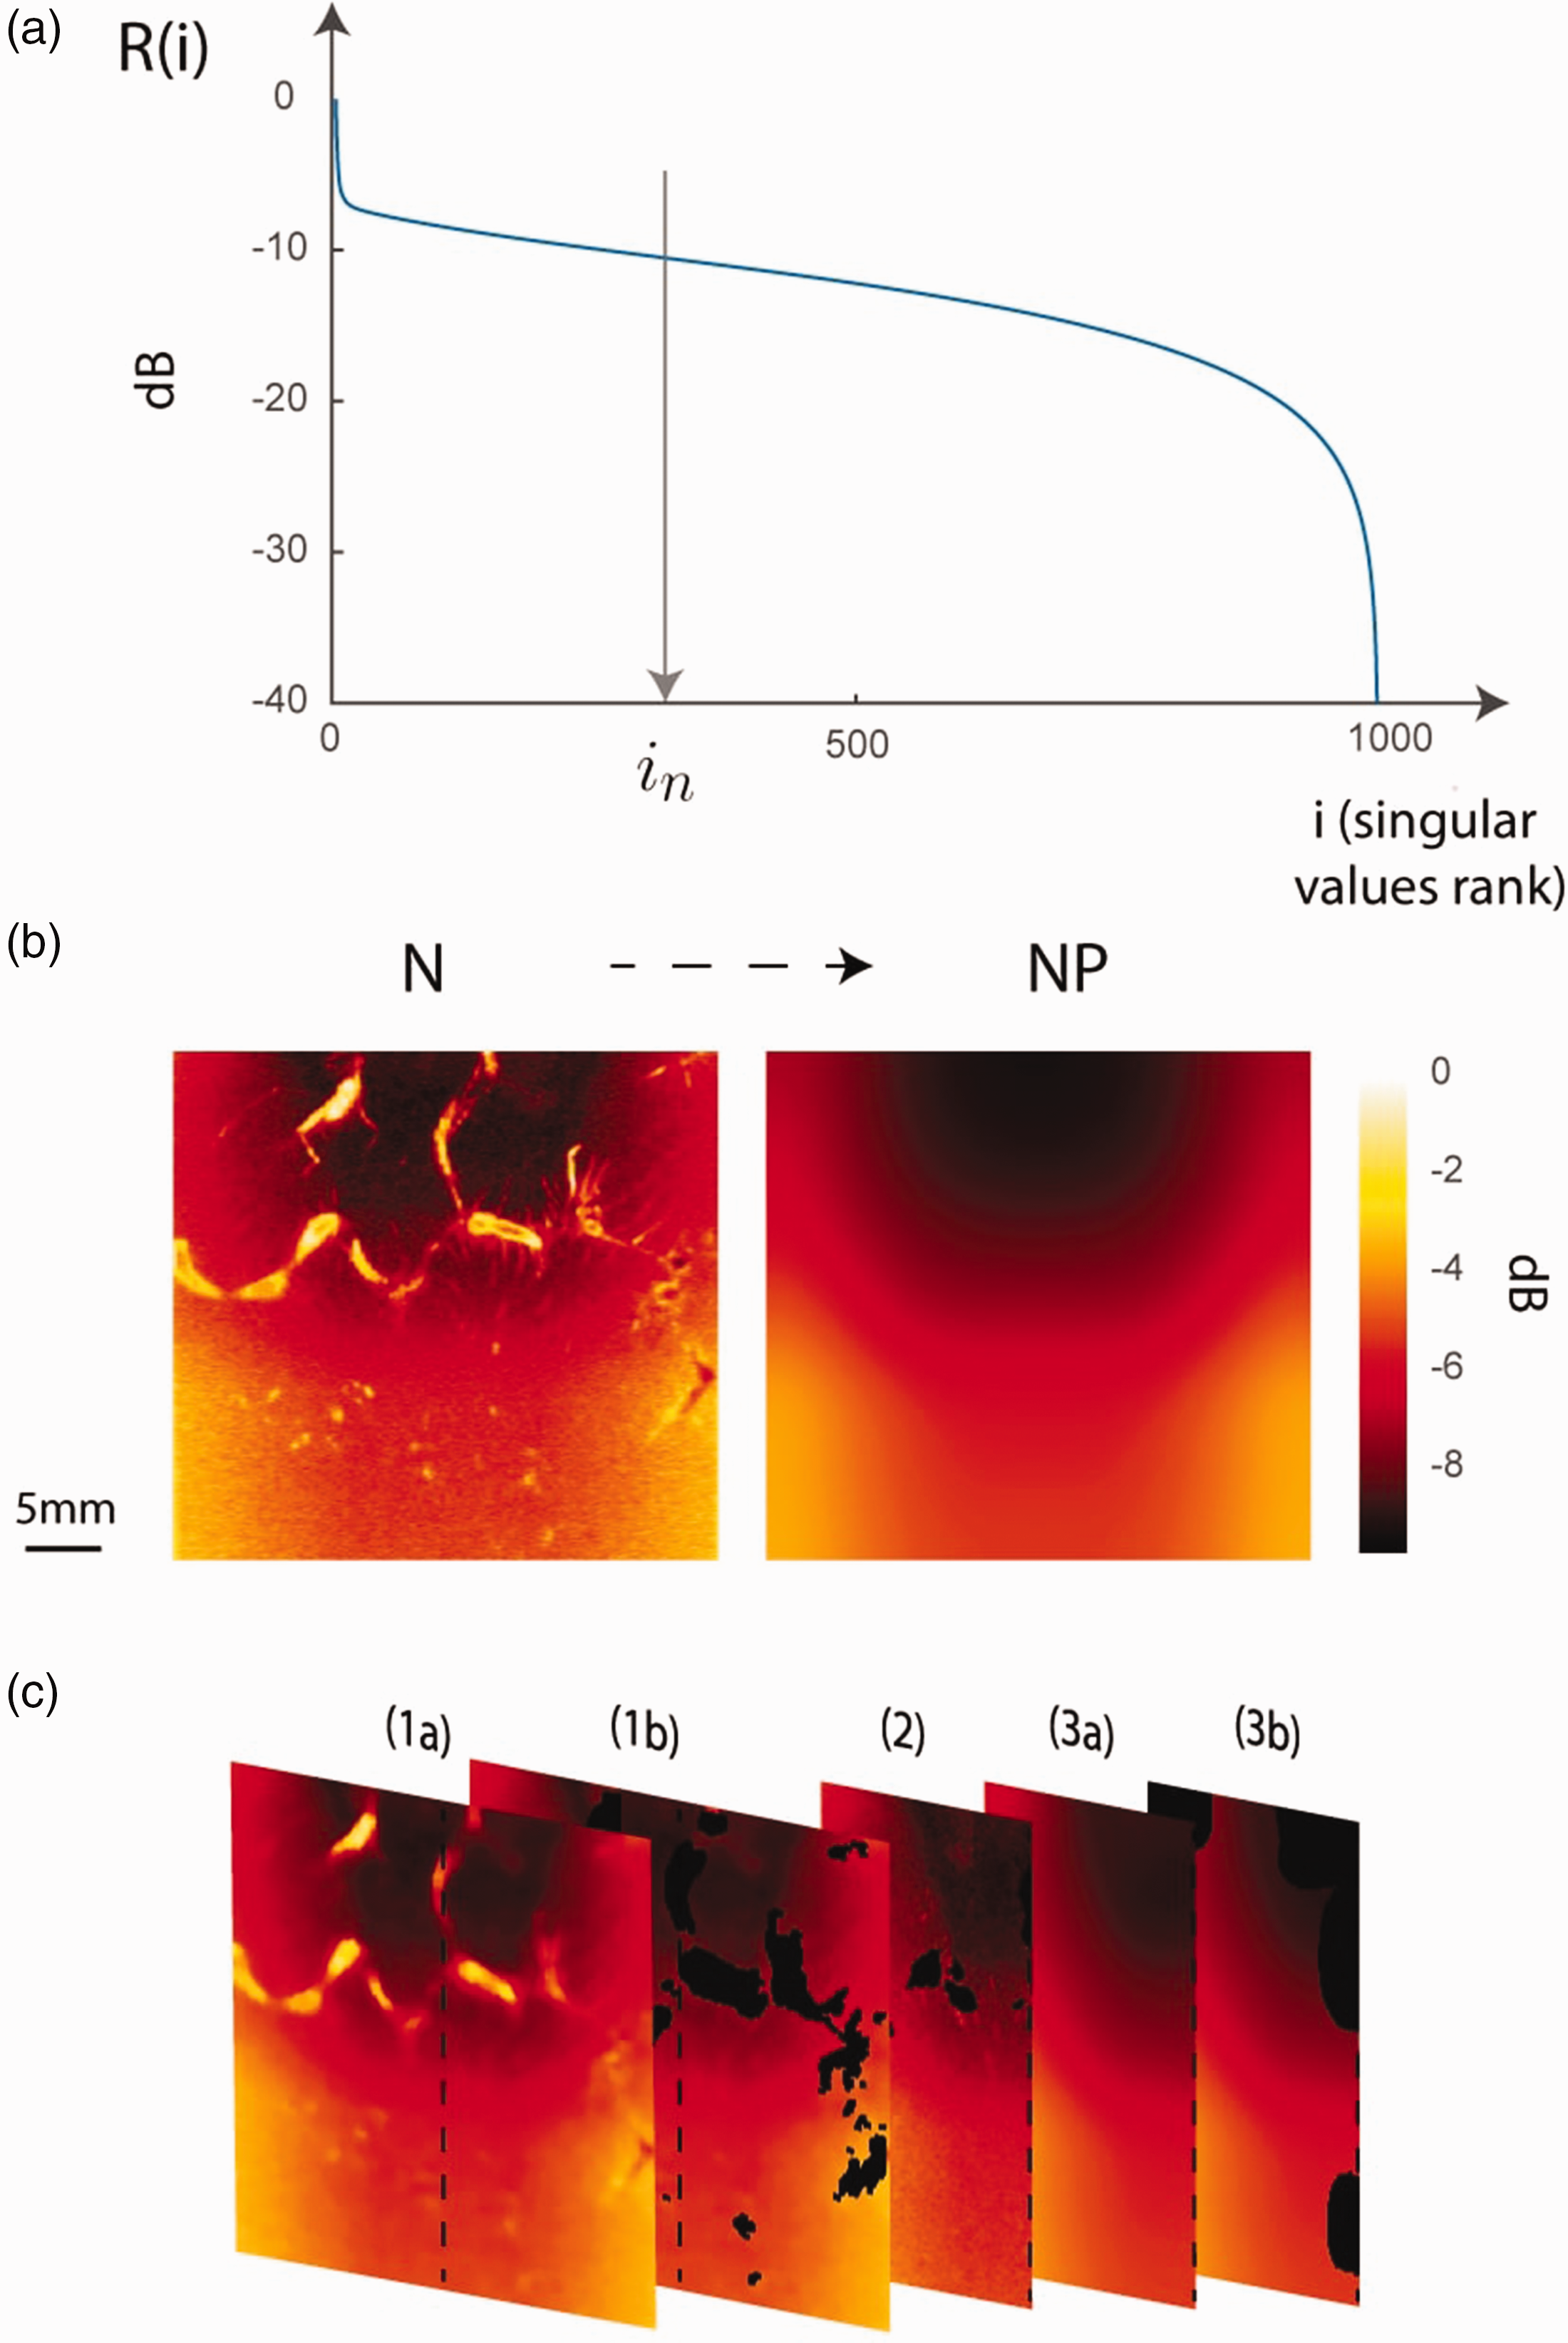
The other main aspect of Doppler signal processing discussed in this manuscript is noise equalization. We compared noise profile division10–13 (NPD) with weighted noise profile subtraction (WNPS). Visually, the amplitude Doppler images obtained by the two methods are similar (see Figure 4(b) and (c)). The noise background was made spatially homogeneous in both cases, showing that NP was correctly estimated from SVD (see Figure 2). However, the signal amplitude on the sides and in depth was reduced when using NPD (see Figure 4(e)). If we subtract these two images quantized in dB (see Figure 4(b) and (c)), the difference reaches up to 5 dB at the bottom and on the sides of the vascular image (see Figure 4(d)), corresponding to one fifth of the signal dynamic range of the amplitude Doppler obtained by NPD (see Figure 4(b)).
In order to evaluate the quality of the MANIOQ filtered data and compare it to the reference methods SNR was evaluated on the 89 acquisitions of ELASTOGLI cohort for SR, HC, HC + NPD, and HC + WNPS. The results shown in Figure 5(c), show that SNR were higher for SR compared to HC (+1,5 dB, p < 0.001). These results can be explained by the very high dynamic range when remains residual tissue speckle, see 55 dB dynamic in Figure 3(a,1), compared to HC, 28 dB dynamic in Figure 3(b,2). Moreover, hot spot of vascularization often corresponds to high echogenic tissue speckle, as the sulcis Figure 6. Here higher SNR does not reflect a better clutter filtering. We deduce SNR is not a relevant when evaluated data contain residual tissue speckle. Results in Figure 5(c) show that the median SNR increases (+1,6 dB, p < 0.001) for HC + NPD compared to HC. This gain is slightly accentuated if WNPS is used (+1,8 dB, p < 0.001). This small increase using WNPS instead of NPD for the same clutter filtering can be explained by the signal dynamic gain on the edges and in depths illustrated in Figure 6(c).
After HC and WNPS, a method of quantification of the vascular volume by two quantifiers, fractional moving blood volume FMBV and vascular index VI, has been proposed. This quantification was assessed in the B-mode hyper signal ROI (BHS) which corresponds to the tumoral structure, 18 and on its periphery (see Figure 6). For the 3 grades of gliomas (Figure 6(a), (b) and (c)), the blood volume (FMBV) and vascular density (VI) were more important in BHS area than others area. Moreover, this increase was higher for the two highest grades (Figure 6(b) and (c)). These results are presented in Table 1 with only 2% FMBV for grade II compared to 3.6% and 4.6% FMBV for grade III and IV inside the HSB area. VI, also increases with grade, with 68.5% for grade II, compared to 83% and 92.6% for grade III and IV.
Vascularization decreases with distance to BHS, regardless of the grade (Figure 6(a), (b) and (c)). This decrease was quantified by FMBV and VI in the 0–5 mm ROI with now only 1.2%, 0.9%, 1.1% FMBV and 39.4%, 25.3%, 45.9% VI, for grade 2, 3, 4. FMBV and VI decrease according to the distance from HSB, suggesting that the brain close to the tumor was infiltrated by pathological micro-vessels. The spatial extent of this infiltration was a little shorter for grade II oligodendroglioma than for higher grades. Indeed, we measured 0.6% in the ROI 5-10 mm for grade 2 glioma, while the same value is reached in the area 10-15 mm for grades 3 and 4.
It is interesting to compare the measurement of FMBV and VI to the intensity of B-mode which is the reference intraoperative imaging. The variations in B-mode do not follow the same trend as FMBV and VI. Indeed, while for the three studied cases FMBV and VI decrease with distance from BHS area, the intensity of the B-mode signal does not show a strict decrease. For grade 3, we measured for the B-mode intensity, −36.3 dB in the 0–5 mm area and −34.9 dB in the 5–10 mm area, i.e. a 1.4 dB increase. For the FMBV and VI we measure 0.9% and 25.3% in the 0-5 mm area then 0.7% and 16.6% in the 5–10 mm area, i.e. a 0.2% and 8.7% decrease. For the grade 4, for B-mode intensity, we measure –43.5 dB in the 0–5 mm area then –42 dB in the 5–10 mm area, i.e a 1.5 dB increase. For the FMBV and VI we measure 1.1% and 45.9% in the 0–5 mm area then 0.8% and 27.1% in the 5–10 mm area, i.e. a 0.3% and 18.8% decrease. We believe that B-mode intensity could be disturbed by peritumoral edema, which could explain why, in high grade tumors, B-mode intensity is increasing in the 5–10 mm area, while FMBV and VI decrease. Indeed, in grade II tumors, that usually do not produce peritumoral edema, we did not find this pattern of B-mode intensity quantification.
MANIOQ quantification has limitations. First, the quantification has a loss of sensitivity with the depth and laterality of the quantification. Second, the quantification is performed in two dimensions on a few planes, which limits the analysis to a partial tumor volume. Indeed, gliomas can be spatially heterogeneous. This concerns particularly glioblastoma (grade 4), which can have contingents of lower grade. In the future a 2D scan could be performed to reconstruct a 3D volume, or a 3D acquisition could be performed. Thirdly, this treatment is not applied in real time. It is done off-line. The download time of the Aixplorer raw data, and the data processing, are about 3 minutes. The SNR is limited by the acoustic imaging standards that limit the US amplitude. It is also limited by the number of acquisition plans that can be stored in the memory of the Aixplorer machine. The image size is limited by the size of the probe which is 3.84 cm laterally. The analysis window of the tumor is also limited by the size of the opening of the skull. Unlike MRI, in some cases, when the tumor is large, we cannot visualize it completely by US. Finally, the technique for quantification requires a surgeon's practical experience to enable him/her to read the B-mode ultrasound image and to segment the anatomical landmarks. The final quantitative analysis presented here is based on the analysis of three cases and so have a case report level of evidence. A statistical analysis of glioma micro vascularization on the whole ELASTOGLI cohort, as well as a comparison with preoperative MRI perfusion measurements, and histopathological analysis, will be realized.
Conclusion
We have presented a new method for quantifying vascularization volume with contrast free ultrafast Doppler. We proposed two innovations for clutter filtering and noise equalization which are hierarchical clustering and weighted noise profile subtraction. We compared the quality of obtained data with two reference methods: clutter filtering by square recognition and noise equalization by noise profile division. We made this methodological comparison using 89 per operative ultrafast Doppler acquisitions from a cohort 23 of patients with gliomas. We have shown that hierarchical clustering was a more robust method than square recognition for clutter filtering, allowing to identify the elliptical blood subspace within the spatial similarity matrix, and preventing residual tissue speckle. We also showed that weighted noise profile subtraction, instead of noise profile division, maintains the TGC and LGC allowing a more spatially homogeneous blood volume quantization. Finally, we measured B-mode mean intensity, fractional moving blood volume (FMBV) and vascular index (VI), within the tumoral structure, and on adjacent brain regions for three different grades of gliomas varying from grade 2 to grade 4. We showed that FMBV and VI were much higher in tumoral structure (BHS) than adjacent regions. These two parameters inside tumoral structure were increasing according to the grade. We also showed that vascular infiltration of the brain around was more extensive for the grade 3 and 4 (up to 15 mm) than for the grade 2 (up to 10 mm). MANIOQ allow analysis of glioma micro vascularization and infiltration according to glioma grade. This work opens the way for a statistical clinical analysis of glioma micro vascularization on the whole ELASTOGLI cohort. These results could be compared with pre-operatory MRI perfusion measurements.
Supplemental Material
sj-zip-1-jcb-10.1177_0271678X231170504 - Supplemental material for Multi-layered adaptive neoangiogenesis Intra-Operative quantification (MANIOQ)
Supplemental material, sj-zip-1-jcb-10.1177_0271678X231170504 for Multi-layered adaptive neoangiogenesis Intra-Operative quantification (MANIOQ) by Guillaume Lacoin, Ilyess Zemmoura, Jean-Luc Gennisson, Denis Kouamé and Jean-Pierre Remenieras in Journal of Cerebral Blood Flow & Metabolism
Footnotes
Funding
The author(s) disclosed receipt of the following financial support for the research, authorship, and/or publication of this article: This work was supported by the CHRU Tours Hospital (the ELASTOGLI project), the InCa Plan cancer (the BPALP project under Grant N° 18CP122-00) and France Life Imaging WP3 Interventional Imaging (Call for exchange of expertise ANR-11-INBS-0006).
Acknowledgements
We thank Jean-Philippe Cottier and Camille Courtin for their help in the segmentation procedure of brain tumors and the numerous discussions on the micro-vascularization of brain tumors. We also thank Corentin Alix for discussions on ultrasound image processing methods and Paul-Armand Dujardin for statistical analysis advices.
Declaration of conflicting interests
The author(s) declared no potential conflicts of interest with respect to the research, authorship, and/or publication of this article.
Authors’ contributions
I.Z., J-P.R. and G.L. conceived the presented idea, write the clinical trial protocol and obtain the funding. J-L.G. and J-P.R. developed the ultrasound sequence. G.L. developed the theory and performed the computations. J-P.R. verified the analytical methods and supervised the findings of this work. D.K. brought its expertise on signal processing for Doppler filtering. All authors discussed the results and contributed to the final manuscript.
Supplemental material
Supplemental material for this article is available online.
References
Supplementary Material
Please find the following supplemental material available below.
For Open Access articles published under a Creative Commons License, all supplemental material carries the same license as the article it is associated with.
For non-Open Access articles published, all supplemental material carries a non-exclusive license, and permission requests for re-use of supplemental material or any part of supplemental material shall be sent directly to the copyright owner as specified in the copyright notice associated with the article.