
Abstract
Cerebral venous thrombosis (CVT) is a special and easily misdiagnosed or undiagnosed subtype of stroke. To identify specific biomarkers with a high predictive ability for the diagnosis of acute CVT, we performed metabolomic analysis in plasma samples from acute CVT patients and healthy controls and confirmed the results in validation cohorts. In the discovery stage, there were 343 differential metabolites, and the caffeine metabolism pathway and the biosynthesis pathway for the branched chain amino acids (BCAAs) valine, leucine, and isoleucine were two significant pathways between the CVT and healthy cohorts. The area under the curve (AUC) for metabolites associated with valine, leucine, and isoleucine biosynthesis was 0.934. In the validation stage, the BCAA concentrations demonstrated an AUC of 0.935 to differentiate patients with acute CVT from the control cohort. In addition, BCAAs combined with D-dimer levels were used to establish a diagnostic model for CVT, and the AUC was 0.951, showing good diagnostic efficacy of separating CVT patients from the control cohort. BCAAs as plasma biomarkers deserve to be further studied and even developed in clinical CVT management.
Keywords
Introduction
Cerebral venous thrombosis (CVT) is a special type of cerebrovascular disease, found in 0.5%–1% of all stroke patients, with an estimated incidence of >10 per 1 000 000 people per year.1–3 Unfortunately, due to the lack of specific biomarkers for CVT and the diversity of its clinical manifestations and neuroimaging features, admission delays and misdiagnoses are common. The rate of misdiagnosis or missed diagnosis is as high as 73%, and 40% of patients have an average diagnosis delay of more than 10 days. 4 This inevitably leads to delays in treatment, which increases the risk of persistent residual symptoms, including the progression of early nonhemorrhagic lesions such as venous infarctions and intracranial hypertension.5–7 Therefore, exploring sensitive and specific diagnostic strategies, including screening for novel, specific, potentially diagnostic biomarkers in acute CVT, may be an important strategy to solve this diagnostic dilemma.
Metabolomics is a useful screening tool for identifying biomarkers of disease. 8 Previous studies have used untargeted metabolomics to investigate the application of metabolic biomarkers in the diagnosis of stroke and to determine the metabolic characteristics of ischemic stroke8,9 and transient ischemic attack (TIA). 10 Considering the efficiency and high-throughput nature of the metabolomic approach, it is possible to develop novel diagnostic panels using this method to rapidly identify patients with acute CVT. In this study, a metabolomic approach based on liquid chromatography tandem mass spectrometry (LC–MS) identified potential biomarkers for the rapid diagnosis of acute CVT and distinguished acute CVT from other cerebrovascular diseases.
Materials and methods
Study participants
Patients and healthy controls were prospectively enrolled in Xuanwu Hospital, Capital Medical University between January 2020 and December 2021. All participants provided written informed consent and abided by the ethical principles described in the current revision of the Declaration of Helsinki, and the study was approved by the ethics committee of Xuanwu Hospital, Capital Medical University ([2020]098). The inclusion criteria for acute CVT patients (within 7 days after the onset of symptoms) were as follows: patients with acute CVT diagnosed by MRI + MRV, CT + CTV, or conventional DSA following established diagnostic criteria, 11 and age ≥16 years. Inclusion was not limited based on sex. Healthy controls matched by age and sex were enrolled from the physical examination center of the hospital in the discovery and verification stages. Individuals with diseases affecting serum markers, such as tumors, polycystic ovarian syndrome, metabolic syndrome, infection, malignant hematologic disease, amino acid, hormone or vitamin supplementation, and alcohol consumption within 48 hours prior to blood collection, were excluded from the study. Finally, a total of 13 eligible controls and 40 eligible acute CVT patients were selected for the study. Plasma from these individuals was analyzed by untargeted metabolomics to identify candidate biomarkers with high predictive power for CVT. In the validation stage, we collected a validation cohort of 61 eligible healthy controls (HC), 65 eligible cerebral artery infarction (CI) controls according to the Guidelines for the Early Management of Patients with Acute Ischemic Stroke, 12 66 eligible cerebral hemorrhage (non-traumatic intracerebral hemorrhage, CH) controls according to the 2022 AHA Guidelines, 13 and 67 patients with acute CVT to verify the proposed biomarkers. The flow chart of the study design is shown in Figure 1.
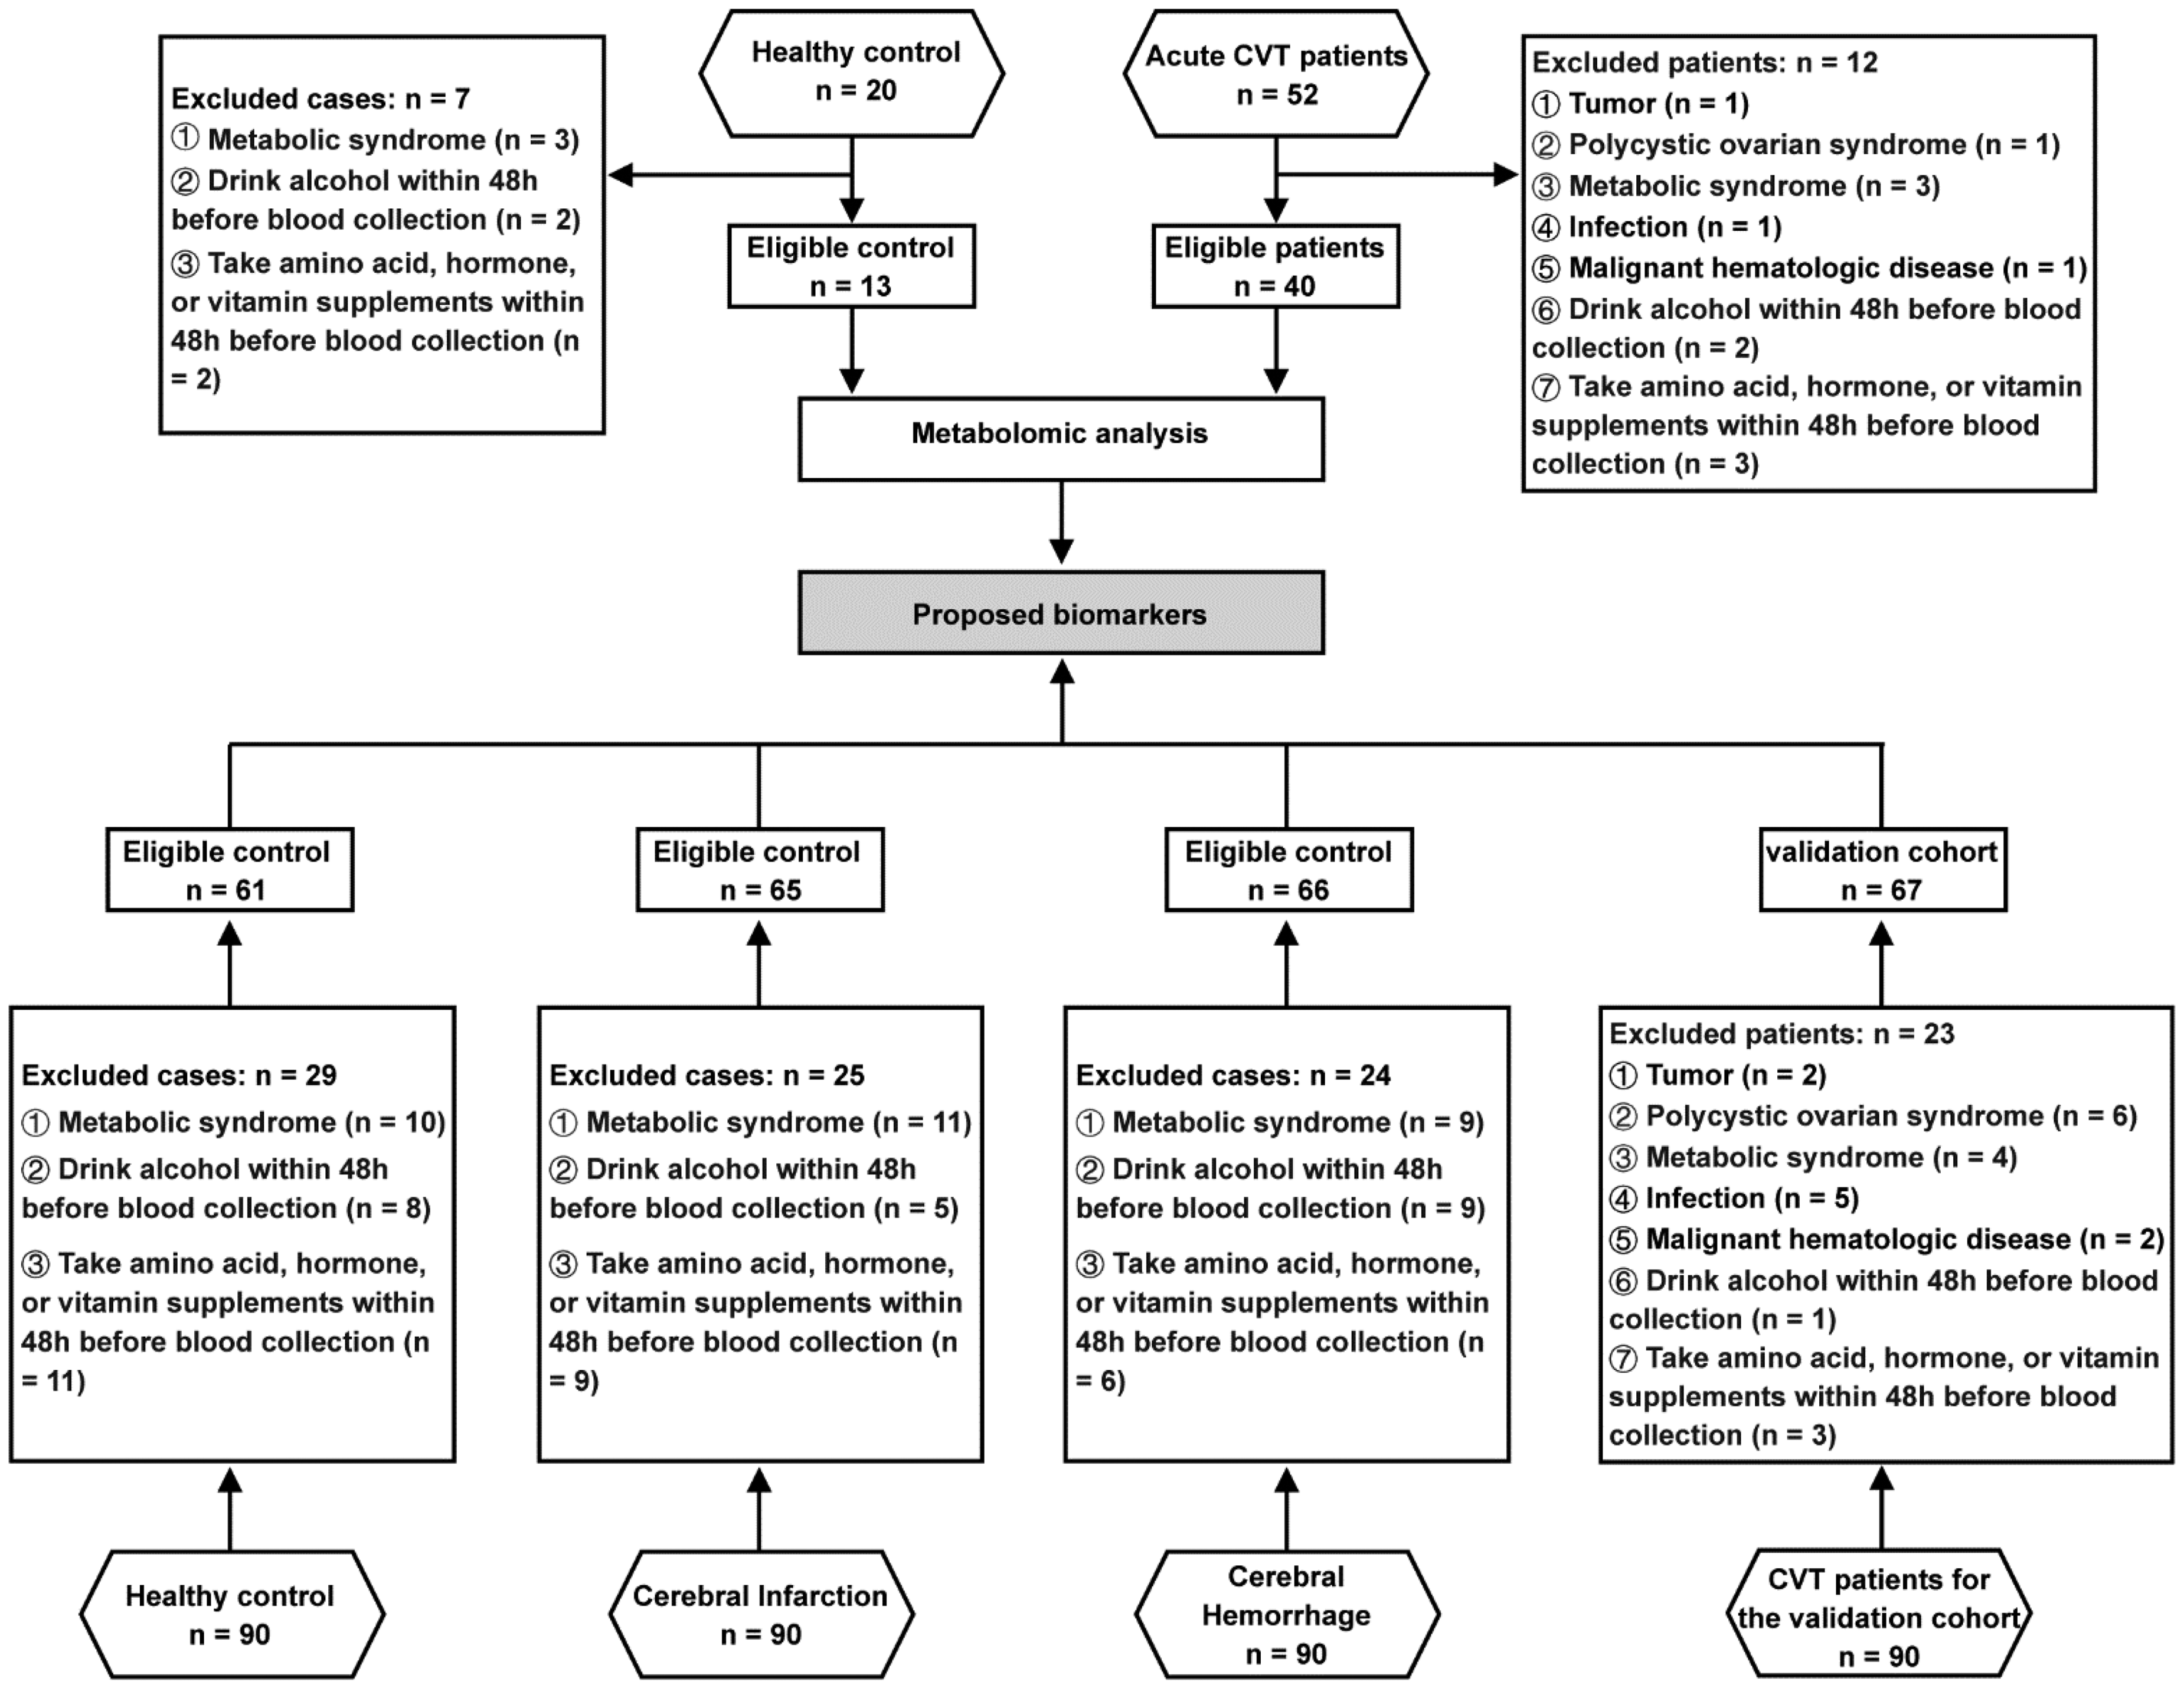
Flow chart of the study design.
Blood was collected from fasted patients on the first morning of admission. In the discovery stage, the median timepoint of blood collection in the CVT group was 5.0 (3.0, 6.0) days. In the validation stage, the median timepoint of blood collection was 5.0 (4.0, 6.0) days for the CVT group, 5.0 (3.0, 5.0) days for the CI group, and 5.5 (3.5, 5.5) days for the CH group. Whole blood samples containing EDTA were centrifuged at 3000 rpm at 4°C for 15 min and immediately stored at −80°C until metabolomic analysis was performed.
Clinical characteristics
Demographic data affecting serum markers, including age, sex, body mass index (BMI), systolic blood pressure (SBP), diastolic blood pressure (DBP), white blood cell (WBC) count, plasma concentration of triglycerides (TGs), total cholesterol (TC), high-density lipoprotein (HDL), low-density lipoprotein (LDL), homocysteine (Hcy), D-dimer, glucose (Glu), clinical characteristics, the National Institutes of Health Stroke Score (NIHSS), as well as the modified Rankin Score (mRS), were collected on admission.
Sample preparation
Prior to analysis, serum samples were thawed slowly at 4°C; 100 μL was placed into a 96-well plate; and 300 μL extract (methanol: CAN = 2:1, V: V, precooling at −20°C) was added, vortexed for 1 min, stored at −20°C for 2 h, and centrifuged at 4000 rcf at 4°C for 20 min. After centrifugation, 300 μl supernatant was drained in a vacuum concentrator, and 150 μl complex solution (methanol: H2O = 1:1, v: v) was added for redissolution, followed by vortexing shock for 1 min and centrifugation at 4000 rcf for 30 min at 4°C. The supernatant was placed in a sample bottle. Ten microliters of each supernatant were mixed into QC samples to evaluate the repeatability and stability of LC-MS/MS analysis.
Untargeted metabolomic data processing
Untargeted LC–MS analysis was used for plasma metabolomic analysis, and a high-resolution mass spectrometer (Q Exactive HF, Thermo Fisher Scientific, USA) was used for primary and secondary mass spectrometry data acquisition. Positive and negative ion modes were used to improve the coverage of metabolites.
The range of the mass-to-charge ratio (m/z) scan was 70-1050. According to the parent ion strength, Top3 was selected for fragmentation, and secondary information was collected. The secondary resolution was 30,000; the maximum injection time was 50 ms; and the stepped nce was set to 20, 40, and 60 eV. Ion source (ESI) parameter settings: The sheath gas flow rate was 40, the Aux gas flow rate was 10, the spray voltage (|KV|) positive ion mode was 3.80, the negative ion mode was 3.20, the capillary temperature was 320°C and the Aux Gas heater temperature was 350°C.
Data analyses were performed by staff who was blinded to clinical data. Compound Discoverer 3.0 (ThermoFisher Scientific, USA) software was used for LC-MS data processing, including peak extraction, peak alignment, and compound identification. Data preprocessing, statistical analysis, classification annotation and functional annotation were performed using MetaboAnalyst software (https://www.metaboanalyst.ca/). 14 Principal component analysis (PCA) was used to reduce the dimensionality of the original multivariate data to analyze the grouping, trend (difference between sample groups) and outliers (whether there were abnormal samples) of the observed variables in the dataset. Candidate metabolites were selected based on variable influence in projection (VIP) values >1 from the partial least-squares discriminant analysis (PLS-DA) model and fold change (FC) cutoff at >1.2 (or FC < 0.83). Random Forest Analysis was selected as the classification method and feature ranking method to identify the most significantly expressed metabolites in the two comparison groups. Using a forest size of 50,000-trees, the importance score was used to identify metabolites. Receiver operating characteristic (ROC) curves were generated by Monte-Carlo cross validation (MCCV) using balanced sub-sampling. In each MCCV, 2/3 of the samples were used to evaluate the importance of the features. The top 2, 3, 5, 10 … 100 (max) important features were then used to build the classification models, which was validated on the 1/3 of the samples that were left out. The procedure was repeated multiple times to calculate the performance and confidence interval of each model. The area under the receiver operating characteristic curve (AUC) was used to compare the predictive performance results of each prediction portfolio and calculate sensitivity and specificity AUC values with 95% confidence intervals (CIs). The mean AUC, the standard deviation (SD) of the AUC and the 95% CI of the mean AUC were analyzed and calculated for statistical significance (P < 0.05).
Measurement of potential biomarkers
In the validation stage, the plasma concentrations of valine, leucine and isoleucine were detected by a branched chain amino acid kit (Sigma, MAK003-1kT, USA) according to the instructions of the manufacturer.
Statistical analysis
All the clinical data were analyzed with SPSS 19.0 (SPSS Inc., Chicago, IL) and GraphPad Prism 6 (GraphPad Software, La Jolla, CA), and baseline characteristics and outcome proportions were reported using descriptive statistics. Since there were no similar studies to refer to, the sample size was determined through expert validation (n ≥ 60) based on the principles of exploratory small sample studies. Continuous variables are expressed as the mean ± standard deviation (SD) or median with interquartile range (IQR), and categorical variables are expressed as percentages. Values of the measured parameters were checked for conformity to a normal distribution by means of the Kolmogorov-Smirnov test prior to statistical analysis. Bivariate analysis with the t test or Mann–Whitney U test for continuous variables and the chi-square test for categorical variables were used to compare the variables between two groups. All tests were two-sided, and P < 0.05 was considered statistically significant.
Results
Characteristics of participants in the discovery stage
In the discovery stage, 13 healthy controls with an average age of 31.62 ± 9.57 years and 40 patients with acute CVT with an average age of 32.77 ± 14.17 years were enrolled. There were 29 (72.50%) females in the CVT group and 9 (69.23%) females in the control group. Univariate analysis revealed that baseline demographic and clinical variables, such as BMI; SBP; DBP; WBC count; and plasma concentrations of TGs, TC, HDL, LDL, Hcy, and Glu, were not significantly different between the healthy control and CVT groups. The detailed baseline demographic and clinical variables are presented in Supplementary Table 1.
Differential metabolites of acute CVT patients in the discovery stage
To screen the differential metabolites for CVT, we used fold change (FC) analysis and t tests to perform univariate statistical analysis of metabolites and then plotted the volcano plot. P < 0.05 and FC > 2 or < 0.5 were used as screening criteria for differential metabolic indices. Compared with the healthy control group, there were 343 differential metabolites in the CVT group, among which 224 were significantly upregulated and 119 were significantly downregulated (Figure 2(a)). Moreover, a multivariate analysis was conducted using MetaboAnalyst software. Orthogonal partial least squares discriminant analysis (OPLS-DA) was used and showed good separation between the healthy control and CVT groups, indicating high correlation within the group and great difference between groups (Figure 2(b)). The partial least squares discriminant analysis (PLS-DA) showed good consistency among samples within the CVT group (red dots are close together in clusters) and significant variability between groups (red and green dots are separated) (Figure 2(c)). Student's t test was used to find and confirm potential biomarkers from the data. A heatmap of the top 100 differential plasma metabolites similarly showed consistency within the CVT group and variability with the healthy control group (|log2FC| ≥ 1, P ≤ 0.05, Figure 2(d)).
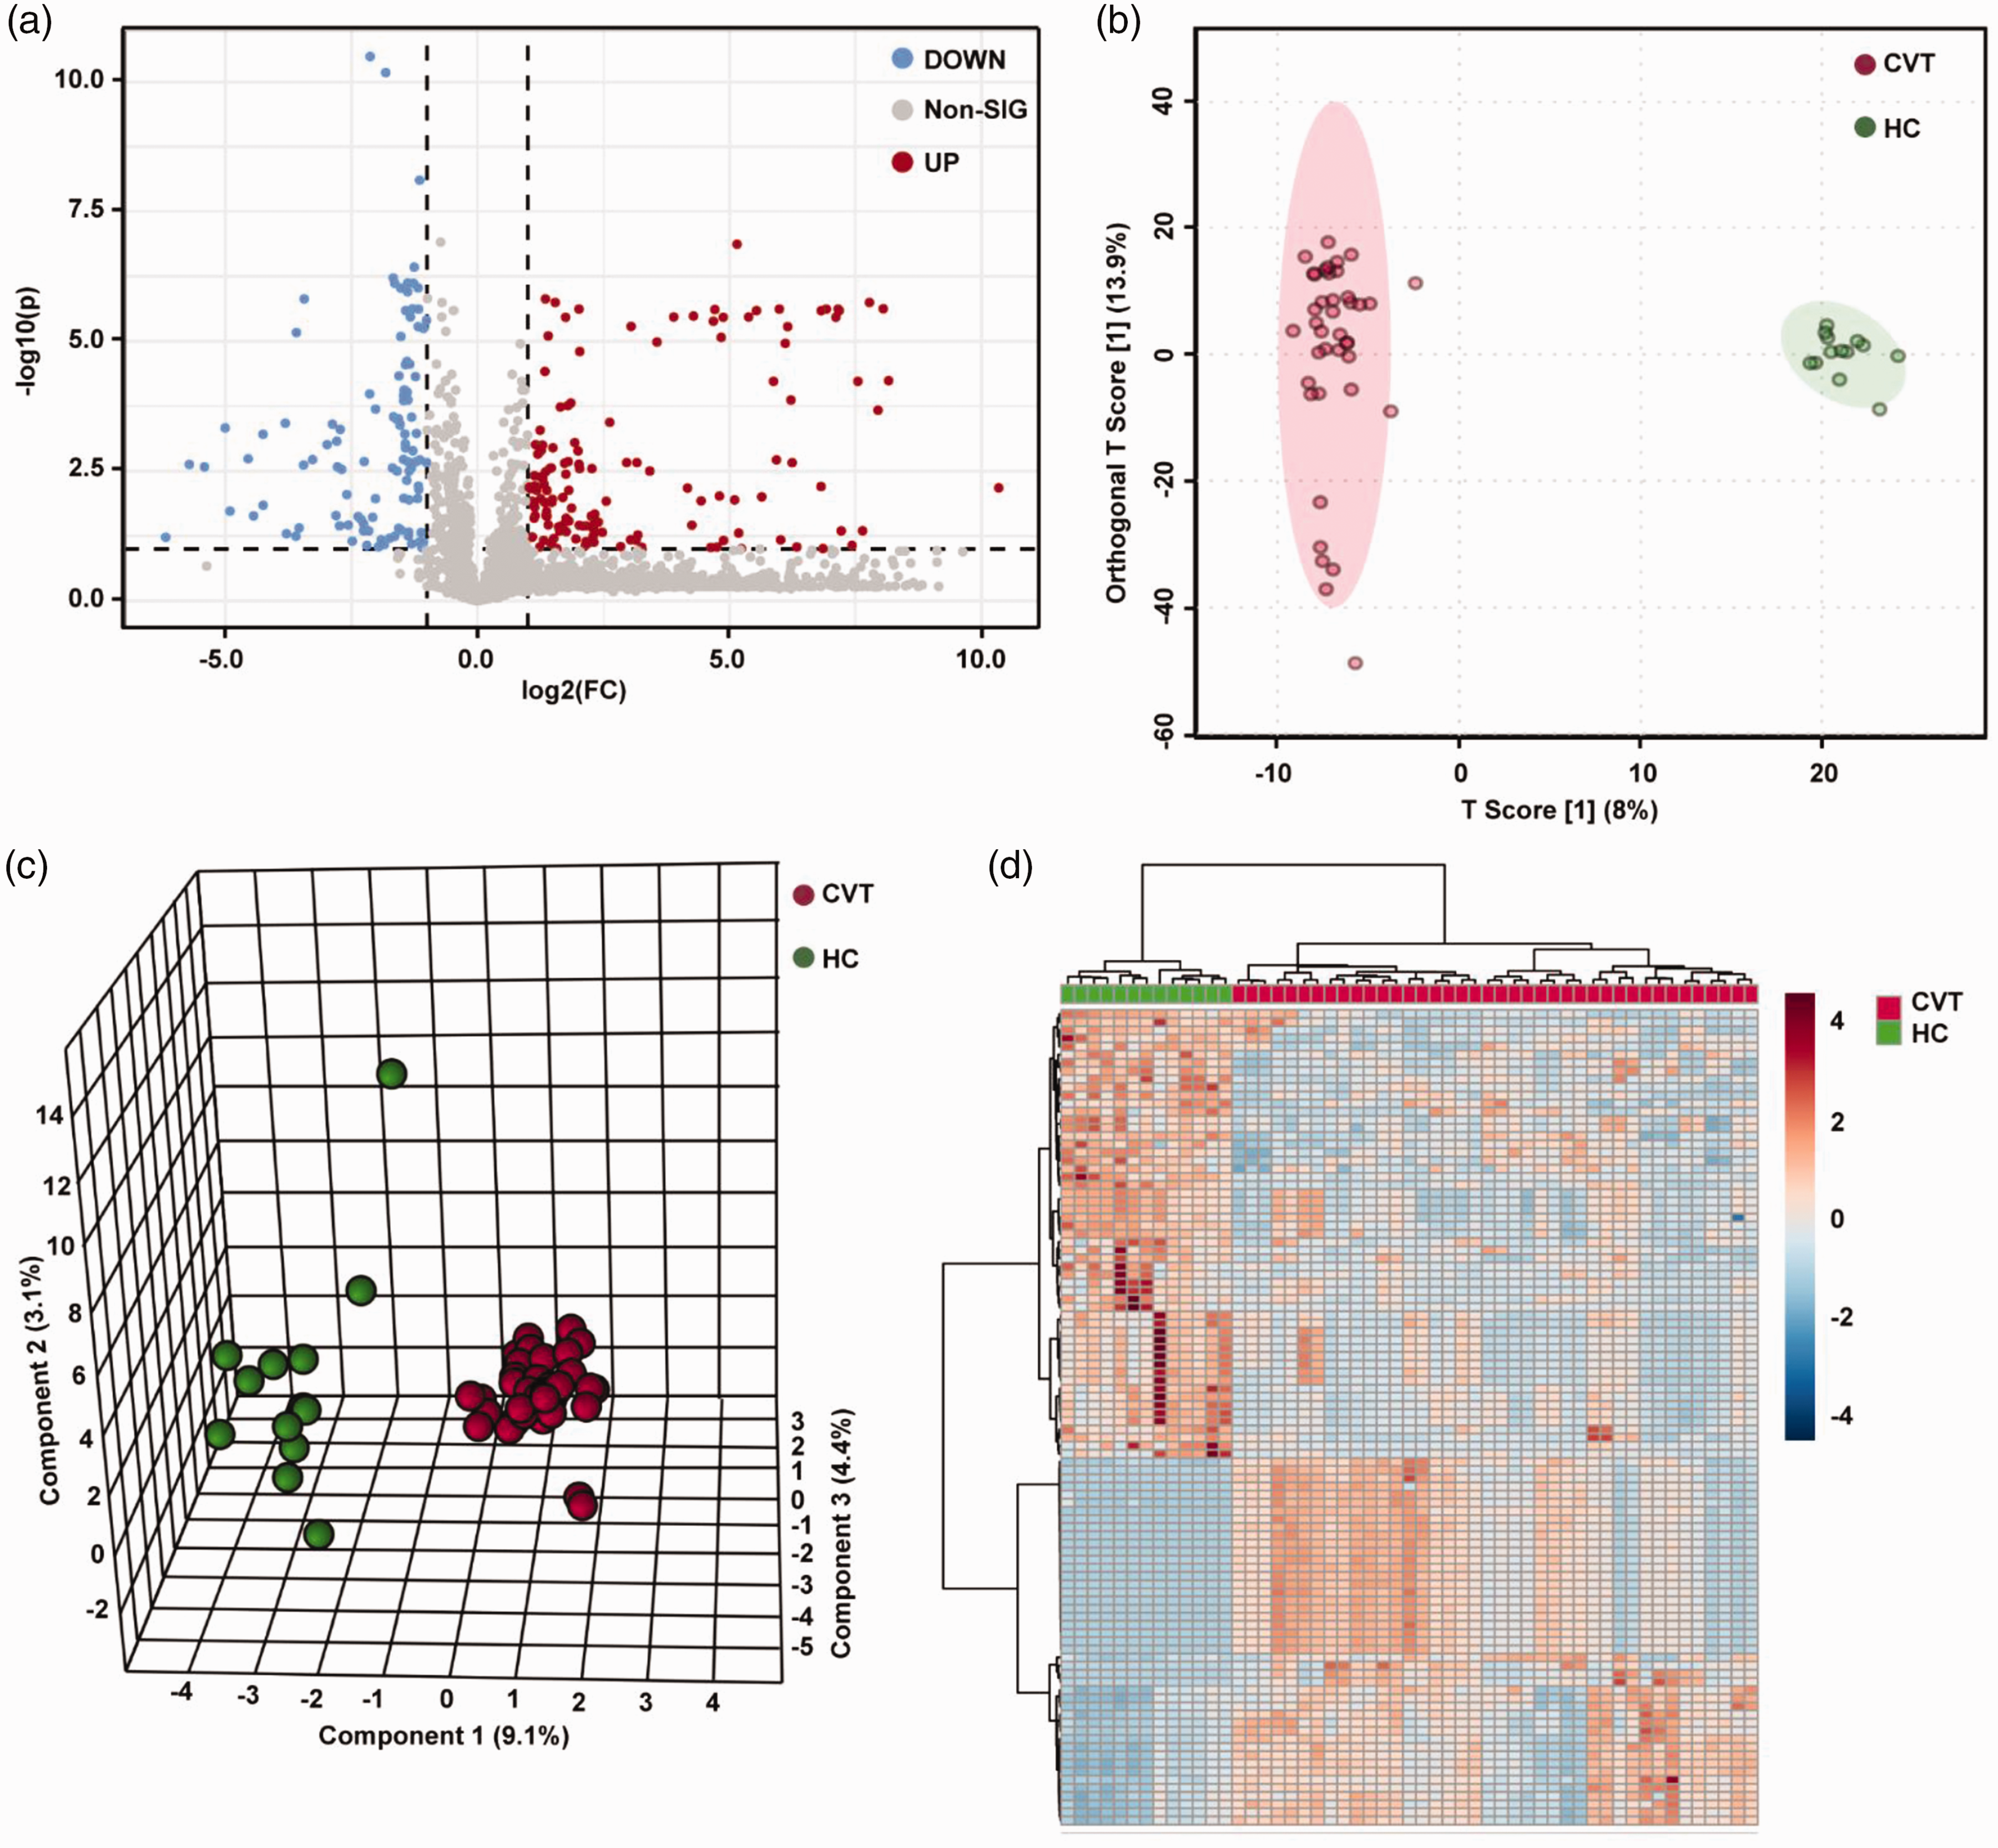
Metabolic profile of patients with CVT compared with healthy controls. (a) Volcano plot of plasma metabolites in patients with CVT and healthy controls. Red dots represent significantly upregulated metabolites (FC > 2, P < 0.05), and blue dots represent significantly downregulated metabolites (FC < 0.5, P < 0.05). (b) OPLS-DA two-dimensional plot. Ellipses represent 95% CIs between CVT and healthy control groups. (c) The three-dimensional PLS-DA plot showing good model discrimination between patients with CVT compared with healthy control groups. (d) Heatmap of the top 100 metabolites with significant changes (P < 0.05).
Analyses of metabolic pathways between the acute CVT and healthy control groups
We performed metabolic pathway analysis on 343 differential plasma metabolites between the acute CVT and healthy control groups. The identified differential metabolites were analyzed using metabolite set enrichment analysis with MetaboAnalyst software. We found that caffeine metabolism (KEGG pathway: hsa00232, P = 0.006) and valine, leucine, and isoleucine biosynthesis (KEGG pathway: hsa00290, P = 0.040) were two statistically significant pathways in the pathway enrichment analysis between the CVT and healthy control groups (Figure 3(a) and (b)). The relative peak intensities of all detected metabolites are shown in Figure S1. Significantly, the three metabolites valine, isoleucine, and leucine are BCAAs.
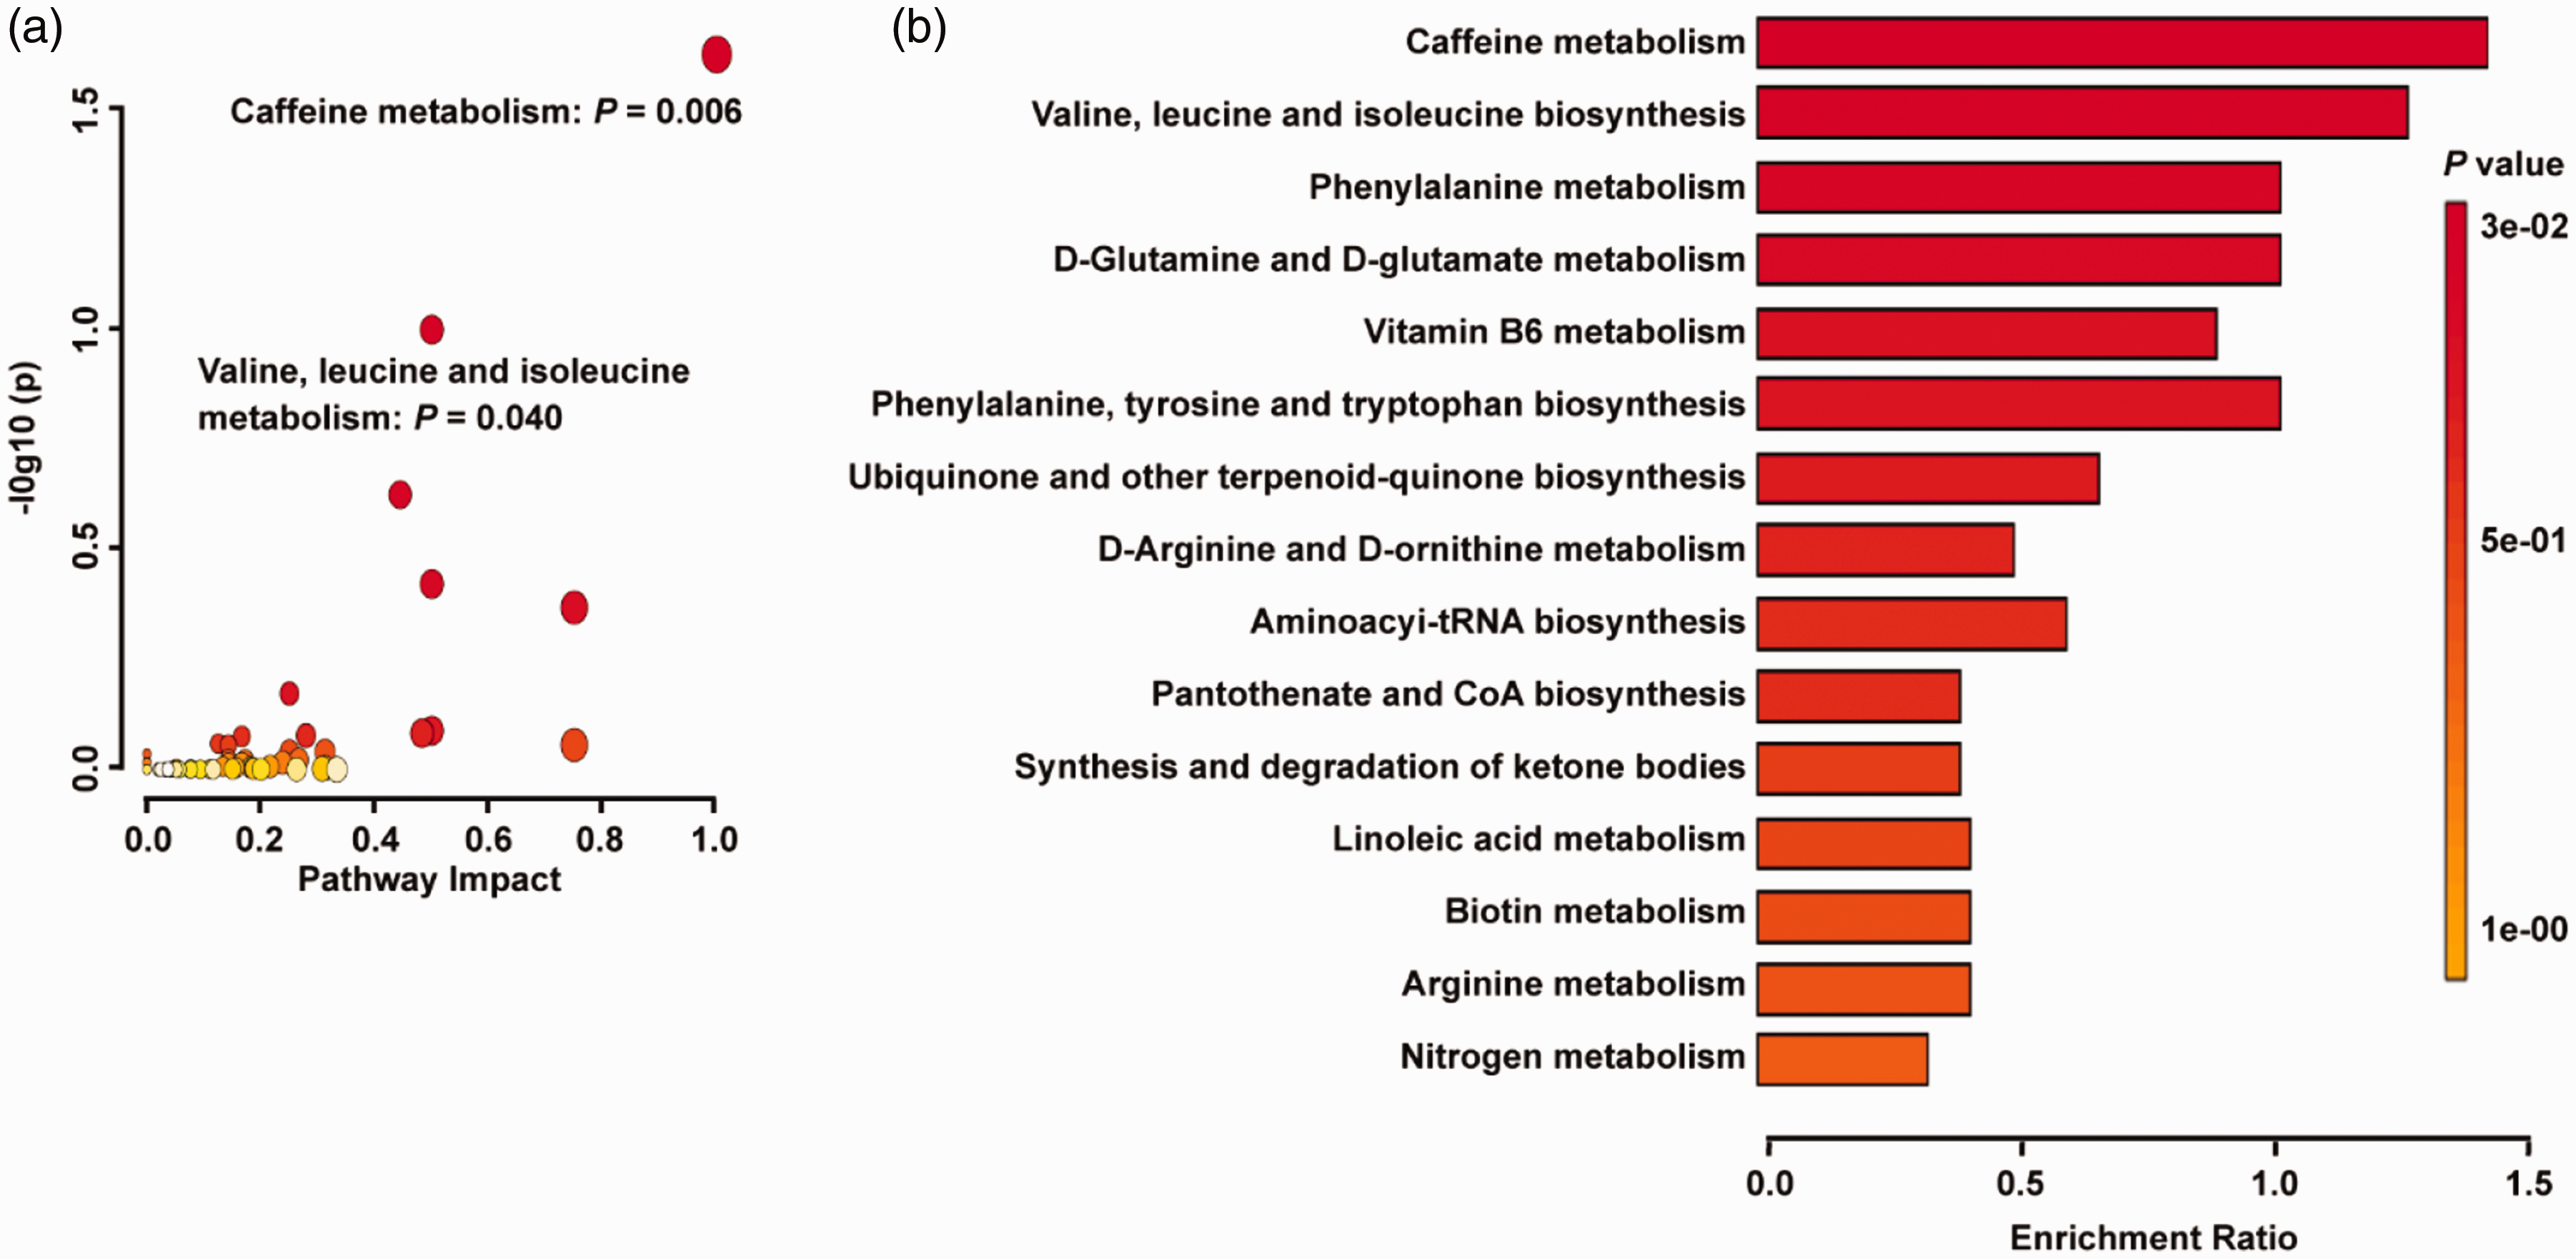
Metabolic pathway analysis based on differential metabolites identified in the plasma of patients with CVT and healthy controls. (a) The KEGG metabolic pathway database showed that the caffeine metabolism pathway and valine, leucine, and isoleucine biosynthesis pathway were statistically significant pathways. The X-axis represents the pathway impact, and the Y-axis represents –log10 (P). (b) Metabolite set enrichment analysis showed that the caffeine metabolism and valine, leucine, and isoleucine biosynthesis pathways are statistically significant pathways based on differential metabolites identified in the plasma of patients with CVT and healthy controls.
Establishment of a diagnostic model for acute CVT
The ROC analysis of the caffeine metabolism pathway showed good separation of the CVT group and the healthy control group, with AUCs of 0.768 (95% CI: 0.613–0.918, P = 0.002) for theobromine, 0.690 (95% CI: 0.441–0.891, P = 0.004) for paraxanthine, 0.729 (95% CI: 0.494–0.962, P = 0.003) for caffeine, 0.716 (95% CI: 0.576–0.891, P = 0.000) for 7-methylxanthine, 0.869 (95% CI: 0.638–0.966, P = 0.000) for 1,7-dimethyluric acid, and 0.757 (95% CI: 0.482–0.932, P = 0.001) for 1-methylxanthine (Supplementary Table 2).
The ROC analysis of the valine, leucine, and isoleucine biosynthesis pathway also showed good separation of the CVT and healthy control groups, with an AUC of 0.679 (95% CI: 0.463–0.853, P = 0.012) for threonine, 0.889 (95% CI: 0.758–0.954, P = 0.000) for valine, 0.894 (95% CI: 0.719–1.000, P = 0.004) for isoleucine, and 0.880 (95% CI: 0.660–0.988, P = 0.047) for leucine (Supplementary Table 2).
Based on the potential metabolites that were selected above, we established diagnostic models using all the significantly changed metabolites. A random forest model was used to establish the CVT diagnostic model, and the diagnostic performance was evaluated by a ROC curve. When the six metabolites in the caffeine metabolism pathway were combined in the diagnostic model, the AUC was 0.839 (95% CI: 0.621–0.958, P = 0.000), with 0.764 average accuracy based on 100 cross validations (Figure 4(a)). When the four metabolites in the valine, leucine, and isoleucine biosynthesis pathway were combined in the diagnostic model, the AUC was 0.934 (95% CI: 0.831–0.992, P = 0.000), with 0.803 average accuracy based on 100 cross validations (Figure 4(b)).
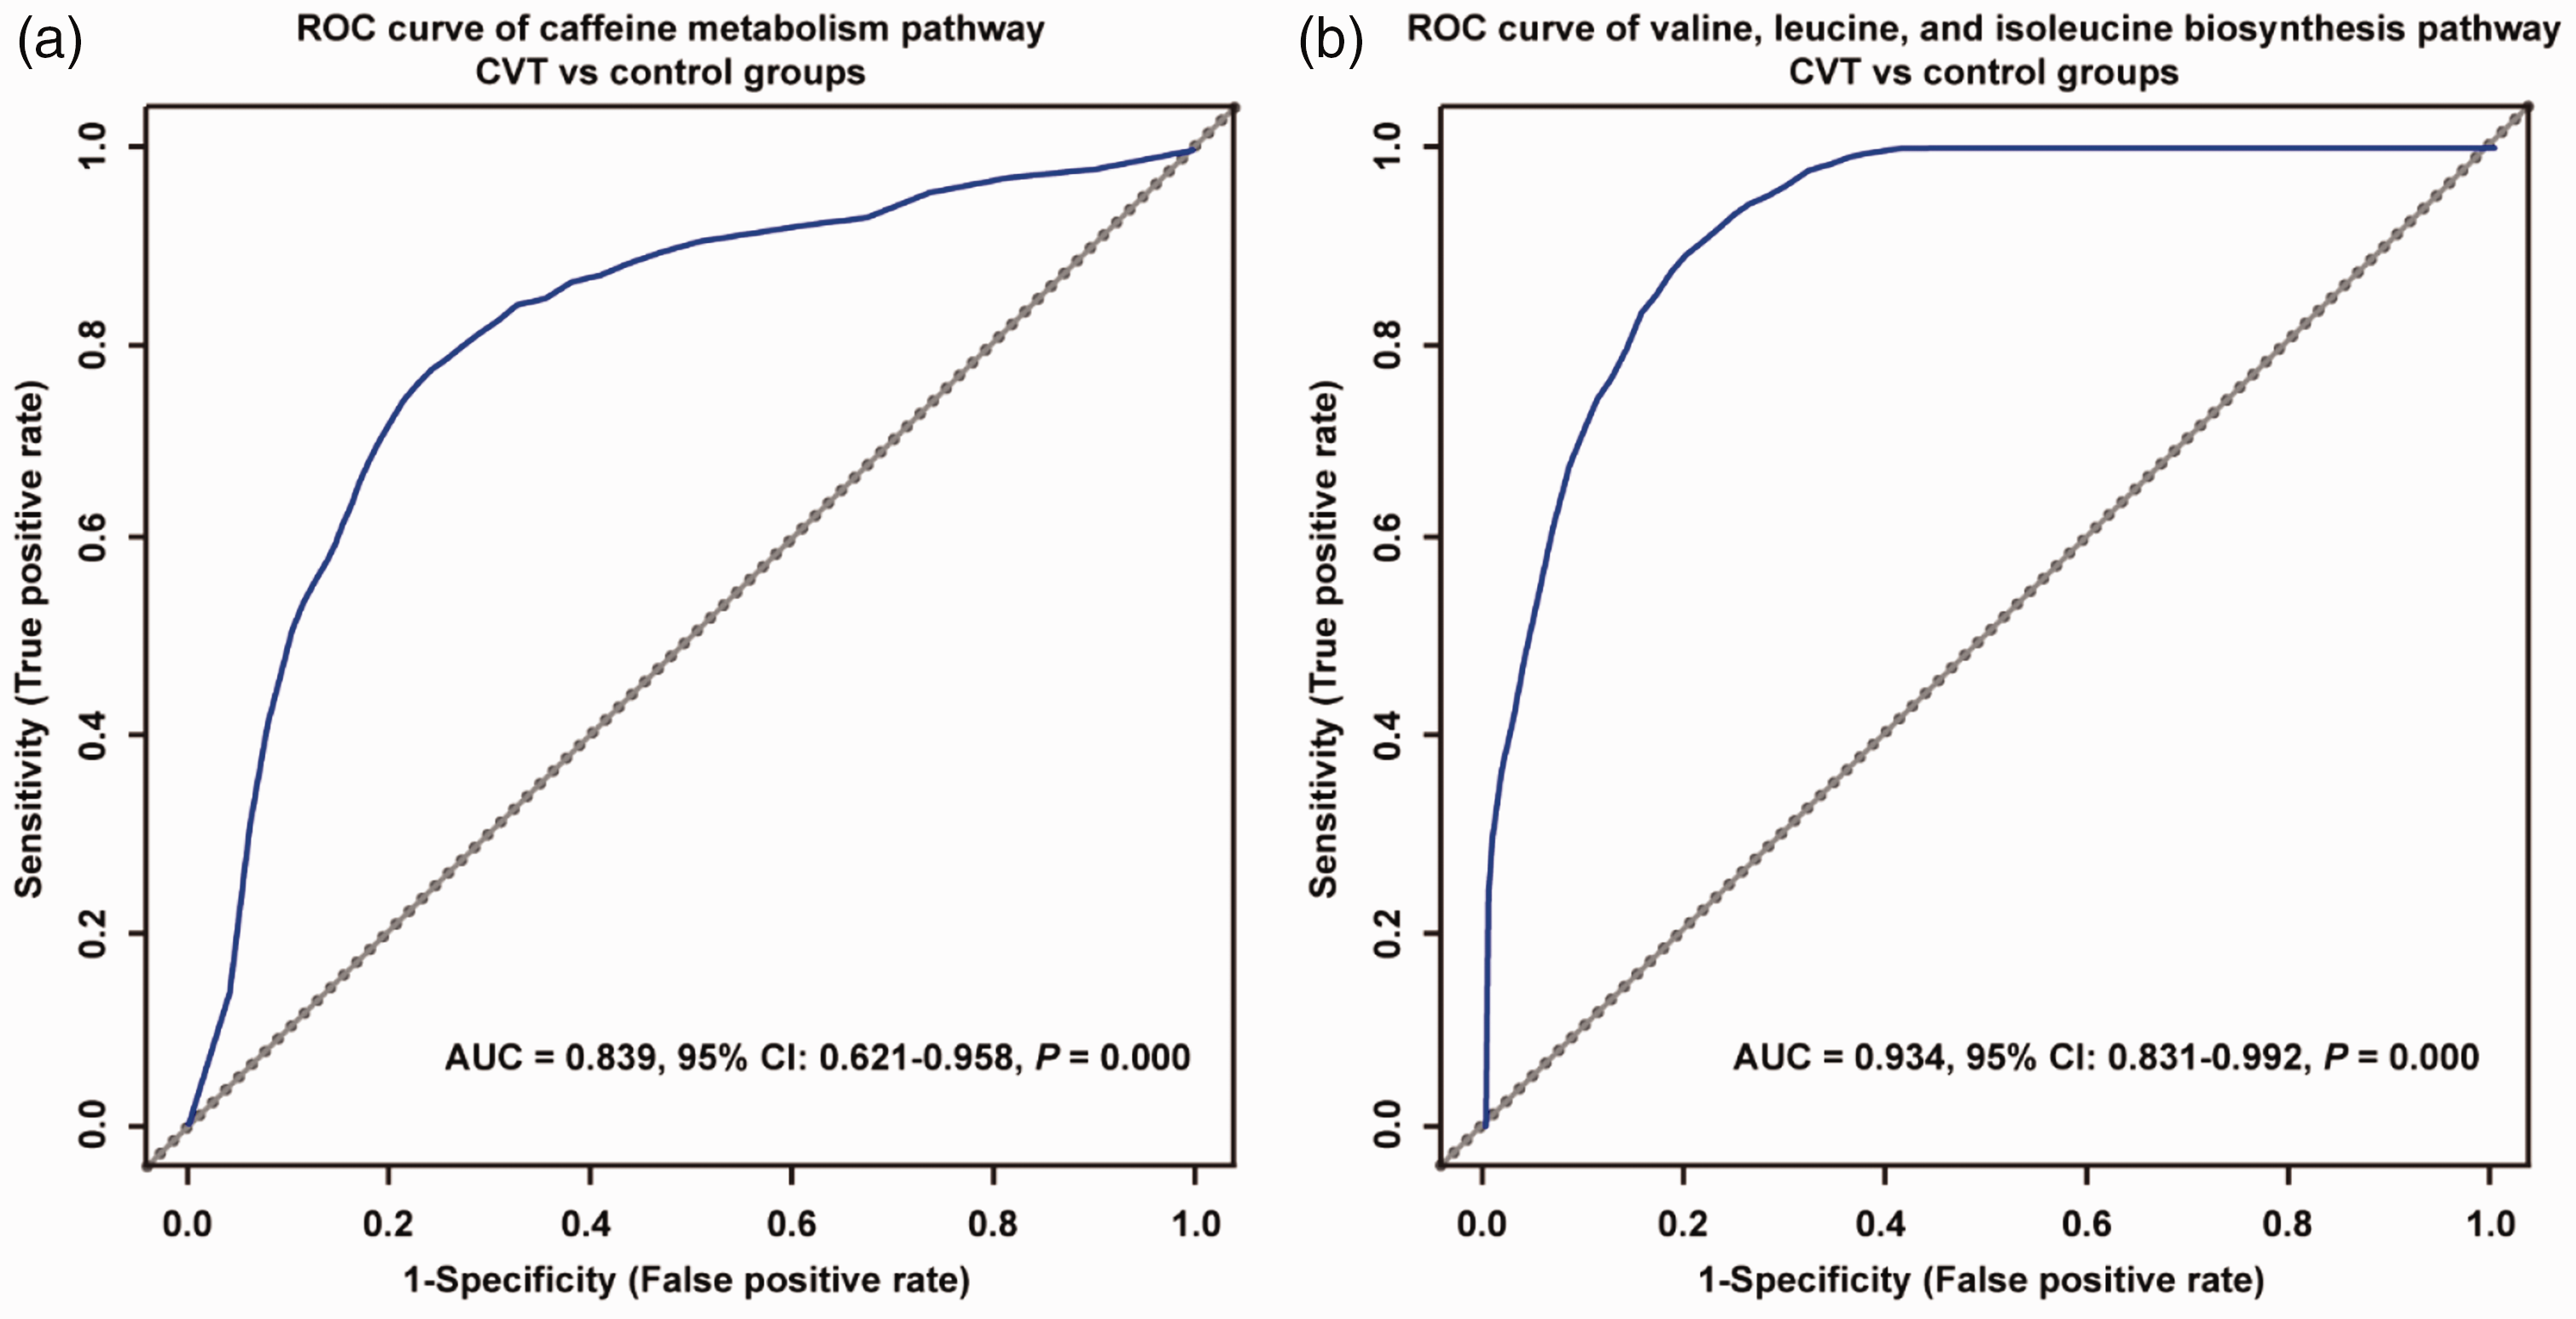
ROC analysis of the caffeine metabolism pathway and the valine, leucine, and isoleucine biosynthesis pathway in the discovery stage. (a) ROC analysis of the combination of six metabolites in the caffeine metabolism pathway in differentiating the CVT and control groups. The AUC is 0.839. (b) ROC analysis of the combination of four metabolites in the valine, leucine, and isoleucine biosynthesis pathway in differentiating the CVT and control groups. The AUC is 0.934.
Diagnostic and differential diagnostic value of BCAA concentrations in acute CVT in the validation stage
In the validation stage, 61 healthy controls, 65 patients with cerebral infarction, 66 patients with cerebral hemorrhage, and 67 patients with CVT were included. The baseline characteristics of these participants are shown in Supplementary Table 3. There were 40 (59.70%) females with an average age of 37.09 ± 15.58 years in the CVT group, 38 (58.46%) females with an average age of 35.63 ± 13.50 years in the cerebral infarction group, 37 (56.06%) females with an average age of 36.39 ± 13.72 years in the cerebral hemorrhage group, and 31 (50.81%) females with an average age of 33.92 ± 12.89 years in the healthy control group. Furthermore, BMI, SBP, DBP, WBC count, TGs, TC, HDL, LDL, Hcy, Glu, and NIHSS scores showed no significant differences among the four groups.
Compared with the healthy control, cerebral infarction control and cerebral hemorrhage control groups, patients with CVT had lower concentrations of BCAAs, and the concentrations (pmol/μl) of BCAAs in the cerebral infarction control (113.84 ± 12.75) and cerebral hemorrhage control groups (107.69 ± 9.80) were higher than those in the healthy control (70.86 ± 12.55) and CVT groups (53.26 ± 15.83, Figure 5(a)). In addition, the AUC of plasma BCAA concentrations was 0.935 (95% CI: 0.907–0.963, P = 0.001), distinguishing patients with CVT from healthy controls, cerebral infarction controls, and cerebral hemorrhage controls (Figure 5(b)). Furthermore, the ROC analysis showed good separation of the cerebral infarction control and healthy control groups, with an AUC of 0.875 (95% CI: 0.831–0.919, P = 0.000), which could distinguish cerebral infarction patients from healthy controls, cerebral hemorrhage controls and CVT patients (Figure 5(c)). Cerebral hemorrhage had an AUC of 0.780 (95% CI: 0.723–0.835, P = 0.000) for distinguishing patients with cerebral hemorrhage from healthy controls, cerebral infarction controls and CVT patients (Figure 5(d)).
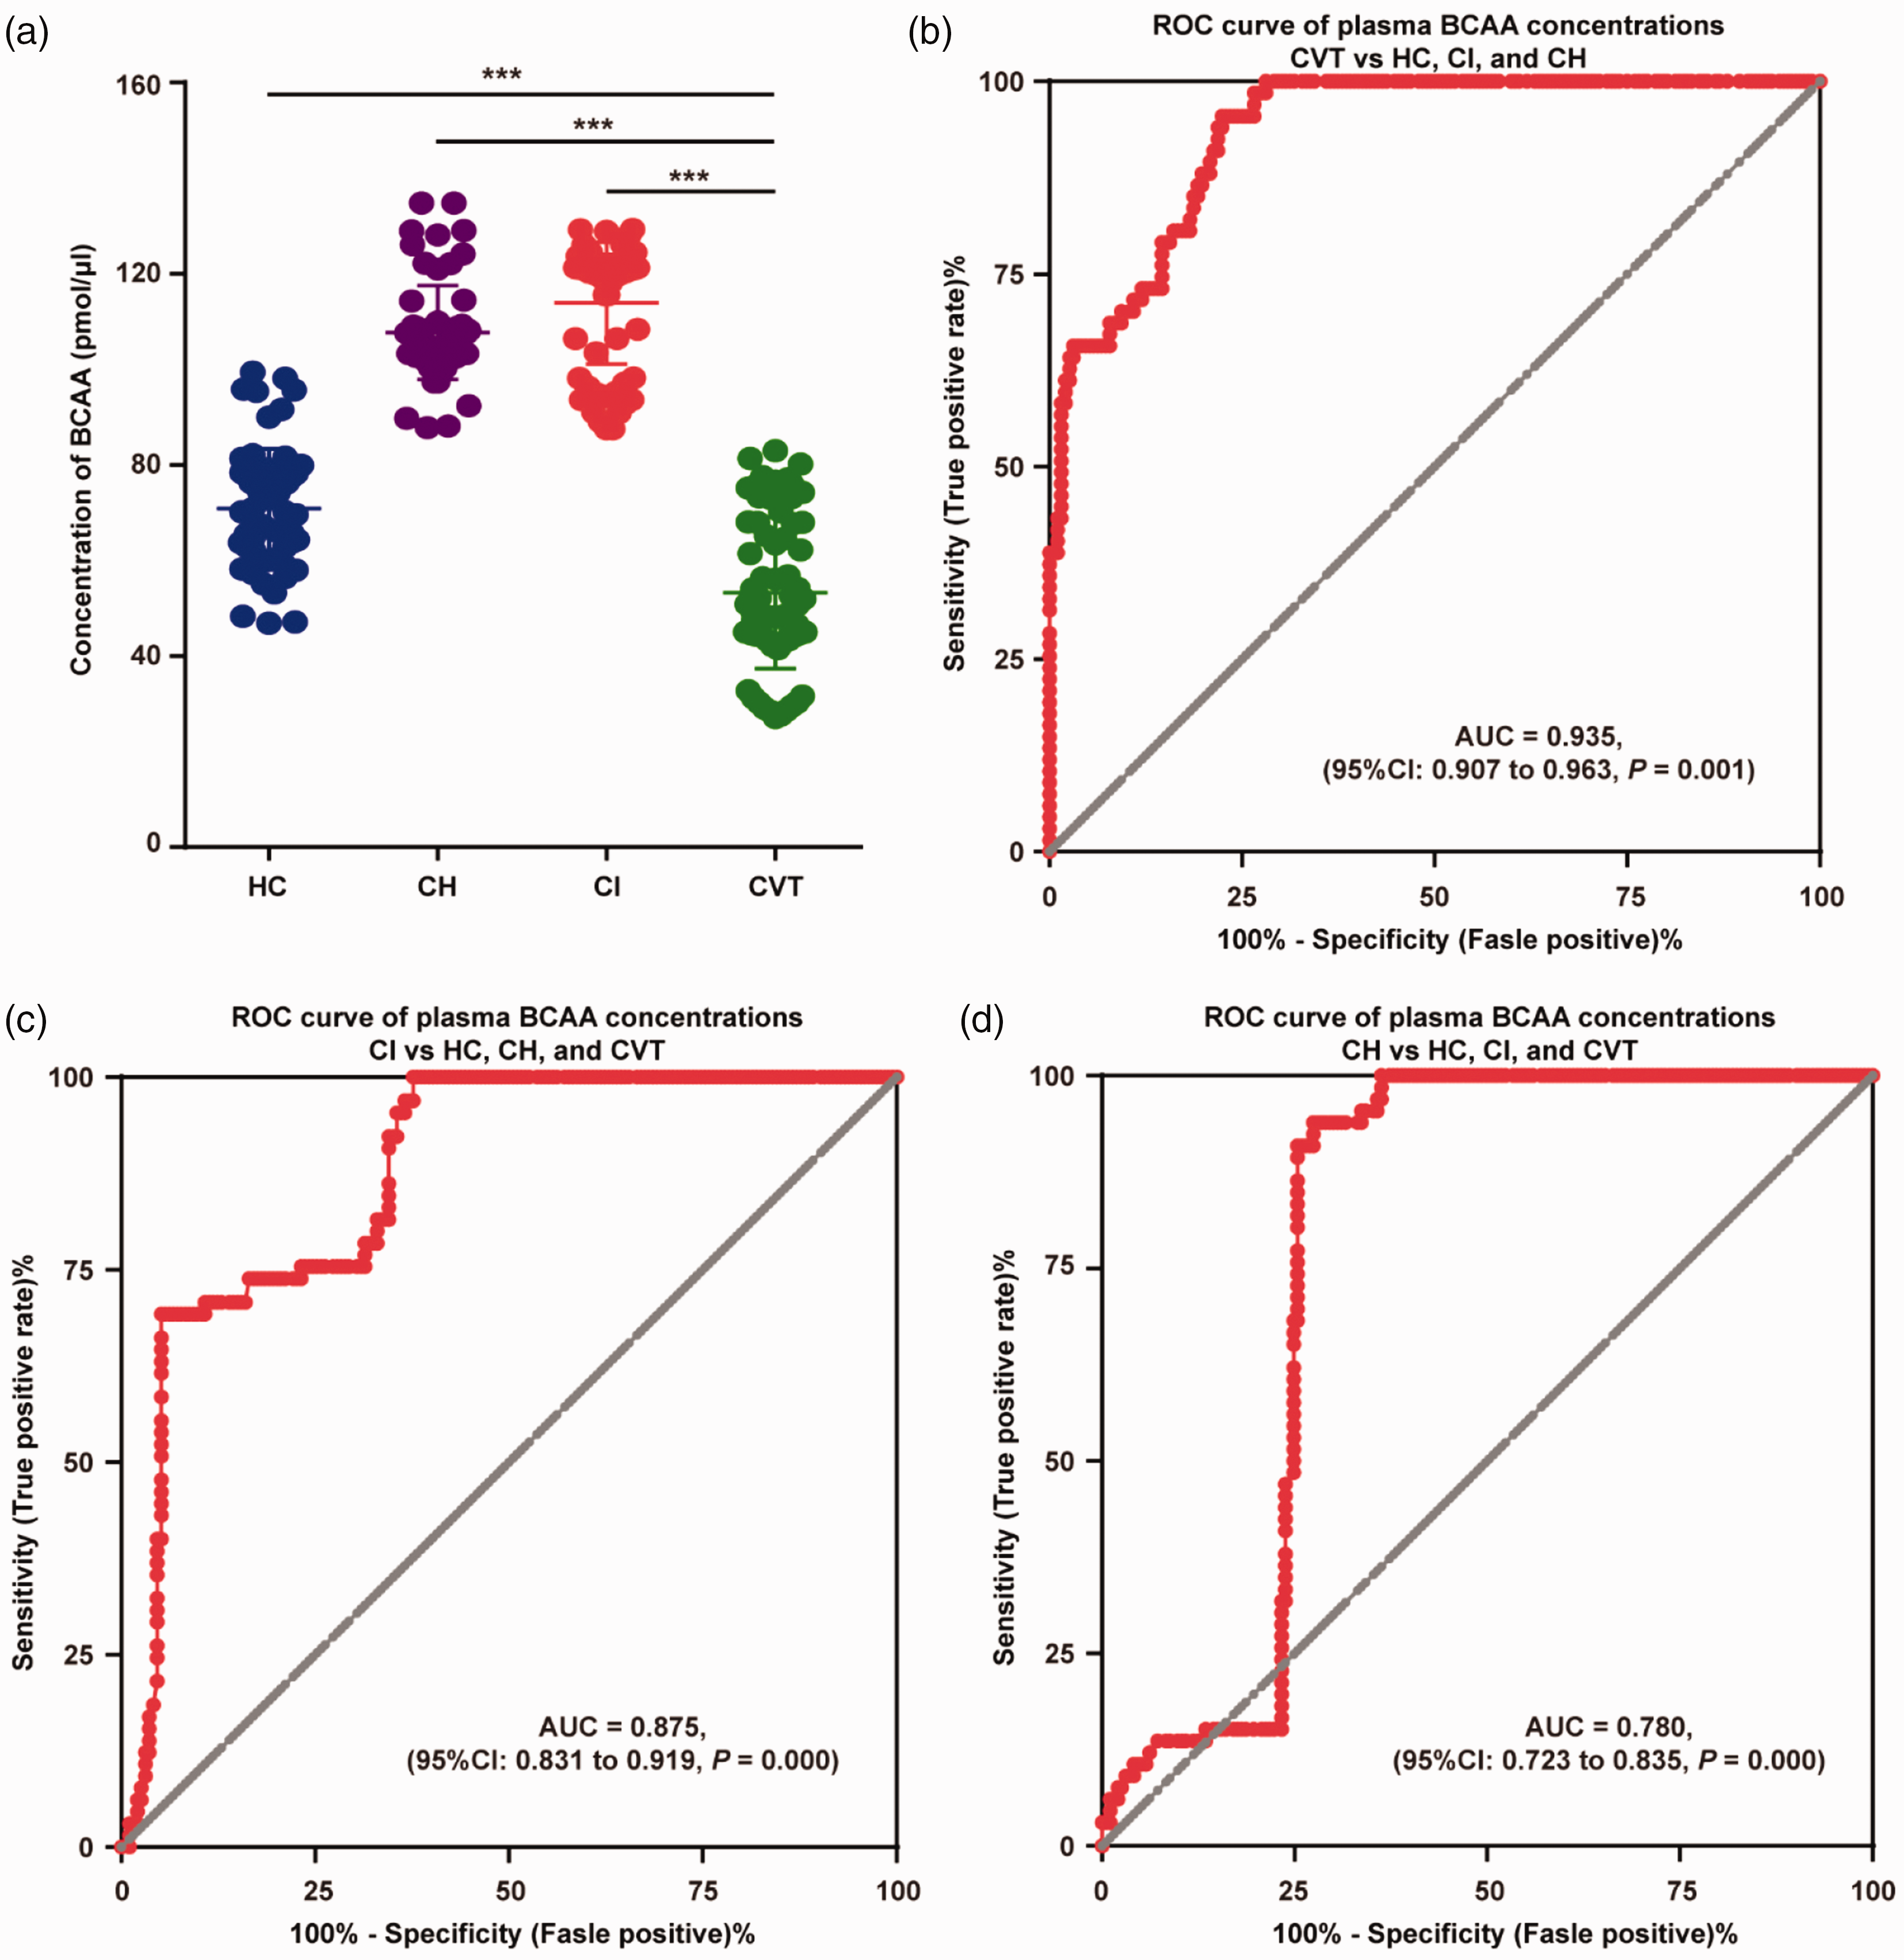
BCAA concentrations and ROC analysis in healthy controls, cerebral hemorrhage controls, cerebral infarction controls, and patients with CVT in the validation stage. (a) In the validation stage, there were lower plasma BCAA concentrations in the CVT group than in the healthy control, cerebral infarction control, and cerebral hemorrhage control groups; the cerebral infarction control and cerebral hemorrhage control groups had higher plasma BCAA concentrations than the healthy control group. (b) The ROC analysis of plasma BCAA concentrations showed an AUC of 0.935 (95% CI: 0.907–0.963) to differentiate patients with CVT from healthy controls, cerebral infarction controls, and cerebral hemorrhage controls. (c) The ROC analysis of plasma BCAA concentrations showed an AUC of 0.875 (95% CI: 0.831–0.919) to differentiate cerebral infarction patients from healthy controls, cerebral hemorrhage controls and CVT patients. (d) The ROC analysis of plasma BCAA concentrations showed an AUC of 0.780 (95% CI: 0.723–0.835) to differentiate cerebral hemorrhage patients from healthy controls, cerebral infarction controls and CVT patients.
BCAAs combined with D-dimer may be a specific diagnostic model for CVT
D-dimer, a product of fibrin degradation, plays an important role in the diagnosis of deep vein thrombosis, pulmonary embolism, and CVT, and D-dimer levels can be used as important indicators for technical screening in symptomatic outpatients with CVT. A meta-analysis showed that the average sensitivity and specificity of elevated serum D-dimer concentrations for the diagnosis of CVT were 93.9% and 89.7%, respectively. 15
Compared with the healthy control group (324.85 ± 132.850), the concentration (ng/μL) of D-dimer was significantly higher in the cerebral infarction group (1107.92 ± 506.730), the cerebral hemorrhage group (1409.83 ± 479.237), and the CVT group (933.75 ± 306.49) (P < 0.05, Figure 6(a)). Plasma D-dimer concentrations demonstrated an AUC of 0.984 (95% CI: 0.963-0.998, P = 0.001) to differentiate patients with CVT from nonthrombotic healthy controls (Figure 6(b)). However, the ROC analysis showed a nonsignificant separation of patients with CVT from the control cohort, which included all healthy, cerebral hemorrhage and cerebral infarction individuals (AUC: 0.525, 95% CI: 0.458–0.592, P = 0.541, Figure 6(c)). Interestingly, when BCAA and D-dimer levels were used to establish the diagnostic model for CVT, the AUC was 0.951 (95% CI: 0.925–0.977, P = 0.000), indicating that the separation of CVT patients from the control cohort, including all healthy, cerebral hemorrhage and cerebral infarction individuals, showed good diagnostic efficacy (Figure 6(d)).
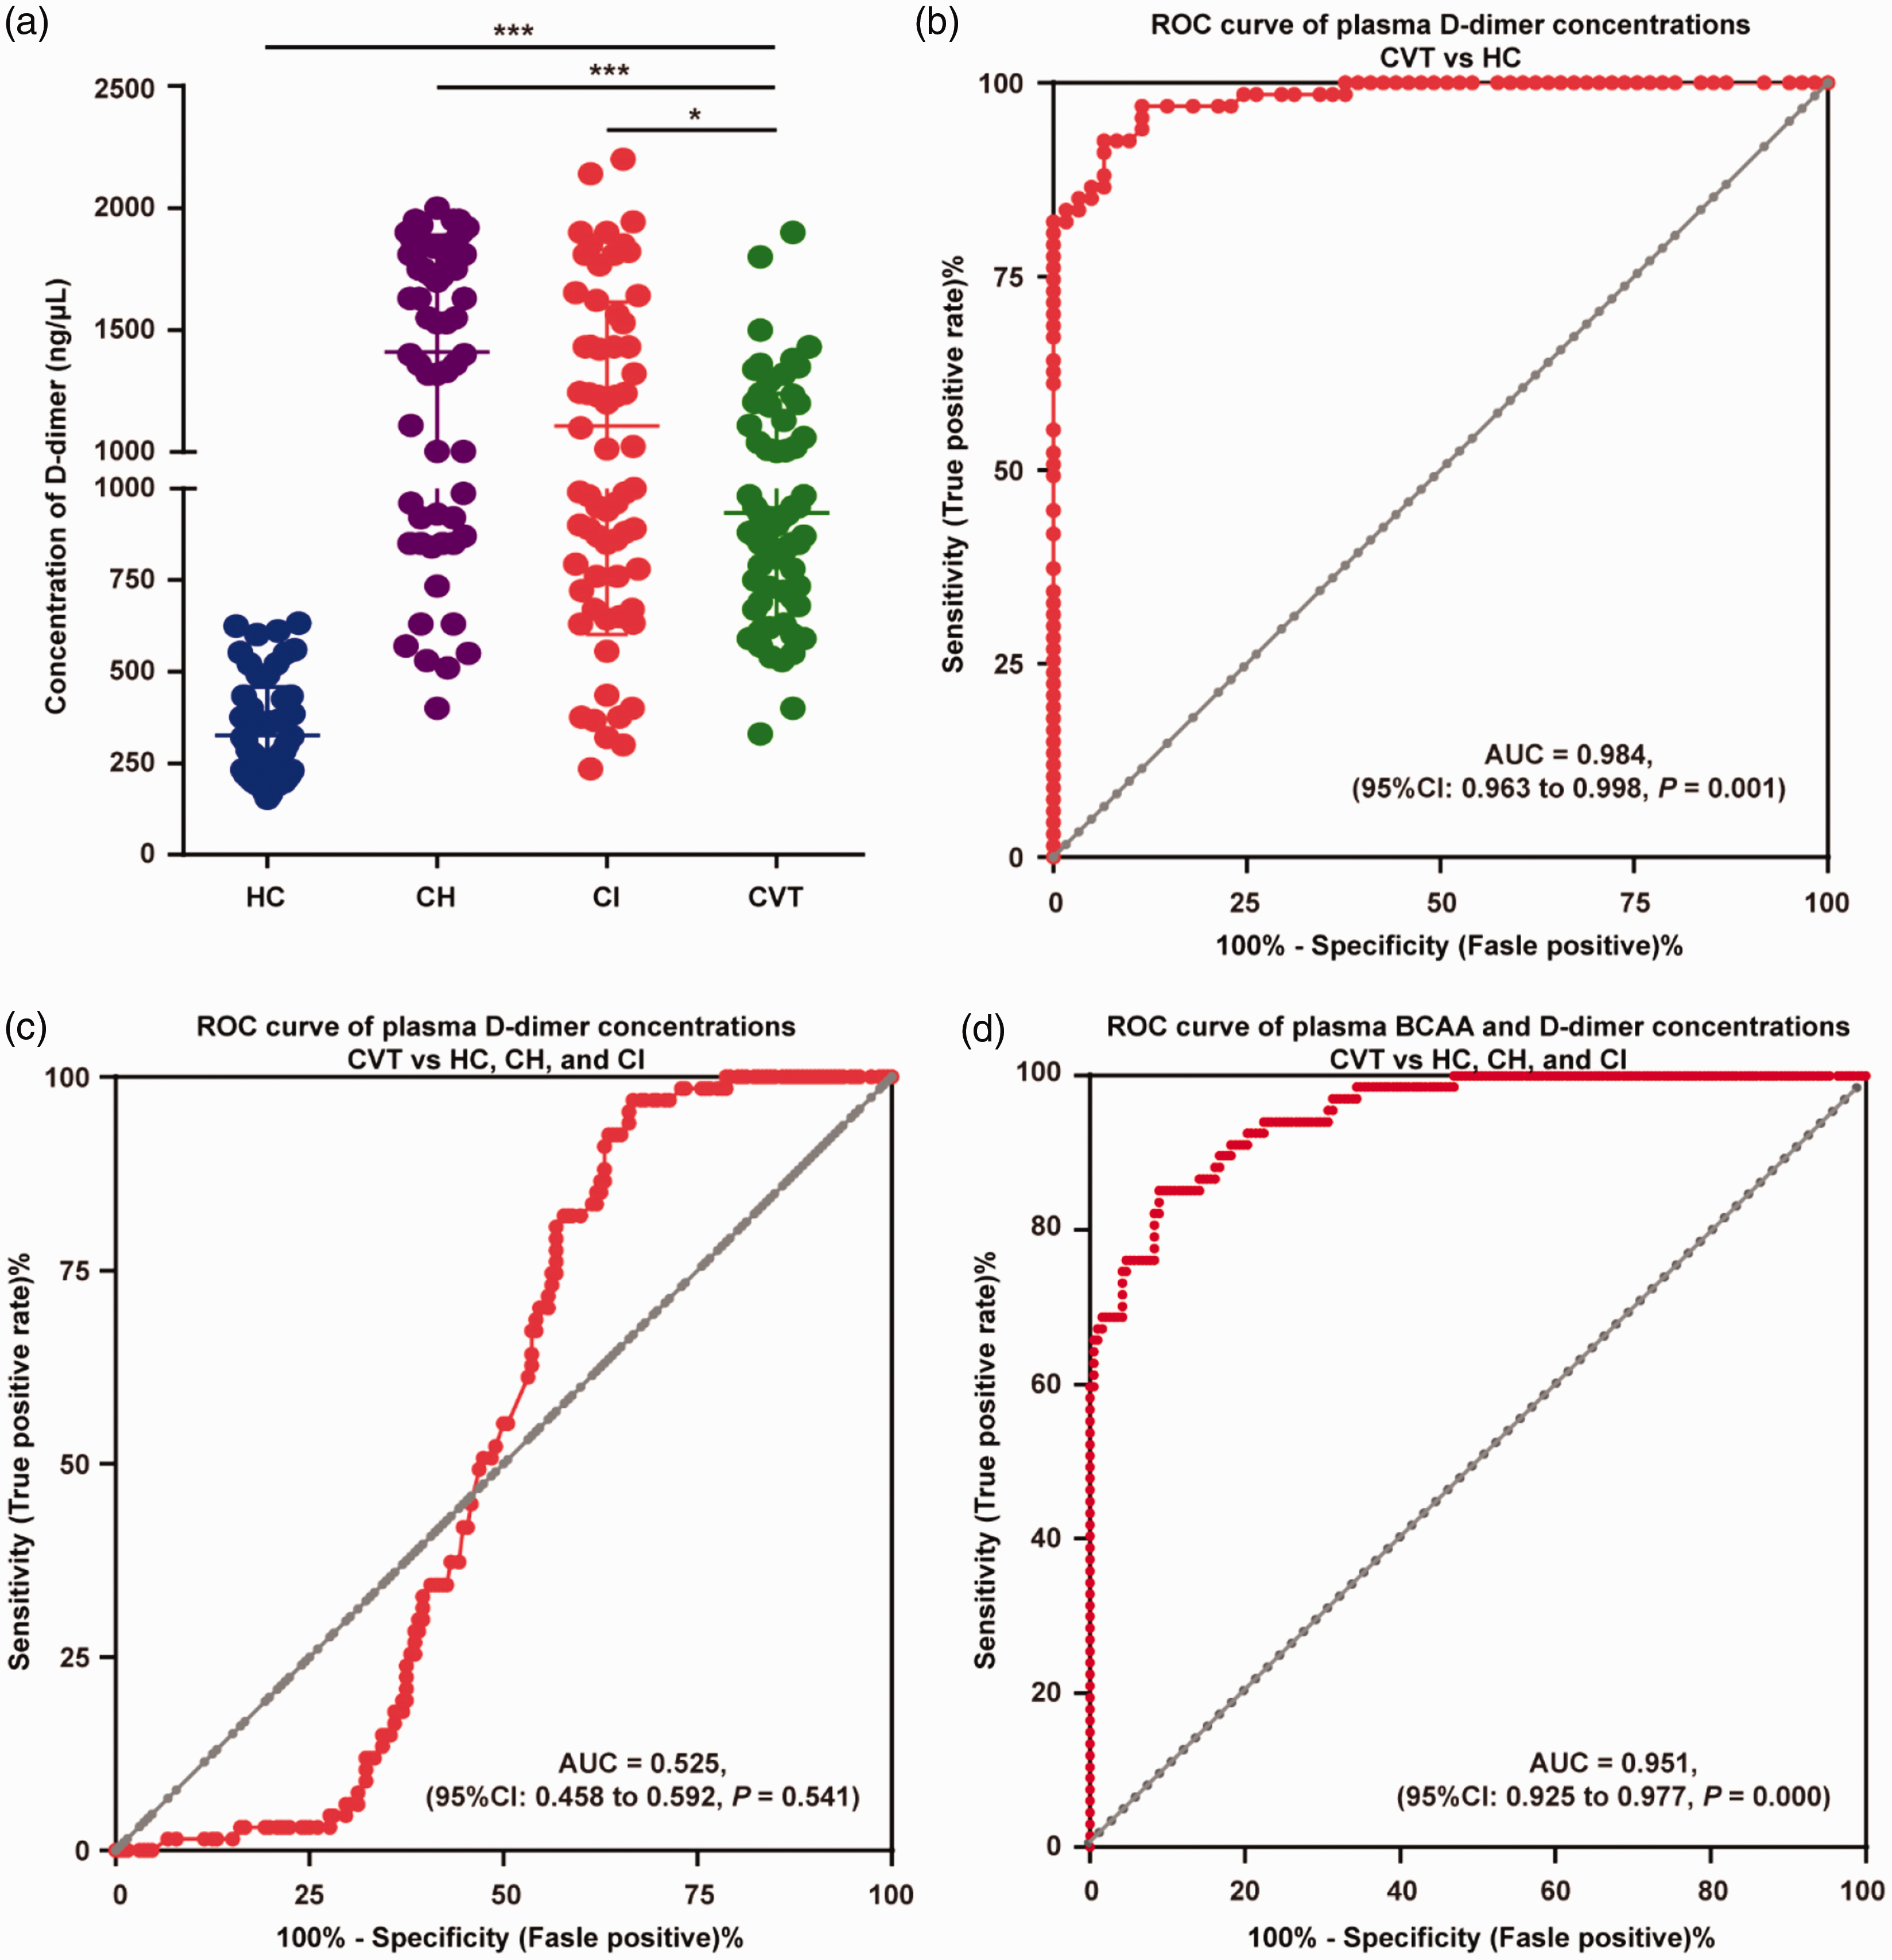
D-dimer concentrations and ROC analysis in healthy controls, cerebral hemorrhage controls, cerebral infarction controls, and patients with CVT in the validation stage. (a) There were higher plasma D-dimer concentrations in the cerebral hemorrhage, cerebral infarction, and CVT groups than in the healthy control group. (b) The ROC analysis of plasma D-dimer concentrations showed an AUC of 0.984 (95% CI: 0.963–0.998) to differentiate patients with CVT from healthy controls. (c) The ROC analysis of plasma D-dimer concentrations showed a nonsignificant separation of patients with CVT from the control cohort, which included all healthy, cerebral hemorrhage and cerebral infarction individuals (AUC: 0.525, 95% CI: 0.458–0.592). (d) The ROC analysis of plasma BCAA and D-dimer concentrations showed an AUC of 0.951 (95% CI: 0.925–0.977) to differentiate patients with CVT from the control cohort, which included all healthy, cerebral hemorrhage and cerebral infarction individuals.
Discussion
CVT is a special subtype of stroke with highly variable clinical and radiological presentation, which increases the difficulty of early identification. This study identified that lower plasma BCAA concentrations were an independent predictor of CVT, distinguishing patients with CVT from healthy controls and patients with cerebral hemorrhage or cerebral infarction. In addition, when BCAAs combined with D-dimer levels were used to establish the diagnostic model for CVT, good separation of CVT patients was observed. This finding may contribute to the discovery of candidate biomarkers for the diagnosis and prognosis of CVT.
We found that caffeine metabolism (P = 0.006) and valine, leucine, and isoleucine biosynthesis (P = 0.040) were two statistically significant pathways. The primary metabolites of caffeine metabolism include theobromine, paraxanthine, caffeine, 7-methylxanthine, 1,7-dimethyluric acid and 1-methylxanthine. Caffeine metabolism is influenced by many exogenous and endogenous factors, such as genetic determinants, age, sex, pregnancy, diet, lifestyle, smoking, environmental factors, drugs and diseases. 16 We attempted to review the existence of a preference for coffee beverages by asking healthy subjects, but the results did not differ significantly. In the last few decades, studies have shown that caffeine metabolism plays a role in neurodegenerative diseases, sleep disorders, and psychiatric disorders mainly through adenosine receptors, while there is currently little information regarding thrombophilia. 16 Genome-wide association studies (GWASs) identified eight loci involved in the regulation of caffeine metabolism, including 4q22 (ABCG2 transporter), 7q11.23 (CYPOR), 7p21 (near AHR), 15q24 SNP (near CYP1A2), 11p13 (BDNF), 17q11.2 (monoamine transporter SLC6A4), 2p24 (GCKR, glucokinase regulatory protein) and 17q11.2 (MLXIPL). 17 A genome-wide study in 882 European CVT patients and 1205 control subjects showed that 37 SNPs in the 9q34.2 region were strongly associated with genetic susceptibility to CVT. 18 Although these genetic variants may be interrelated, there is little evidence for an association between caffeine metabolism and thrombosis.
Recent studies have suggested that dysfunctional BCAA catabolism is associated with a risk of cardiovascular disease 19 and thrombosis. 20 Importantly, a study of human participants that compared blood and urine metabolite concentrations in the acute and chronic stages of ischemic stroke found that serum concentrations of valine, isoleucine, and leucine were significantly elevated in the acute stage. 21 Conversely, a study of serum metabolic profiles based on nuclear magnetic resonance spectroscopy in patients with deep vein thrombosis and healthy controls showed significant reductions in leucine, valine and alanine concentrations in the thrombosis group. 22 In view of the conclusions of the above studies and the heterogeneity of arterial and venous thrombosis, we inferred that these BCAAs are potential biomarkers of CVT.
BCAAs play an important role in the shuttling of nitrogen between organs and tissues and can provide nitrogen for neurotransmitter synthesis in the CNS. It is currently recognized that BCAA biosynthesis plays a vital role in regulating various cellular processes that are important for health and disease.23,24 For healthy people, BCAAs can provide energy for long-term exercise, promote muscle protein synthesis, and reduce muscle decomposition. 25 BCAAs are associated with the risk of incident diabetes and can induce insulin resistance, suggesting that they play a role in metabolic homeostasis.26,27 Furthermore, BCAAs also play a unique role in the brain; they are integral in the glutamate/glutamine cycle between astrocytes and neurons, which is critical for the efficient uptake of glutamate during excitatory neuronal signaling. 28
The concentration of BCAAs is chronically increased in the blood of patients with cardiovascular diseases. 24 A novel mechanistic study showed that the ingestion of BCAAs significantly promotes platelet activation and increases the risk of arterial thrombosis. 20 The ingestion of BCAAs by human participants led to an increase in the relative levels of valine, leucine, and isoleucine in platelets. These platelets manifested a corresponding increase in agonist-induced activation, granule release, aggregation, and spreading. 20 Sidorov et al. reported that BCAA levels were associated with the risk of ischemic stroke. 29 Serum concentrations of valine, isoleucine, and leucine were significantly elevated in acute ischemic stroke, with thrombi in the lumen of arteries. 21 Interestingly, deep vein thrombosis patients with venous thrombi showed significant reductions in leucine, valine and alanine concentrations in the serum. 22
Consistently, we found that patients with acute CVT had lower concentrations of BCAAs, and the concentrations of BCAAs in the cerebral infarction control (113.84 ± 12.75) and cerebral hemorrhage control groups (107.69 ± 9.80) were higher than those in the healthy control (70.86 ± 12.55) and CVT groups (53.26 ± 15.83), which is consistent with a recent study of BCAA changes in patients with deep venous thrombosis and could help in the differential diagnosis of venous thrombosis and arterial thrombosis. 22
Clinical diagnosis of CVT is often difficult, as it can present with a variety of signs and symptoms, mimicking numerous neurological pathologies. Radiological venous assessment plays an increasingly important role in the diagnosis and management of CVT. At present, CT/CTV and MRI/MRV are commonly used noninvasive modalities in the diagnosis of CVT. 11 Moreover, several advanced imaging modalities have been developed for radiological venous assessment in humans, including magnetic resonance black-blood thrombus imaging, 30 susceptibility-weighted imaging,31–33 free water elimination DTI analysis, 34 and three-dimensional T1 weighted sampling perfection with application-optimized contrast using different angle evolutions (3 D-T1-SPACE).30,35 These techniques allow for clear demonstration of cerebral veins and even deep medullary veins with high sensitivity and specificity. However, due to the variation in venous anatomy, changes in the signal of venous thrombosis with time, and slow blood flow in veins or sinuses, there are many potential pitfalls in the imaging diagnosis of CVT, especially in patients with isolated cortical venous thrombosis or during the acute stage. 11
D-dimer, a product of fibrin degradation, plays an important role in the diagnosis of deep vein thrombosis. Increased D-dimer levels are considered to support the diagnosis of CVT, and several studies on D-dimer levels in patients with suspected CVT have suggested that D-dimer levels are helpful for the diagnosis of CVT.36,37 However, D-dimer levels are also elevated after surgery and with advanced age, pregnancy and puerperium, cancer and chronic inflammation, cerebral hemorrhage, and many other conditions.38–41 As a result, in clinical practice, D-dimer can help to differentiate CVT from a healthy state but cannot effectively distinguish between arterial thrombosis and cerebral hemorrhage. CVT is often associated with the clinical characteristics of infarction and hemorrhage; therefore, it is still controversial whether a normal D-dimer level can completely exclude CVT. The D-dimer level is elevated in most patients with acute thrombosis and is a sensitive marker for detecting thrombosis but lacks specificity. 11 In the validation cohort, we compared D-dimer levels in the CVT, cerebral infarction, cerebral hemorrhage, and healthy control groups and found that D-dimer levels were elevated in the CVT, cerebral hemorrhage and cerebral infarction groups. In addition, ROC analysis showed a significant separation of patients with CVT from healthy controls but could not significantly differentiate CVT patients from the control cohort, which included all healthy, cerebral hemorrhage and cerebral infarction patients (AUC: 0.525, 95% CI: 0.458–0.592, P = 0.541). Interestingly, we identified that the plasma concentrations of BCAAs were lower in CVT patients and higher in cerebral hemorrhage and cerebral infarction patients, significantly differentiating CVT from other cerebral vascular diseases. BCAAs combined with D-dimer levels showed good diagnostic efficacy in separating the CVT cohort from the control cohort, which included all healthy, cerebral hemorrhage and cerebral infarction individuals (AUC: 0.951, 95% CI: 0.925–0.977, P = 0.000).
However, we are aware of several limitations of this study. First, the patients experiencing CVT, cerebral infarction or cerebral hemorrhage who were enrolled in this study were all in the acute phase (0–7 days), and the subacute and chronic stages need to be further studied. Second, in the discovery stage, we used LC–MS to evaluate the concentrations of valine, isoleucine, and leucine separately. However, in the validation stage, due to the limitations of conventional laboratory testing techniques, we only measured the total concentrations of BCAAs (valine, isoleucine, and leucine) using commercially available kits. Therefore, we speculate that quantitative measurements of valine, isoleucine and leucine separately might be developed to further verify the diagnostic efficacy of BCAAs alone or in combination with D-dimer for CVT. Third, the etiology and risk factors for different subtypes of CVT, cerebral infarction and cerebral hemorrhage are complex and heterogeneous. Although we controlled for the baseline data (such as age and sex) of all participants, we did not distinguish all stroke subtypes, nor did we validate the findings in all stroke subtypes, and future studies need to be performed in a larger cohort with a broad range of stroke severities. In the discovery stage, the NIHSS score at admission was 5.07 ± 5.27, while in the validation stage, the NIHSS score was 3.84 ± 3.436, indicating heterogeneity in CVT patients, although the trend of decreased BCAA levels in peripheral plasma of the CVT group compared to the HC group was consistent in both the discovery and validation stages. Because the BCAA levels were detected by mass spectrometry in the discovery stage and by ELISA in the validation stage, there is a batch effect in our current comparison of absolute BCAA values in peripheral plasma between the two cohorts of patients, which is another limitation of this study. Therefore, the generalizability of the results is somewhat limited.
Recently, we explored the pathological characteristics of CVT using a novel severe CVT rat model 42 and found that nonthrombotic internal jugular venous stenosis may be an interventional risk factor for CVT. 43 We discovered that BCAAs, as potential biomarkers, might play a role in distinguishing acute CVT, cerebral hemorrhage and cerebral infarction.
Conclusion
BCAAs may serve as significant biomarkers for acute CVT. These results could provide new insights for the identification of candidate biomarkers for CVT.
Supplemental Material
sj-pdf-1-jcb-10.1177_0271678X231170037 - Supplemental material for Potential role of plasma branched-chain amino acids in the differential diagnosis of acute cerebral venous thrombosis
Supplemental material, sj-pdf-1-jcb-10.1177_0271678X231170037 for Potential role of plasma branched-chain amino acids in the differential diagnosis of acute cerebral venous thrombosis by Huimin Jiang, Chen Zhou, Huimin Wei, Yan Wu, Yifan Zhou, Xuechun Xiao, Lu Liu, Ming Li, Jiangang Duan, Ran Meng and Xunming Ji in Journal of Cerebral Blood Flow & Metabolism
Footnotes
Funding
The author(s) disclosed receipt of the following financial support for the research, authorship, and/or publication of this article: This work is supported by grants from National Natural Science Foundation of China (82102220, 82271311), Beijing Municipal Commission of Education (KM202010025023), the Pharmaceutical Collaboration Project of Beijing Science and Technology Commission (Z181100001918026) and the Postdoctoral Science Foundation of China (No. 2022M712217).
Declaration of conflicting interests
The author(s) declared no potential conflicts of interest with respect to the research, authorship, and/or publication of this article.
Authors’ contributions
CZ and HJ are the principal investigators and designed the study. HW, YW, YZ, XX and LL contributed to the experiment implementation. ML, JD, and RM made suggestions to improve the study. CZ, HJ and XJ revised the manuscript and polished the language. XJ and CZ are responsible for the overall content as the guarantor.
Supplemental material
Supplemental material for this article is available online.
References
Supplementary Material
Please find the following supplemental material available below.
For Open Access articles published under a Creative Commons License, all supplemental material carries the same license as the article it is associated with.
For non-Open Access articles published, all supplemental material carries a non-exclusive license, and permission requests for re-use of supplemental material or any part of supplemental material shall be sent directly to the copyright owner as specified in the copyright notice associated with the article.