
Abstract
Brain lactate concentration is higher during wakefulness than in sleep. However, it is unknown why arousal is linked to an increase in brain lactate and why lactate declines within minutes of sleep. Here, we show that the glymphatic system is responsible for state-dependent changes in brain lactate concentration. Suppression of glymphatic function via acetazolamide treatment, cisterna magna puncture, aquaporin 4 deletion, or changes in body position reduced the decline in brain lactate normally observed when awake mice transition into sleep or anesthesia. Concurrently, the same manipulations diminished accumulation of lactate in cervical, but not in inguinal lymph nodes when mice were anesthetized. Thus, our study suggests that brain lactate is an excellent biomarker of the sleep–wake cycle and increases further during sleep deprivation, because brain lactate is inversely correlated with glymphatic-lymphatic clearance. This analysis provides fundamental new insight into brain energy metabolism by demonstrating that glucose that is not fully oxidized can be exported as lactate via glymphatic-lymphatic fluid transport.
Introduction
The energy metabolism of the central nervous system (CNS) relies almost exclusively on glucose. Classical studies have shown that the brain's O2:glucose extraction ratio at rest is 5.5:1 and thus ∼9% of glucose is unaccounted for in terms of oxidative metabolism.1–5 The fate of glucose that is not fully oxidized remains unclear.6–8 Here, we explored the possibility that the glymphatic system constitutes a pathway for export of the brain's metabolic waste products. The glymphatic system is a highly organized fluid transport system that by convective flow drives exchange of interstitial fluid (ISF) with cerebrospinal fluid (CSF) in mice and rats,9,10 as well as in human brain.11,12 In turn, CSF exits the CNS by multiple routes, including the cribriform plate positioned under the olfactory bulb, arachnoid granules, peri-venous spaces, and along cranial and spinal nerves. The outflowing CSF collects in the connective tissues surrounding the brain and is ultimately collected by meningeal and cervical lymph vessels and returned to the general circulation at the level of vena cava.13–15 Thus, the possibility exists that lactate generated within the CNS is transported out via the glymphatic-lymphatic clearance system.
The analysis presented here took advantage of the fact that the glymphatic system is controlled by the sleep–wake cycle and is primarily active during sleep and anesthesia, while suppressed during wakefulness. 16 Several groups have shown that brain lactate is highest during wakefulness and declines during the transition into either natural sleep or anesthesia.17–22 We first confirmed that brain lactate levels are highest in awake behaving mice and ∼20–30% lower during sleep or anesthesia. We next asked whether suppression of glymphatic activity would reduce the decline in lactate concentration that normally occurs when awake mice transition into natural sleep or anesthesia.17–22 The analysis showed that four mechanistically different approaches to suppress glymphatic activity (pharmacology, genetic, mechanical or body position) all eliminated the rapid decline in brain lactate concentration when awake untreated mice fell asleep or were anesthetized. Conversely, lactate concentration in cervical lymph nodes exhibited the inverse pattern: Lactate was highest in cervical lymph nodes harvested from anesthetized control animals and all the manipulations that suppressed glymphatic activity attenuated the rise in lactate concentration induced by anesthesia. In contrast, neither state-dependent changes in brain activity nor manipulations of the glymphatic system had any effect on the lactate content of inguinal lymph nodes in the same mice. Overall, the analysis provides direct support for the notion that excess carbon in the form of lactate can exit CNS via the glymphatic-lymphatic transport system. 7
Methods
Mice
A 1:1 ratio of male and female C57BL/6 mice, 8–12 weeks of age were used for all experiments, ∼20 g. Aquaporin-4 knockout (AQP4 KO, Aqp4−/−) mice on C57BL/6 background were generated as described previously. 23 All experiments were approved by the University Committee on Animal Resources of the University of Rochester and performed according to guidelines from the National Institutes of Health and ARRIVE (items 5 to 7, 10 to 13). Light was on from 06:00 to 18:00 and off from 18:00 to 06:00. Of note, we have previously documented that the mice housed in our vivarium are mostly asleep during the light phase and mostly awake during the dark phase. 24 Electroencephalogram (EEG) and electromyogram (EMG) recordings were not collected in this study, as in our prior studies16,25 we found that it was not possible to implant the EEG electrodes concurrently with a microdialysis probe without affecting the health of the mice significantly.
Surgery
Mice randomized to the cisterna magna (CM) puncture group were anesthetized with a mixture of ketamine and xylazine (K–X; 100 mg/kg ketamine, JHP Pharmaceuticals, and 10 mg/kg xylazine, Lloyd) administered intraperitoneally. The mice were then placed in the prone position with the head slightly flexed. A 5 mm linear incision was made over the occipital-cervical junction with skull and neck musculature reflected inferiolaterally down to the CM. A horizontal cisternotomy was made with a beveled 30-gauge needle so that CSF could flow out freely from the CM puncture. Suction of CSF coming from the CM was performed by gently placing sterile tissue on top of the area. For sham surgery, the mice underwent the same surgical procedure with the only difference that the CM was kept intact. Afterwards, the skin of the mice was sutured with 5–0 nylon suture (Ethicon), thereafter local anesthetic bupivacaine (Hospira Worldwide) was applied on the wound and 200 µL saline was given intraperitoneally. The mice returned to their cage on a heating pad with mouse chow, hydrogel (98% sterile water), and water available ad libitum until beginning of microdialysis or acute slice experiments.
Acetazolamide treatment
For mice randomized to the acetazolamide treatment group, 20 mg/kg of acetazolamide (X-GEN pharmaceuticals) in 0.9% saline was delivered via the intraperitoneal route every 6 h and continued for the subsequent 18 h (total of four injections) for slice experiments in order to inhibit carbonic anhydrase and thus CSF production. For microdialysis experiments, treatment continued for 42 h (total of eight injections).
Sleep deprivation
A group of control C57Bl/6 WT mice (not subjected to acetazolamide or CM puncture) underwent sleep deprivation during microdialysis. Sleep deprivation by introduction to novel objects and mechanical stimulation was started at the beginning of the light cycle and continued for the following 4 h (6:00 to 10:00). Food and water remained available throughout the sleep deprivation period.
Immobility-defined sleep analysis
Mice were housed separately and acclimatized to their home cage in a 12 h light:dark room isolated from external stimuli. The mice were recorded for 24 h using a camera that can image in light and dark conditions (Axis 221 Network Camera) mounted above each cage. Zeitgeber time (ZT) 1 began at the onset of the dark phase, and the light phase started at ZT13. Video recordings were analyzed using ANY-maze® (Version 4.99, Stoelting Co) and immobility-defined sleep was quantified by the number and duration of immobile episodes during 1 h epochs in 24 h. Immobile episodes were defined as lasting more than 40 s at 95% sensitivity detection as shown previously to accurately estimate sleep in mice.26,27
Microdialysis
Biosensors are not particularly suitable for prolonged use, therefore microdialysis was used. Surgical implantation of the microdialysis guide cannula was performed under ketamine–xylazine anesthesia (100 mg/kg ketamine, JHP Pharmaceuticals, 10 mg/kg xylazine, Lloyd, i.p.) and aseptic conditions. The animals recovered for two days before inserting the microdialysis probe. Mice were anesthetized with 2% isoflurane mixed with 1.0–2.0 L oxygen/min, and the probe (MD-2212 from BASi) was afterwards inserted into the cannula at the following coordinates: + 2.0 mm anterior; + 0.25 mm lateral; −1 mm ventral. The probe was equilibrated with artificial CSF containing the following (in mM): 155 NaCl, 3.5 KCl, 1 CaCl2, 1 MgCl2 and 2 NaH2PO4, pH 7.4, 300 mOsm, perfusion rate at 0.5 µL/min delivered by a Hamilton syringe controlled by a Harvard microinjection pump. All microdialysates were collected in a room with a light–dark cycle (12/12, lights on at 6:00). Collection of samples started 3 h into the light or dark cycle (21:00–24:00 and 9:00–12:00, respectively). The collection time was 20 min for each sample. The recovery of lactate in aCSF at a perfusion rate of 0.5 µl/min was 23.8 ± 1.3 % (N = 3). The brain lactate concentration was calculated based on the recovery at a perfusion rate of 0.5 µl/min.
Radioisotope clearance
Radiolabeled 14C-inulin (0.5 µCi: 6 kDa, PerkinElmer) was injected into the left frontal cortex, as previously published.16,28 A stainless steel guide cannula (Plastics One) was implanted stereotactically into the left frontal cortex of anesthetized mice (2% isoflurane) with the coordinates of the cannula tip at 1.0 mm anterior and 3.5 mm lateral to bregma, and 1.5 mm below the surface of the brain. Animals were allowed to recover after surgery, and the experiments performed 12–24 h after the guide tube cannulation, as reported.16,28–30 In each mouse, a small volume of a CSF (0.5 μl), containing 14C-inulin (0.5 μCi), was injected (33 GA cannula, Plastics One) into the brain ISF over 5 min. At the end of the experiments (60 min), the brain was removed and prepared for radioactivity analysis. The brain was solubilized in 0.5 ml tissue solubilizer (PerkinElmer) overnight followed by the addition of 5 ml of scintillation mixture (Ultima Gold, PerkinElmer). The injectate was treated in the same way. All samples were analyzed in a liquid scintillation counter (LS6500 Multipurpose Scintillation Counter, Beckman Coulter). The percentage of 14C-inulin remaining in the brain after microinjection was determined as percentage recovery in brain = 100 × (Nb/Ni), where Nb is the radioactivity remaining in the brain at the end of the experiment and Ni is the radioactivity injected into the brain ISF (i.e., the dpm of 14C-inulin). Clearance is shown as the percentage change from the 100% injected. Inulin was used, as it is metabolically inert, polar molecules that are neither transported across the BBB nor retained by the brain;9,16,28,31 hence, their clearance provides a measure of the ISF bulk flow. Of note, all the mice were exposed to surgery when the injection cannula was implanted. A surgical control group was therefore not included in the inulin clearance analysis.
Lymph node dissection
Mice underwent cervical dislocation 80 min into K–X anesthesia (100 mg/kg ketamine, 10 mg/kg xylazine, I.P) and superficial cervical and inguinal lymph nodes were dissected. The thoracic cavity was opened and the heart was stopped. An incision down the midline was performed, the skin was then separated from the peritoneum and peeled to the sides from the jawline to the tail. The inguinal lymph nodes were obtained from the skin flap of each side on the leg, located at the Y-shape junction of blood vessels. The superficial cervical lymph nodes were collected from above the submandibular glands (submandibular lymph nodes) and more laterally, by the parotid gland (parotid lymph nodes).32–34 Curved forceps were used to hold the lymph node while cleaning off fat and other tissue using another curved forceps. The lymph nodes were snap frozen in a tube on dry ice immediately after dissection. The nodes were then dissolved in 10 µL/mg hypotonic lysis buffer containing the following (in mM): 10 HEPES, pH 7.5, 1.5 MgCl2, 10 KCl and crushed with zirconium oxide beads (0.5 mm diameter) using a bullet blender (Next Advance) for 5 min.
Sampling of brain tissue
Mice were awake or anesthetized with 100 mg/kg ketamine and 10 mg/kg xylazine; 15 min later, the mice were sacrificed by decapitation. Their heads were immediately snap frozen by immersion in −80 ℃ 100% isopentane for 90 s with 100% ethanol in dry ice in an outside chamber. The brains were afterwards dissected in a −20 ℃ chamber of a Leica CM1900 cryostat and embedded in Tissue-Plus Optimal Cutting Temperature Compound (OCT). A Leica CM1900 cryostat was used to cut the brain in 20 µm thick coronal slices at 2.2 mm anterior from Bregma.
Protein determination
A colorimetric assay kit from Biorad (kit 500-0001) was used to determine protein concentration in brain slices using bovine serum albumin as standard, according to the manufacturer instructions.
Lactate measurements
The dialysate, lymph nodes, or brain slice were mixed with 30 µL reaction buffer (final concentrations): 3 U/mL horseradish peroxidase (Sigma-Aldrich), 1 U/mL lactate oxidase (Sigma-Aldrich), and 0.25 mM Amplex Red (Life Technology) in 1 × phosphate-buffered saline. Lactate measurements were done using a 530/25 excitation and a 590/35 emission filter set spectrophotometer Wallac Victor 2 V Multi-label Counter, Perkin Elmer. Lactate concentrations in samples were then calculated using a standard curve for lactate.
Statistical analyses
Statistical analysis was performed using GraphPad Prism 6.0e software. The data from microdialysis, lymph nodes, and brain slices were evaluated using a one-way ANOVA analysis of variance and exact P-values were calculated using Dunnett's post hoc tests. A two-way ANOVA with Dunnett's test was used to compare microdialysis samples collected during different times. For comparison of two groups, an unpaired student t-test was used. For comparison of sleep versus awake lactate concentrations in within the same group, a paired t-test was used. Probability values < 0.05 were deemed significant. All values are expressed as mean ± SEM.
Results
Brain lactate concentration declines during the transition from dark to light phase
Mice underwent microdialysis in light and dark phase. Previous studies have shown that sleep can be measured with 94% accuracy using video-based analysis to determine sleep in mice, named immobility-defined sleep.26,27 We confirmed that mice were predominantly awake and asleep in the dark and light phase, respectively (Figure 1(a) and (b)). Microdialysis was used to collect ISF in freely behaving mice.24,35,36 The microdialysis probe was inserted in the right cingulate cortex two days prior to sample collections (Figure 2(a)). The microdialysis probe was equilibrated with artificial CSF for one hour prior to sample collection.22,24,35 The dialysates were sampled every 20 min for three hours during the dark phase (21:00–24:00) and the light phase (9:00–12:00). Video-based sleep analysis showed that the mice spent 7.4 times more minutes immobile during the light phase than the dark phase (P = 0.02), suggesting that the mice are mainly awake in the dark phase and inactive – consistent with sleep behavior – in the light phase (Figure 1(a) and (b)). Earlier studies have shown that mobility assessment of mice correlates by 94% with the standard EEG/EMG approach.26,27 The lactate concentration in the brain remained remarkably stable during the dark phase when the mice are mostly awake and also during the light phase when they are mostly asleep18,20,37 (P = 0.92 and P = 0.46 for dark and light phases, respectively, Figure 2(b)). During the dark phase (awake), the lactate concentration in the cortex was 1.645 ± 0.163 mM, when corrected for lactate recovery in the microdialysates using a flow rate of 0.5 µL/min, similar to earlier reports
38
(see Methods section). When the mice transitioned from the dark phase to light phase, the relative concentration of lactate declined by 28.8 ± 3.8% in accordance with previous observations (P < 0.0001, Figure 2 (b)).18–20
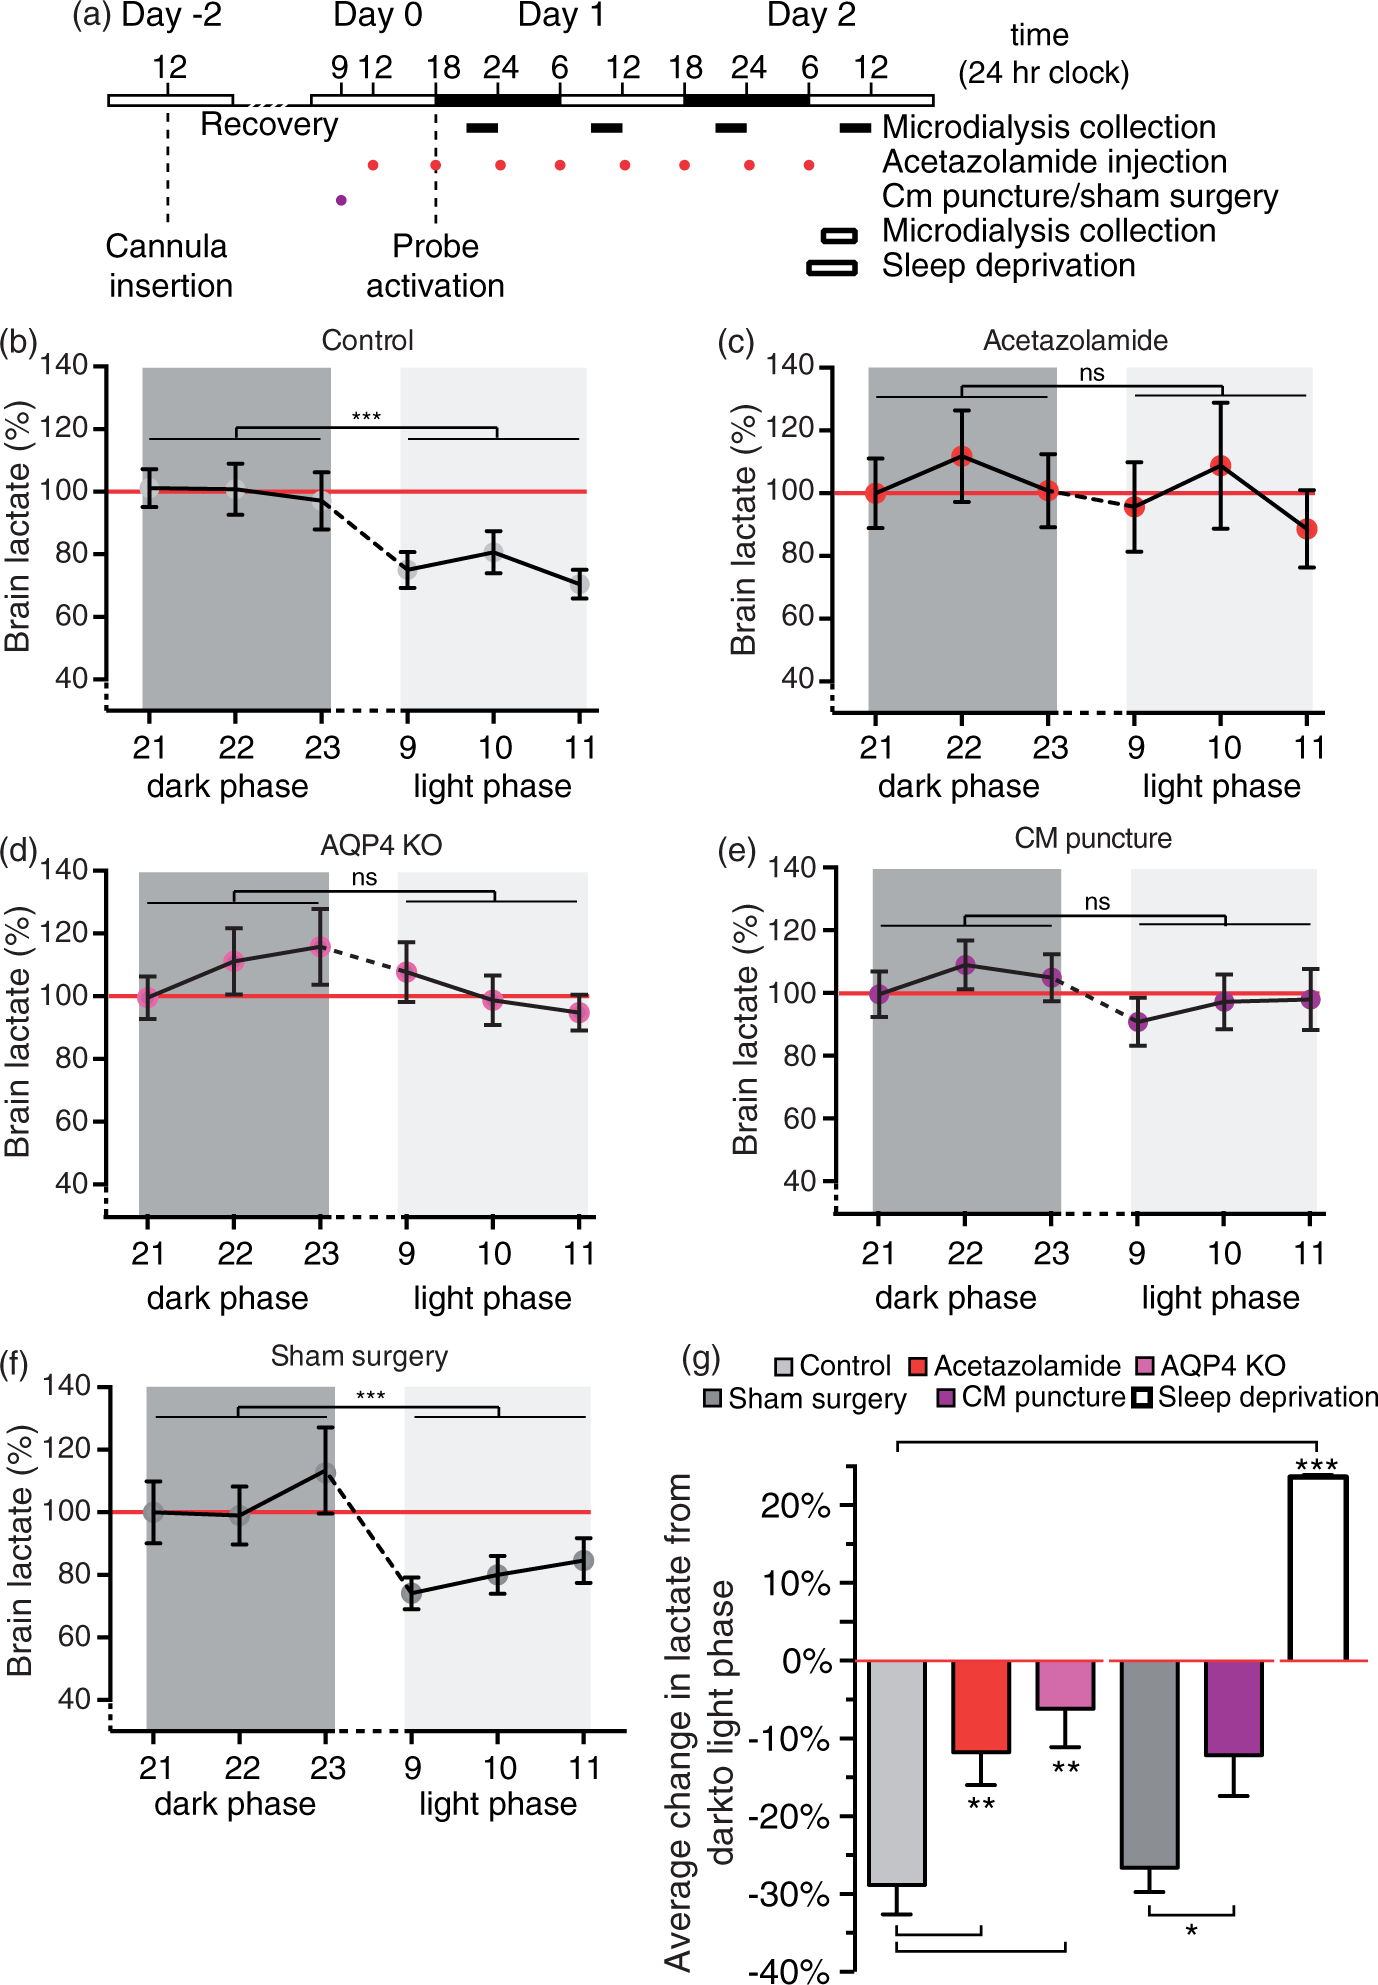
Immobility-defined sleep analysis in light and dark phase. (a) Time spent in immobility-defined sleep per hour over a 24-h period. Data expressed as total minutes within 1 h epochs. (b) Mice spent significantly more time immobile during the light phase compared to the dark phase coinciding with normal sleep behavior. Cumulative data for 12-h periods corresponding to dark (ZT1-12) and light (ZT13-24) phases. Bar graphs represent mean ± SEM. ZT; Zeitgeber time. N = 4. *P = 0.021, unpaired t-test. Brain lactate during wakefulness, sleep and sleep-deprivation. (a) Schematic representation of microdialysis experiment. Lactate concentration in cingulate cortex during wakefulness and sleep state in (b) control mice (c) treated with acetazolamide, (d) AQP4 KO mice, (e) CM puncture, and (f) sham surgery. Values are shown as average of three collections per hour, N = 9 representative sleep/wake cycles. ***P < 0.001; ns, not significant; two-way ANOVA. (g) Percentage average change in lactate concentration of mouse cortex in the awake state (21:00–24.00) or sleep (9:00–12:00) deprived state compared to the awake state (red line). N = 16, 15, 7, 15, 21, and 3 for control sleep, acetazolamide treated, AQP4 KO, sham surgery, CM puncture and sleep deprivation, respectively. **P < 0.01, ***P < 0.001, one-way ANOVA followed by Dunnett's test compared to control. *P < 0.05, t-test for comparison of sham surgery and CM puncture. Bar graphs represent mean ± SEM.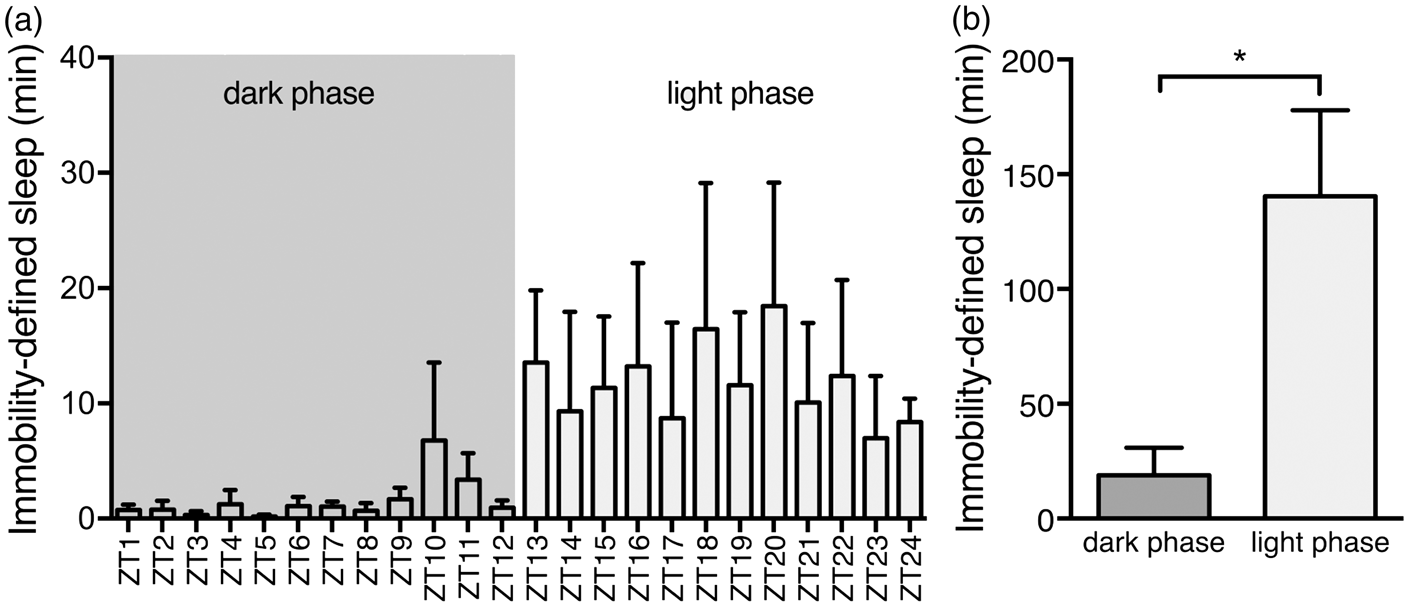
Suppression of the glymphatic system attenuates the light–dark phase differences in lactate concentration
We next asked whether glymphatic fluid transport, which is turned on when mice transition into either sleep or anesthesia, 16 is responsible for the decline in brain lactate concentration. The effects of three mechanistically different manipulations that previously have been shown to reduce glymphatic fluid transport were assessed. 28 We assessed the effect of (1) acetazolamide, a carbonic anhydrase inhibitor that inhibits CSF production, (2) deletion of the water channel aquaporin 4 (AQP4 knockout mice), (3) CM puncture, and (4) sham surgery as a control for the CM puncture. None of these manipulations changed the lactate concentration in the awake state: There was no difference in brain lactate between the control and experimental groups in the awake state (control, 1.645 ± 0.163 mM; acetazolamide, 1.708 ± 0.260 mM; AQP4 KO, 1.407 ± 0.227 mM; sham surgery, 1.403 mM ± 0.358 mM and CM puncture, 1.544 ± 0.131 mM, P = 0.88). However, acetazolamide eliminated the drop in brain lactate from dark to light phase as shown by the lack of statistical difference in the lactate concentration in the dark and light phase (P = 0.58, Figure 2(c)). Similarly, lactate failed to decline during the transition from light to dark phase in AQP4 knockout mice (P = 0.25, Figure 2(d)). CM puncture eliminated glymphatic fluxes by reducing the pressure differences that drive CSF exchange with ISF. CM puncture diminished the decline in lactate that occurred upon the transition from dark to light phase (P = 0.17, Figure 2(e)). In contrast, animals exposed to sham surgery (opening of skin and muscles in the neck) exhibited significantly higher brain lactate during the dark phase (P = 0.01) than light phase and did not differ significantly from non-surgical controls (P = 0.99), albeit a trend toward a small decrease was noted (Figure 2(b) and (f)).
Next, we compared the average difference in lactate between dark and light phase across the five groups. Thus, this comparison assessed whether manipulations that suppress glymphatic function reduced the gap in lactate between dark and light phase observed in untreated control mice (Figure 2(g)). Acetazolamide treatment significantly dampened the decline in lactate from dark to light phase when compared to control (11.76 ± 4.2% reduction, P = 0.01 compared to the dark phase, P = 0.008 compared to control). Mice lacking AQP4 exhibited a trend toward a decline in lactate; however, it was not significant (6.2 ± 4.9% reduction, P = 0.26 compared to the dark phase, P = 0.005 compared to control). CM puncture also significantly lowered the dark to light phase differences compared to sham surgery (12.1 ± 5.3% reduction, P = 0.03 compared to the dark phase, P = 0.035 compared to sham, Figure 2(g)). On the contrary, animals exposed to sham surgery (26.6 ± 3.1% reduction, P < 0.001 compared to the dark phase) did, as expected, not differ from non-surgical controls (28.8 ± 3.8%, P = 0.65, Figure 2(g)). Thus, only the two control groups (control and sham surgery) experienced a significant drop in lactate when they transitioned from dark to light phase, suggesting that glymphatic clearance plays an important role in lactate clearance. Similar to previous reports, we confirmed that brain lactate increases significantly in mice undergoing sleep deprivation (23.6 ± 0.1%, P < 0.0001, Figure 2(g)).20,39,40
To assess how potently acetazolamide, AQP4 deletion, CM puncture, and body position reduced glymphatic efflux, we evaluated clearance of the inert compound inulin (6 KDa) that within the 30 min experiment is not transported across the BBB, and only exits the brain via convective glymphatic transport.16,29 As previously published, acetazolamide treatment, AQP4 KO, CM puncture significantly reduced brain clearance of inulin
28
(Figure 3(a)). The analysis also showed that positioning the body on a 45 ° slope with the head downwards reduced inulin clearance (P = 0.02, Figure 3(a)). Thus, suppression of glymphatic clearance correlated with a reduced rate of lactate clearance. Of note, a control sham group was not included in these experiments, since the radiolabeled glymphatic clearance assay includes surgical implantation of the injection cannula.
9
Disruption of the glymphatic system inhibits anesthesia-induced decline in brain lactate decline. (a) Brain clearance as percentage decline in of 14C-inulin (% injected dose) at 60 min. N = 6, 5, 5, 5, and 6 for control, acetazolamide (Ace), AQP4 KO, head 45 angle downwards, and CM puncture, respectively. ***P < 0.001; **P < 0.01, one-way ANOVA followed by Dunnett's test compared to control. (b) Schematic representation of microdialysis experiment. (c) The change in lactate per minute calculated as slope of linear regression of the lactate concentration in microdialysis samples of awake mouse cortex, 20 and 40 min after injection of ketamine–xylazine anesthesia. N = 11, 6, 3, 5, 7, and 6 for control, acetazolamide (Ace), AQP4 KO, head 45 ° angle downwards (head down), sham surgery, and CM puncture, respectively. **P < 0.01, *P < 0.05; ns, not significant; one-way ANOVA followed by Dunnett's test compared to control. Bar graphs represent mean ± SEM.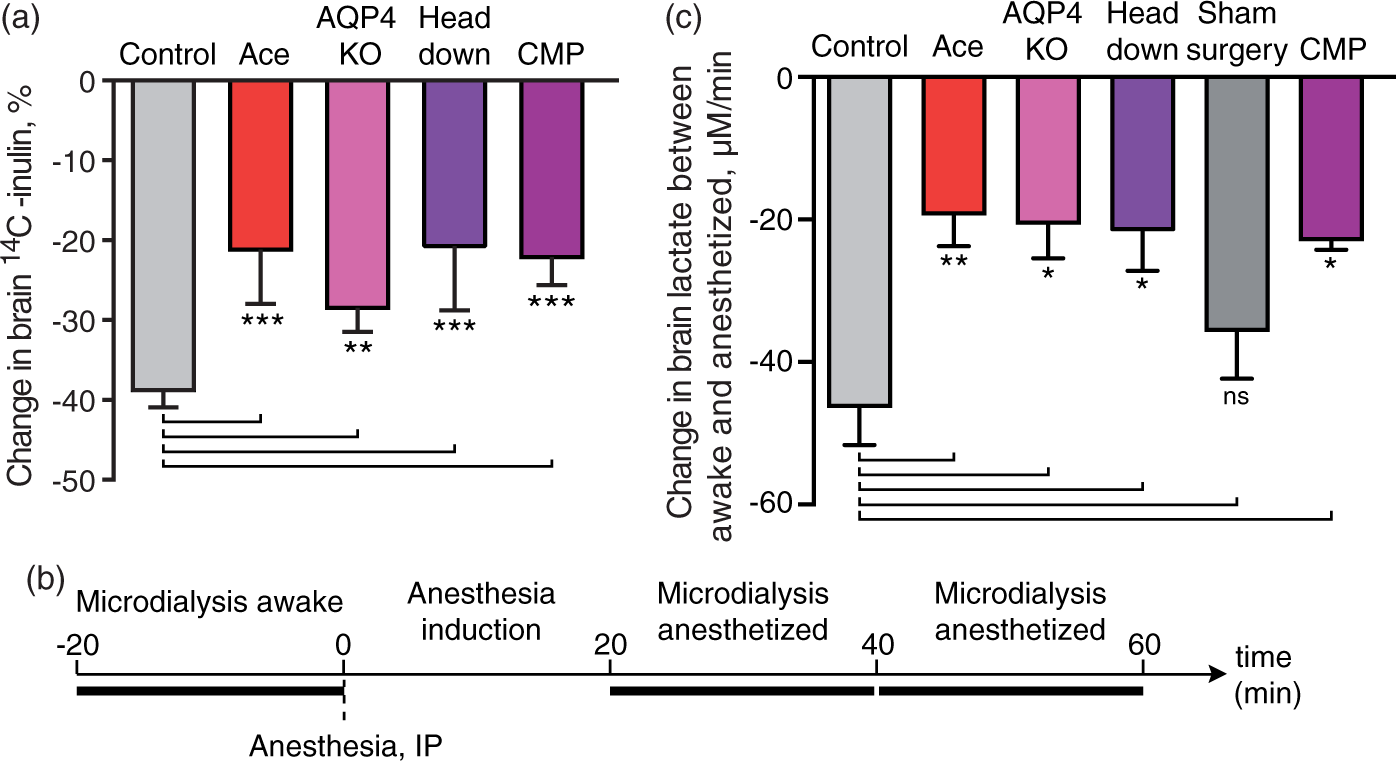
Overall, these experiments show that acetazolamide, AQP4 deletion, and CM puncture all suppressed glymphatic inulin clearance and the drop in lactate concentration that occurred in control mice during the transition from dark to light phase (Figures 2(g) and 3(a)).
Manipulations of the glymphatic system eliminate the decline in cerebral lactate concentration in response to anesthesia
In addition to natural sleep, some injectable anesthetics, such as chloral hydrate, thiopental and phenobarbitone, reduce brain lactate. Conversely, inhalable anesthetics tend to increase brain lactate, as is the case for sevoflurane, halothane, and particularly isoflurane.16,21,22 The effects of isoflurane on lactate are known to involve a direct effect on mitochondria including partial depolarization of the mitochondrial membrane and are not a general effect of anesthesia.41,42 To critically test whether glymphatic fluid transport contributes to the anesthesia-induced decline in lactate, we collected microdialysis samples in the cingulate cortex before, during, and following administration of ketamine–xylazine (K–X) anesthesia. The rate of decline in lactate was calculated as the slope of the linear regression between three points: (1) Awake state for 20 min immediately prior to K–X administration, and (2) 20-40 min and (3) 40-60 min after K–X administration (Figure 3(b)). The analysis showed that the reduction in lactate concentration was significantly slower in mice treated with acetazolamide (P = 0.04), AQP4 KO mice (P = 0.045), CM puncture (P = 0.02) compared with untreated controls (Figure 3(c)). We also took advantage of the observations that body posture can affect glymphatic activity.15,43 We found that mice positioned with their body at a 45 ° angle with the nose down also exhibited significantly less of a reduction of brain lactate compared to mice resting horizontally in the prone position (P = 0.02, Figure 3(c)). Sham surgery did not significantly slow the decline in lactate concentration compared to the untreated control group (P = 0.43).
These observations are consistent with the conclusion that lactate concentration in cortex falls when awake mice transition into the unconscious state of anesthesia (Figure 3), because the glymphatic system is activated and extracellular lactate is flushed out of the cortex by the glymphatic-lymphatic pathway. 16
Lactate in cervical lymph nodes is inversely correlated with lactate in cortex
CSF exits from the brain via the olfactory mucosa through the cribriform plate, meningeal lymph vessels as well as cranial and spinal nerves from where it is eventually collected in cervical lymphatic vessels and returns to the blood.13,15,44 To assess whether lactate produced in the brain is drained to the cervical lymph vessels, we harvested cervical lymph nodes from mice decapitated awake and mice anesthetized with K–X. Due to the invasive character of these experiments, natural sleep could not be included in the analysis. The superficial cervical lymph nodes (submandibular and parotid lymph nodes) were dissected, as well as inguinal lymph nodes (Figure 4(a)). The concentration of lactate in the lymph nodes from controls, acetazolamide, AQP4 KO, CM puncture, sham surgery for CM puncture, and head down body position groups were quantified 80 min after they received K–X anesthesia. Mice in all the experimental groups were placed in prone position laying flat after administration of K–X, except for mice included in the head down body position groups, which were placed in the prone position on a 45 ° downward slope with the nose down. Lactate concentration in the harvested lymph nodes was quantified. The analysis showed that the control groups (untreated and sham surgery) exhibited significantly higher lactate in the cervical lymph nodes than mice treated with acetazolamide, AQP4 KO or the mice positioned head down (P = 0.04, P = 0.02, P = 0.01, respectively, Figure 4(b)). The sham surgery did not affect the lactate concentration compared to control (P = 0.99). However, the CM puncture group had a lower lactate content than the sham surgery group (P = 0.03). Thus, lactate concentration in cervical lymph nodes was higher while brain interstitial lactate was lower during the transition from wake to K–X anesthesia when the glymphatic system was not suppressed (Figures 3 and 4). In contrast, the lactate concentration in control inguinal lymph nodes was significantly lower than control cervical lymph nodes (P < 0.0001) and did, as expected, not change in response to manipulations of the glymphatic system (P = 0.47, Figure 4(c)).
Disruption of the glymphatic system hinders lactate efflux to cervical lymph nodes. (a) Left, drawing of the neck region of a mouse in the supine position with superficial cervical lymph nodes, parotid, and submandibular shown in blue. Right, drawing of the pelvic region of a mouse in the supine position with inguinal lymph nodes shown in blue. Lactate concentration in (b) superficial cervical lymph nodes and (c) inguinal lymph nodes in ketamine–xylazine anesthetized mice in control, acetazolamice treated (Ace), AQP4 KO, head 45° angle downwards (head down), sham surgery, CM puncture; N = 23, 10, 9, 10, 13, 15, respectively. *P < 0.05; ns, not significant; one-way ANOVA followed by Dunnett's test compared to control. T-test to compare CM puncture with sham surgery. Bar graphs represent mean ± SEM.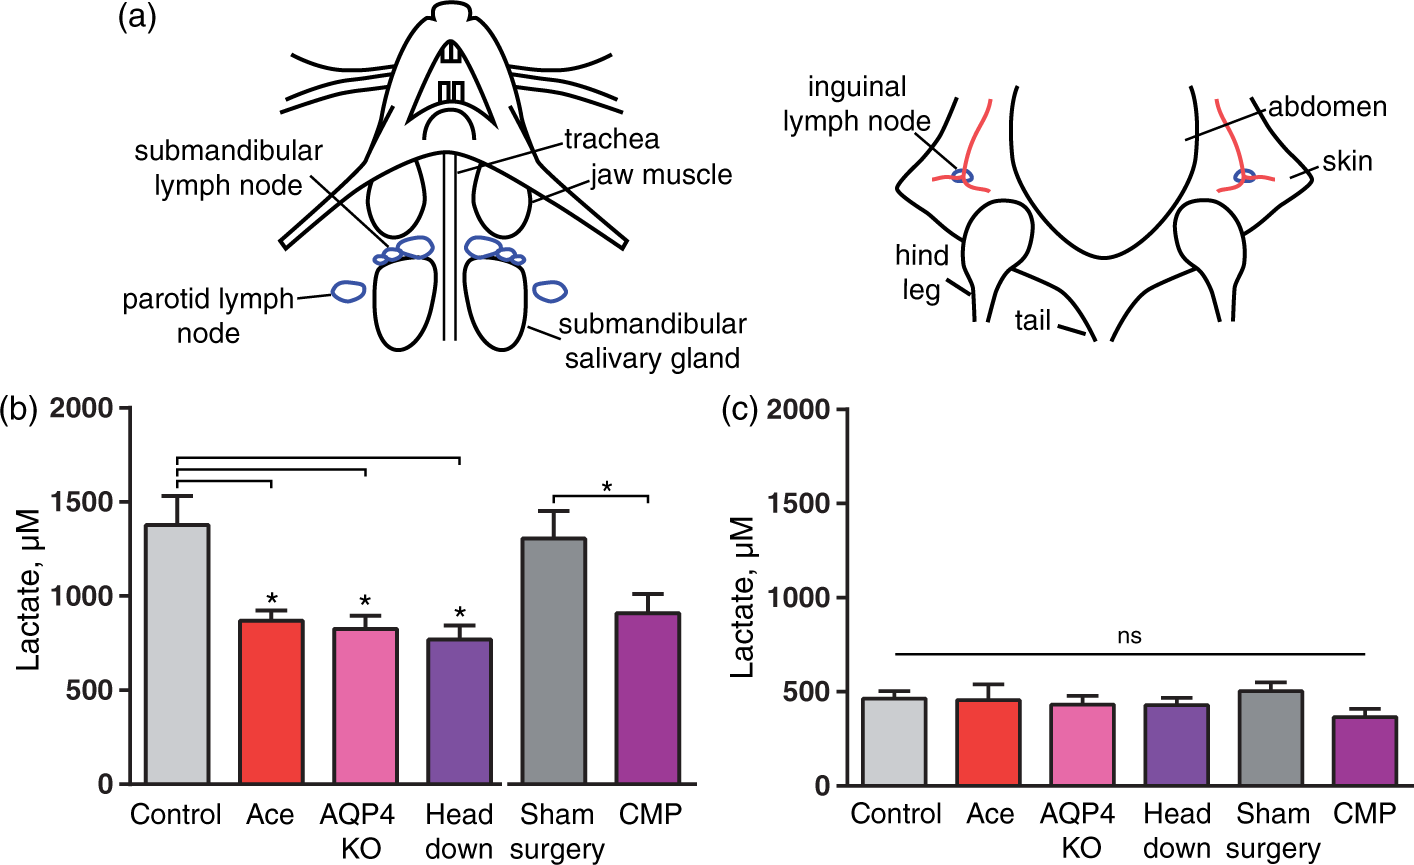
Anesthesia-induced reduction in brain lactate concentration is also sensitive to glymphatic manipulations
Lactate is transported across the plasma membrane by the monocarboxylate transporters (MCTs) by a driving force of protons and lactate concentration, and transport of lactate across cell membranes is fast; however, differences in intra- and extra-cellular concentrations have been reported.45–47 To critically assess whether the microdialysis samples data were representative for brain lactate concentrations, we also analyzed lactate concentrations in whole brain tissue samples from awake mice and mice who were anesthetized with K–X for 20 min in combination with the manipulations of glymphatic function. The mice in these experiments were decapitated and the whole heads were frozen by immersion in −80 ℃ isopentane, which freezes the brain in ∼10 s similar to immersion in liquid nitrogen but halts lactate development faster than liquid nitrogen.48,49 While this approach does not instantaneously stop lactate production, lactate generated after decapitation is expected to be similar across all groups. Brains were extracted and sectioned in a −20 ℃ chamber for determination of lactate. The analysis showed that acetazolamide, AQP4 KO or CM puncture did not alter brain lactate in awake mice consistent with the notion that glymphatic clearance is low during wakefulness
16
(P = 0.39, Figure 5(a)). However, the brain lactate concentration in acetazolamide and AQP4 KO mice were significantly higher during ketamine–xylazine anesthesia compared to control mice (P = 0.0008, P = 0.01, respectively) and CM puncture was significantly higher than sham surgery mice (P < 0.03). Sham surgery did not differ from control (P = 0.67, Figure 5(b)). These observations add further support to the notion that brain lactate concentration decreases in response to anesthesia as a consequence of increased glymphatic washout of lactate.
The effect of glymphatic manipulations on brain lactate in awake and anesthetized mice. Lactate concentration in flash-frozen mouse brain cut coronally at bregma −0.2 mm, in (a) awake control, acetazolamide treated and CM puncture, N = 13, 5, 4, respectively. P = 0.21, one-way ANOVA. (b) ketamine–xylazine anesthetized control, acetazolamide treated, sham surgery, and CM puncture mice, N = 11, 6, 6, 7, respectively. ***P < 0.001, *P < 0.05, one-way ANOVA followed by Dunnett's test for comparison of acetazolamide and AQP4 KO to control, t-test for comparison of CM puncture to sham surgery. Bar graphs represent mean ± SEM.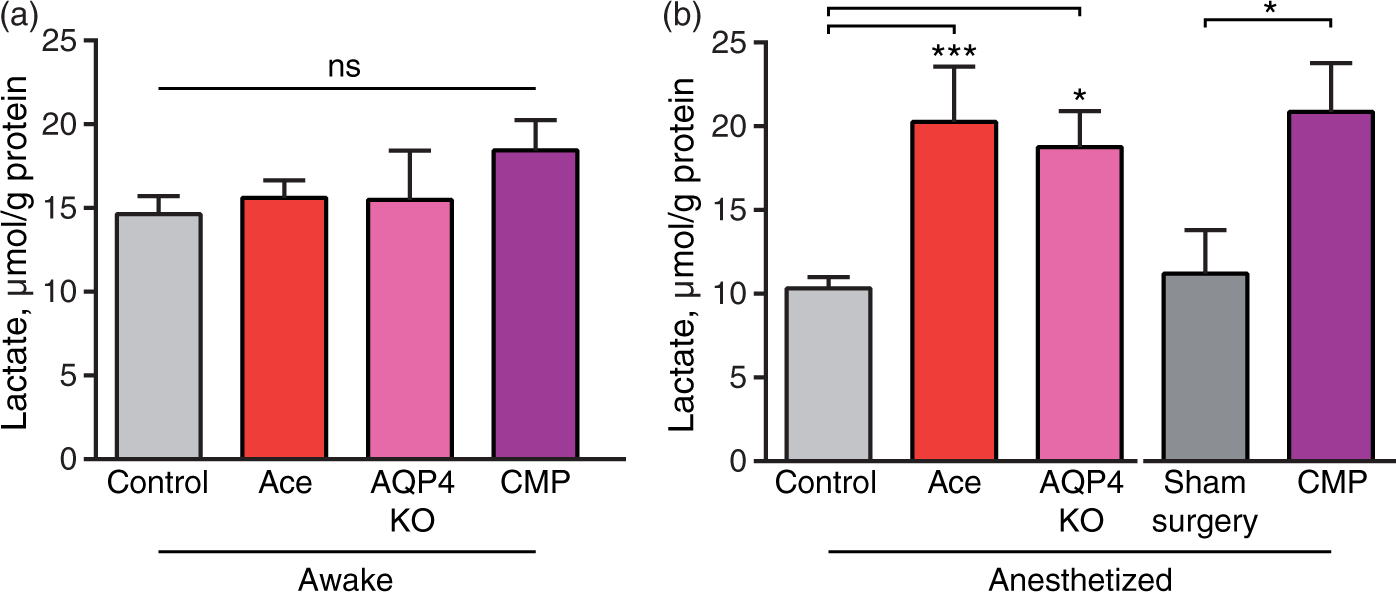
Discussion
Past studies have documented that brain lactate concentration follows neural activity and that lactate increases in response to somatosensory stimulation.50–53 A substantial body of literature further shows that cerebral lactate concentration is increased during wakefulness, perhaps partially mediated by break down of astrocytic glycogen as a result of noradrenergic stimulation,
54
and declines when an awake mouse or a rat transition into natural sleep or anesthesia.17–22 The state-dependent changes in lactate closely follow EEG activity and lactate is considered the best metabolic biomarker of the sleep–wake cycle, together with norepinephrine and glycogen.19,20,55–57 However, no studies have, to our knowledge, addressed why lactate is so robustly regulated by the sleep–wake cycle. The data presented here suggest that the glymphatic system, which is activated by natural sleep or anesthesia, literally flushes excess lactate out of the brain resulting in transient increases in lactate in nearby cervical, but not distal inguinal, lymph nodes (Figure 6). Earlier studies have documented that glymphatic transport of both endogenous and exogenous proteins and peptides (4–100 kDa) is driven by convective exchange of CSF-ISF.9,10,28 This study extents these observations to include the small metabolite lactate (90 Da). Several manipulations, including acetazolamide, CM puncture, aquaporin 4 (AQP4) deletion, and body position which all reduce glymphatic clearance were employed.28,58 Acetazolamide inhibits carbonic anhydrase and thereby CSF production in the choroid plexus, CM puncture eliminates the small pressure gradients that provide the hydraulic force that drives the convective exchange of CSF with ISF,
28
whereas deletion of AQP4 water channels reduces intraparenchymal convective fluid fluxes.
9
All of these manipulations reduced or eliminated the decline in lactate concentration that normally takes place when mice fall asleep (transition from dark to light phase) or are anesthetized with K–X. In fact, a simple manipulation – placing the mice's body in a 45° angle with their nose down
43
– inhibits glymphatic clearance, as well as the drop in lactate that occurs in response to K–X anesthesia (Figures 3(b) and 5(b)). Thus, our analyses show that the activation of glymphatic clearance that occurs when awake mice transitioning into sleep or anesthesia correlates with lactate clearance, and hence support the conclusion that the glymphatic system contributes to the rapid reduction of brain lactate. It is however clear, that both glucose and oxygen consumption are lowered during sleep, in part due to reduced adrenergic activity.59–61 The relation between metabolism and sleep is complex, and may also involve the recently appreciated role of lactate as a signaling molecule.61,62 Recent work shows that lactate released from astrocytes increases locus coeruleus (LC) activity and thereby increases noradrenergic drive. To overcome issues related to metabolic differences in sleep and wakefulness, we used three mechanistically different manipulations to reduce glymphatic activity during the transition from awake to sleep and four manipulations during the transition from wakefulness to anesthesia. All sets of data presented in this report supported the notion that glymphatic clearance plays a key role in state-dependent changes in brain lactate concentration.
Pathways from the glymphatic system in the brain to the lymph system. Drawing of CSF efflux from the brain to the lymph. CSF is collected into meningeal lymph (top blue line) or flows out via nasal mucosa and enters lymph vessels (blue) connected to superficial cervical lymph nodes, parotid, and submandibular, and deep cervical lymph nodes (blue). In this study, parotid and submandibular lymph were collected for lactate measurements. The optic nerve is shown in bold blue.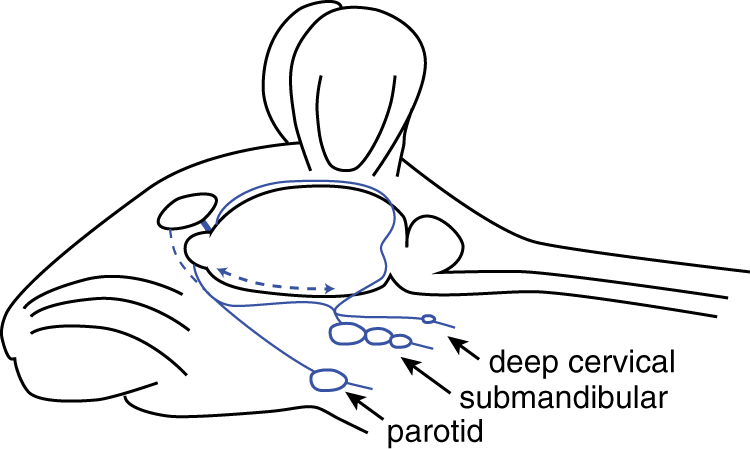
During physiological conditions, O2 and glucose are normally consumed in a ratio of 5.5:1, suggesting that 9% of glucose is consumed anaerobically in CNS.1–5 During a period of activation, the O2:glucose ratio declines even further4,63 leading to the concept that increased neural activity is, at least in part, supported by less efficient ATP production by glycolysis and that brain activity therefore is linked to generation of surplus lactate. However, it is unclear how the excess lactate leaves the brain. The expression of MCTs in brain endothelial cells is high and lactate is able to permeate the blood–brain barrier, most likely by passing through MCTs on endothelial cells. 64 Nonetheless, Madsen et al.5,65 found that in humans, the arterio-venous difference in lactate during activation is minimal and therefore it is unlikely that lactate is exported via the general circulation. A later study monitored arterio-venous lactate differences, as well as brain glucose, lactate, and glycogen after sensory stimulation. The authors concluded that excess glucose consumption during sensory stimulation is not accounted for by lactate efflux to blood or from accumulation within brain tissue. 3 A follow-up analysis based on systemic administration of radiolabeled glucose showed that roughly half of lactate produced during cortical spreading depression is exported to the blood. 66 It is uncertain whether this observation applies to lactate export across the BBB during physiological stimulation or transitions between wake and sleep, since cortical spreading depression is a pathological event, which for example involve opening of the blood–brain barrier.67,68 More recently, it was documented that lactate diffuses brain wide and it was hypothesized, based on the distribution of a tracer (Evans blue conjugated with albumin, ∼67 KDa), that the perivascular space may constitute an efflux pathway for lactate.6,7 Our observation provides direct support for this hypothesis. In addition, glymphatic bulk flow within the tissue will transport lactate from the metabolic active neuropil into perivascular spaces and thereby facilitate BBB efflux of lactate. Of note, although the primary source of lactate in the brain is glucose or glycogen,69,70 lactate can also be generated from other sources. For example, astrocytes engage in glutamate metabolism via the Krebs cycle that can result in lactate production. 71 In addition, it is possible that some of the lactate is derived from intermediate metabolites of the Krebs cycle via pyruvate recycling and the alpha α-ketoglutarate glutamate-glutamine pathway in astrocytes, as shown in cultured cells.72–75 Independently of the source of lactate, our data point to glymphatic transport as an important path for lactate clearance.
An interesting consequence of state-dependent changes in brain lactate is that it will alter the lactate/pyruvate ratio, and thereby the NADH/NAD redox potential.76,77 The glymphatic-lymphatic washout of lactate during sleep, and the lack of lactate clearance during wakefulness is therefore expected to result in an increase of redox state during wakefulness relative to sleep. A recent study reported that simply increasing extracellular lactate or NADH induced a pattern of immediate early gene expression that was reminiscent of those induced by long-term potentiation (LTP), although physiological levels of brain lactate might not reach 10–20 mM lactate as used in this study. 78 Other studies have in the past noted similar changes in gene expression mediated by LTP versus wakefulness. 79 Thus, it is possible that the suppression of glymphatic lactate clearance during wakefulness contributes to the characteristic expression of immediate early genes and thereby to memory consolidation.
Footnotes
Funding
The author(s) disclosed receipt of the following financial support for the research, authorship, and/or publication of this article: This work was supported by the NIH/NINDS NS078167 and NS078304 (MN), R56 NS086924 and R21 AG050212 (RD), Novo Nordisk Foundation, and Lundbeckfonden.
Acknowledgements
We thank Yonghong Liao and Hanna Vinitsky for technical assistance.We also thank Gerry Dienel and Mauro DiNuzzo for thoughtful comments on the manuscript.
Declaration of conflicting interests
The author(s) declared no potential conflicts of interest with respect to the research, authorship, and/or publication of this article.
Authors' contributions
IL, MLL and MN designed research; IL, MLL, EY, WP, HM, EH and RD performed research; IL, RD, MN contributed new reagents/analytic tools; IL, MLL, EY, HM, EH and RD analyzed data; and IL, MLL, HM, RD and MN wrote the paper.