
Abstract
[11C]DAA1106 is a potent and selective ligand for the peripheral benzodiazepine receptor (PBR) with high affinity. It has been reported that the density of PBR is related to brain damage, so a reliable tracer method for the evaluation of PBR would be of use. We evaluated a quantification method of [11C]DAA1106 binding in simulated data and human brain data. In the simulation study, the reliability of parameters estimated from the nonlinear least-squares (NLS) method, graphical analysis (GA), and multilinear analysis (MA) was evaluated. In GA, variation of the estimated distribution volume (DV) was small. However, DV was underestimated as noise increased. In MA, bias was smaller, and variation of the estimated DV was larger than in GA. In NLS, although variation was larger than in GA, it was small enough in regions of interest analysis, and not only DV but also binding potential (BP), determined from the k3/k4 without any constraint, could be estimated. The variation of BP estimated with NLS became larger as k3 or k4 became smaller. In human studies with normal volunteers, regions of interest were drawn on several brain regions, BP was calculated by NLS, and DV was also estimated by NLS, GA, and MA. As a result, DVs estimated with each method were well correlated. However, there was no correlation between BP with NLS and DV with NLS, GA, and MA, because of the variation of K1/k2 between individuals. In conclusion, BP is estimated most reliably by NLS with the two-tissue compartment model.
Keywords
Introduction
The peripheral benzodiazepine receptor (PBR) is pharmacologically distinct from the central benzodiazepine receptor. Peripheral benzodiazepine receptor is primarily found on mitochondrial membranes in various peripheral tissues (Anholt et al, 1985, 1986; Antkiewicz-Michaluk et al, 1988; Gavish et al, 1999), and specific ligands for PBR such as [3H]Ro5-4864 and [3H]PK11195 revealed that PBR was also expressed in the brain (Schoemaker et al, 1981, 1983; Benavides et al, 1983; Le Fur et al, 1983). PK11195 binding in cultured microglia and astrocytes was at eightfold higher density than in cultured neurons (Jayakumar et al, 2002), suggesting that PBR mainly localizes in glial cells in the brain. It has been reported that the density of PBR is increased in microglia activated by brain damage (Myers et al, 1991; Stephenson et al, 1995; Banati et al, 1997; Kuhlmann and Guilarte, 2000).
[11C]PK11195 has been used for the in vivo imaging of PBR in the brain by positron emission tomography (PET), especially for the evaluation of lesions, and [11C]PK11195 binding was reported to have increased in the stroke region (Pappata et al, 2000), plaque of multiple sclerosis (Banati et al, 2000; Debruyne et al, 2002), the cortex of Alzheimer's disease (Cagnin et al, 2001), and epileptic foci (Goerres et al, 2001). Since PBR localizes in glial cells in the brain, definition of the reference region without specific binding is difficult, especially in diseases with a widespread distribution of pathologic changes, such as Alzheimer's disease. Semi-quantification of specific binding was performed using late images, in which the activity of the region of interest was normalized to that of the cerebellum (Groom et al, 1995), cortical gray matter (Debruyne et al, 2003), or the whole brain (Debruyne et al, 2002). However, evaluation of specific binding potential (BP) with a compartment model without arterial blood sampling was performed using cluster analysis for the extraction of voxels with normal ligand kinetics to serve as the reference input function (Banati et al, 2000; Cagnin et al, 2001). Recently, Kropholler et al (2005) analyzed [11C]PK11195 kinetics by a one-tissue or two-tissue compartment model with metabolite-corrected plasma input function, and concluded that a two-tissue reversible compartment model with K1/k2 fixed to the whole cortex value was optimal. However, in the [11C]PK11195 study, its signal in the brain was not high enough for stable quantitative analysis.
(N-5-fluoro-2-phenoxyphenyl)-N-(2,5-dimethoxybenzyl) acetamide (DAA1106) is a potent and selective ligand for PBR with high affinity (Chaki et al, 1999, Okuyama et al, 1999, Okubo et al, 2004). The synthesis of [11C]DAA1106 and its high accumulation in the mouse brain have been reported (Zhang et al, 2003), and radioactivity of [11C]DAA at 30 mins after injection was approximately four times higher than that of [11C]PK11195 in the monkey occipital cortex (Maeda et al, 2004). It has also been reported that [11C]DAA1106 binding was inhibited by unlabeled DAA1106 and PK11195 in monkey brain and that the [11C]DAA1106 binding corresponded to specific binding (Maeda et al, 2004). Moreover, the radiolabeled metabolite of [11C]DAA1106 was more polar than [11C]DAA1106, and was shown not to cross the BBB in mice (Zhang et al, 2003). The application of [11C]DAA1106 can be useful in the diagnosis of neurodegenerative disorders and in the investigation of the mechanism of glia-neuron interactions. However, the quantitative analysis method for [11C]DAA1106 binding has not been established.
In the present study, we evaluated a kinetic analysis method for the quantification of [11C]DAA1106 binding in the human brain of normal volunteers and simulated data.
Materials and methods
Theory
Compartment Model: The compartment model for [11C]DAA1106 kinetic analysis is shown in Figure 1. K1 is used to describe the rate constant for transfer from plasma to the free and nonspecific binding compartment Cf, k2 is used to describe the rate constant for transfer from Cf to plasma, and k3 and k4 are included to represent the binding and dissociation of the radioligand at the PBR site, respectively. The total distribution volume (DV) is represented by K1/k2(1 + k3/k4), and BP is defined as k3/k4 (Mintun et al, 1984).
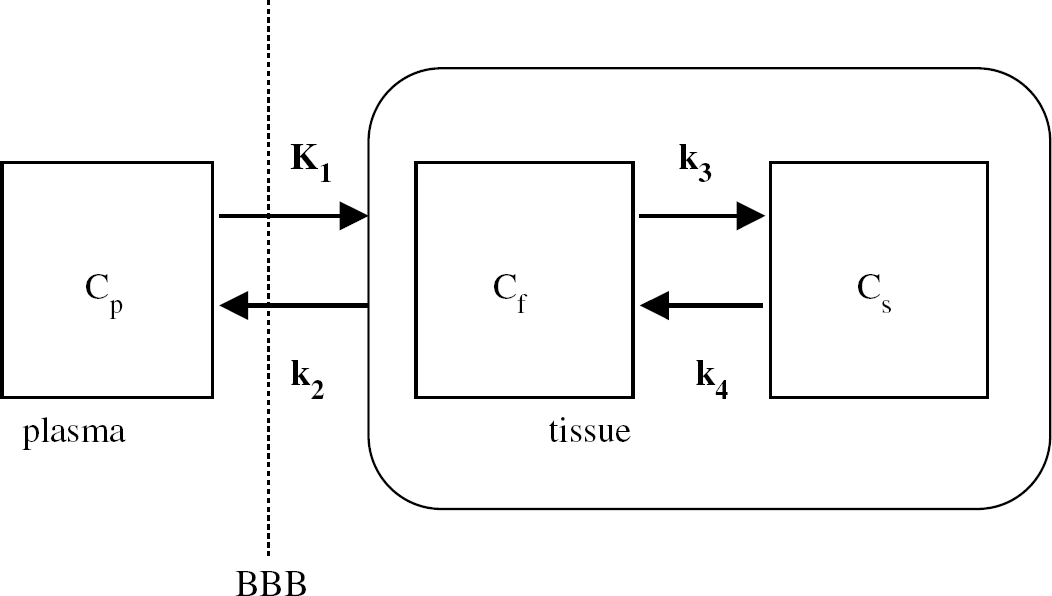
Kinetic model for [11C]DAA1106.
Nonlinear Least-Squares Method: Each rate constant of two-tissue compartment model (Figure 1) is estimated by nonlinear least-squares (NLS) fitting with iteration of modified Marquardt algorithm without weighting and without constraints.
GraphicaI AnaIysis Method: Graphical analysis (GA) yields DV by arterial input function and the tissue time–activity curve (TAC) (Logan et al, 1990). Parameters are estimated from the equation
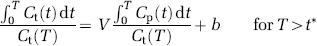
where Cp is the radioactivity concentration in metabolite-corrected plasma, Ct is the radioactivity concentration in tissue, and V represents the total DV. Since b becomes constant only after equilibration time t*, V and b are estimated as a slope and an intercept, respectively, by using points of T> t*.
Multilinear Analysis Method: Equation (1) can be rear-ranged to obtain equation (2) (Ichise et al, 2002).
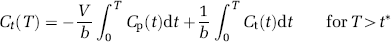
β1 = −V/b and β2 = 1/b are estimated by linear regression analysis without weighting for T> t*, and V is calculated from –β1/β2.
Simulation Analysis
Simulated TACs of [11C]DAA1106 with several noise levels were generated to investigate the bias and variation of parameter estimates caused by the statistical noise for each analysis method. A dynamic tracer concentration for [11C]DAA1106 was derived from the rate constant values (k-values) given as true values and a measured input function according to the human PET imaging protocol. The true k-values used for the simulation were K1 = 0.055, k2 = 0.088, k3 = 0.062, and k4 = 0.012, determined from the dorsolateral prefrontal cortex of human brain by the NLS method with the two-tissue compartment model.
The noise ratio for each frame was determined according to the collected total count given by
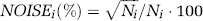
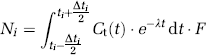
where i is the frame number, Ct is the nondecaying tissue radioactivity concentration derived from the k-values and the input function, ti is the midpoint time of the ith frame, Δti is the data collection time, λ is the radioisotope decay constant, and F is a scaling factor representing the sensitivity of the measurement system and is introduced here to adjust the noise level. It should be noted that this equation assumes that the noise, which is added to the TAC, is determined by the count of curve itself. In fact, the noise is determined by the total count of the slice, and is affected by random, dead time, and so on. The noise was generated with random numbers based on Gaussian distribution and added to the nondecaying tissue activity for each frame. The level of the noise for the dynamic data was expressed as the mean of percent noise described in equation (3) from 1 to 90 mins. In this simulation study, F was chosen so that the mean of percent noise would be 1%, 3%, 5%, 7%, 10%, and 15%, and a thousand noisy data sets were generated for each.
In these simulated TACs, each k-value was estimated by the NLS method, and the DV value was estimated by GA and multilinear analysis (MA) methods. For NLS, initial k-values varied between ± 25% from the true k-value, and parameter estimates were considered invalid if K1, k2, k3, and k4 were outside the range 0.0<k < 0.5, or k3/k4 was more than three times the true value. For GA and MA, t* was fixed at 30, 40, or 50 mins. For the MA method, parameter estimates were considered invalid if DV was more than three times the true value. Reliability of the estimated parameters was evaluated by the mean and coefficient of variation (COV; s.d./mean (%)) of the estimates excluding outliers, and the relationship between reliability of the parameter estimates and noise level was investigated for each analysis method. In the GA and MA methods, the relationship between estimated DV and t* was also investigated with TACs of 0% and 5% noise.
Next, reliability of the parameter estimates by the NLS method was investigated for various k3 and k4 values using TACs simulated with K1 = 0.055, K1/k2 = 0.625, k3 = 0.02, 0.04, 0.06, 0.08, 0.1, k4 = 0.004, 0.006, 0.008, 0.01, 0.015, blood volume (BV) = 0.05, with the same F of equation (4) for approximately 2% noise determined from the residual error of the NLS analysis in human volume of interest (VOI) data (Millet et al, 1996; Ikoma et al, 2001). In this estimation, the parameter was considered unsuccessful when the BP value was more than twice the true value.
Simulations were performed on Dr View (Asahi Kasei Information Systems Co., Tokyo, Japan).
Human Study Analysis
Subjects: Nine healthy volunteers (age range 32 to 73 years; mean ± s.d., 55.6 ± 17.4 years) participated in this study. All volunteers were free of any somatic, neurologic, or psychiatric disorders, and they had no history of current or previous drug abuse. This study was approved by the ethics and radiation safety committees of the National Institute of Radiological Sciences, Chiba, Japan. Written informed consent was obtained from each subject.
Radiotracer Preparation: (N-5-fluoro-2-phenoxyphenyl)-N-(2,5-dimethoxybenzyl) acetamide and (N-5-fluoro-2-phenoxyphenyl)-N-(2-hydroxy-5-methoxybenzyl) acetamide (DAA1123) as desmethyl precursors were kindly donated by Taisho Pharmaceutical Co. (Tokyo, Japan). [11C]CH3I was transferred under a helium gas flow with heating into a reaction vessel containing anhydrous N,N-dimethylformanide (DMF) (300 μL), DAA1123 (0.3 to 0.5 mg), and NaH (3 to 5 μL, 0.5g/20 mL DMF) cooled to −15°C to −20°C. After adding CH3CN/H2O (6/4, 500 μL), the radioactive mixture was applied to a semipreparative high-performance liquid chromatograph (HPLC) column (Zhang et al, 2003). The radioactive fraction corresponding to [11C]DAA1106 was collected in a sterile flask.
Positron Emission Tomography Study: Positron emission tomography scans were performed using ECAT EXACT HR+ (CTI-Siemens, Knoxville, TN, USA), which provides 63 planes and a 15.5-cm axial field of view. A transmission scan with a 68Ge-68Ga source was followed by a dynamic 90-min scan (20 secs × 9, 60 secs × 5, 120 secs × 4, 240 secs × 11, and 300 secs × 6) with a bolus injection of 351.1 to 375.9 (mean ± s.d., 360.8 ± 9.2) MBq of [11C]DAA1106. The specific radioactivities were 25.8 to 68.8 (mean ± s.d., 43.4 ± 13.9) GBq/μmol at the time of injection. Radioactivity was measured in three-dimensional mode and the data were reconstructed using a Hanning filter with a cutoff frequency of 0.4 (full width at half maximum = 7.5 mm).
T1-weighted magnetic resonance imaging (MRI) of the brain was acquired from Phillips Intera, 1.5 T (Philips Medical Systems, Best, The Netherlands). T1-weighted images of the brain were obtained from all subjects. The scan parameters were 1-mm thick 3D T1 images with a transverse plane (repetition time (TR)/echo time (TE) 22/9.2 ms, flip angle 30, matrix 128 × 128, field of view (FOV) 256 × 256). Voxel size of the magnetic resonance images is 1 mm × 1 mm × 1 mm.
ArteriaI BIood SampIing: To obtain the arterial input function, an automated blood sampling system was used during the first 12 mins of each PET measurement (Eriksson et al, 1988). The concentration of radioactivity in the arterial blood was measured every second. To collect the difference in time between brain and automated blood sampling, the blood start time that arterial blood activity measured by automated blood sampling system began to appear was adjusted to the measurement start time that brain activity began to be observed by PET camera, that is, t =0. At the same time, arterial blood samples were taken manually and their concentration of radioactivity was measured 13 times during the initial 3 mins after the tracer injection, 8 times during the next 17 mins, and then once every 10 mins until the end of the scan. Each manually taken blood sample was separated into plasma and blood cell fractions by centrifugation, and the concentration of radioactivity of plasma was measured. For the plasma fractions at 3.5, 9, 19, 29, 39, 49, 59, 69, 79, and 89 mins after injection, acetonitrile was added and then centrifuged. The extraction efficiency of radioactivity into the acetonitrile supernatant at 3.5 mins was 97% of the total radioactivity in the plasma. There was little change of the extraction efficiency with time after injection. The obtained supernatant was subjected to radio-HPLC analysis (column m Bondapak C18; mobile phase, 65/35 acetonitrile/distilled water). The fraction of unchanged [11C]DAA1106 in total plasma radioactivity was fitted by f=a*exp(-bt) + (1-a)*exp(-ct), where f is the fraction of unchanged [11C]DAA1106; a, b, and c are the estimated parameters. A metabolite-corrected plasma curve was generated by the product of the plasma activity and metabolite fraction curves. Plasma protein binding was not determined in the present study.
Positron Emission Tomography Data AnaIysis: Radioactivity concentration in brain regions was obtained with a template-based method for defining VOIs (Yasuno et al, 2002). Briefly, this method consisted of two major steps: the first involving the spatial transformation of a template of a VOI from a model MRI to an individual MRI, and the second refining the transformed VOI to the individual segmented gray matter of the MRI using the intensity characteristics of these images. The finally refined VOIs were linearly transformed with the parameters obtained from the coregistration of the individual MRIs to PET images. Manual correction was also applied to VOIs of the striatum and thalamus. Volumes of interest were defined over the dorsolateral prefrontal cortex (mean volume 5652 voxels, 2.68 × 2.68 × 2.425 mm/voxel), medial prefrontal cortex (1472 voxels), lateral temporal cortex (5038 voxels), medial temporal cortex (1558 voxels), parietal cortex (4138 voxels), occipital cortex (3939 voxels), anterior cingulate cortex (651 voxels), posterior cingulate cortex (692 voxels), striatum (1068 voxels), thalamus (592 voxels), and cerebellum (1338 voxels).
For each region, K1, k2, k3, k4, and BV were estimated by NLS, and DV was estimated by GA and MA. In GA and MA, the start time for the linear regression t* was set at 40 mins, and a vascular radioactivity contribution of 5% was eliminated from the measured TAC of each VOI by using the whole-blood TAC. Analysis of human data was performed using MATLAB (The MathWorks, Natick, MA, USA) or PMOD (PMOD Technologies, Zurich, Switzerland).
Results
Simulation Study
Plasma input function for the simulation and examples of simulated TACs with several noise levels are shown in Figure 2. Distribution volume and BP were estimated by NLS, GA, and MA in these simulated TACs, and the bias and variation of the estimated parameters for each method were investigated. In the NLS method, the bias was small at a low noise level. However, the variation of estimated DV and BP became larger as the noise increased (Figure 3A). The COV values of DV and BP were almost the same, whereas that of K1/k2 was smaller. When the noise level was 5%, COV of DV, BP, K1/k2 was 22%, 21%, 11%, respectively. Percentage of simulations with outliers that were excluded from the statistics was 0% at 1 and 3% noise level, 0.3% at 5% noise, 2.6% at 7% noise, 9.6% at 10% noise, and 21% at 15% noise. In the GA method, the variation of DV was much smaller than in the other methods (Figure 3B). However, DV was underestimated even at the low noise level, and this bias became larger as the noise increased. Bias and COV were affected by the start point of linear regression, t*. However, in the MA method, although DV was underestimated at a low noise level and overestimated at a high noise level, bias did not change much according to the noise level (Figure 3C). Coefficient of variation of the estimated parameters was larger than in GA, and was greatly affected by t*. When t* was 30 mins, COV was smaller than in NLS. However, COV became larger than in NLS when t* was 50 mins. There was small negative bias in GA and MA even at 0% noise level for the cause of the selection of t*.
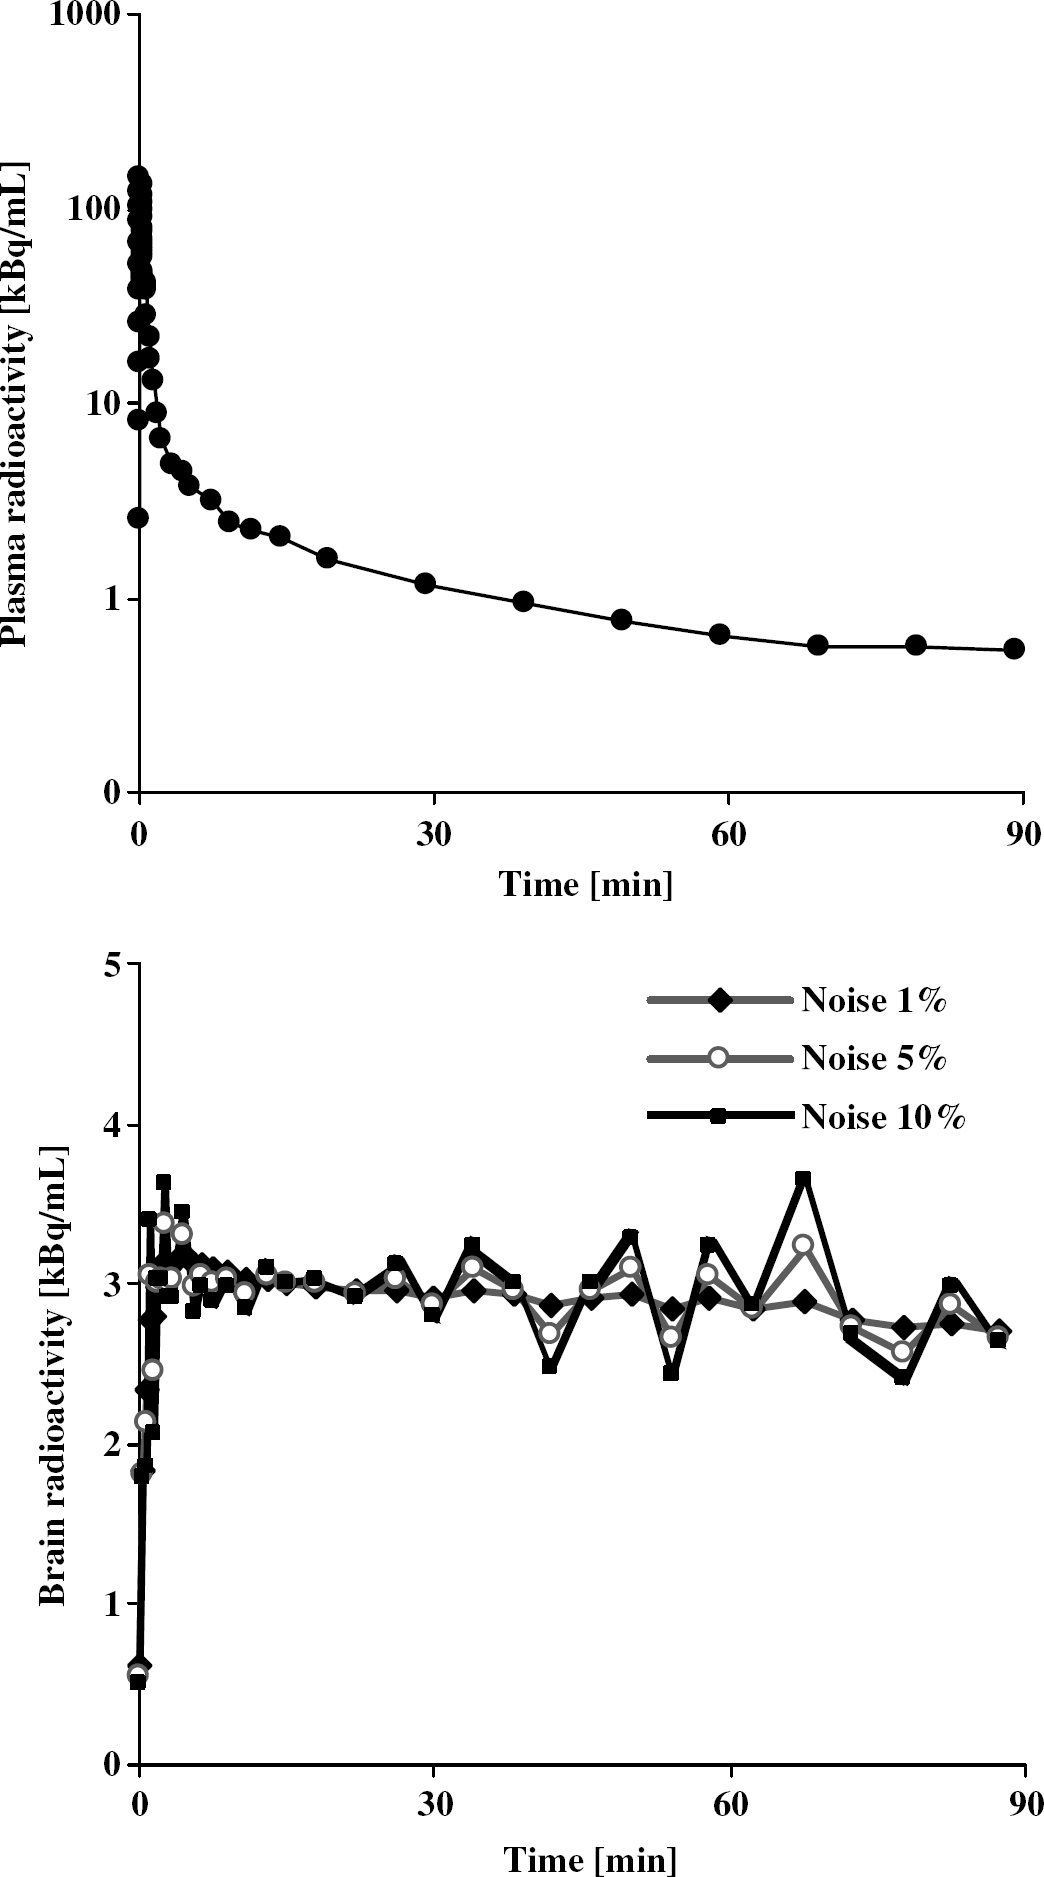
Metabolite-corrected plasma TAC used as an input function for the simulation (upper) and examples of simulated TACs of the frontal cortex for [11C]DAA1106 at a mean noise of 1%, 5%, and 10%, respectively (lower).
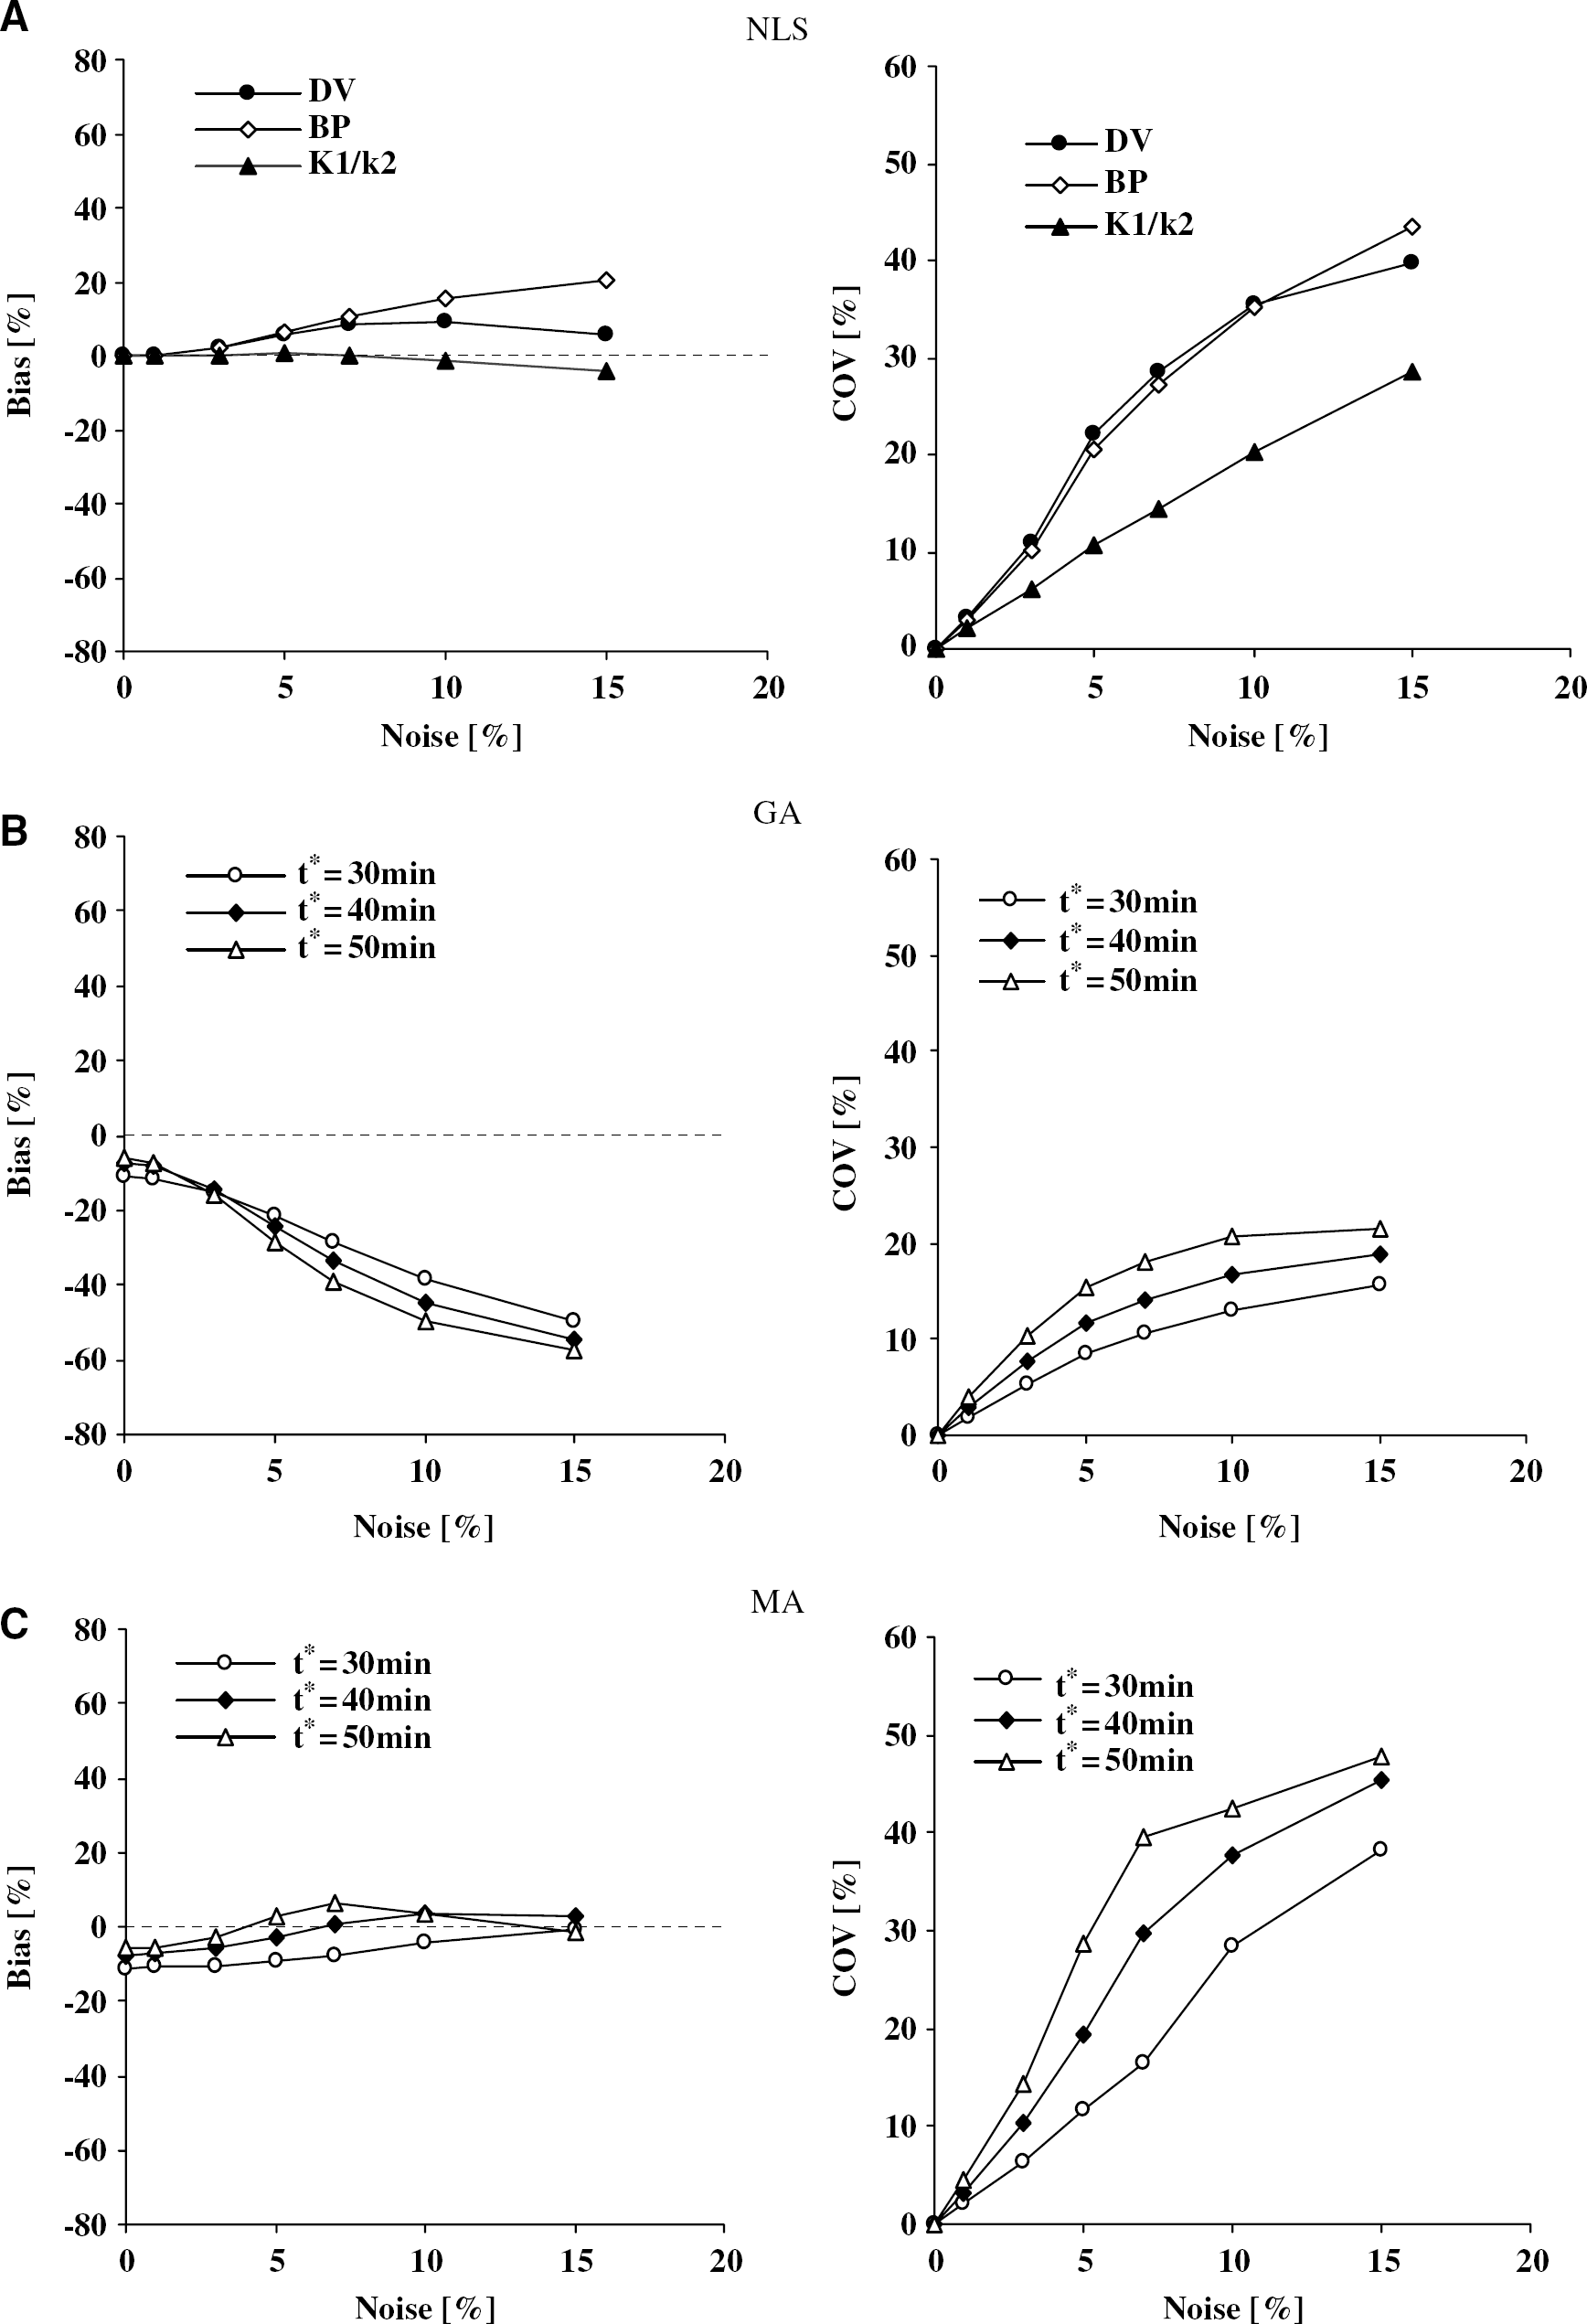
Relationship between noise and reliability for the methods of NLS (
The relationships between DV estimates and t* in the GA and MA methods are shown in Figure 4. In the 0% noise TAC, DV estimates approached the true value as t* became larger. However, in the 5% noise TAC, DV estimated by GA did not approach the true value and that by MA was overestimated as t* became larger.
Next, the reliability of NLS was investigated for various k-values. Coefficient of variation of the estimated BP increased as k3 became smaller or k4 became smaller (Figure 5). Although COV decreased as K1 became larger owing to the change of uptake, that is, increase of the radioactivity count, this tendency that COV of the BP increased with small k3 and k4 did not change according to the K1 value (data not shown). When k4 was smaller than 0.01, COV of the BP estimate at 2% noise TACs was over 10%.
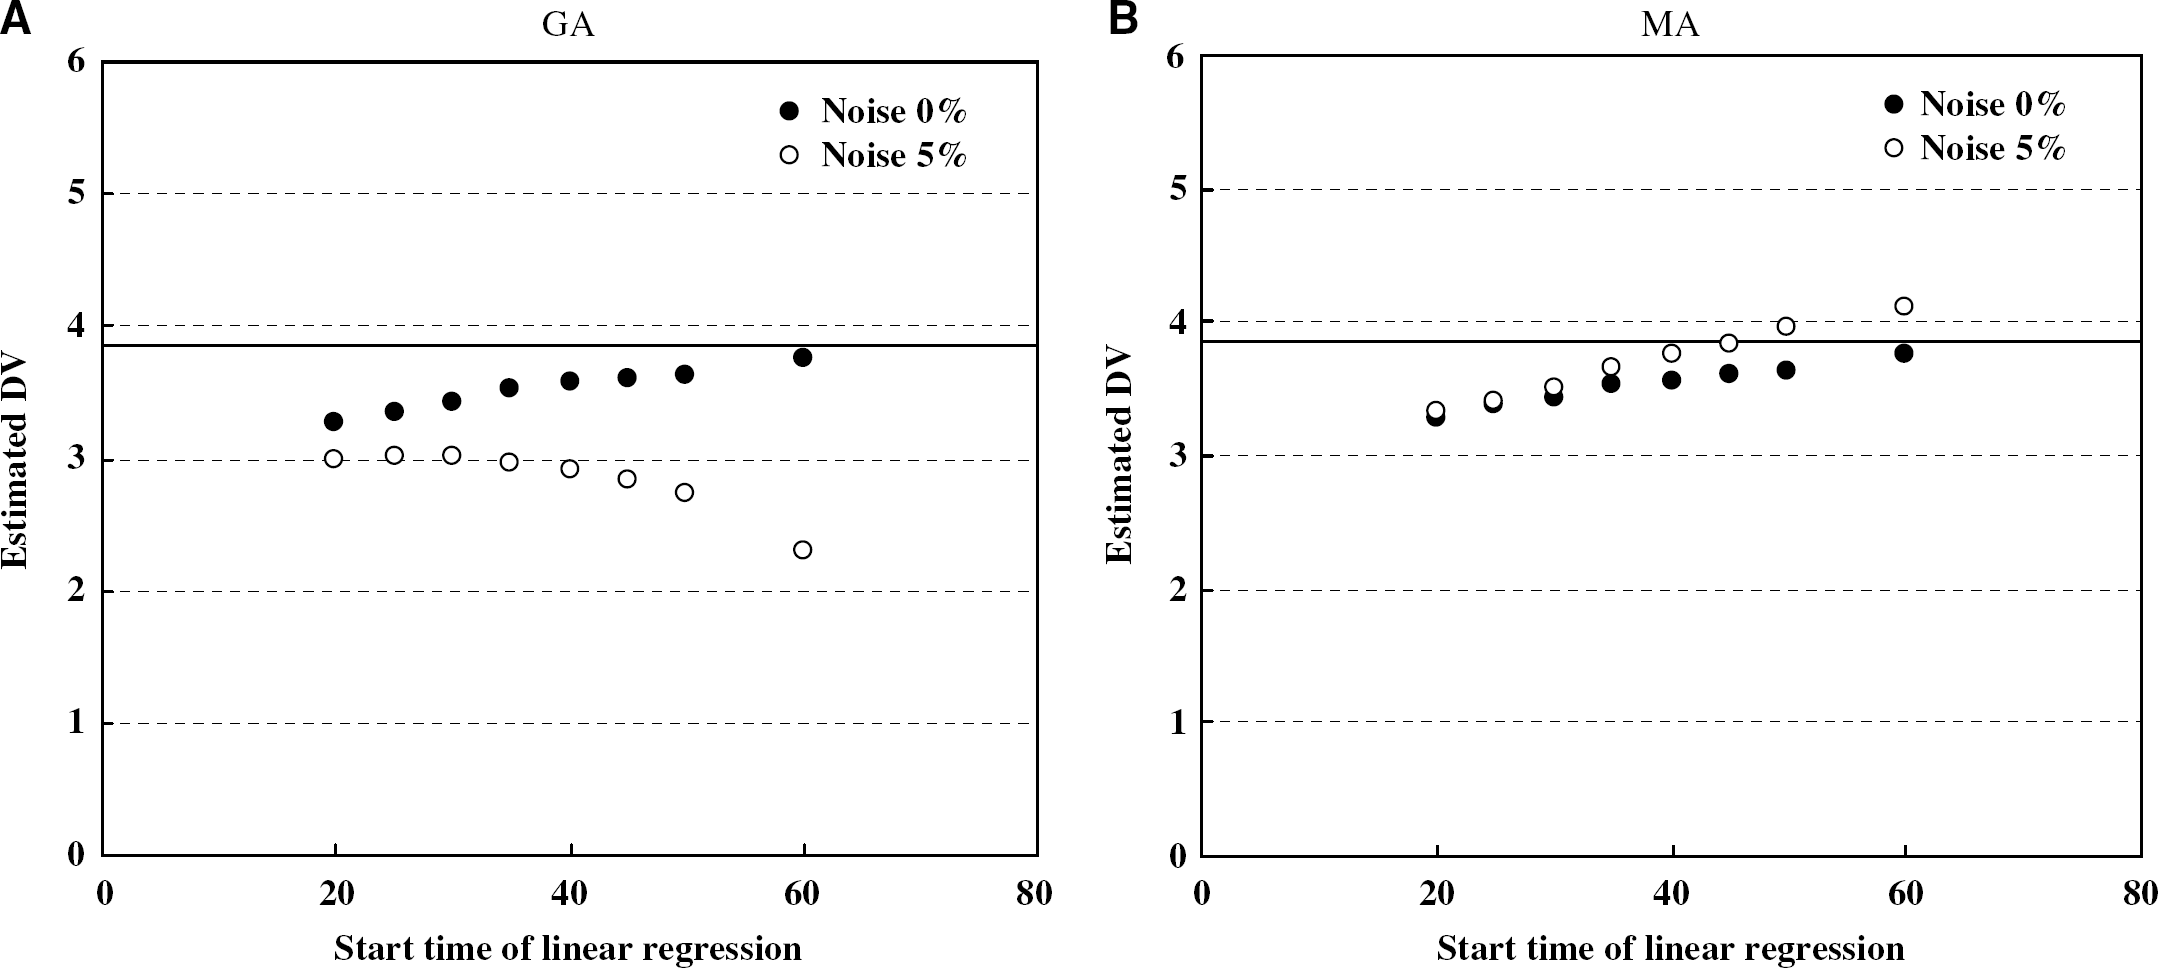
Relationship between the start time of linear regression and DV estimated with GA (
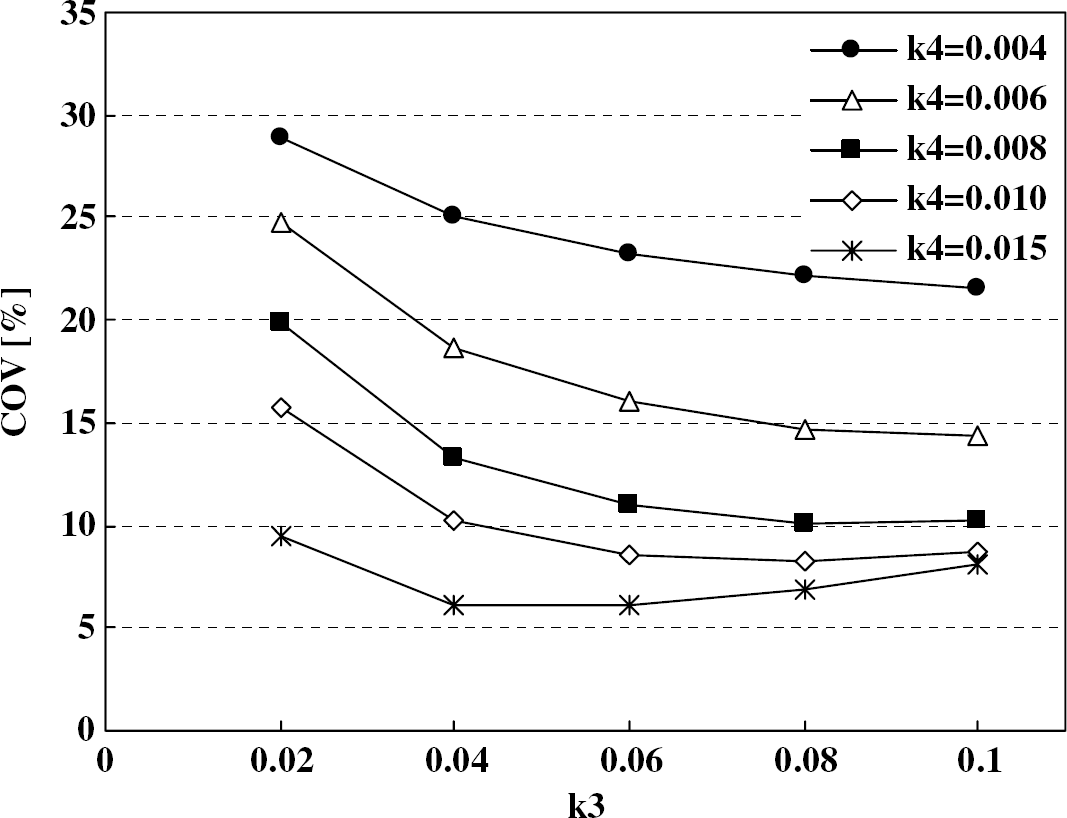
Relationship between k3 value and COV of BP estimated by NLS method for simulation data with approximately 2% noise. The rate constant values used in the simulation were K1= 0.055, k2 = 0.088, k3 = 0.02, 0.04, 0.06, 0.08, 0.1, and k4 = 0.004, 0.006, 0.008, 0.01, 0.015, BV = 0.05.
Human Study
Typical examples of unchanged fraction in plasma, TACs for whole-blood and metabolite-corrected plasma, and TACs for several regions are shown in Figure 6, and early and late images are shown in Figure 7. Typical examples of estimated results by NLS and GA are shown in Figure 8. The two-tissue compartment model was able to fit the measured TACs; meanwhile, the one-tissue compartment model was not sufficient to describe the TACs. In the TAC shown in Figure 8, BV estimated by NLS with the two-tissue compartment model was 0.051, and the fraction of vascular radioactivity to the total region time activity was 38% at 1 min after injection, 14% at 2 mins, 4% at 10 mins, and under 3% after 30 mins. The DV estimates of each method are listed in Table 1. Although the mean DV values estimated by GA and MA were smaller than those by NLS in all regions, there was strong correlation between DV estimated by NLS and that by GA or MA (Figure 9). The DV underestimation of GA with respect to NLS was approximately 14% in small region (anterior cingulate cortex, posterior cingulate cortex, striatum, and thalamus), 12% in large region (dorsolateral prefrontal cortex, medial prefrontal cortex, lateral temporal cortex, medial temporal cortex, parietal cortex, occipital cortex, and cerebellum), and that of MA was approximately 8.6% in small region, 10% in large region. This was consistent with the underestimates observed in the simulation study, as shown in Figure 3. However, no correlation was observed between BP estimated by NLS and DV estimated by NLS, GA, or MA in the dorsolateral prefrontal cortex (Figure 10) and all the other regions.
Average values of parameters estimated by each method in human study (n = 9)
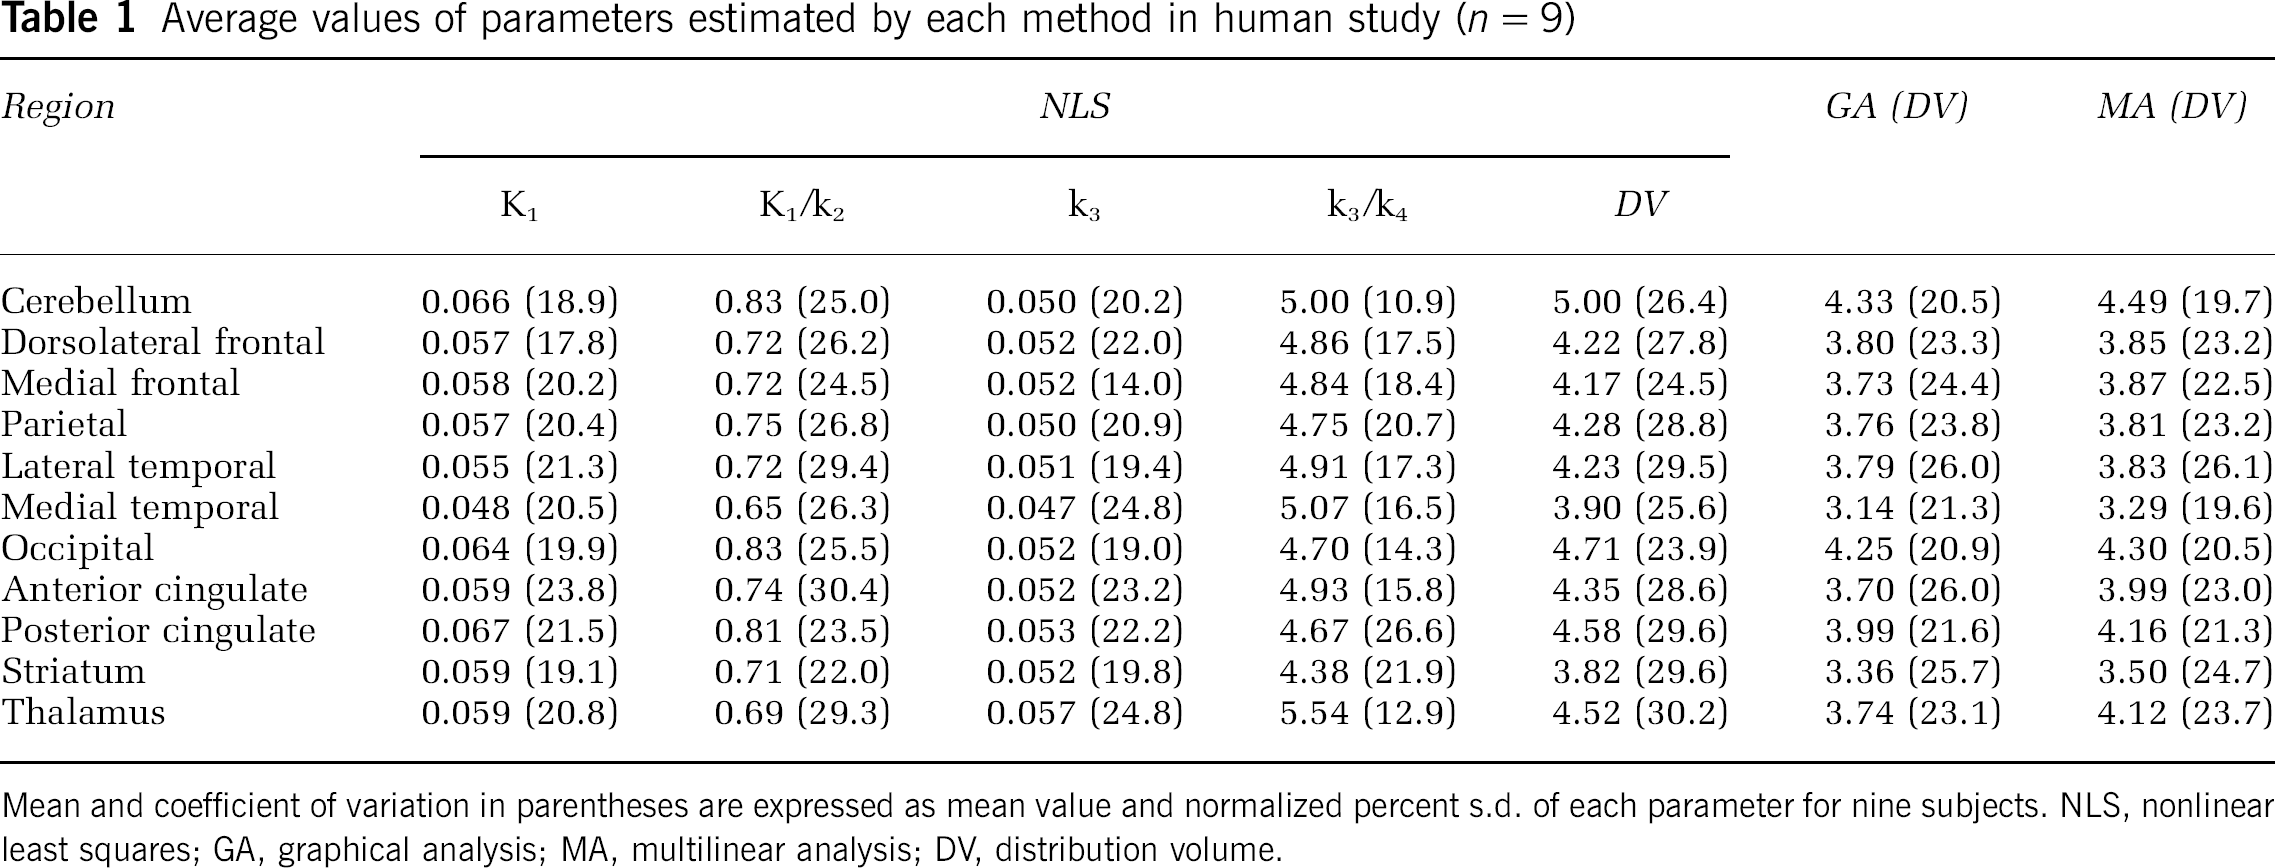
Mean and coefficient of variation in parentheses are expressed as mean value and normalized percent s.d. of each parameter for nine subjects. NLS, nonlinear least squares; GA, graphical analysis; MA, multilinear analysis; DV, distribution volume.
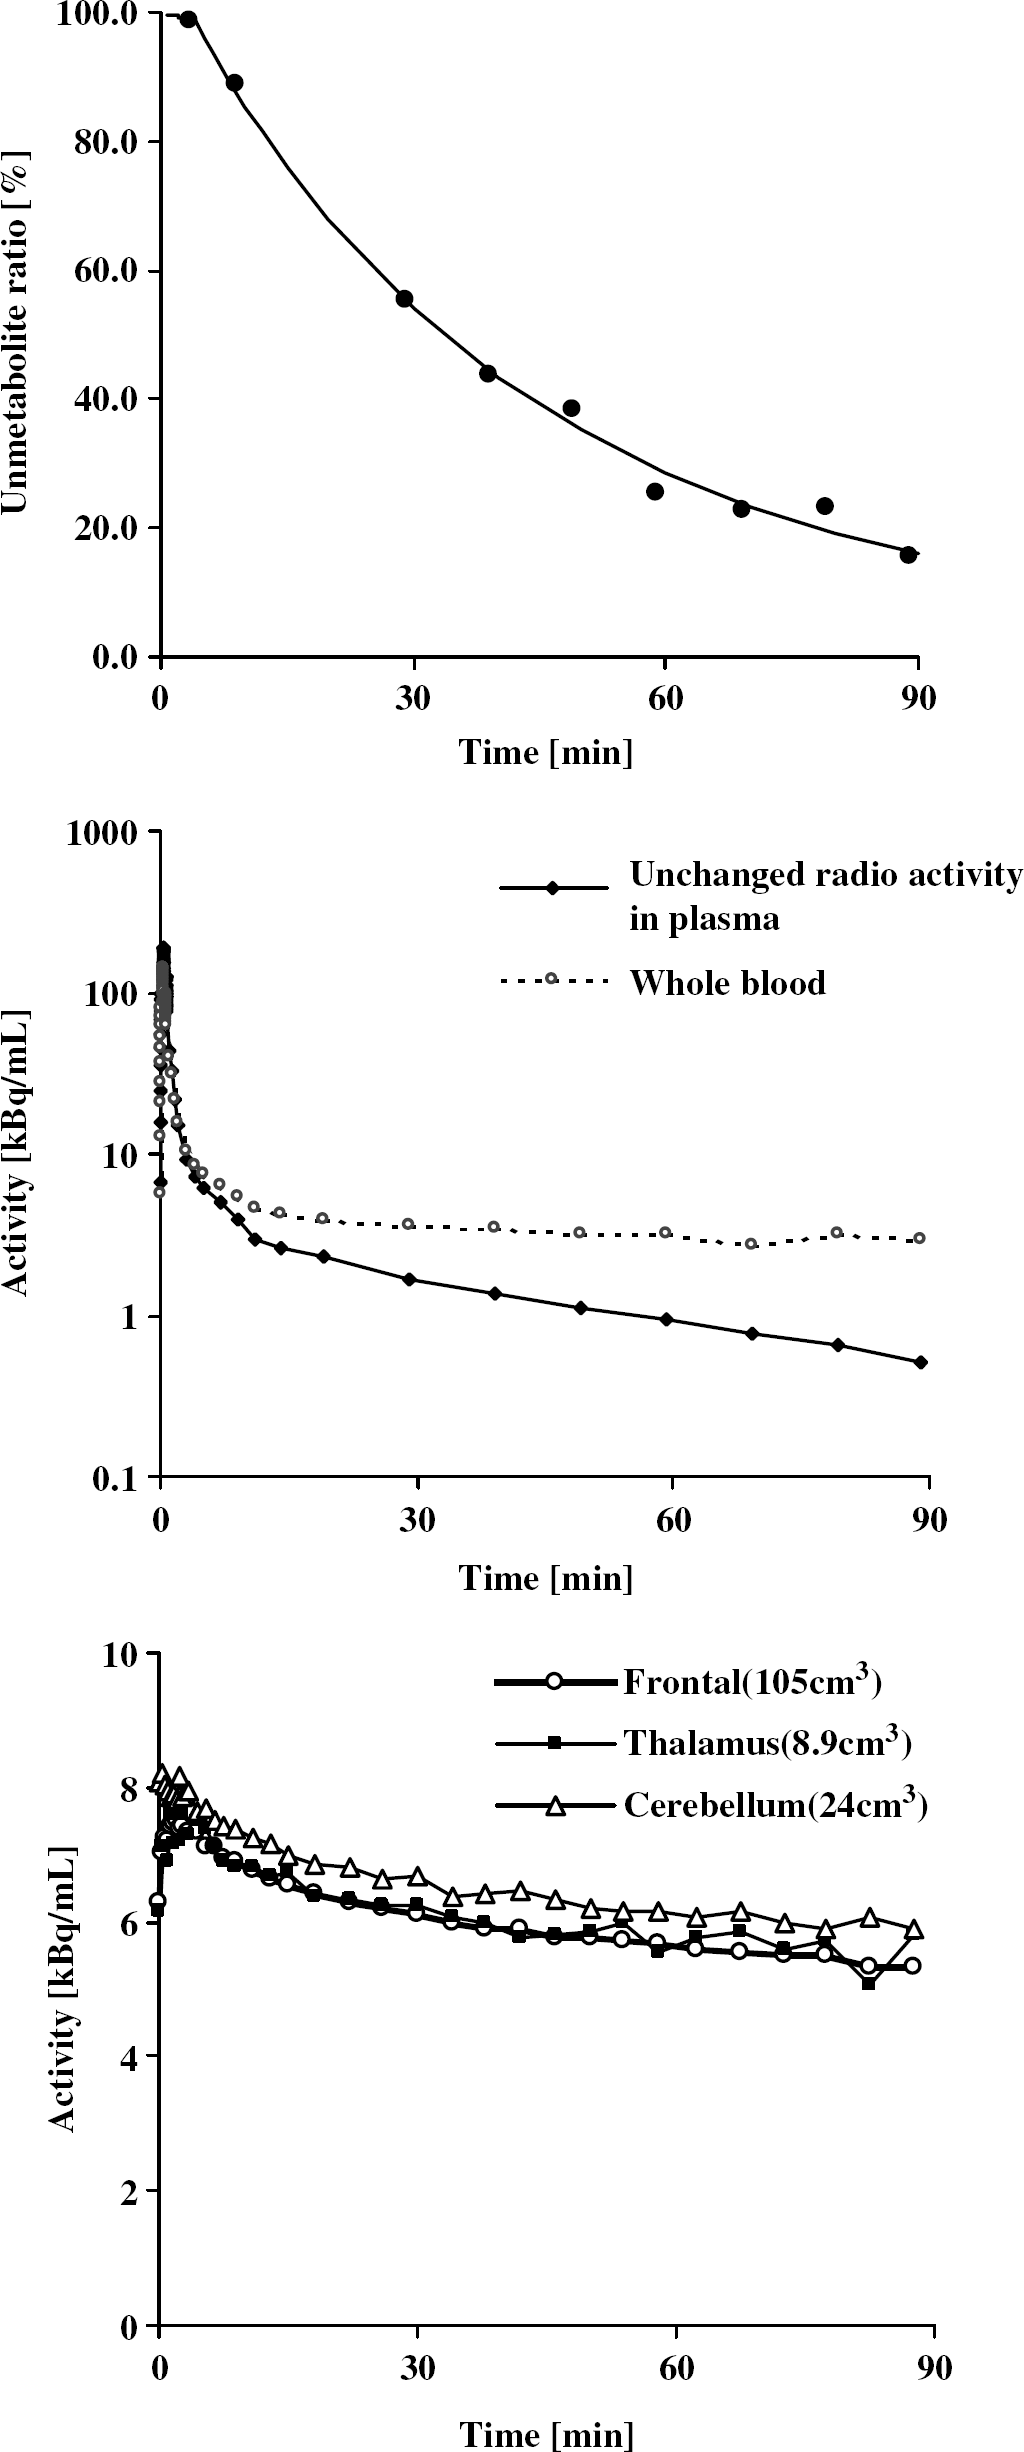
Example of time curve of the percentage of unchanged radioligand in total plasma radioactivity (top), measured TACs of blood, metabolite-corrected plasma (middle), the dorsolateral prefrontal cortex, thalamus, and cerebellum (bottom) using [11C]DAA1106.
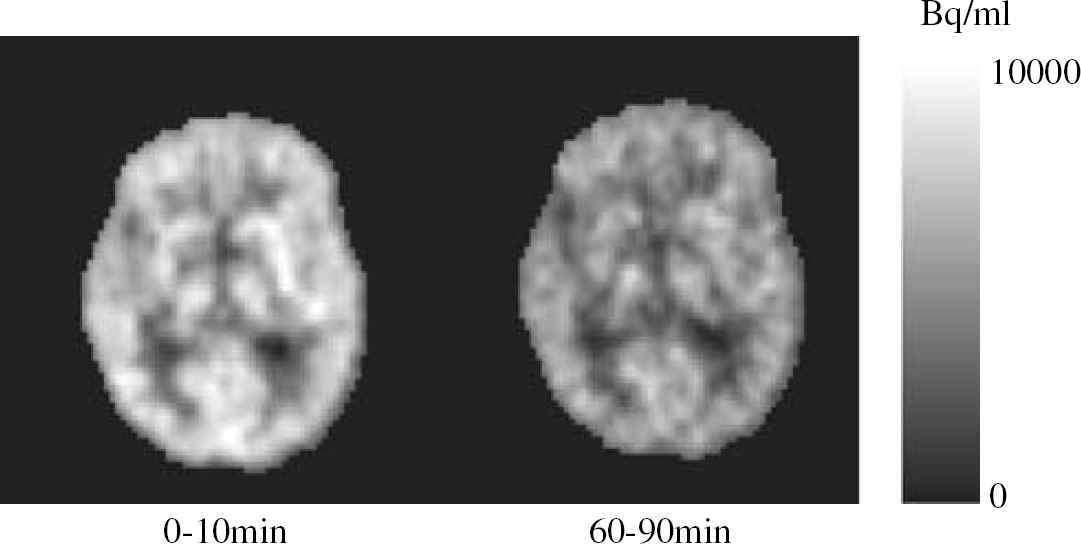
Summation images from 0 to 10 mins (left) and from 60 to 90 mins (right) of [11C]DAA1106.
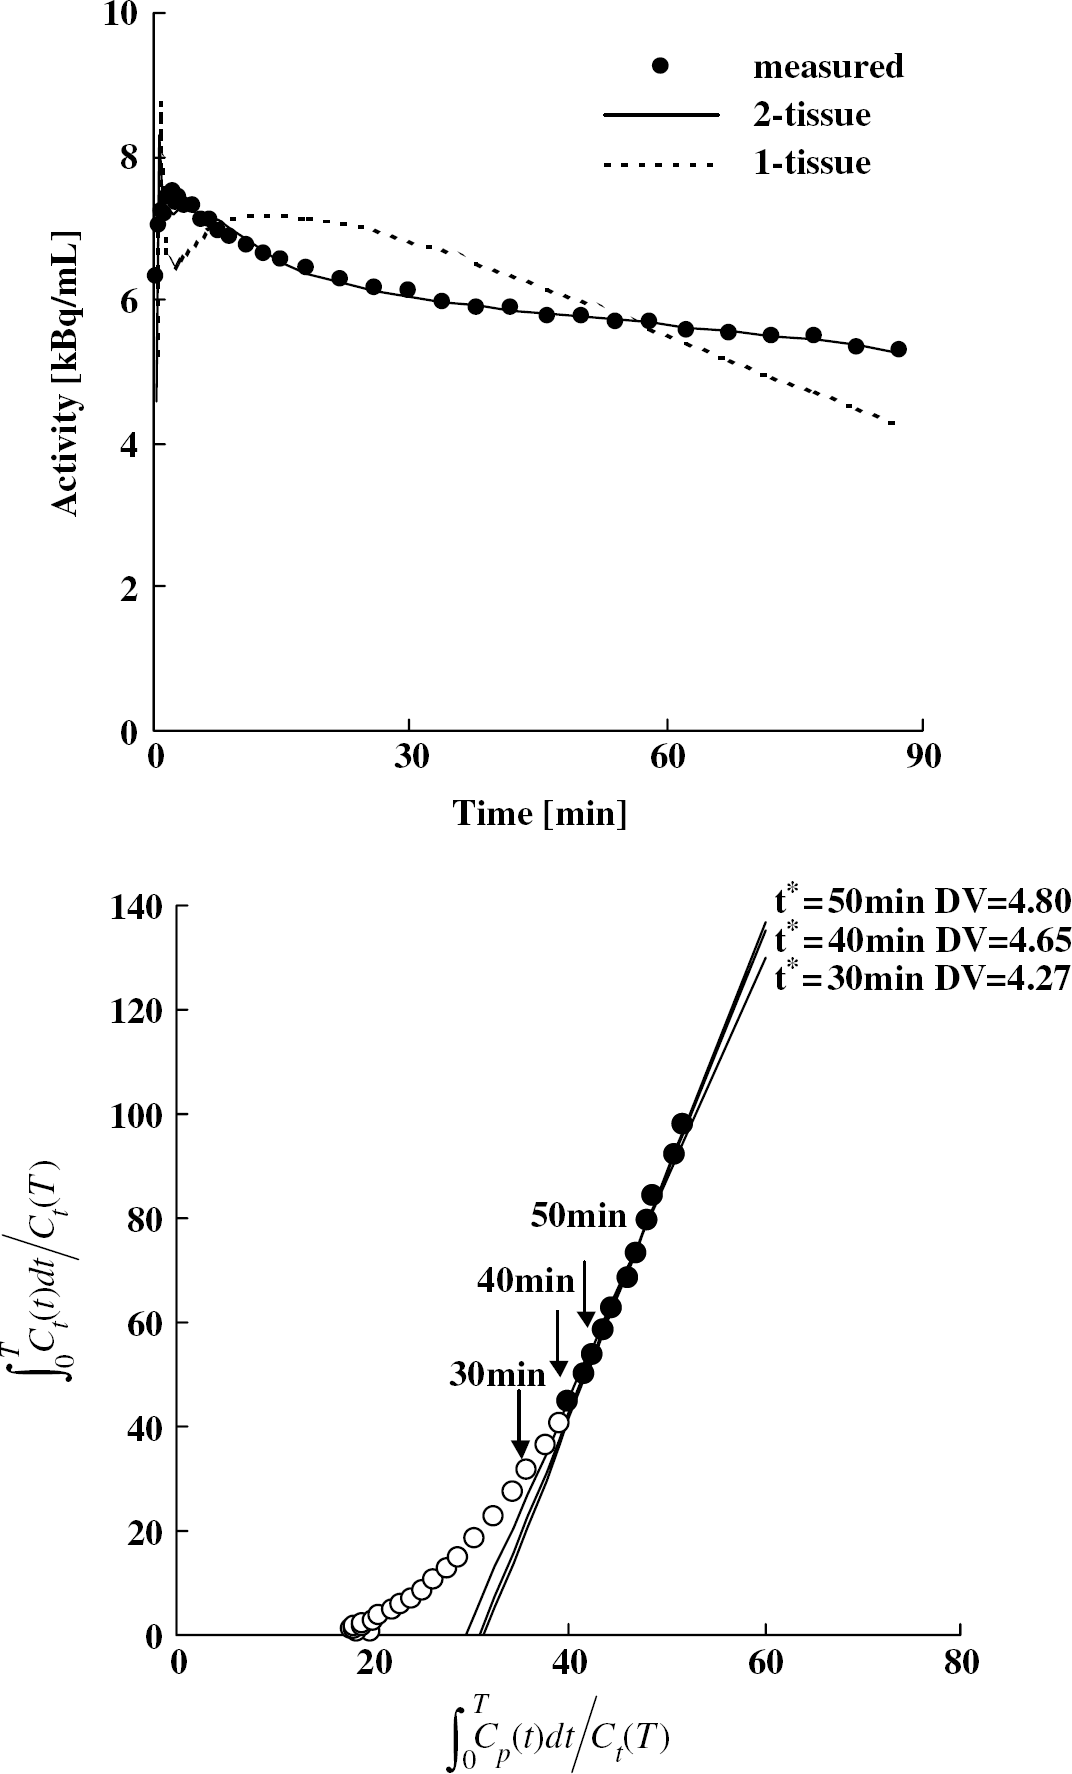
Examples of fitted curves with the one-tissue compartment model (dashed line) and two-tissue compartment model (solid line) (upper) and GA with t* = 30, 40, and 50 mins (lower) for the measured TAC of the dorsolateral prefrontal cortex.
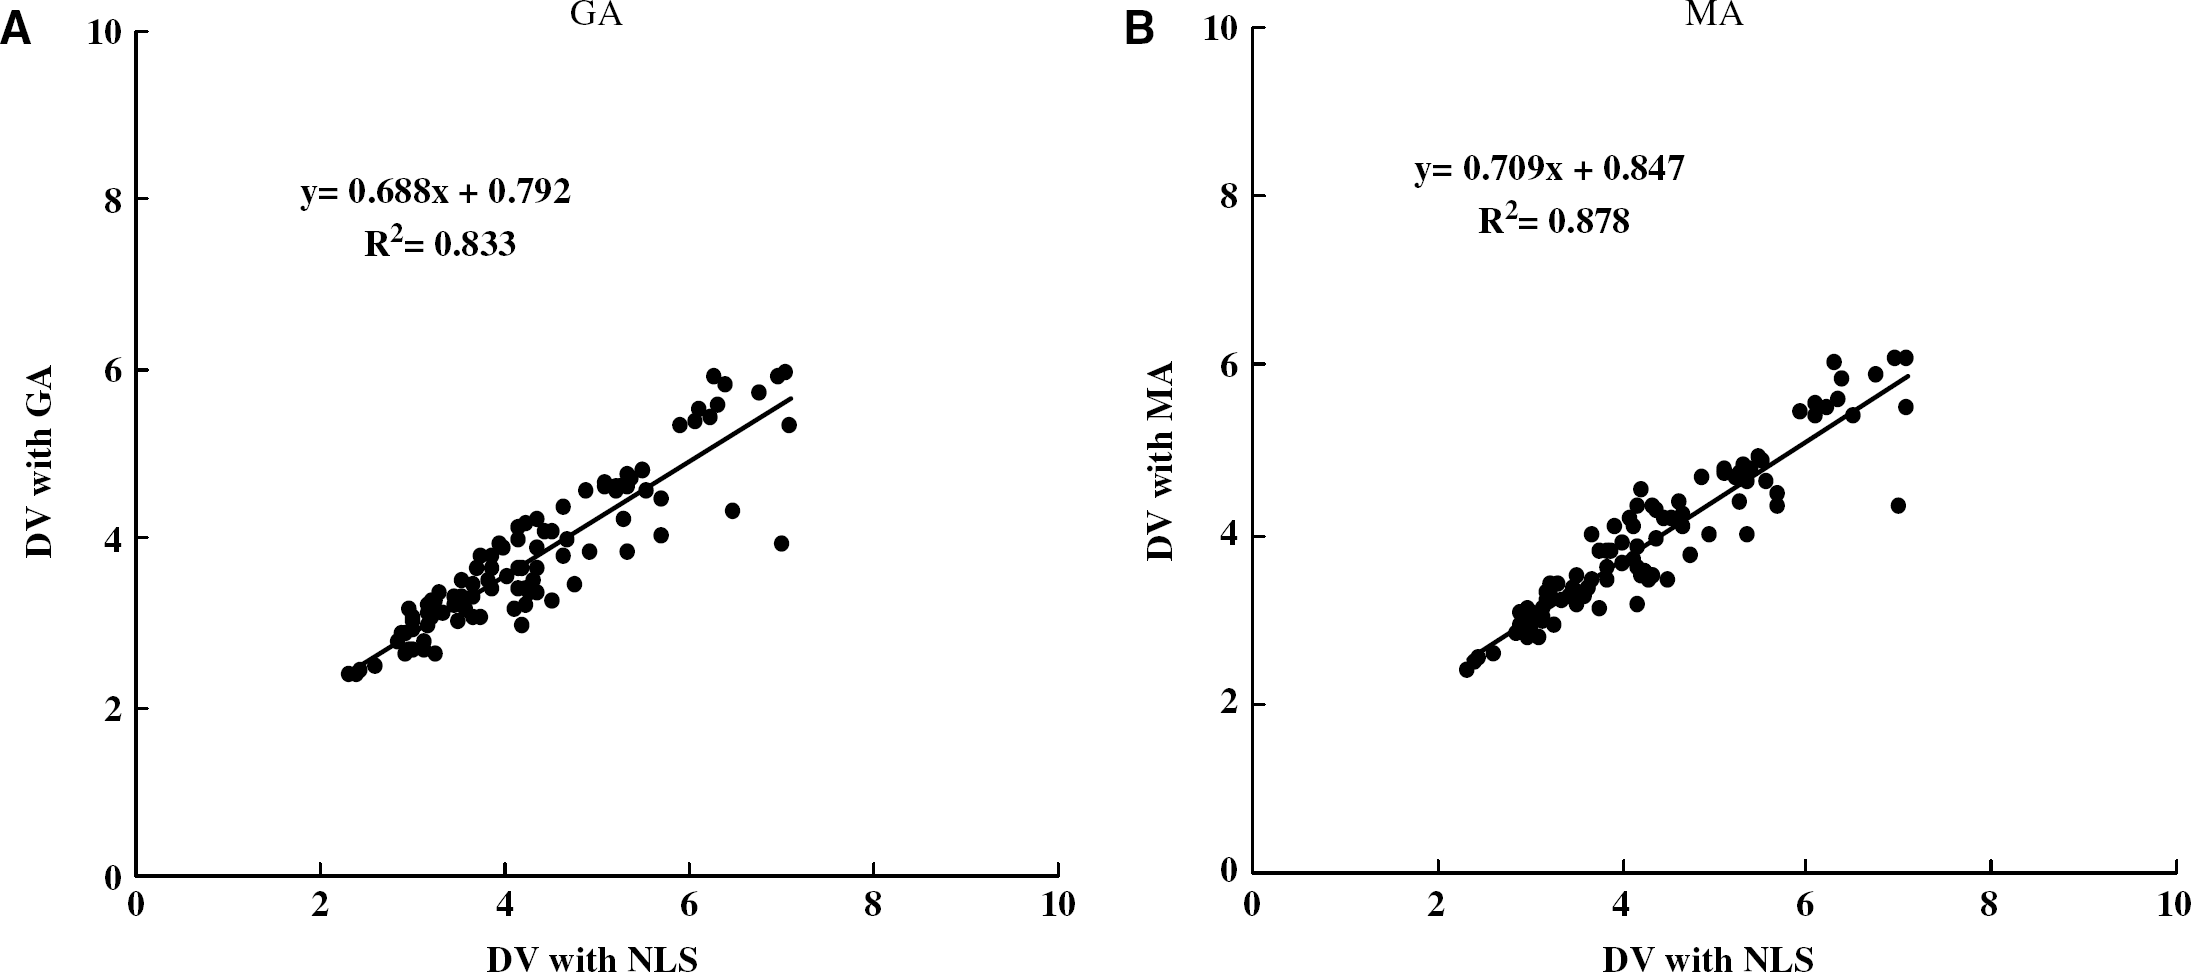
Relationship between DV estimated from the NLS method and that from GA (
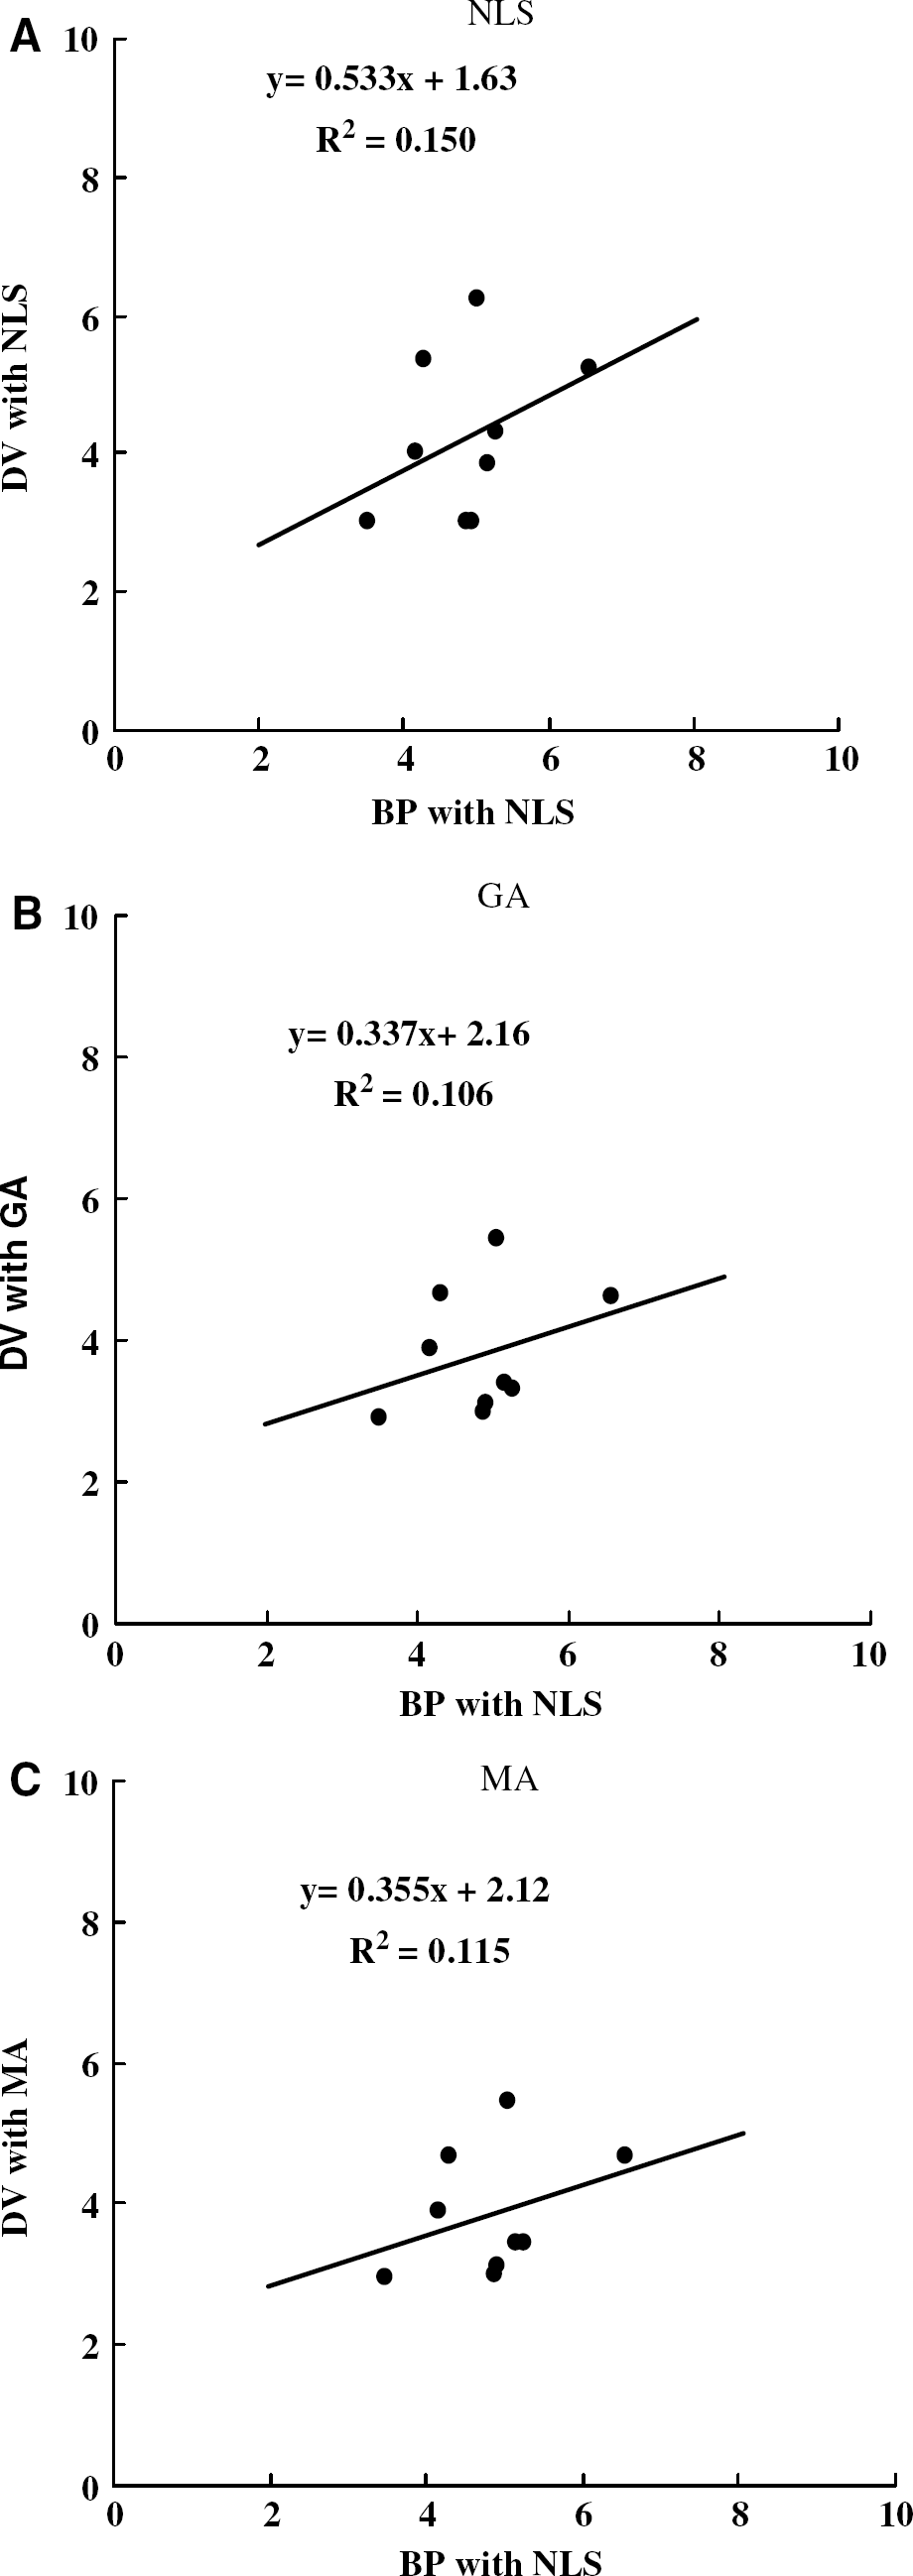
Relationship between BP estimated from the NLS method and DV from the NLS (
Discussion
Optimal Analysis Method for [11C]DAA1106
In this study, several analytical methods for receptor-binding quantification with arterial input function were used for simulated data and human data. In the simulation study, variation of the GA method was smaller than that of the other methods. However, DV was underestimated as noise increased, a bias that becomes a problem when comparing the estimated DV among TACs with different noise levels or different K-values. This bias was caused by the noise in tissue activity, and several methods for reducing the bias in GA were suggested. Logan et al (2001) applied the iterative method called generalized linear least squares developed by Feng (1993, 1996) to generate smoothed TACs, and reported that GA with smoothed TACs reduced the noise-induced bias. Another approach was rearranging the equation of GA to multilinear form, and it was shown that this MA reduced the noise-induced bias for both the one-tissue compartment model (Carson, 1993) and two-tissue compartment model (Ichise et al, 2002). In equation (2), only the integral of Ct(t) is included as a potential noise source in linear regression, and integral of Ct(t) reduces the noise in Ct of each frame. Deducing from the residual error of TAC fitting by NLS, the noise level of human VOI analysis in this study was under 3%. At this noise level, COV of MA is small enough when t* is early. However, COV of MA became larger than that of NLS as t* became late, as shown in Figure 3C. The difference in COV doubled between t* = 30 and 50 mins. For the tracer with early t*, enough data points for linear regression can be obtained after equilibrium, and therefore the MA method is useful for a DV estimation. However, this method is not appropriate for slow kinetics tracers, since enough points for linear regression cannot be obtained after equilibrium (Ichise et al, 2002). The determination of optimal t* for GA or MA is very difficult because selection of earlier t* before equilibrium causes underestimation of DV, while estimates with late t* are greatly affected by noise. Furthermore, equilibrium time t* may be different with regions or subjects if their kinetics are different. In the simulation study of [11C]DAA1106, DV estimates approached the true value when t* was 60 mins in TACs without noise, and this result showed that the equilibrium time t* was not early. Moreover, with 5% noise, the DV estimate by GA method did not approach the true value, whereas that by MA was overestimated. In human [11C]DAA1106 data, DV values estimated by GA and MA with t* = 40 mins were smaller than that by NLS, showing underestimation of GA and MA. These results were consistent with those of simulation, showing that the condition of equilibrium did not exist within 40 mins. Considering the decay of radioactivity, the scan time cannot be made longer than 90 mins, and the frame number of the latter scan cannot be increased because its acquired radioactivity count is small. Therefore, enough data points for reliable linear regression after equilibrium cannot be obtained, and GA and MA are not appropriate for the quantification of [11C]DAA1106.
Another disadvantage of GA and MA is that the estimated parameter with these methods is only DV. Distribution volume is a complex parameter of K1/k2 and k3/k4. In general, k3/k4 and DV are considered to be parallel to each other on the assumption that there are small variations of K1/k2 among regions or individuals. However, in the human study of [11C]DAA1106, the value of K1/k2 was different among individuals. The estimated value of K1/k2 is less affected by the statistical noise in tissue activity than that of DV and BP, as shown in the simulation study (Figure 3), and the large variation of K1/k2 across subjects was observed even in regions with large areas, such as the frontal, temporal, parietal, and occipital cortices (Table 1). The variation in K1/k2 across regions was smaller than that across subjects. Therefore, the difference of K1/k2 among individuals was not due to the statistical noise in tissue activity. This difference may be due to errors in plasma input functions caused by measurement of plasma samples, metabolite correction, delay correction between plasma and brain, and due to biologic factors such as variation in plasma protein binding. In normal volunteers, COV of K1/k2 among individuals was larger than that of k3/k4, indicating that the individual variation of DV is mainly caused by the individual variation of K1/k2 rather than k3/k4. Moreover, when the estimation is performed in a small region, there is some possibility that K1 and DV are underestimated owing to the partial volume effect. For that reason, we concluded that the NLS method is the most appropriate for the assessment of BP in [11C]DAA1106.
Reliability of Estimated Parameters with Nonlinear Least-Squares Method
The advantage of the NLS method is that every parameter can be estimated, and the disadvantage is that COV is large (Figure 3A). To improve the reliability of the parameter estimates, parameter coupling of K1/k2 is often used. However, in the [11C]DAA1106 study, K1/k2 cannot be constrained, since the reference region cannot be determined. With many tracers, the unconstrained NLS fit with two-tissue compartment model shows K1/k2 changing with DV, and k3/k4 may have no biologic significance occasionally. Meanwhile, in the [11C]DAA1106 study, the range of DV was small, so parameters of each TAC converged on the close value, and k3/k4 was estimated reasonably. However, the COV of estimated k3/k4 was large. Therefore, the noise included in TAC should be decreased as much as possible.
In the VOI analysis of human data, the noise level depends on the VOI size, that is, the number of voxels in a VOI (Millet et al, 1996; Ikoma et al, 1998). Since the noise level varies according to camera sensitivity, administration dose, kinetic parameters, and uniformity of VOI, it is difficult to determine the optimal number of voxels for the most reliable estimation in each scan. To decrease the error of estimated BP, a larger VOI should be determined; however, too large a VOI has the effect of heterogeneity. The number of voxels in large regions, such as the frontal, temporal, and parietal cortices, is over 1500, but that in the thalamus is approximately 500. So, these smaller regions have larger COV than the cerebral cortex. The permissible range of parameter estimation error depends on the difference of BP among the groups to be compared.
Reliability of the parameter estimates also varied with the k-value (Figure 5). Especially, COV of BP becomes large when the k3 and k4 values are small. In addition, the noise in TAC of late times affects k3 and k4 estimates. In normal volunteers, the mean value of k3 is 0.052, range from 0.032 to 0.083, k4 is 0.011, range from 0.0042 to 0.018, BP is 4.9, range from 3.1 to 7.6. In this range of k4, the estimated BP may include an error in the small VOI. In the future, [11C]DAA1106 will be applied for various diseases, and in a case with low k3 or k4, interpretation of the estimated BP would require some caution. The density of PBR was reported to increase in microglia activated by brain damages (Myers et al, 1991; Stephenson et al, 1995; Banati et al, 1997; Kuhlmann and Guilarte, 2000). Cagnin et al (2001) reported that the BP of Alzheimer's disease patients in the [11C]PK11195 study was approximately twice the BP of controls in the inferior and middle temporal gyri, the inferior parietal lobules, and so on. Reflecting the increase of the density of PBR, the BP value, especially the k3 value, is expected to be larger than that of normal volunteers when [11C]DAA1106 is applied to patients with brain damages. However, in the simulation study, the COV of estimated BP does not increase seriously even if the value of k3 became twice as large as the k3 value of normal volunteers (Figure 5). Therefore, NLS with two-tissue compartment model will be appropriate for the quantification of PBR in case of a neuronal damage or loss in several neurodegenerative and psychiatric disorders.
Binding Potential of Human Data
Estimated BP values for normal volunteers are listed in Table 1. Although there was no significant difference among regions, the thalamus had the highest BP value. This observation is consistent with the BP value reported with [11C]PK11195 (Groom et al, 1995; Cagnin et al, 2001; Gerhard et al, 2003). In [11C]PK11195 PET studies, the semiquantification of specific binding was performed using late images, in which the activity of the region of interest was normalized to that of the cerebellum (Groom et al, 1995), cortical gray matter (Debruyne et al, 2003), or the whole brain (Debruyne et al, 2002). However, with the semiquantitative approach, the choice of the normalization area affects the sensitivity to the detection of changes. Therefore, arterial input function and two-tissue compartment model analysis is necessary for the quantification of [11C]DAA1106 binding. Because [11C]DAA1106 shows a higher uptake than [11C]PK11195 (Maeda et al, 2004), the application of [11C]DAA1106 can be expected to provide useful information.
Conclusion
We have evaluated three methods for the quantification of [11C]DAA1106 binding. In the simulation study, the variation of DV estimated from GA was smaller than those from the other methods. However, in the GA method, DV was underestimated even at a low noise level, and this bias became large as noise increased. In MA, although DV was underestimated, the bias did not change with the noise level. However, the variation of estimated DV was larger than in GA, and reliability and underestimation were strongly affected by the start time of linear regression. In NLS, the variations of estimated DV and BP were large. But these parameters were not underestimated, and were estimated reliably at a low noise level. In the human study, there was correlation between DV estimated from NLS and that from GA or MA. However, BP estimated from NLS did not correlate with DV estimated from NLS, GA, or MA. In the [11C]DAA1106 study, the reference region without specific binding cannot be determined, equilibrium time is not fast, and the K1/k2 value differs among individuals. For these reasons, we concluded that NLS is the most reliable method for the quantitative analysis of [11C]DAA1106. It should be noted that the NLS method is affected by noise and this effect changed according to VOI size and k-values. When the VOI size is small or the k3 and k4 values are small, the error of the estimated BP was large, and interpretation of BP should be attempted with caution.
Footnotes
Acknowledgements
We are grateful to Taisho Pharmaceutical Co., Ltd for donating the samples (DAA1106 and precursor) and for helpful suggestions.