
Abstract
Perivascular fibroblasts (PVFs) are recognized for their pro-fibrotic role in many central nervous system disorders. Like mural cells, PVFs surround blood vessels and express Pdgfrβ. However, these shared attributes hinder the ability to distinguish PVFs from mural cells. We used in vivo two-photon imaging and transgenic mice with PVF-targeting promoters (Col1a1 or Col1a2) to compare the structure and distribution of PVFs and mural cells in cerebral cortex of healthy, adult mice. We show that PVFs localize to all cortical penetrating arterioles and their offshoots (arteriole-capillary transition zone), as well as the main trunk of only larger ascending venules. However, the capillary zone is devoid of PVF coverage. PVFs display short-range mobility along the vessel wall and exhibit distinct structural features (flattened somata and thin ruffled processes) not seen with smooth muscle cells or pericytes. These findings clarify that PVFs and mural cells are distinct cell types coexisting in a similar perivascular niche.
Introduction
The microvasculature of the central nervous system (CNS) is surrounded by mural cells and perivascular fibroblasts (PVFs). The physiological roles of these perivascular cell types and their distinct functions across microvascular zones continue to be refined with new advances in genetics and imaging.1,2 Mural cells include vascular smooth muscle cells (SMCs) and different forms of pericytes. SMCs cover surface and penetrating arterioles, and through contraction and relaxation of their circumferential cellular processes, dynamically regulate blood flow. 3 Pericytes reside on downstream arteriole-capillary transition (ACT) zone and capillaries, and exhibit protruding cell bodies and longer processes with varying degrees of morphological complexity. Ensheathing pericytes on ACT zones dynamically regulate blood flow similar to SMCs, 4 while capillary pericytes are involved in slower modulation of capillary tone5–7 and blood-brain barrier function.8–11 Unlike mural cells, which are embedded in the vascular basement membrane, 1 PVFs reside between the mural cell layer and astrocytic endfeet, which corresponds to the Virchow-Robin space on larger vessel.12,13 Recent transcriptomic analyses demonstrate that PVFs express genes encoding structural components, modifiers and receptors for the extracellular matrix (ECM).12,14 Further, studies in zebrafish have demonstrated that PVFs establish the ECM along developing blood vessels. 2
PVFs may be a continuation of the pial fibroblast layer of the meninges along blood vessels diving into the cortical parenchyma.13,15 As such, PVFs appear to be most abundant around large diameter arterioles and venules.12,13,16 However, their precise organization along the microvascular tree remains unclear. PVFs also express Pdgfrβ and CD13, both of which are commonly used as markers to identify pericytes but are broadly expressed by mural cells. 16 This difficulty in differentiating PVFs from mural cells can obscure the distinct physiological roles of these cell types during vascular health and pathology. For example, prior studies have reported that PVFs and meningeal fibroblasts, not mural cells, create the fibrotic scar following CNS injury.14–18 However, other reports have implicated “type-A pericytes” in this pro-fibrotic response19,20 demonstrating the importance of a side-by-side comparison of PVFs to mural cells. Further, since some markers of PVFs are secreted ECM components (collagens), it can be difficult to differentiate PVFs from their secreted proteins by immunostaining. Detailed studies of mural cells in relation to their vascular topology, morphology and dynamics has helped to reveal their unique functions,4,5,21,22 and now similar analyses are required before PVFs can be carefully studied.
In vivo two-photon imaging is an essential approach in the study of neurovascular physiology and pathophysiology. However, it relies on well-characterized transgenic mouse lines to label defined cell types of the neurovascular unit in the healthy brain prior to adding the complexity of tissue reactions to disease and injury. Considering how little is known about PVF distribution and appearance in vivo, we used mouse lines with enriched genetic targeting for CNS fibroblasts (Col1a1-GFP and Col1a2-CreERT2) to characterize PVFs in the widely studied vascular architecture of the mouse cerebral cortex. In vivo topological analysis revealed that PVFs occupied cortical penetrating arterioles, ACT zones and large ascending venules across various CNS regions, but were absent in capillaries occupied by capillary pericytes. We further demonstrate that PVFs are morphologically distinct from mural cells, and exhibit short-range mobility on the order of days, in contrast to the stability of mural cells of the adult microvasculature.
Methods
Animals
Mice were housed in specific-pathogen-free facilities approved by AALAC and were handled in accordance with protocols approved by the Seattle Children’s Research Institute IACUC committee. All data were analyzed and reported according to ARRIVE 2.0 guidelines. 23
To generate PVF-mural cell reporter mice (Col1a1-GFP; PdgfrβCre-tdTomato), female Col1a1-GFP/+ mice (C57BL/6 background) were bred with male PdgfrbCre/+; Ai14fl/fl mice as shown in Figure 1(a). Pdgfrβ-Cre mice (FVB and C57BL/6 × 129 background) were a generous gift from Prof. Volkhard Lindner of the Maine Medical Center Research Institute and the Rosa-lsl-tdTomato reporter mice, Ai14-flox, were obtained from Jackson Labs (#007914; C57BL/6 background). Col1a2-CreER mice (Jackson Lab; #029567; C57BL/6 background) were also crossed with the Ai14-flox and mT/mG-flox lines (#007576; C57BL/6 background) to create tamoxifen inducible PVF-reporter mice. Sparse labeling of PVFs was achieved with two consecutive days of tamoxifen treatment (80 mg/kg i.p. dissolved in corn oil) beginning on day 7 post cranial window placement. Five consecutive days of tamoxifen treatment (80 mg/kg i.p. dissolved in corn oil) beginning on day 7 post window placement was also tested in PVF-reporter mice. Mice throughout all experiments were within 3–7 months of age and both males and females were used.
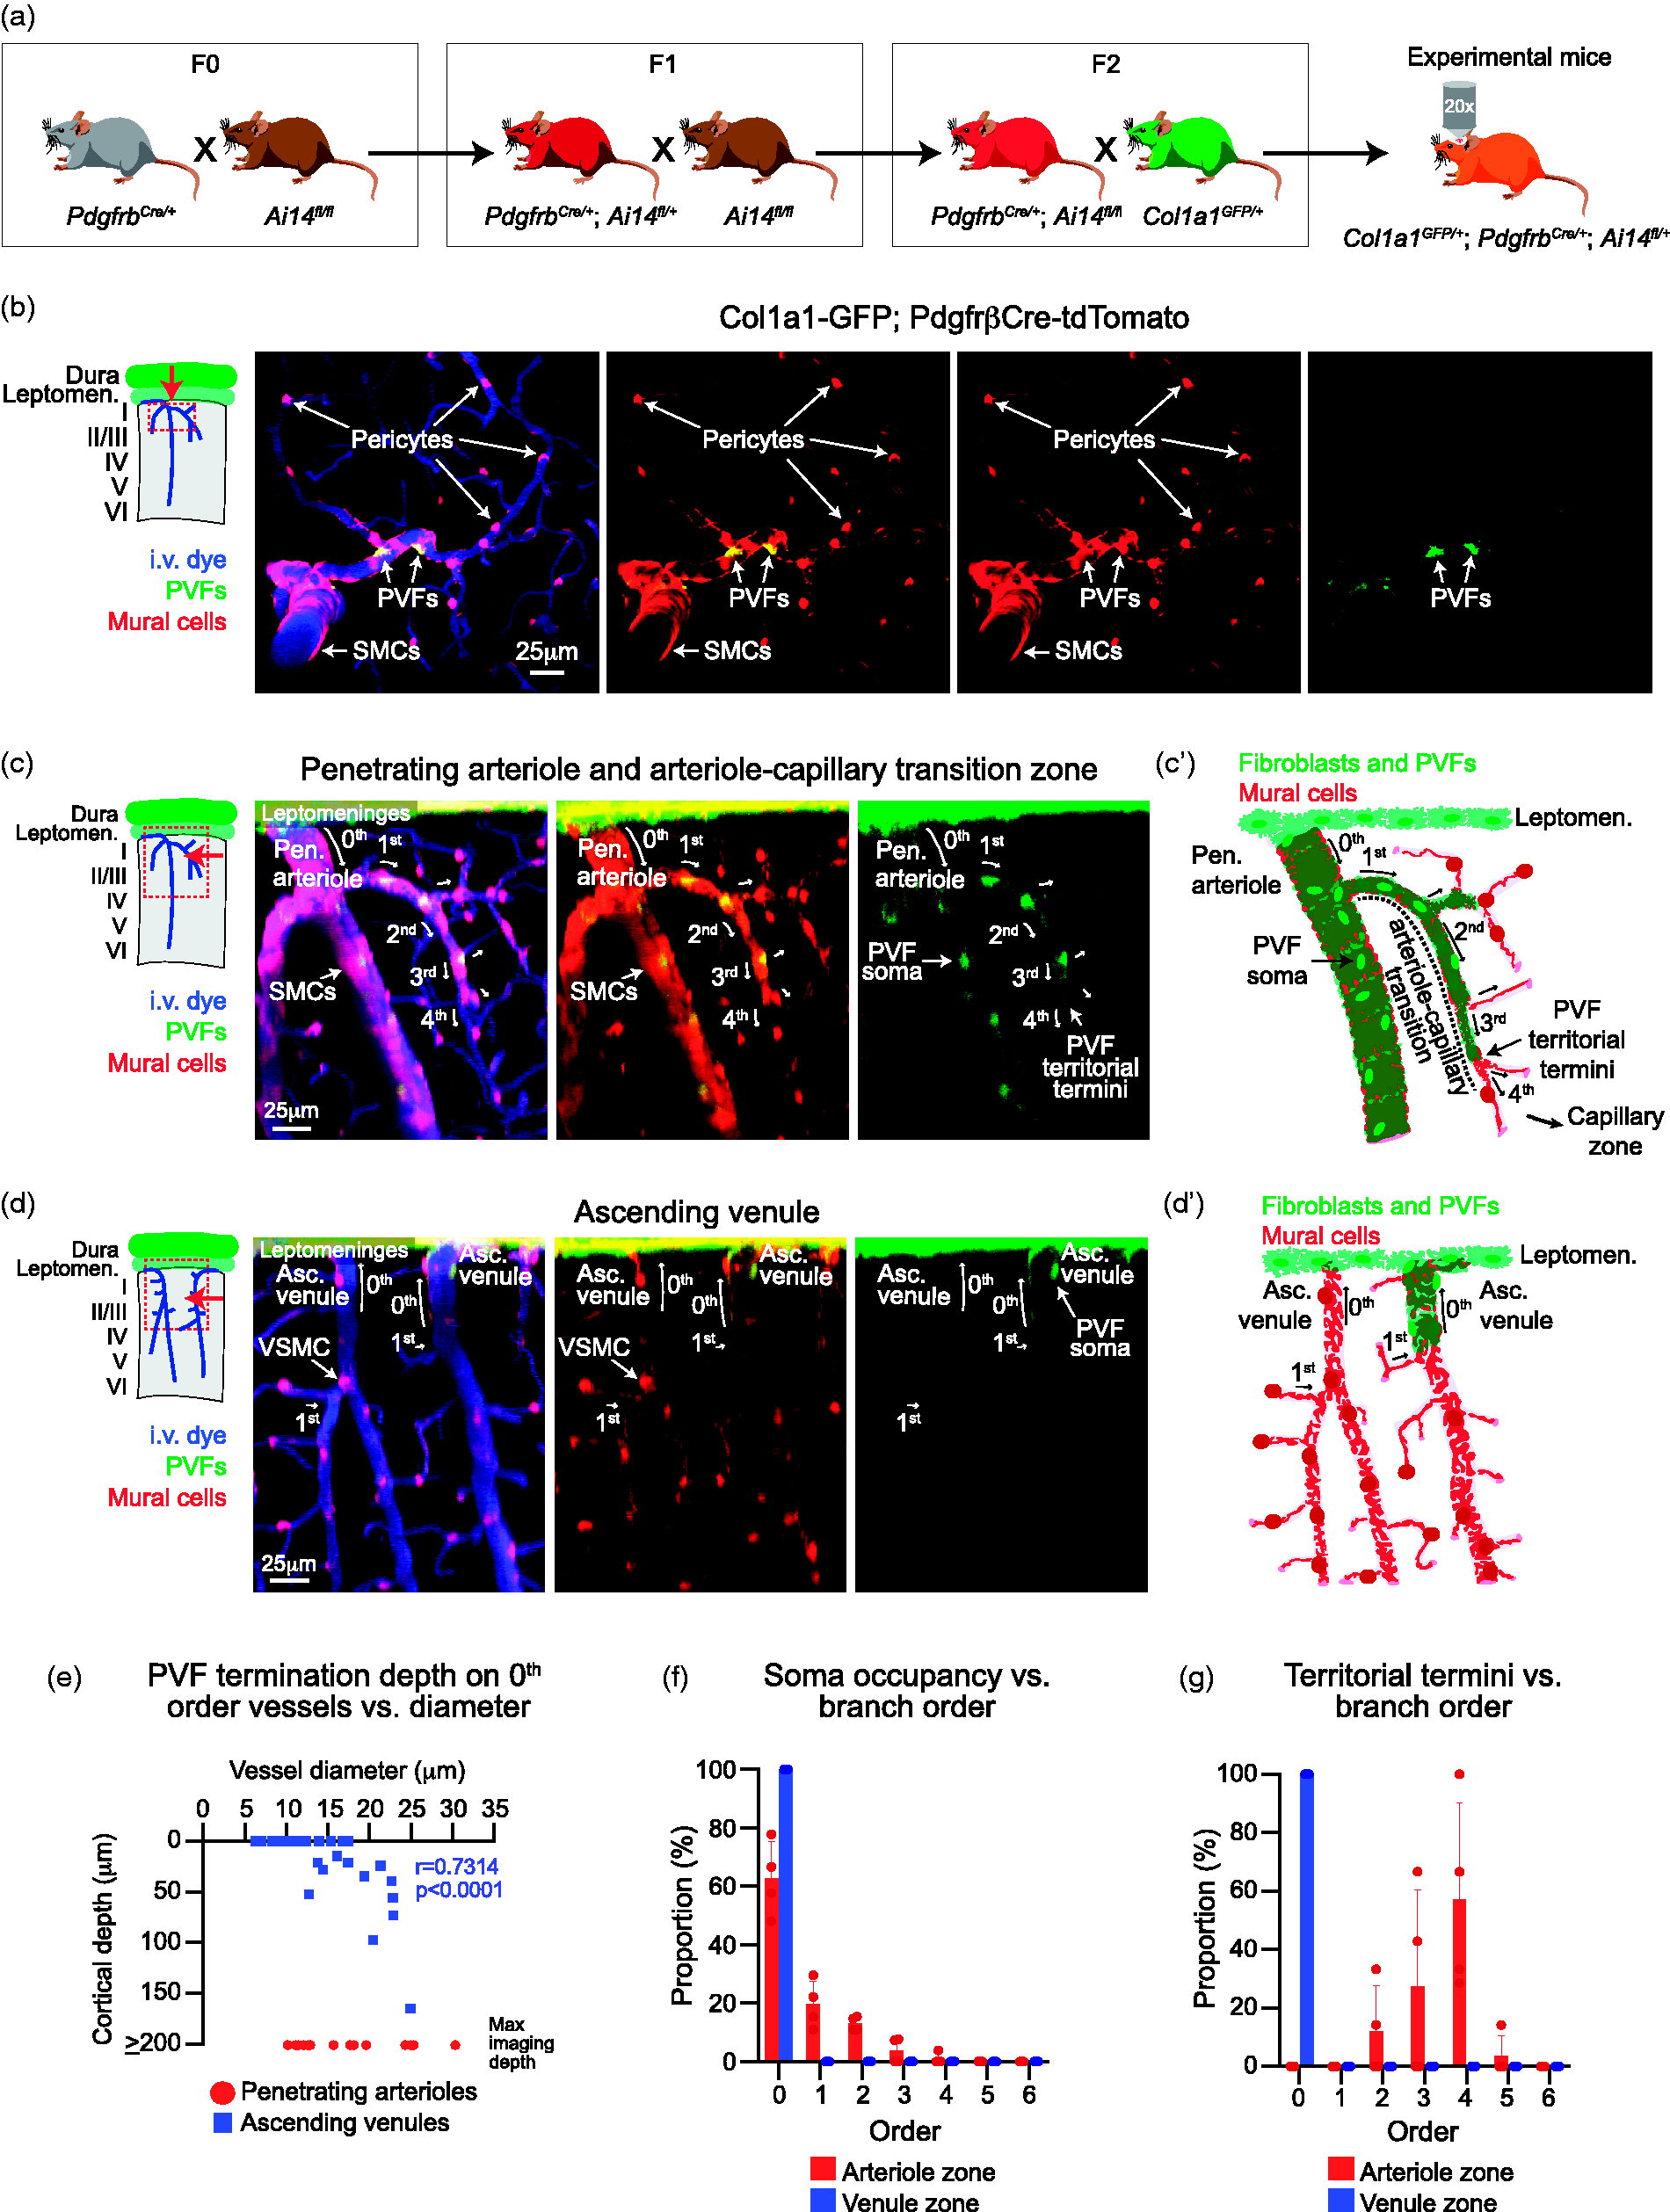
Col1a1-expressing perivascular fibroblasts coexist with mural cells on penetrating arterioles, arteriole-capillary transition zones, and large ascending venules. (a) Schematic demonstrating how PVF-mural cell reporter mice were generated (PdgfrbCre/+; Ai14fl/+; Col1a1GFP/+). We first crossed PdgfrbCre/+ with Ai14fl/fl mice (F0). We then took resulting PdgfrbCre/+; Ai14fl/+ mice and crossed themContinued.with Ai14fl/fl mice (F1) to create PdgfrbCre/+; Ai14fl/fl mice. Finally, the resulting PdgfrbCre/+; Ai14fl/fl mice were crossed with Col1a1GFP/+ (F2) mice to generate PdgfrbCre/+; Ai14fl/+; Col1a1GFP/+2 mice. (b) Top down, maximum projected image of the cortical vasculature from in vivo two-photon imaging of Col1a1-GFP; PdgfrβCre-tdTomato mice showing that tdTomato+ mural cells (red) and tdTomato+/GFP+ perivascular fibroblasts (PVFs; red and green) coexist along the vasculature. Blood vessels labeled with i.v. administration of Alexa-680 (2 MDa) (blue). (c) Side projection of in vivo image stack with (c’) schematic demonstrating the topological organization of PVFs (green) along the penetrating arteriole (0th order) as identified by smooth muscle cells (SMCs; red) and arteriole-capillary transition zone (1st-4th branch order). PVF somata and termination of territory end before the capillary zone (≥5th order). (d) Side projection of in vivo image stack with (d’) schematic demonstrating the topological organization of PVFs (green) along the ascending venules (0th order) as identified by VSMCs (red) and 1st order post-capillary connections. PVF somata only occupy the main trunk (0th order) of some ascending venules. (e) Scatter plot of penetrating arteriole (red) and ascending venule (blue) diameters versus PVF termination depth along 0th order vessels. Spearman’s rank correlation shows a positive correlation along ascending venules (****p < 0.0001, r = 0.7314, n = 32 ascending venules). PVFs were observed up to maximum imaging depths along penetrating arterioles regardless of vessel diameter (n = 15 penetrating arterioles). Data was compiled from 4 mural cell-PVF and PVF reporter (Col1a1-GFP) mice. (f) Histogram depicting the proportion of PVF soma occupancy from 0th to 6th branch order along the arteriole (red) or venule (blue) zones. Each point represents the average proportion found in each mouse (n = 4 mice). (g) Histogram depicting the proportion of PVF territorial termination from 0th to 6th branch order along the arteriole (red) or venule (blue) zones. Each point represents the average proportion found in each mouse (n = 4 mice).
Cranial window surgery and in vivo two-photon imaging
We created chronic, skull-removed cranial windows over the somatosensory cortex for in vivo imaging, as previously described. 5 Briefly, a 3 mm in diameter craniotomy was carefully performed with frequently soaking of artifical cerebrospinal fluid to separate the dura prior to skull removal. After placement and sealing of a 3 mm/4 mm coverslip plug 7 , the remaining area surrounding the craniotomy with dental cement. Mice were allowed to rest and recover for at least 3 weeks prior to imaging. To label the vasculature in PVF-mural cell reporter mice, 25 µL of 5% (w/v in saline) custom conjugated Alexa Fluor 680-dextran 24 (Alexa Fluor 680; Life Technologies; A20008 conjugated to 2 Megadalton (MDa) Dextran; Fisher Scientific; NC1275021) was injected through the retro-orbital vein under deep isoflurane anesthesia (2% MAC in medical air). Similarly, the vasculature in PdgfrβCre-tdTomato and Col1a2CreER-tdTomato mice was visualized with 25 µL of 5% (w/v in saline) 70 kDa FITC-dextran (Sigma-Aldrich; 46945). During imaging, isoflurane was maintained ∼1.5% MAC in medical-grade air. The cortical microvasculature was imaged with a Bruker Investigator coupled to a Spectra-Physics Insight X3. Imaging of Col1a1-GFP; PdgfrβCre-tdTomato and Col1a2CreER-tdTomato mice was performed with 975 nm excitation wavelength and 920 nm for Col1a1-GFP mice. Collection of green, red and far-red fluorescence emission of PVF-mural cell reporter mice was achieved with 525/70, 595/50, and 660/40 nm emission bandpass filters respectively, and detected with GaAsP photomultiplier tubes. A 20× (1.0 NA) water-immersion objective (Olympus; XLUMPLFLN) was used to collect high-resolution image z-stacks at 1.0 µm increments. Collection of most images began at the pial surface as identified by pial vessels with penetrating vessels into the cortex. In a subset of image collections, the dural layer was included and recognized by the non-penetrating dural vessels, allowing us to demarcate the meningeal layers in the fibroblast reporter animals.
Topological analysis of PVFs along the cortical vasculature
Blood flow directionality and vascular structure (in Col1a1-GFP mice) and/or mural cell morphology (in Col1a1-GFP; PdgfrβCre-tdTomato mice) were used to identify penetrating arterioles and ascending venules during in vivo two-photon imaging experiments. In total, 21 regions of complete vascular networks (arteriole to capillary zone) and 32 ascending venules were examined over 4 mice. Branching order off of penetrating arterioles was assigned as described previously. 22 Ascending venules were denoted at 0th order with their respective post-capillary offshoots designated as 1st order. The number of Col1a1-GFP+ PVF soma and termination points was documented along branch order. Summation of PVF soma and termination points at their respective branch point was divided by the total number of PVFs or termination points respectively for each arteriolar network. In all, 80 PVFs and 21 termination points were observed within the arteriolar network and 19 PVFs along ascending venules. ImageJ software was used to perform this analysis.
Penetrating arteriole and ascending venule diameter analysis
Diameter analysis of penetrating arterioles and ascending venules in PVF and PVF-mural reporter mice was performed using the Vasometrics ImageJ plug-in. 25 In brief, maximum projected images were created of penetrating and ascending vessels that included the vessel just under the surface of the brain to their first branch point. The line segment tool was used to draw a through-line along the center of the vessel segment wherein multiple evenly spaced cross-sectional lines were created. The fluorescent intensity profile was created at each cross-section enabling a full-width half max lumen diameter to be calculated along the entire vessel segment. In a few cases, measurement of the penetrating vessel was measured at the pial surface due to the perpendicular nature of certain vessels. Analysis was performed on 15 penetrating arterioles and 32 ascending venules.
Analysis of perivascular soma roundness
Somata roundness was analyzed using the ImageJ Shape Descriptors measurement tool. Manual measurements outlining perivascular cells were made from maximum projected two-photon images obtained from Col1a2CreER-tdTomato and PdgfrβCre-tdTomato mice as depicted in Supplementary Figure 4(e). Analysis was performed on 122 perivascular cells along the ACT zone from 8 PdgfrβCre-tdTomato mice and 77 PVFs on penetrating arterioles, ACT zones, and ascending venules from 4 Col1a2CreER-tdTomato mice. To generate a histogram, all data was binned at 0.2 increments and distributed across a scale of roundness where 1 is considered a perfect circle and 0 is completely flat.
Analysis of PVF and ensheathing pericyte dynamics. Dynamics of PVF and ensheathing pericyte somata was performed on in vivo two-photon imaging stacks from Col1a2CreER-tdTomato and PdgfrβCre-tdTomato mice respectively. Distance (d0) from the center of individual PVF or ensheathing pericyte soma was measured manually to the nearest vascular branch point in a 2D maximum projected image using the line selection tool in ImageJ. This value and the respective z-distance (z0) was then used to calculate the true physical, Euclidean distance at Day 0 (D0) using the equation
Immunohistochemistry and confocal imaging. Mice were deeply anesthetized with euthasol and trans-cardial perfusions were performed with PBS followed by 4% paraformaldehyde. Brains and spinal cord were dissected, cryoprotected in 30% sucrose with 0.001% sodium azide for 1-2 days, frozen in OCT and cryosectioned using a Leica cryostat. To enhance GFP detection, tissue sections (100 µm) from Col1a1GFP; PdgfrβCre-tdTomato and Col1a2CreER-mGFP mice were stained with rabbit anti-GFP antibody conjugated with Alexa Fluor 488 (1:100; ThermoFisher A-21311) and for 48 hours at 4 °C followed by 15 minutes of DAPI staining (1:5000; ThermoFisher). Retina whole mounts were also incubated with rabbit anti-GFP antibody conjugated with Alexa Fluor 488 for 4 days at 4 °C followed by 15 minutes of DAPI staining. Col1a2CreER-tdTomato brain sections (50 µm) were stained with rabbit anti-Pdgfrα (1:100; Cell signaling; D1E1E) overnight at 4 °C. Co-staining for Pdgfrα and Pdgfrβ was performed on brains from Ai14flox/+ mice using rabbit anti-Pdgfrα and rat anti-Pdgfrβ (1:200; Novus; APB5) overnight at 4 °C. Following incubation with primary antibodies, sections were incubated with appropriate Alexa Fluor conjugated (1:500; ThermoFisher) for 2 hours at room temp followed by 15 minutes of DAPI staining. All antibody staining was performed in a solution of 2% TritonX-100, 10% goat serum and 0.1% sodium azide in PBS. Tissue sections were washed 3 times for 5 minutes in PBS after each antibody incubation. Following staining, tissue was mounted onto slides with Fluoromount-G (ThermoFisher; 00-4958-02). Immunofluorescent images were captured using a Leica SP5 or Zeiss 710 LSM confocal microscopes.
Analysis of Col1a2CreER activity in PVFs and SMCs. Immunofluorescent confocal images from Col1a2CreER-tdTomato treated with either 2 or 5 consecutive days of tamoxifen (80 mg/kg) were taken within the cortex of 3 mice from each treatment group. TdTomato-expressing SMCs were identified by their ring-like morphology. TdTomato-expressing PVFs were identified by their flattened, elongated cell soma surrounded by fibrotic lamella. The length of SMCs and PVFs along penetrating arterioles were measured using ImageJ line segment tool. The total length of SMCs and PVFs was determined and divided by the total tdTomato+ vessel length (22 blood vessels in 3 mice treated with 2 days of tamoxifen with average tdTomato+ blood vessel length of 219 µm; 13 blood vessels in 3 mice treated with 5 days of tamoxifen with average tdTomato+ blood vessel length of 408 µm). For the in vivo imaging experiments, tdTomato+ SMCs were also identified by their ring-like morphology.
Statistics. All statistical analyses were performed in Graphpad Prism software (ver. 9). Respective statistical analyses are reported in the figure legends. Normality tests, generally Shapiro-Wilk tests, were performed on necessary data sets prior to statistical tests. Standard deviation is reported in all graphs where necessary.
Results
Perivascular fibroblasts occupy the arteriole, arteriole-capillary transition, and venule zones but not the capillary bed
To study PVFs and mural cells along the cortical vasculature we generated PVF-mural cell reporter mice by first crossing PdgfrbCre/+ with Ai14fl/fl mice (F0). We then crossed PdgfrbCre/+; Ai14fl/+ with Ai14fl/fl mice (F1) to create PdgfrbCre/+; Ai14fl/fl. We then crossed these mice with Col1a1GFP/+ mice (F2) to generate PdgfrbCre/+; Ai14fl/+; Col1a1GFP/+ mice. These resulting mice are herein called Col1a1-GFP; PdgfrβCre-tdTomato or PVF-mural cell reporter mice (Figure 1(a)). Both PVFs and mural cells express Pdgfrβ 16 and therefore are both tdTomato-positive in these mice. However, Col1a1 expression is specific to meningeal fibroblasts (Supplementary Figure 1) and PVFs of the pial surface and intraparenchymal vasculature (Figure 1).14–17 Therefore, we were able to identify PVFs in the brain by their additional expression of GFP (Figure 1(b)).
We first used in vivo two-photon imaging to assess the organization of PVFs along vascular zones previously defined by hierarchical organization of mural cells within the cortex.7,22 Penetrating arterioles, denoted as 0th order, were identified by robust tdTomato-expressing SMCs. The ACT zone (∼1st – 4th order) branch off the penetrating arterioles and ramify into the capillary zone (>5th order), increasing in branch order with each bifurcation. Here, branch orders 1 – 4th order are considered the ACT zone due to α-smooth muscle actin (α-SMA)-expressing ensheathing pericytes that tend to cover these vessel segments.4,26 Ensheathing pericytes can be identified by the morphology of their processes, which completely encircled the endothelium and are more elongated compared to SMCs. When pericytes shift their morphology to mesh and thin-strand processes at or before 4th order, this represents entry into the α-SMA-low to negative capillary zone (Figure 1(c)). We analyzed the distribution of PVF somata and the termination of the territories covered by their processes with respect to branch orders. This was done by counting the number of PVF somata and endpoint of PVF territory (territorial termini) at each branch order divided by their respective totals for each arteriolar network. This revealed that PVF somata were predominantly found along 0th order penetrating arterioles, and up to 4th order branches (Figure 1(c) and (f)) with their territories terminating predominantly on 3rd and 4th order vessels (Figure 1(c) and (g)), which corresponded to the ACT zone. PVFs were absent within the capillary zone. Over the cortical depths we could image, PVFs were continually present on penetrating arterioles even up to the maximum imaging depth used (≥200 µm) (Figure 1(e)). This was the case regardless of penetrating arteriole diameter.
Ascending venules (0th order on the venule side) drain blood out of the brain and are covered by tdTomato-expressing venule smooth muscle cells (VSMCs)21,27 or also called venule stellate-shaped mural cells. We found that PVF somata were present on some, but not all ascending venules (Figure 1(d)). Only 37.5% (12/32) of 0th order ascending venules were covered by PVFs, and these were typically ascending venules of larger diameter (>12 µm). PVF territories along ascending venules also terminated at shallower depths than penetrating arterioles and the depth of termination correlated with the ascending venule diameter (Figure 1(e)). Unlike arterioles, PVFs on the venous side did not extend beyond the 0th order vessel with either their somata or processes (Figure 1(f) and (g)).
Immunohistochemical analysis allowed us to examine penetrating arteriole and ascending venule labeling beyond cortical depths achieved by in vivo imaging. We found that PVF coverage of penetrating arterioles extended down to their deepest terminal branches (Supplementary Figure 2). Interestingly, principal cortical venules (PCVs), which are the largest venules that drain cortical gray matter and underlying white matter, 28 exhibited PVF labeling even down to their branches in the external capsule/corpus callosum (Supplementary Figure 2). Together this demonstrates that PVFs are found along penetrating arterioles, ACT zones and the trunk of large diameter ascending venules, but not along capillaries in the cortex. Thus, PVFs and capillary pericytes occupy distinct vascular zones.
Topological organization of perivascular fibroblasts is identical across various CNS regions
We next asked if PVFs were organized similarly along the vasculature throughout the CNS by examining various CNS regions of PVF-mural cell reporter mice histologically. Similar to what we observed in the cortex (Figures 1 and 2(a)), PVFs were found on arterioles, ACT zones, and large diameter venules, but not capillaries in the corpus callosum (Figure 2(b), Supplementary Figure 2) and hippocampus (Figure 2(c)), which are two regions where vascular pathology contributes to neurological disease.29,30 PVFs in the spinal cord are also organized similarly, a CNS region where fibrotic responses elicited by injury are regularly studied (Figure 2(d)).14,16,17 The same topological organization was also observed in the striatum, thalamus and the cerebellum (Supplementary Figure 3(a) to (c)). Interestingly, PVFs were not found along the retinal vasculature (Supplementary Figure 3(d)). This may be because the pia covers the optic nerve but does not extend to the retina 31 and is consistent with the idea that PVFs are perhaps an extension of the pia. 15
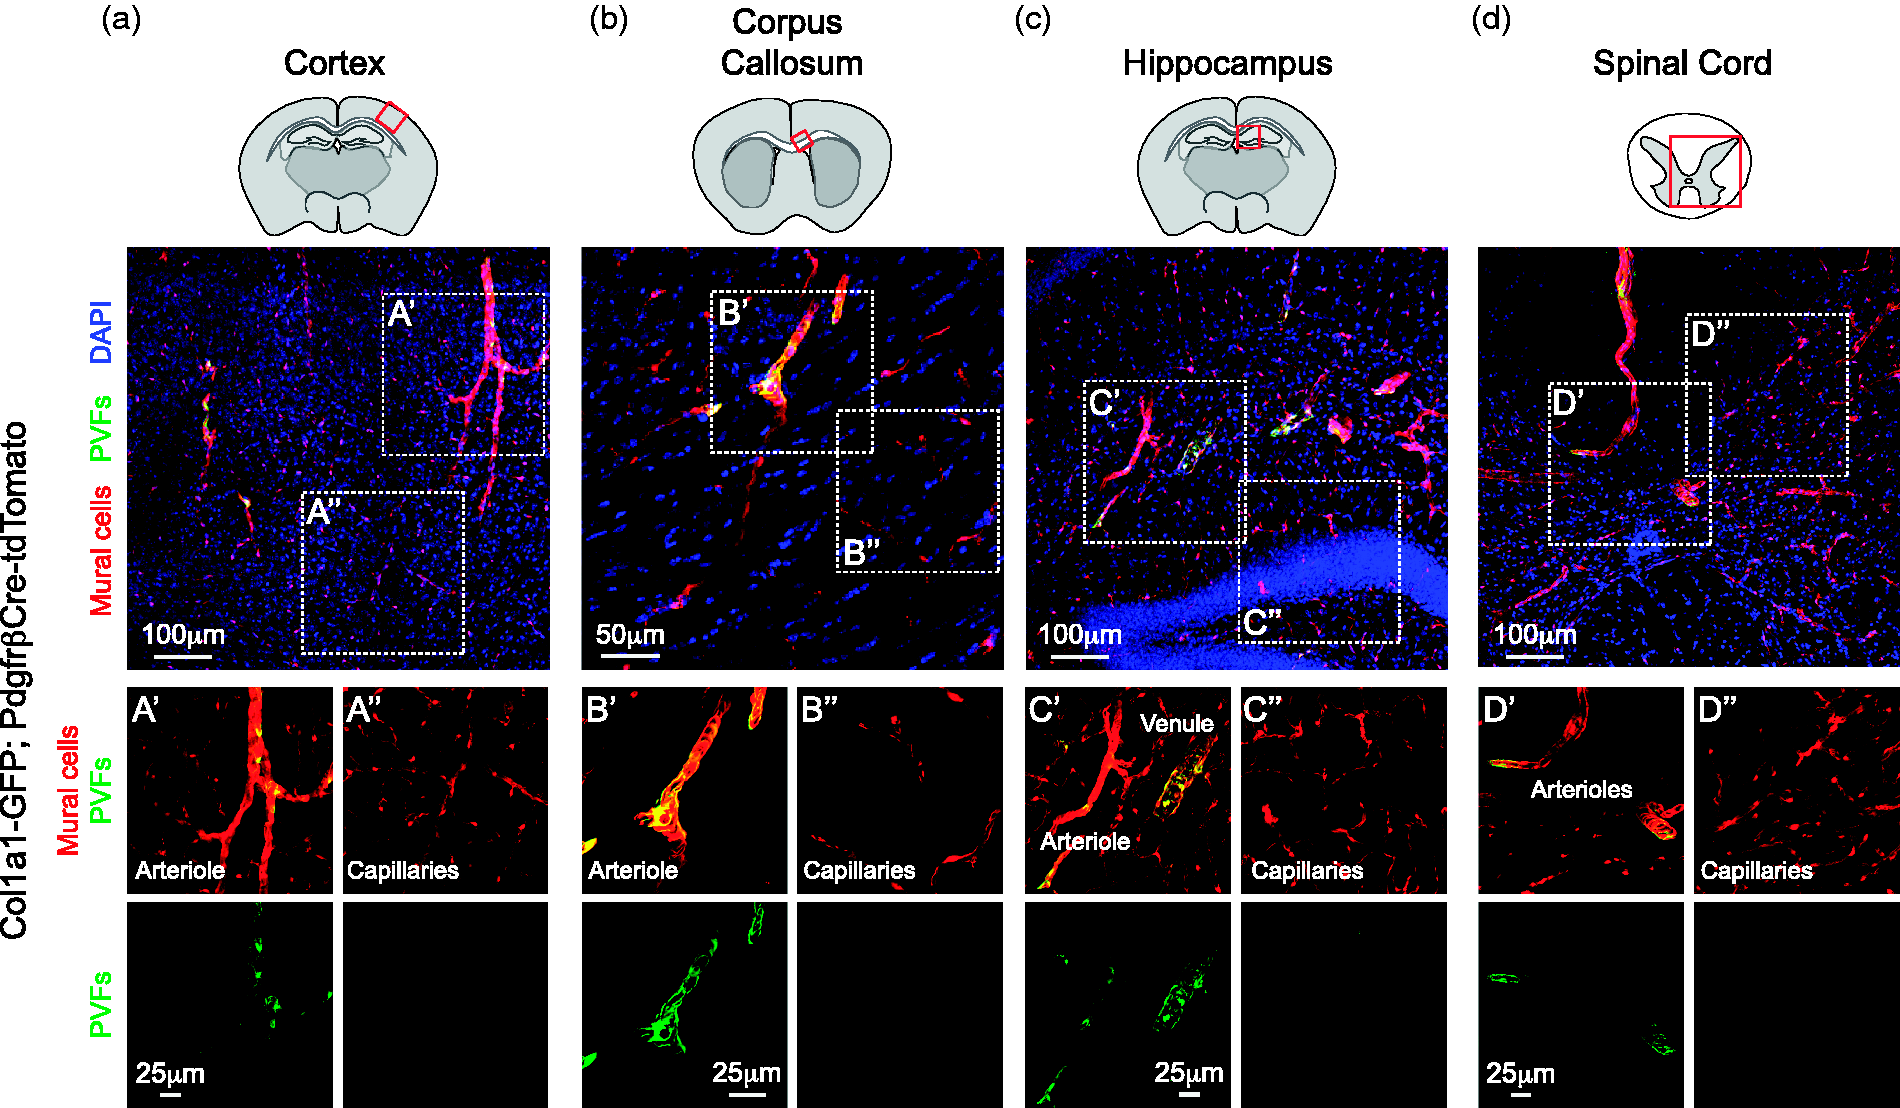
Topological organization of PVFs is similar across CNS regions. Representative confocal image of the (a) cortex, (b) corpus callosum, (c) hippocampus and (d) spinal cord from Col1a1-GFP; PdgfrβCre-tdTomato mice. Inset images show that perivascular fibroblasts (PVFs; green) are found along arterioles, arteriole-capillary transition zones, and venules in the (a′) cortex, (b′) corpus callosum, (c′) hippocampus (d′) and spinal cord. However, PVFs are not present on the capillary zone, which is occupied by thin-strand and mesh pericytes (red) in the (a″) cortex, (b″) corpus callosum, (c″) hippocampus (d″) and spinal cord. Mural cells are shown in red and DAPI in blue.
Morphological features of perivascular fibroblasts are distinct from mural cells
Morphological description of PVFs and a comparison to mural cells would assist in differentiating these two perivascular cell types. The morphology of mural cells along different microvascular zones in cerebral cortex has been described in detail using PdgfrβCre mice.21,27 Although PVFs are also labeled with the PdgfrβCre driver, as shown above, mural cells are brighter and more conspicuous in PdgfrβCre-tdTomato mice. SMCs along penetrating arterioles have thick circumferentially oriented processes (Figure 3(a)). Ensheathing pericytes of the ACT zone also have thick circumferential processes, and exhibit protruding, ovoid cell bodies typical of pericytes (Figure 3(b)). VSMCs also have protruding cell bodies like pericytes but their processes extend in multiple directions thus take on an overall stellate shape (Figure 3(c)).21,27 Observations from Figure 1 demonstrated flattened PVF somata that did not protrude far from the vessel wall. As such, putative PVF somata were occasionally observed along the vasculature of PdgfrβCre-tdTomato mice, most often along the ACT zone where morphological distinction was the greatest (Figure 3(b) and Supplementary Figure 4(a) to (d)).
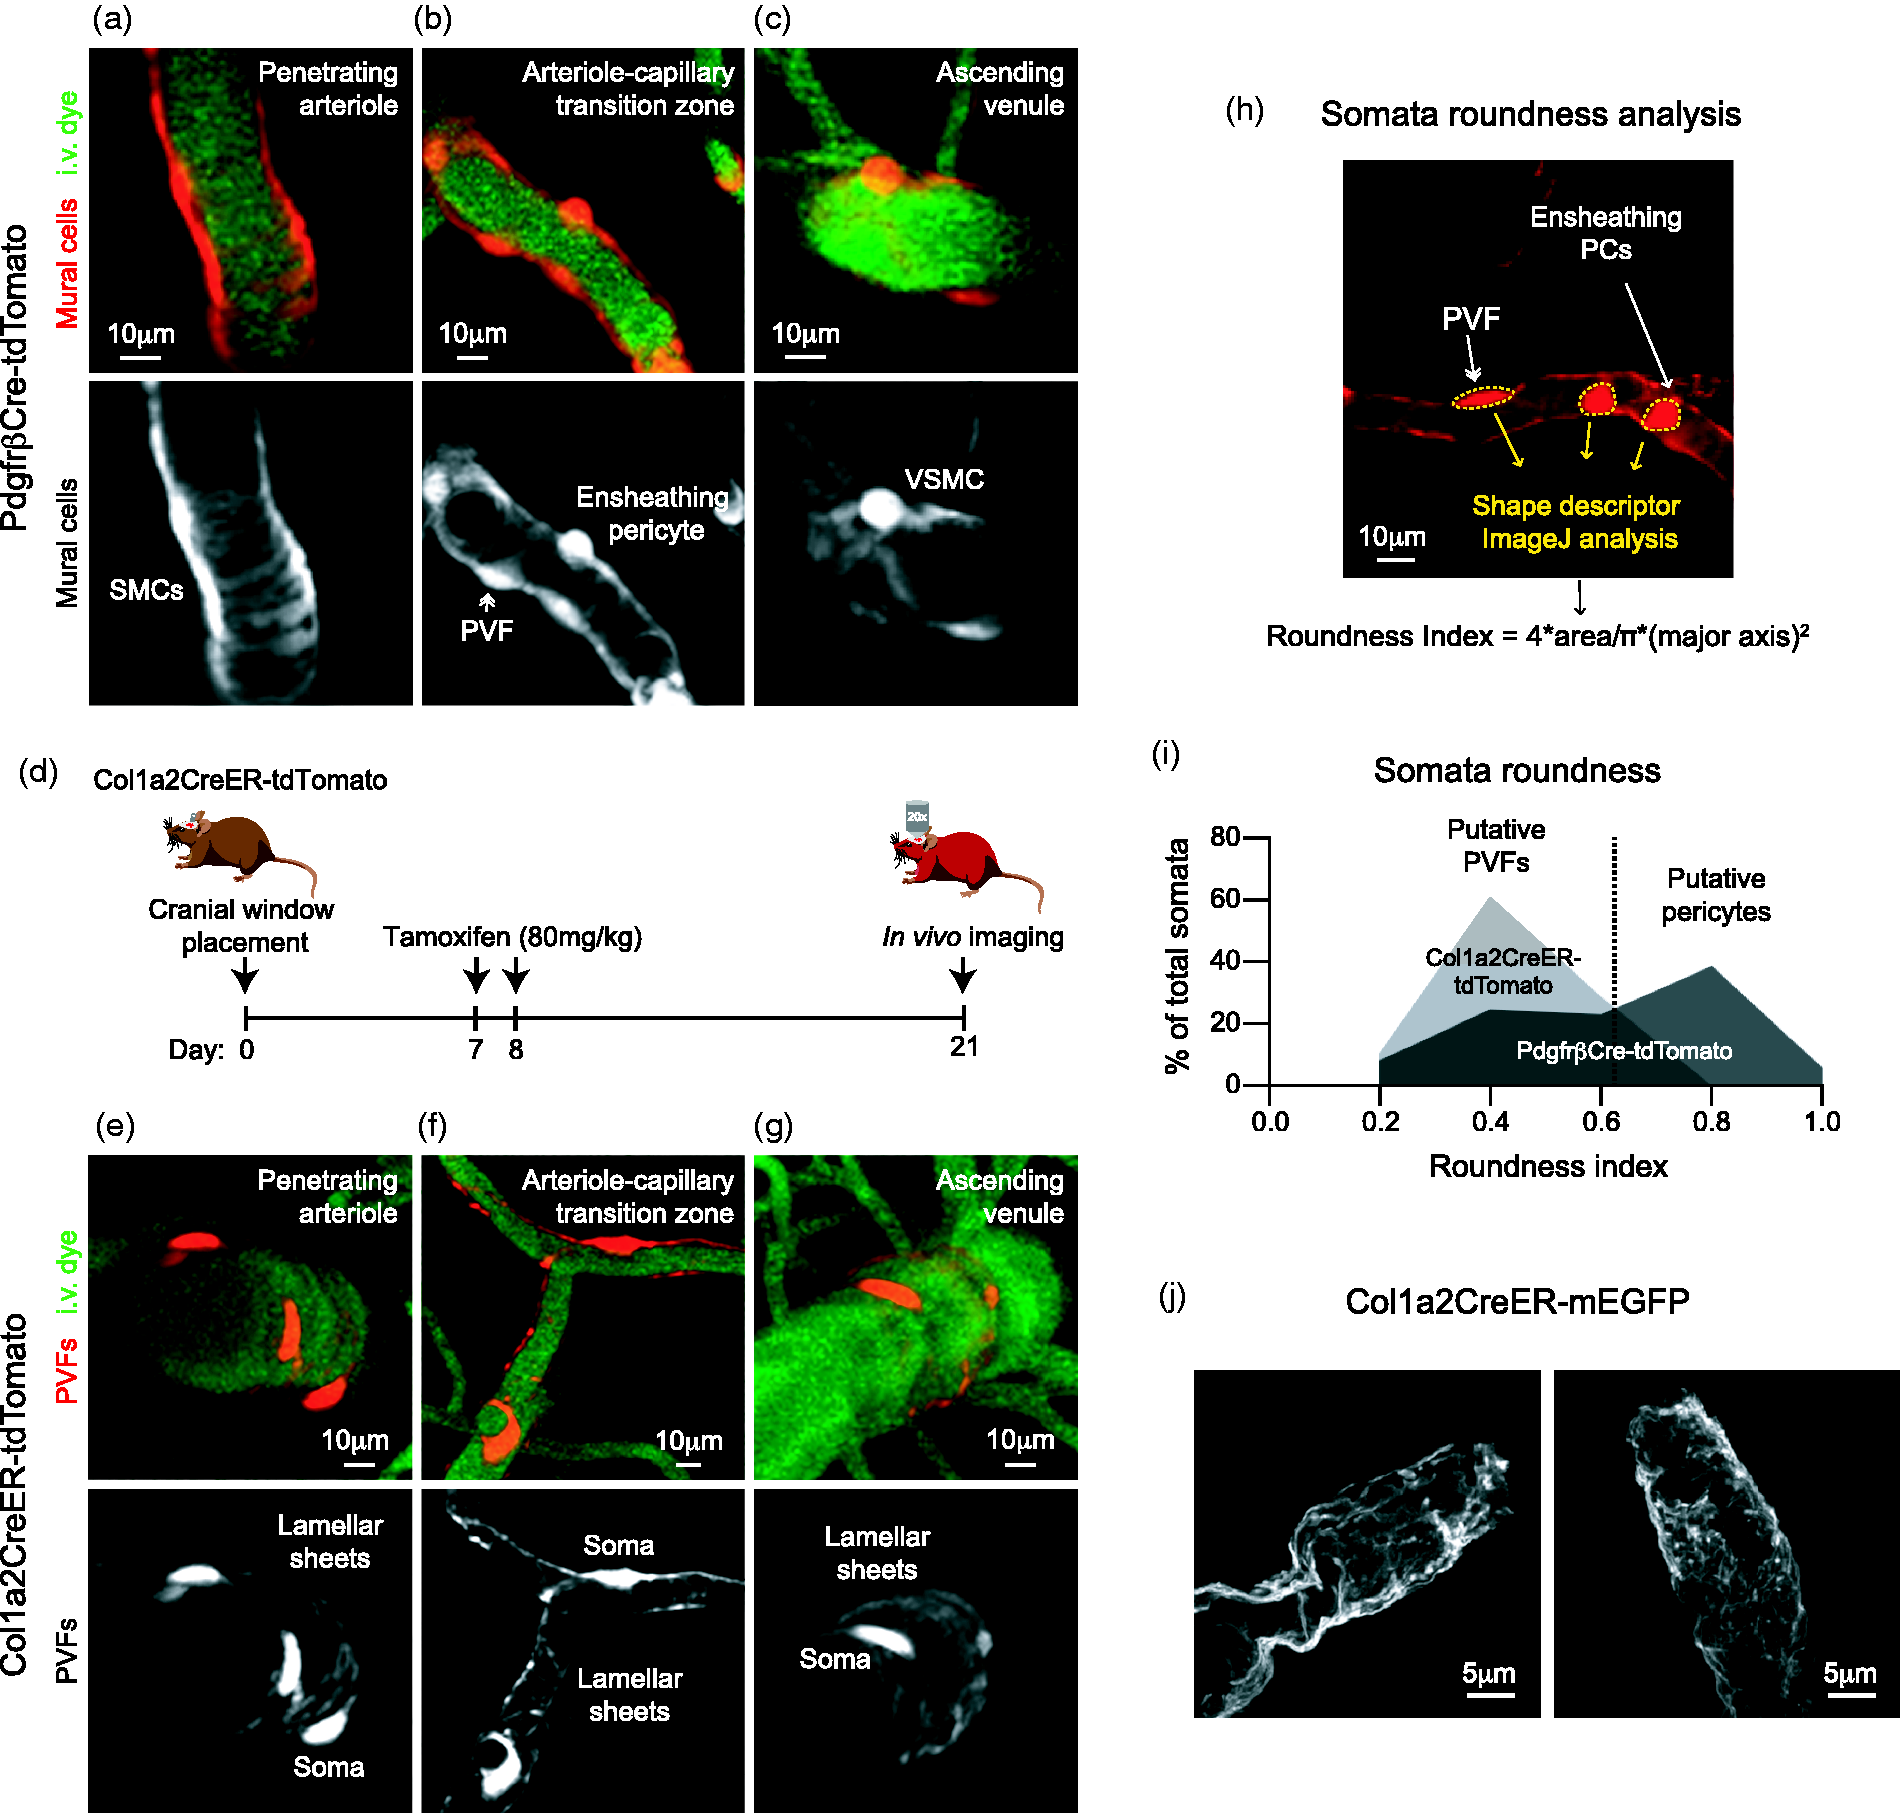
Morphological features of PVFs are distinct from mural cells. (a-c) Representative two-photon images from PdgfrβCre-tdTomato mice of (a) smooth muscle cells (SMCs) on a penetrating arteriole, (b) ensheathing pericyte and a putative PVF in the arteriole-capillary transition zone and (c) VSMCs on an ascending venule with respective red channel separated to better show mural cell morphology (white). Vasculature labeled with i.v. administration of FITC-dextran (70kDa; green). (d) Schematic demonstrating in vivo experimental timeline on Col1a2CreER-tdTomato mice. Cranial windows were placed in Col1a2CreER-tdTomato (Col1a2Cre/+; Ai14fl/+) mice. On days 7 and 8, mice were given tamoxifen (80mg/kg). In vivo imaging began 21 days after window placement. (e–g) Representative two-photon images of PVFs (red) from Col1a2CreER-tdTomato mice on the (e) penetrating arteriole, (f) arteriole-capillary transition zone, and (G) ascending venule with respective red channel separated below to appreciate PVF morphology in white. Vasculature labeled with i.v. administration of FITC-dextran (70kDa; green). (h) Example of somata roundness analysis. Cell somata in PdgfrβCre-tdTomato mice were outlined (yellow dashed line) using the freehand tool in ImageJ and the Roundness Index was obtained by using Shape descriptor analysis. (i) Histogram of somata roundness of tdTomato+ perivascular cells along the arteriole-capillary transition zone in PdgfrβCre-tdTomato mice (black) and tdTomato+ PVFs along penetrating arterioles, arteriole-capillary transition zone, and ascending venules in Col1a2CreER-tdTomato mice (gray). A roundness index of 1 would be considered a perfect circle. Data was compiled from 122 perivascular cells from 8 PdgfrβCre-tdTomato mice and 77 PVFs from 4 Col1a2CreER-tdTomato mice. (j) Representative high-resolution confocal image of ruffled PVF membrane (white) from Col1a2CreER-mEGFP mice.
To gain a clearer view of PVF morphology, we utilized the tamoxifen inducible fibroblast-targeting line Col1a2CreER and crossed them with the Rosa-lsl-tdTomato reporter mice (Ai14-flox). 32 Recent work showed that Col1a2CreER cell targeting overlaps with ∼90% of Col1a1-GFP expressing fibroblasts in the CNS. 14 We found that Col1a2CreER-tdTomato mice given five consecutive days of tamoxifen (80 mg/kg) resulted in robust tdTomato expression in PVFs. In addition to the PVFs, we noticed some tdTomato-expressing SMCs that covered 9.12% of the total length of penetrating arterioles examined (Supplementary Figure 5(a) and (b)). Two days of tamoxifen (80 mg/kg) resulted in a lower population of tdTomato+ PVFs but also less penetrating arteriole length coverage by tdTomato-expressing SMCs (0.18%; Supplementary Figure 5(c) and (d)). We further confirmed this in vivo, where we placed cranial windows in Col1a2Cre/+; Ai14fl/+ (Col1a2CreER-tdTomato) mice and tamoxifen (80 mg/kg) was given to the mice on days 7 and 8 post cranial window placement (Figure 3(d)). Following in vivo imaging 21 days after window placement, we found 4.04% of the tdTomato+ cells along penetrating arterioles, on average, were SMCs and were easily distinguished from PVFs due to their ring-like morphology (Supplementary Figure 5(e) to (g)). Expression of a second fibroblast marker, Pdgfrα, was also confirmed in PVFs along cortical vessels in Col1a2CreER-tdTomato mice with two days of tamoxifen (Supplementary Figure 6). Further, in vivo imaging of PVFs in Col1a2CreER-tdtomato mice treated with 2 days of tamoxifen exhibited vascular zone specificity identical to GFP in Col1a1-GFP mice. Meningeal fibroblasts were also sparsely labeled (Supplementary Figure 7). Together, these observations verify that Col1a2CreER can be a specific and efficient Cre driver to study fibroblasts and PVFs in the CNS with proper titration of tamoxifen dosage.
Imaging of PVF-reporter mice revealed that PVFs on penetrating arterioles, ACT zones, and ascending venules all shared similar features: Flattened somata and thin, sheet-like lamella that covered much of the vessel surface (Figure 3(d) to (f)). We then analyzed the roundness of perivascular somata in PdgfrβCre-tdTomato and Col1a2CreER-tdTomato mice. This consisted of outlining individual cell soma and obtaining a roundness index through shape descriptor ImageJ analysis (Figure 3(h)). This analysis in PdgfrβCre-tdTomato mice revealed two groups of somata shapes in the ACT zone. One group with a round shape (∼>0.6 roundness index), which were putative ensheathing pericytes, and another group with a more flattened somata (∼<0.6 roundness index), which were putative PVFs. Indeed, the roundness index of PVF somata in Col1a2CreER-tdTomato fell between 0.2–0.7, coinciding with the flattened somata group in the PdgfrβCre-tdTomato mice (Figure 3(i)). These observations were consistent in all the mice analyzed (Supplementary Figure 4(e)). Immunohistochemistry for Pdgfrα and Pdgfrβ in mice without fluorescent reporters demonstrated that Pdgfrα+/Pdgfrβ+ PVFs have flattened soma and Pdgfrα-/Pdgfrβ+ mural cells have round, protruding cell bodies (Supplementary Figure 8), supporting our analysis of perivascular cells in PdgfrβCre-tdTomato and Col1a2CreER-tdTomato mice.
We also examined PVFs in Col1a2CreER-mEGFP mice by high resolution confocal microscopy, where cells expressed membrane-bound EGFP to improve visibility of fine subcellular structure. This revealed that PVF processes were fibrous sheets with “ruffled” texture (Figure 3(j), Supplementary Figure 9). This is consistent with electron microscopy studies of human cortical arterioles and venules, which are described to be surrounded by thin “pial cells” within perivascular spaces. 13 Thus, PVFs are morphologically distinct from mural cells both at the level of their somata (protruding vs flattened) and processes (circumferential banding vs. ruffled sheets).
Perivascular fibroblasts are a dynamic perivascular cell population
Previous studies showed that the somata of pericytes were very stable in their positions.
5
This is in line with their tight physical interlocking with endothelial cells and encasement in vascular basement membrane.
33
In contrast, PVFs reside within the fluid-filled perivascular space of large vessels, raising the possibility that PVFs can move more easily through this space. We therefore monitored the position of PVF somata weekly up to 4 weeks in most cases. PVFs often made small morphological adjustments to their somata overtime (Figure 4(a)). To pinpoint their position from week to week we determined the Euclidian distance at Day 0 (D0) from the center of an individual PVF soma to the nearest vessel branch point, a vascular structure known to be stable over long periods in the adult cortex.
34
This was done by measuring the distance (d0) from the cell soma to the nearest vessel branch point in a 2D max projected image and determining the z-distance (z0) between these two structures. The Euclidian distance was calculated using the equation:
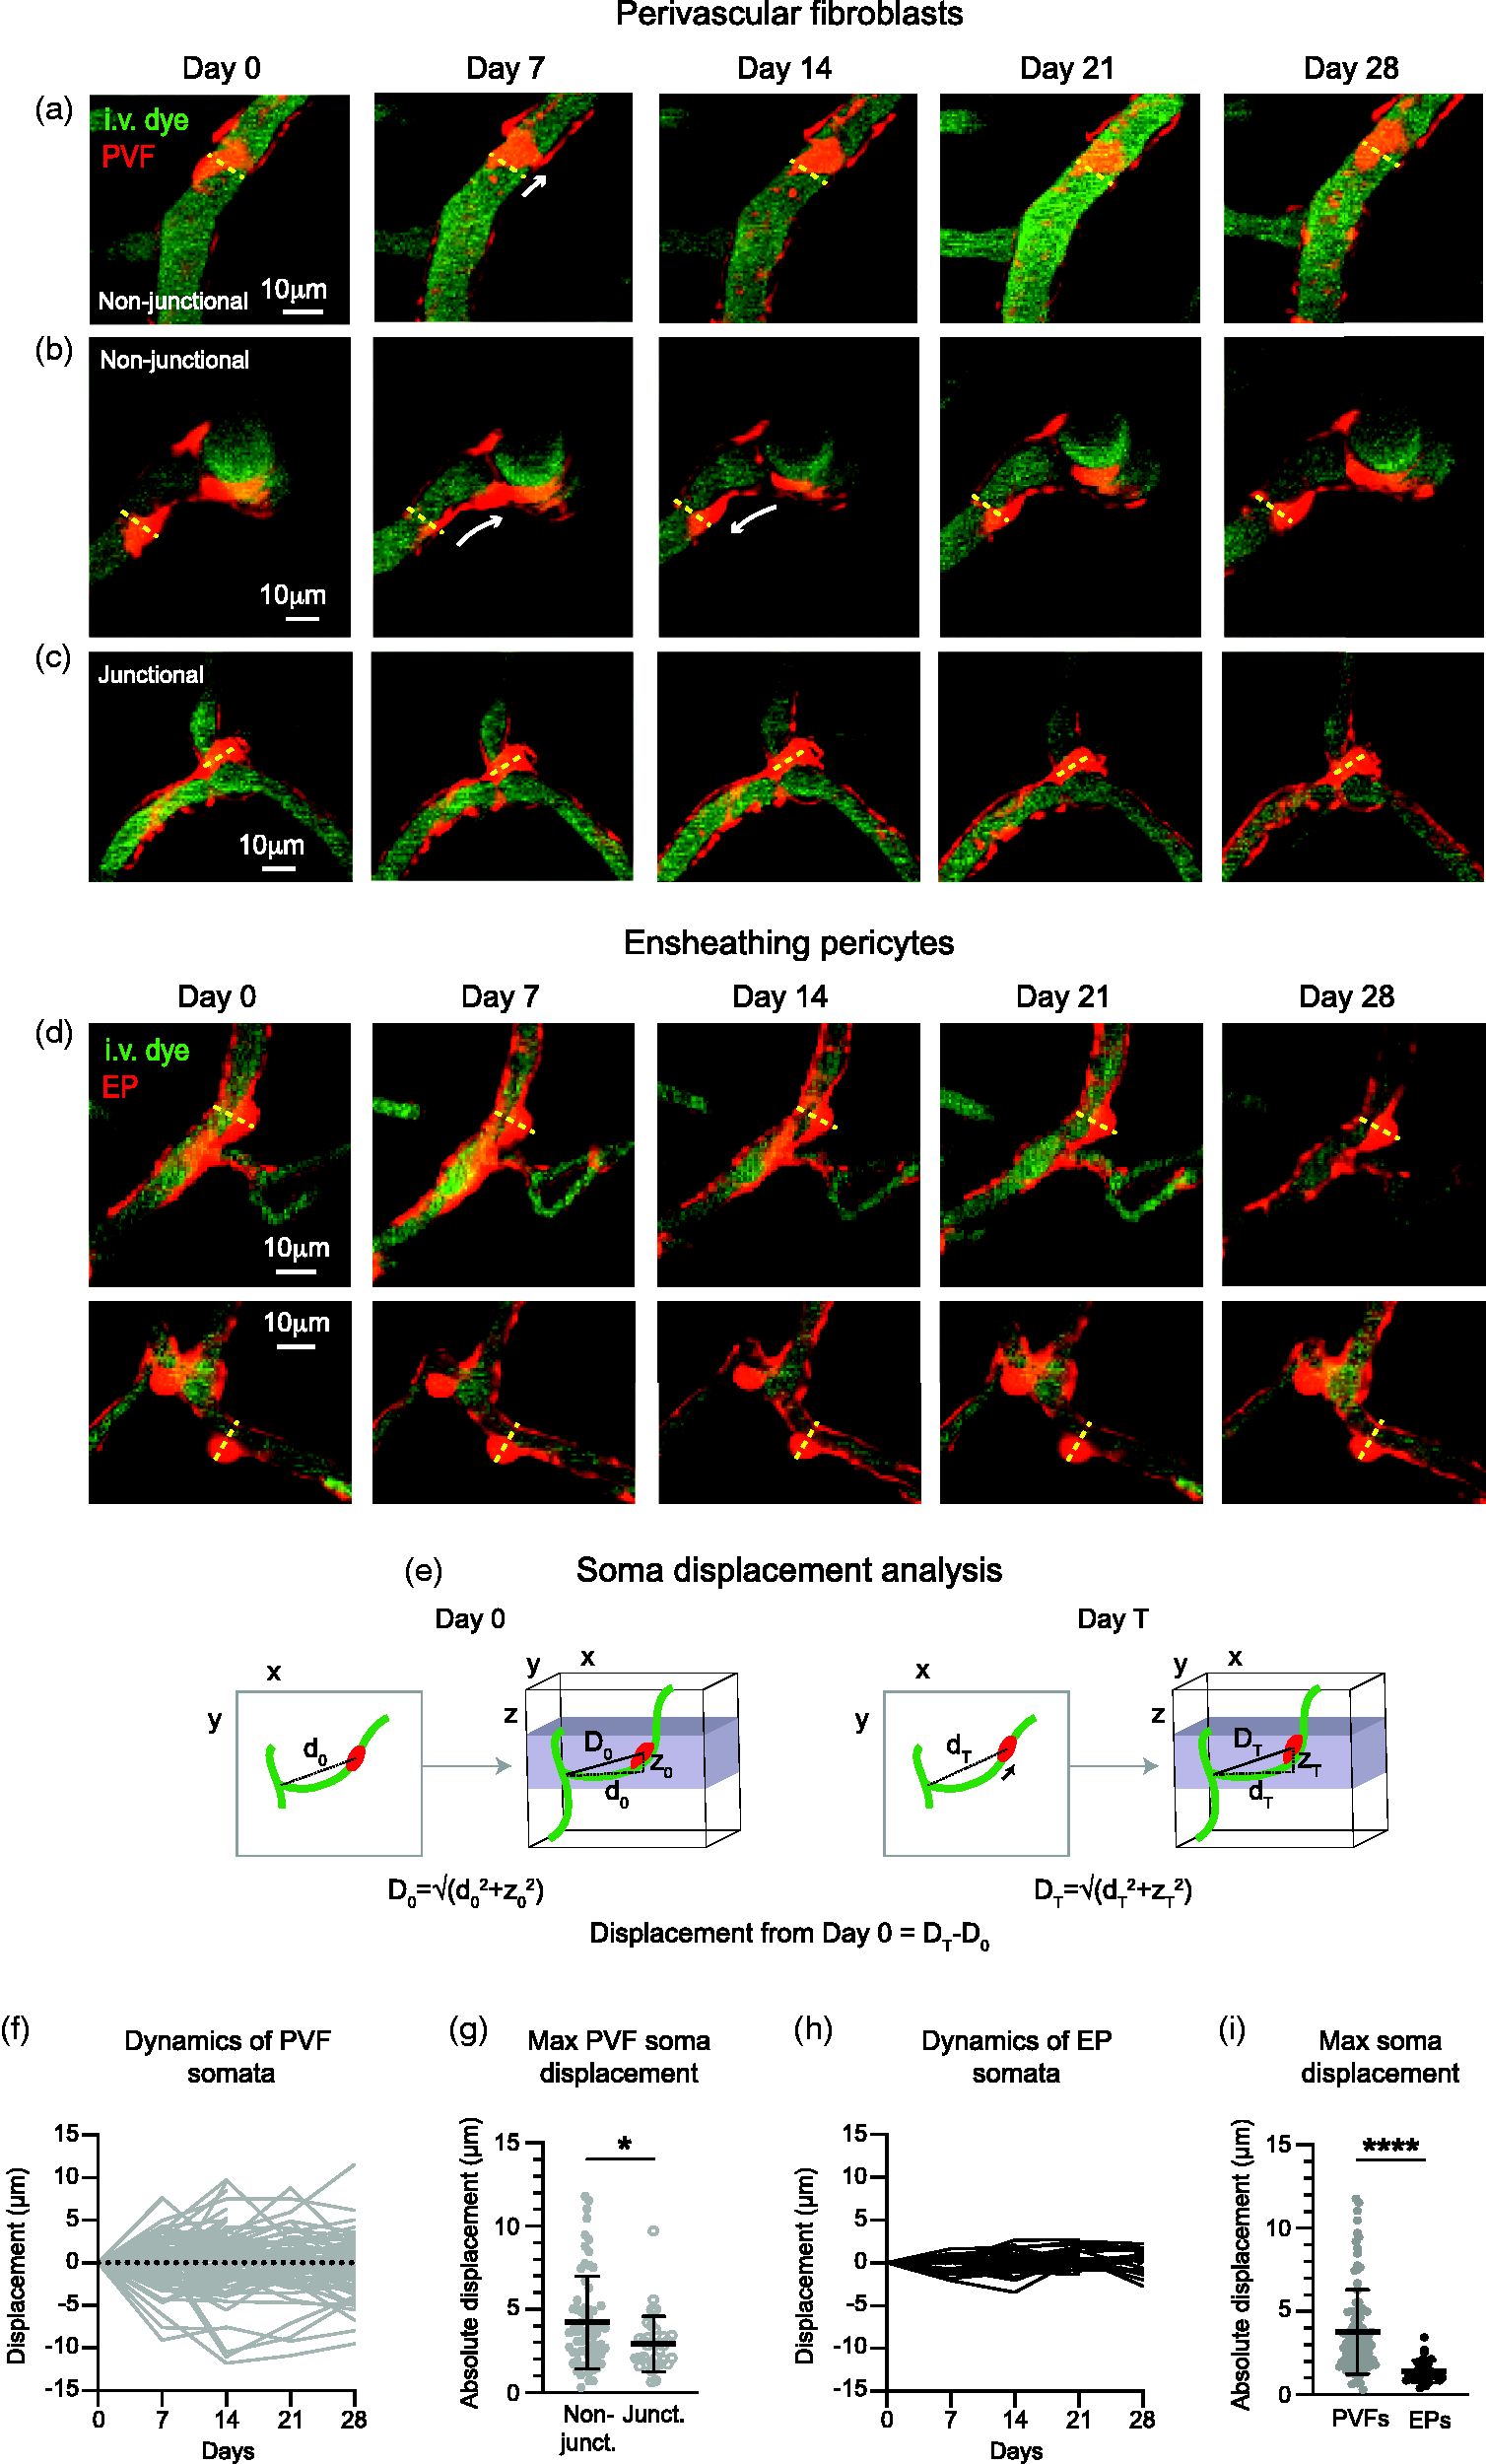
Perivascular fibroblasts are a dynamic perivascular cell population. (a–c) Representative in vivo two-photon images of perivascular fibroblasts (PVF; red) over 28 days from Col1a2CreER-tdTomato mice. (a, b) Non-junctional PVFs display more mobility than (c) PVFs found at vascular junctions. Dashed line indicates initial soma position on Day 0. Vasculature labeled withContinued.i.v. administration of FITC-dextran (70kDa; green). (d) Two representative examples of ensheathing pericytes from PdgfrβCre-tdTomato mice following 28 days of in vivo two-photon imaging. Dashed line indicates initial soma position on Day 0. Vasculature labeled with i.v. administration of FITC-dextran (70kDa; green). (e) Schematic demonstrating how displacement of PVFs and ensheathing pericytes from Day 0 was measured. The distance (d0) between the soma center and nearest vascular branch point was measured in the 2D projected image. Then the z-distance (z0) between these two structures was determined and used to calculate the Euclidean distance (D0). This was repeated at each imaging time point (Day T; DT). Displacement from Day 0 was determined by subtracting DT from D0. (f) Graph demonstrating soma displacement of PVFs over 28 days from initial position on day 0 (n = 102 PVFs from 4 Col1a2CreER-tdTomato mice). (g) Graph comparing maximum displacement of PVFs with non-junctional (n = 68 PVFs) and junctional (n = 34) vascular positions. PVFs with non-junctional positions were significantly more dynamic than PVFs at junctions (Mann-Whitney test U = 841, *p = 0.0251. Median: Non-junctional = 3.627µm, junctional = 2.814 µm). (h) Graph demonstrating soma displacement of ensheathing pericytes (EP) over 28 days from initial position on day 0 (n = 32 EPs from 5 PdgfrβCre-tdTomato mice). (i) Graph comparing maximum displacement of PVFs (n = 102 PVFs) and EPs (n = 32). PVFs were significantly more dynamic than EPs (Mann-Whitney test U = 431, ****p < 0.0001. Median: PVFs = 3.081µm, EP = 1.142 µm).
Discussion
Our studies confirm that PVFs and mural cells co-exist in a similar perivascular niche in the brain microvasculature, but cell-specific transgenic mouse lines and morphological distinctions can be used to differentiate the cell types and the microvascular zones they occupy. The data shown here provides foundational knowledge on PVF organization, morphology and dynamics that will be necessary before detailed studies on cellular reactions to disease or injury using in vivo two-photon microscopy. Future studies will be needed to delineate the physiological role of PVFs in the healthy brain. For example, by residing solely on arterioles, ACT zones, and larger ascending venules, PVFs may play a unique role in large vessel stability. Surrounding large arterioles is a fluid filled perivascular space occupied by PVFs and a basement membrane intermixed with a composition of laminin-α1/2 and fibrillar Col1 and Col3.36–38 In addition to Col1 expression, transcriptional analysis suggests that PVFs also express Col3 and laminin-α1/2 and may therefore be a source of these ECM components.12,14 In zebrafish, deposition of collagen (Col1a2 and Col5a1) by PVFs was vital for vascular stability along intersegmental vessels that sprout off of the dorsal aorta. 2 Interestingly, upon spreading out their fibrous lamella, fibroblasts form actin stress fibers and focal adhesions attaching themselves to the ECM and helping to create tension within their environment. 39 Thus, the sheet-like encasement of PVF processes may physically strengthen the vascular basement membrane. This possibility could be tested by optical ablation of resting PVFs along the brain vasculature or deletion of PVF-derived basement membrane proteins. Of note, we think it is unlikely that PVF or mural cell morphology are altered by expression of GFP or tdTomato in these transgenic mice since all cells retain their unique morphology and can be differentiated via similar criteria following immunohistochemistry for Pdgfrα and Pdgfrβ. However, we caution that due to the close apposition of PVFs and mural cells, resolving these cells solely by immunohistochemistry may be difficult. Thus, while PVF markers such as Pdgfrα can help to define PVF territories along the vasculature, differentiation of individual PVFs from mural cells based on morphology is most rigorous with fluorescent mouse reporters.
We also demonstrate that PVFs are dynamic along the brain vasculature. It is possible that PVFs are actively responding to environmental or migratory cues during their movement. The small adjustments seen in PVF position could also be a passive effect of vasomotion, the natural slow oscillations (∼0.1 Hz) in arteriole diameter important for driving CSF flow. 35 Although, we did not observe net directional movement of PVFs, as might be expected if PVFs migrated with flow of CSF. Vasomotion is substantially reduced under isoflurane-induced anesthesia, as used in these studies, 40 and therefore future experiments could assess this possibility in awake mice. We were unable to resolve distinct territories of individual PVFs in instances where multiple tdTomato-expressing PVFs were present along the vasculature. It is possible that the territories of individual PVFs overlap, and this was a limitation in assessing the morphology and dynamics of PVF lamellar sheets.
Vascular stability and clearance of brain waste, such as amyloid beta, through perivascular spaces is substantially altered in aging and Alzheimer’s related diseases.41–43 Native PVF morphology can change with their environmental conditions. For example, fibroblasts in high tension environments, such as those created by Col1 and 3, spread out their membrane and form lamellar structures as opposed to dendritic morphologies exhibited by fibroblasts in low-tension environments.44,45 Thus, under conditions of small vessel disease or tissue hypoxia, PVFs could conceivably influence CSF flow by changing the shape or accessibility of the perivascular space along arterioles and venules. Indeed, activation of PVFs coincided with enlarged perivascular spaces in patient tissue and mouse models of amyotrophic lateral sclerosis. 46 Further, if PVFs do contribute to the composition of the vascular basement membrane, PVF pathology may alter the intramural peri-arterial drainage for CSF. 47 These unexplored mechanisms within the perivascular space would be in addition to the overt migration of PVFs from vessels to form a component of tissue scars following injury, which has thus far been the `focus of PVFs in disease.
Supplemental Material
sj-pdf-1-jcb-10.1177_0271678X211068528 - Supplemental material for Distinct features of brain perivascular fibroblasts and mural cells revealed by in vivo two-photon imaging
Supplemental material, sj-pdf-1-jcb-10.1177_0271678X211068528 for Distinct features of brain perivascular fibroblasts and mural cells revealed by in vivo two-photon imaging by Stephanie K Bonney, Liam T Sullivan, Timothy J Cherry, Richard Daneman and Andy Y Shih in Journal of Cerebral Blood Flow & Metabolism
Footnotes
Funding
The author(s) disclosed receipt of the following financial support for the research, authorship, and/or publication of this article: This work was support by NIH NRSA fellowship to SKB F32 NS117649 and grants to RD (NS119615) and AYS (NS106138, AG063031, NS097775).
Acknowledgments
The authors greatly appreciate the fruitful discussions from members of the Shih Lab, specifically Drs. Andrée-Anne Berthiaume, Vanessa Coelho-Santos and Stefan Stamenkovic. We are also thankful for the discussions with Drs. Julie Siegenthaler and Mark Majesky throughout these studies.
Declaration of conflicting interests
The author(s) declared no potential conflicts of interest with respect to the research, authorship, and/or publication of this article.
Authors’ contributions
SKB and AYS conceptualized and designed experiments. Two-photon imaging and data analysis was done by SKB. Tissue collection and confocal imaging was performed by LTS and SKB. Retina dissections were assisted by TJC. Statistics was performed by SKB. Manuscript was written by SKB and AYS with editing and contributions from all authors.
Supplemental material
Supplemental material for this article is available online.