
Abstract
Vascular contributions to cognitive impairment and dementia (VCID) particularly Alzheimer’s disease and related dementias (ADRDs) are increasing; however, mechanisms driving cerebrovascular decline are poorly understood. Methylenetetrahydrofolate reductase (MTHFR) is a critical enzyme in the folate and methionine cycles. Variants in MTHFR, notably 677 C > T, are associated with dementias, but no mouse model existed to identify mechanisms by which MTHFR677C > T increases risk. Therefore, MODEL-AD created a novel knock-in (KI) strain carrying the Mthfr677C > T allele on the C57BL/6J background (Mthfr677C > T) to characterize morphology and function perturbed by the variant. Consistent with human clinical data, Mthfr677C > T mice have reduced enzyme activity in the liver and elevated plasma homocysteine levels. MTHFR enzyme activity is also reduced in the Mthfr677C > T brain. Mice showed reduced tissue perfusion in numerous brain regions by PET/CT as well as significantly reduced vascular density, pericyte number and increased GFAP-expressing astrocytes in frontal cortex. Electron microscopy revealed cerebrovascular damage including endothelial and pericyte apoptosis, reduced luminal size, and increased astrocyte and microglial presence in the microenvironment. Collectively, these data support a mechanism by which variations in MTHFR perturb cerebrovascular health laying the foundation to incorporate our new Mthfr677C > T mouse model in studies examining genetic susceptibility for cerebrovascular dysfunction in ADRDs.
Introduction
Vascular contributions to cognitive impairment and dementia (VCID) including Alzheimer’s disease (AD) are on the increase, yet the mechanisms defining vascular dysfunction are not well understood. AD is one of the most common forms of age-related neurodegenerative dementia. 1 Currently, over 50 million people globally are suffering from AD, and this number is expected to triple by 2050. 2 Multiple complex factors play a role in disease development, and it is now well-established that both genetic and environmental risk contribute to pathology.3,4 Historically, AD has primarily been characterized by the accumulation of beta amyloid plaques, neurofibrillary tangles of TAU and widespread neuronal loss. 5 Over the last 10 years, over 400 clinical trials for AD have failed, with the majority of them targeting amyloid and TAU accumulation. 6 Recent evidence suggests that the majority of cases of AD also present clinically with cerebrovascular complications that contribute to initiation and progression of the disease through diverse mechanisms including ischemia, vascular inflammation, blood brain barrier (BBB) dysfunction, small vessel disease and white matter hyperintensities – features shared with other dementias such as mixed dementia and vascular dementia (VaD).7,8 To date, few clinical trials have attempted to improve cerebrovascular health to reduce risk or treat dementia, and currently there are a limited number of animal models that precisely manipulate cerebrovascular health to permit in-depth investigations, thus ultimately limiting our understanding of disease etiology.
Genome-wide association studies have linked the 677 C > T polymorphism (often referred to as C677T) in the methylenetetrahydrofolate reductase gene (MTHFR677C > T) 9 with both AD10–12 and vascular dementia. 13 Examining its contribution to AD is broadly relevant because 20–40% of the global population is predicted to be either heterozygous or homozygous for MTHFR677C > T.14,15 Historically, null or highly deleterious mutations in MTHFR have been identified in patients with severe MTHFR deficiency due to an inborn error of metabolism resulting in homocystinuria. 16 Clinically, these MTHFR-deficient patients demonstrate vascular dysfunction, including thromboses 17 and vascular lesions. 18 The MTHFR677C > T polymorphism is predicted to result in a less severe condition that has been linked to increased risk of many common peripheral vascular diseases in adulthood including stroke 19 and atherosclerosis. 20 Additionally, clinical imaging studies have linked MTHFR677C > T to brain volume deficits in patients with mild cognitive decline. 21 Those who carry the risk variant consistently demonstrate reduced MTHFR enzyme activity 22 and global hypomethylation23,24 in leukocytes, and elevated plasma homocysteine.25–27 Previously, MTHFR deficiency has been modeled using mice heterozygous and homozygous for a Mthfr null allele, 28 but the mechanisms by which the MTHFR677C > T variant specifically increases risk for VCID are not clear.
The MTHFR gene codes for a key regulatory enzyme in folate and homocysteine metabolism, and under physiological conditions generates the folate derivative (5-methyltetrahydrofolate) that is utilized for the conversion of homocysteine to methionine. Methionine is used to generate S-adenosylmethionine (SAM), a critical donor of methyl groups for numerous biological functions. Reduced MTHFR activity prevents homocysteine conversion, resulting in elevated homocysteine levels in the blood.29,30 This elevation has long been associated with vascular damage in cardiovascular disease, with evidence pointing to increased inflammation and endothelial cell dysfunction.31,32 Diets that induce hyperhomocysteinemia in mice also show VCID relevant phenotypes.33–35 Diet modification has been used in clinical trials to lower blood homocysteine levels; although some studies reported a reduction in brain atrophy,36,37 trials were generally unsuccessful in modulating cognitive decline, suggesting a plasma homocysteine-independent mechanism of damage in the brain.38,39 Therefore, to better understand the role of the MTHFR677C > T variant, we created and characterized a novel Mthfr677C > T mouse strain that phenocopies decreased liver MTHFR enzyme activity and increased plasma homocysteine. In addition, Mthfr677C > T mice showed cerebrovascular deficits by PET/CT, immunohistochemistry and electron microscopy. These features suggest variations in MTHFR result in deficits in cerebrovascular morphology and function, providing a new mouse model to determine the mechanisms by which MTHFR677C > T increases risk for VCID.
Materials and methods
All experiments were reported in accordance with the ARRIVE guidelines.
Mouse strains
The Mthfr677C > T mouse strain was generated at The Jackson Laboratory (JAX) as part of the IU/JAX/Pitt/Sage MODEL-AD Center under the MODEL-AD animal use summary (ID:18051) and maintained under the Howell lab animal use summary (ID: 12005). Experiments were conducted in accordance with policies and procedures described in the Guide for the Care and Use of Laboratory Animals of the National Institutes of Health 40 and were approved by the JAX Institutional Animal Care and Use Committee. All mice are congenic on the C57BL/6J (JAX# 000664) (B6) strain and bred and housed in a 12/12-hour light/dark cycle and fed LabDiet 5K52 (LabDiet), a standard natural ingredient diet containing 1.9 mg/kg folic acid, and 9.0 mg/kg riboflavin. In mice, based on numbering from ENSMUST00000069604.15, the 806 C > T causes a codon change GCC>GCT, leading to an A262V mutation in the methylenetetrahydrofolate reductase gene that is equivalent to the 677 C > T polymorphism and corresponding A222V mutation in humans. Given its common usage, we refer to this mouse model as Mthfr677C > T. Initially, the Mthfr677C > T was engineered by CRISPR onto LOAD1 (B6.APOE4.Trem2*R47H) 41 (JAX #30922). To create the Mthfr677C > T strain (JAX #31464), APOE4 and Trem2*R47H were bred out by successive backcrosses to B6. To produce experimental animals, mice heterozygous for Mthfr677C > T (MthfrC/T) mice were intercrossed to produce litter-matched male and female MthfrC/C, MthfrC/T and MthfrT/T mice (herein referred to as CC, CT and TT). Mice were aged to either 3–4 months, 6 months, 12 months, 18 months or 24 months.
Mouse perfusion, tissue preparation and sectioning
Mice were anesthetized with a lethal dose of ketamine/xylazine based on animal mass and transcardially perfused with 1X PBS (Phosphate Buffered Saline). Liver blanching was used to determine a successful perfusion. Liver and brain tissue were removed for enzyme activity assessment and snap frozen in liquid nitrogen. Brains were dissected and hemisected at the midsagittal plane. For immunohistochemistry assessment, brain hemispheres were fixed in 4% Paraformaldehyde (PFA) overnight at 4°C followed by 24 hours in 15% sucrose/Phosphate Buffered Solution (PBS) and 24 hours in 30% sucrose/PBS solution. Tissue was then frozen in OCT, and cryosectioned sagittally at 20 μm.
Enzyme activity and Western blotting
MTHFR enzyme activity
Liver and brain were collected from male mice (n = 6/genotype except for TT; n = 4) and from female mice in a separate cohort (n = 6/genotype). MTHFR activity was determined using 14C-methylTHF-menadione oxidoreductase assay 42 (37°C, reverse direction) with the following modifications: 14C-methylTHF was lowered to 200 µM, and total volume increased to 279 µL. Assays were performed in duplicate with 1 blank per sample, using 200 µg protein (from 10 µg/µL aliquots), by an individual blinded to genotype.
Protein extraction
Crude protein extract was prepared from 80–100 mg of frozen liver, (n = 6/sex/genotype, except TT males; n = 4) and whole half brain (n = 6/genotype) in extraction buffer (50 mM potassium phosphate pH 7.2, 50 mM sucrose, 0.3 mM EDTA containing protease and phosphatase inhibitors (Pierce Protease Inhibitor Tablet and Halt Phosphatase Inhibitor Cocktail, ThermoScientific Cat# A32955 and 78420)) using a bead mill with steel beads (2 × 2 min at 20 Hz; TissueLyser, Qiagen). Extracts were cleared by centrifugation (17,000 RCF) at 4°C for 30 min. Protein content was determined by Bradford assay using BSA (Bovine Serum Albumin) as a standard. A portion of the extract was diluted to 10 µg/µL in extraction buffer and aliquoted. Diluted aliquots and concentrated extracts were stored at −80°C.
MTHFR stability assays
MTHFR stability was assessed by pre-incubating 800 µg of protein extract (from 10 µg/µL aliquots) at either 37 or 46°C in the MTHFR assay mix lacking cofactors (i.e. FAD and methylTHF). After 10 mins of incubation, 14C-methylTHF and FAD were added to the reaction mix, and the assay proceeded as described. 42 Assays were performed by an individual blinded to genotype, in duplicate for each temperature, with one blank at 37°C, as temperature was pre-determined not to affect 14C counts in the blank. (Males only, n = 3/genotype).
Western blotting
Western blots were performed with 25 µg of the protein extracted for MTHFR assays, using primary antibodies specific for MTHFR, 9 and β-actin (Cat #A2066; Sigma-Aldrich), as in. 43 Blots were imaged using the Amersham Imager 600 and quantitated with the Amersham Imager 600 analysis software v1.0.0 (GE Healthcare Life Sciences). (Males n = 6/genotype except for TT n = 4; females n = 6/genotype).
Homocysteine
Blood was collected by cardiac puncture from non-fasted, anesthetized animals (see Perfusion method) at harvest prior to perfusion (n = 8−12/sex/genotype/age) using a 25-gauge EDTA-coated needle, attached to a 1 mL syringe. 300–500 mL of blood was slowly injected into a 1.5 mL EDTA coated MAP-K2 blood microtainer (Cat#363706, BD, San Jose, CA) at room temperature. Blood tubes were spun at 23°C and 4388 RCF for 15 minutes. Blood plasma was removed and aliquoted into 1.5 mL tubes. Tubes were stored at −20°C before analysis. Thawed blood plasma was analyzed by Beckman Coulter AU680 chemistry analyzer (Beckman Coulter, Brea, CA) and Siemens Advia 120 (Germany) for levels of homocysteine. Human homocysteine values were obtained from the Alzheimer’s Disease Neuroimaging Initiative (ADNI).
Folate and methionine cycle plasma metabolites
Plasma 5-MTHF was determined by liquid chromatography coupled with electrospray positive ionization tandem mass spectrometry (LC-ESI-MS/MS) as previously described. 44 Prior to analysis samples were prepared by adding 10 µL of 2.5 µmol/L of 13C-5-MTHF internal standard (IS) to 50 µL of blank, working standard and plasma in eppendorf tubes. Samples were left to incubate at room temperature for 10 min. To all samples 250 µL of methanol (containing 5 mg/ml ascorbate) was added. After centrifugation 20 µL of clear extract was injected into a Nexera LC sytem (Shimadzu Corporation, Kyoto Japan) coupled to a 5500 QTrap mass spectrometer (Sciex, Framingham, MA).
Plasma methionine metabolites (SAM, SAH, methionine, cysteine, cystathionine, betaine, and choline were measured in plasma by LC-MS/MS as previously described.45,46 Briefly, plasma samples were prepared by adding 20 mL of plasma to 180 mL of isotope IS in a micro centrifugal filter unit (Amicon Ultra 0.5 mL, 10 kDa NMWL, Millipore) and centrifuged at 14,000rpm at 4°C for 25 min. Clear extract (10 mL) was injected into the Nexer LC system and 5500 QTrap mass spectrometer.
Identification of all metabolites was performed using Analyst 1.7 (Sciex, Framingham, MA) and quantification was achieved using the peak area ratio of metabolite/area of IS.
PET/CT
To assess neurovascular perfusion, mice were non-invasively imaged via PET/CT (n = 5–6 mice/sex/genotype/age). PET/CT is used to give both anatomic (CT) and functional (PET) information, and were performed sequentially during each session, thus permitting the images to be co-registered for regional specificity analysis. To measure regional blood flow, 5.3 ± 0.09 MBq (in 100 µL) copper-pyruvaldehyde-bis(N4-methylthiosemicarbazone) (64Cu-PTSM), 47 which has a very high first pass (>75%) extraction, 48 and glutathione reductase redox trapping of copper, 48 was administered via tail vein in awake subjects and given a 2 min uptake period in their warmed home case prior to imaging. Post uptake, mice were induced with 5% isoflurane (95% medical oxygen) and maintained during acquisition with 1–2% isoflurane at 37°C. To provide both anatomical structure and function, PET/CT imaging was performed with a Molecubes β-X-CUBE system (Molecubes NV, Gent Belgium). For PET determination of tissue perfusion, calibrated listmode PET images were acquired on the β-CUBE, and reconstructed into a single-static image using ordered subset expectation maximization (OSEM) with 30 iterations and 3 subsets. 49 To provide anatomical reference, and attenuation maps necessary to obtain fully corrected quantitative PET images, helical CT images were acquired with tube voltage of 50 kV, 100 mA, 100 μm slice thickness, 75 ms exposure, and 100 μm resolution. In all cases, images were corrected for radionuclide decay, tissue attenuation, detector dead-time loss, and photon scatter according to the manufacturer’s methods. 49 Post-acquisition, all PET and CT images were co-registered using a mutual information-based normalized entropy algorithm 50 with 12 degrees of freedom, and mapped to stereotactic mouse brain coordinates. 51 Finally, to quantify regional changes, voxels of interest (VOI) for 27 brain (54 bilateral) regions were extracted and analyzed for SUVR (relative to cerebellum) according to published methods. 52
Autoradiography
To confirm the in vivo PET images, and to quantify regional tracer uptake, brains were extracted post rapid decapitation, gross sectioned along the midline, slowly frozen on dry ice, embedded in cryomolds with Optimal Cutting Temperature (OCT) compound (Tissue-Tek), and 20 µm frozen sections were obtained at prescribed bregma targets (n = 6 bregma/mouse, 6 replicates/bregma) based on stereotactic mouse brain coordinates. 51 Sections were mounted on glass slides, air dried, and exposed on BAS Storage Phosphor Screens (SR 2040 E, Cytiva Inc.) for up to 12 h. Post-exposure, screens were imaged via Typhoon FL 7000IP (GE Medical Systems) phosphor-imager at 25 µm resolution along with custom 64Cu standards described previously. 53
Immunostaining
20 µm cryosections were rinsed once in 1X PBT (PBS + 1% Triton 100X) and incubated in primary antibodies diluted with 1X PBT + 10% normal donkey serum overnight at 4°C. After incubation with primary antibodies, sections were rinsed three times with 1X PBT for 15 min and incubated overnight at 4°C in the corresponding secondary antibodies. Tissue was then washed three times with 1X PBT for 15 min, incubated with DAPI for 5 minutes, washed with 1X PBS and mounted in Poly aquamount (Polysciences). The following primary antibodies were used: goat anti-Collagen IV (ColIV) (1:40, EMD Millipore Cat# AB769), chicken anti-GFAP (1:200, Origene Cat# AP31806PU-N), rabbit anti-Iba1 (1:200, Wako Chemicals Cat# 019-19741), goat anti-PDGFRβ (1:40, Novus Biologicals Cat# AF1042). Secondary antibodies: donkey anti-goat 488 (1:500, Invitrogen), donkey anti-goat 647 (1:500 Invitrogen) donkey anti-rat 488 (1:500 Invitrogen), donkey anti-rabbit 594 (1:500 Invitrogen), donkey anti-chicken 594 (1:500, Jackson ImmunoResearch Laboratories). Antibodies listed in this study have previously been validated in the Howell lab and are frequently used and maintained.
Confocal imaging and Imaris analysis
Z-stacks of immunostained brain sections were taken on a confocal microscope (Leica TCS Sp8 AOBS with 9 fixed laser lines) at 20x magnification using the Leica Application Suite X (LAS X) software (Leica Microsystems GmbH, Mannheim, Germany). Three images were taken for each brain from each mouse from 1) frontal cortex, 2) somatosensory cortex and 3) visual cortex (n = 6/sex/genotype/age for a total of 216 images). Imaris software (x64 9.5.1) was used for quantification of cortical ColIV+ vessel area and area covered by GFAP+ astrocytes as well as cell counting of Iba1+ microglia, and PDGFRβ+ pericytes using a workflow developed in-house, available upon request. Briefly, confocal images were converted into Imaris compatible files and vessel or astrocyte boundaries were confirmed. For each image, individual vessel or astrocyte volumes were determined in µm3 and collected in Excel. The sum of the individual vessel or astrocyte volumes were determined per image, and this value was used for statistical analysis. A similar method was used to assess cell counts.
Transmission electron microscopy (TEM)
Mice were perfusion fixed (using 2% PFA and 2% glutaraldehyde in 0.1 M Cacodylate buffer (Caco)). Brains were fixed overnight in the same solution at 4°C then stored in 1X PBS. 100 μm thick sagittal sections were cut on a vibrating microtome and post fixed with 2% osmium tetroxide in 0.1 M Caco buffer for 2 hours at room temperature. Sections were rinsed three times with Caco buffer and then dehydrated through of series of alcohol gradations. The sections were then put into a 1:1 solution of propylene oxide/Epon (EMED 812) overnight on an orbital rotator. Sections were then flat embedded with 100% Epon between 2 sheets of Aclar film and polymerized at 65°C for 48 h. For each section, a region of the frontal cortex was cut out and glued onto dummy blocks of Epon. 90 nm ultrathin sections were cut on a Diatome diamond knife, collected on 300 mesh copper grids, and stained with Uranyl Acetate and lead citrate. Grids were viewed on a JEOL JEM1230 transmission electron microscope and images collected with an AMT high-resolution digital camera. For each brain, 10-20 cross-sectional blood vessels as well as other defining cells or features (e.g., microglia) were imaged per (n = 3/sex/genotype.) In a blinded analysis, images were assessed for the following main features 1) presence/absence of endothelial cells, 2) open/closed lumen, 3) presence/absence of astrocyte endfeet, 4) presence/absence of apoptotic cells, 5) presence/absence of microglia and if present, their level of interaction with vessels.
Alzheimer’s disease neuroimaging initiative (ADNI)
The Alzheimer’s Disease Neuroimaging Initiative (ADNI) initial phase was launched in 2003 as a public-private partnership. 54 The primary goal of ADNI has been to test whether serial MRI, PET, other biological markers, and clinical and neuropsychological assessment can be combined to accurately measure the progression of mild cognitive impairment (MCI) and early AD. Demographic information, APOE and whole-genome genotyping data, plasma homocysteine levels, and clinical information are publicly available from the ADNI data repository (http://www.loni.usc.edu/ADNI/). Measurement of levels of plasma homocysteine was described in detail previously. 55
Statistical analysis
Sample size was determined to be sufficient using previously published work from the Howell lab as well as previously published work from our collaborators. Because brain tissue was required for each assay, separate cohorts of mice had to be developed, maintained and aged to perform experiments. While every effort was made to have at least n = 6 for each group, there were instances in which we were unable to get 6 mice/sex/genotype/age from the colony. We could not supplement them with additional mice, in part because we are the only group to maintain the mice and could not be purchased in house from The Jackson Laboratory. Sample size is clearly stated in the figure legends.
For all experiments, authors were blinded to animal genotype before data generation. In the case of electron microscopy where numeric data is not generated, two authors placed images into categories based on observations of vascular abnormalities before revealing sex and genotype. Data are shown as the mean ± standard deviation. Normality was assessed using Shapiro-Wilk and Kolmogorov-Smirnov tests. Multiple group comparisons were performed by one-way or two-way multifactorial analysis of variance (ANOVA) depending on the number of variables followed by Tukey post hoc test. If data from multiple group comparisons was not normally distributed, the Kruskal-Wallace or Mann-Whitney tests were used followed by the Dunn’s multiple comparisons post hoc test. When assessing differences between two groups, a paired two-tailed Student’s test was used. Data from PET/CT were assessed in two ways: principal component analysis as a data reduction method, where regions explaining 80% of the variance were selected for statistical analysis, and by multivariate analysis of variance (MANOVA). Correlation and linear regression analyses were performed when assessing MTHFR activity vs protein expression and when assessing BMI vs plasma homocysteine levels. Full statistical tests for each experiment are listed in Supplemental Table 2. Differences were considered to be significant at p < 0.05. Statistical analyses were performed utilizing Prism v9.3.1 software (GraphPad Software Inc., San Diego, CA, USA) or SPSS 28.0.1 software. For all analyses, *p < 0.05, **p < 0.01, ***p < 0.001, ****p < 0.0001.
Results
Mthfr677C > T mice display reduced enzyme activity in liver, with relevant metabolic changes in plasma
Because liver is a major tissue for folate metabolism, MTHFR enzyme activity was assessed in crude liver extracts of 3–4 month old male and female Mthfr677C > T mice. In both sexes, enzymatic activity was significantly reduced in mice carrying one (CT, heterozygous) or two (TT, homozygous) copies of the risk allele compared to wild type mice (CC). Although specific activity did not differ significantly between the CC and CT groups, activity in the TT mice was significantly lower than both the CC and CT groups (Figure 1(a)). These data are consistent with human findings conducted in human leukocytes. 9 Presence of the variant increased the thermolability of human MTHFR, so thermostability was assessed in crude liver extracts of male Mthfr677C > T mice. Statistics were not performed because of the small sample size, but the data is tightly grouped and the trend aligns with the activity data. Percent retained activity in CC, CT and TT liver extracts decreased in a genotype-specific manner. Specifically, CT was less stable than CC, and TT was less stable than both CC and CT (Figure 1(b)).
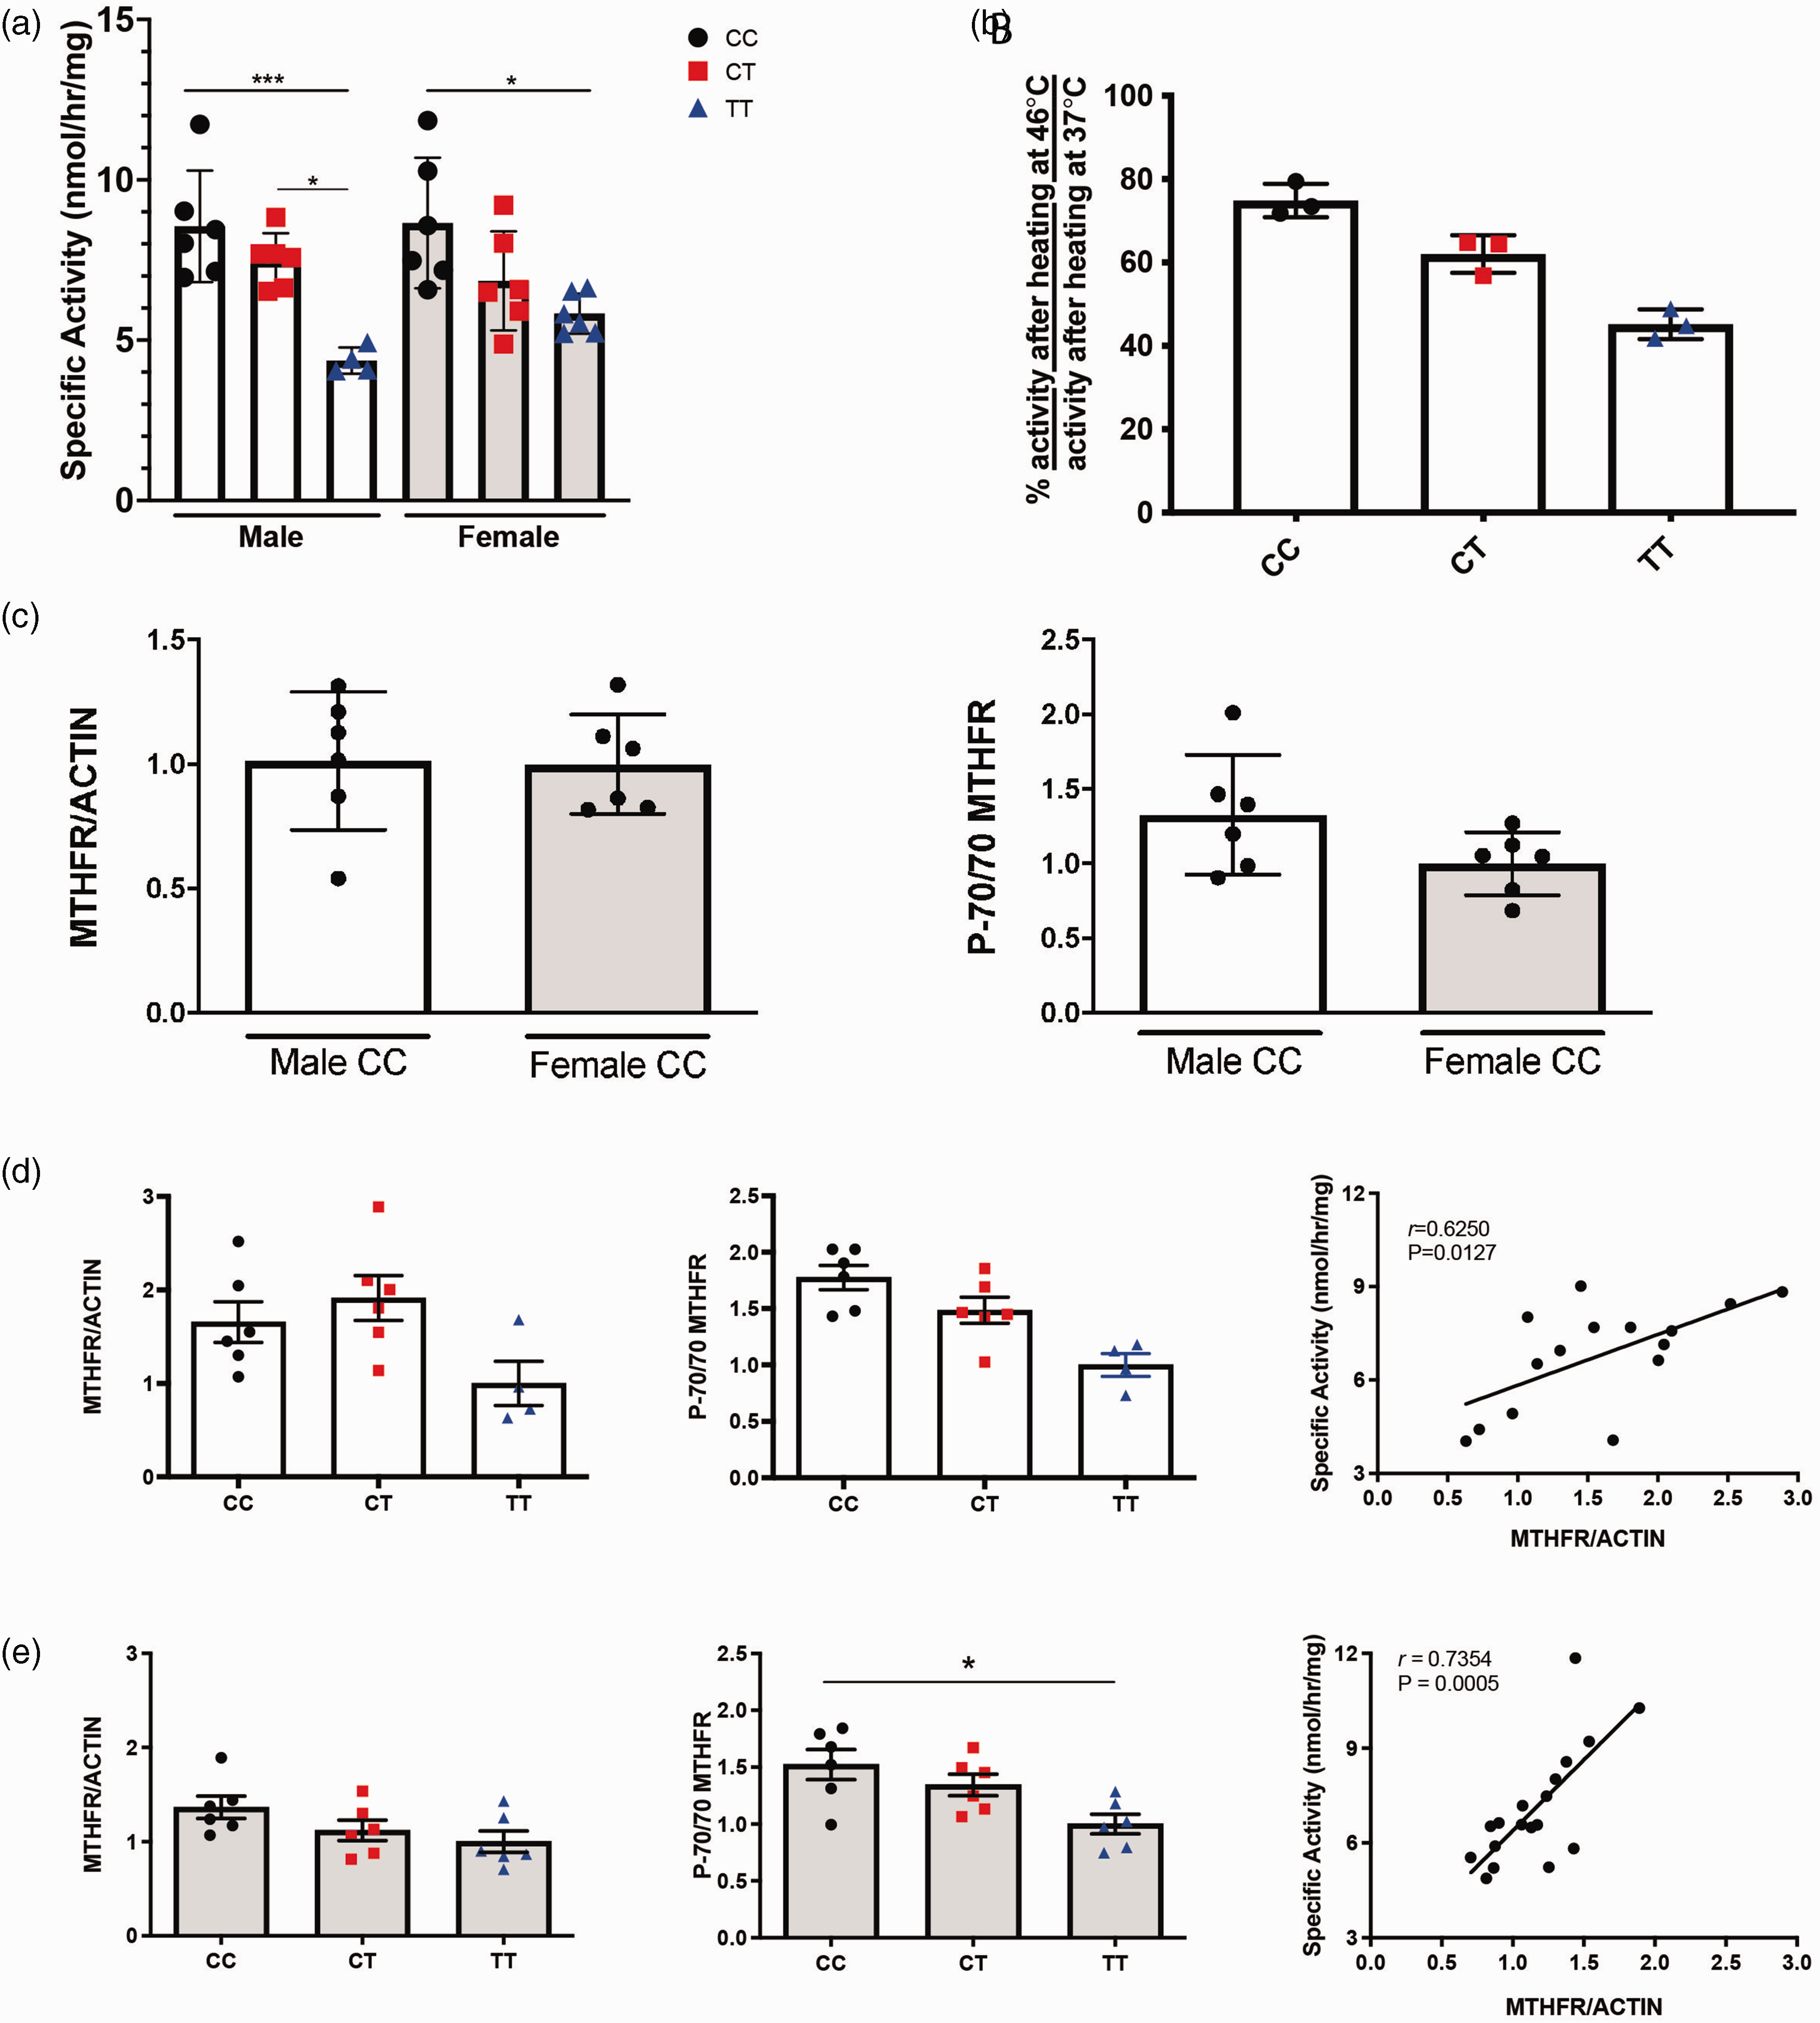
MTHFR enzyme activity is reduced in liver of Mthfr677C > T mice. (a) MTHFR enzymatic activity in the liver. Activity is significantly reduced in both males and females carrying one (CT) or two (TT) copies of the variant. (n = 6/genotype except for TT males: n = 4; P = 0.0002 Two-way ANOVA, Tukey post-hoc). (b) Liver enzymatic activity after the sample is heated is shown as a ratio of percent activity at 46 degrees Celsius/percent activity at 37 degrees Celsius. Activity is reduced in male CT and TT mice. (n = 3/genotype). (c) Western blots were performed on control (CC) male and female mice and determined that MTHFR protein expression does not differ by sex (left) using actin as a standard (n = 6/sex; unpaired t-test). The ratio of the phosphorylated MTHFR isoform p70 to the non-phosphorylated isoform is also not significantly different between male and female controls (right; n = 6/genotype; unpaired t-test). (d) Within males, total MTHFR does not significantly differ based on genotype (left; n = 6/genotype except for TT males: n = 4; One-way ANOVA, Tukey post-hoc). However, the ratio of phosphorylated to non-phosphorylated isoforms is reduced in CT and TT males (center; n = 6/genotype except for TT males: n = 4; P = 0.0017, One-way ANOVA, Tukey post-hoc). MTHFR enzymatic activity correlates with total MTHFR protein (right; n = 6/genotype except for TT males: n = 4; correlation with activity, P = 0.0127 Pearson r = 0.6250) and (e) In females, total MTHFR protein also does not significantly differ based on genotype (left; n = 6/genotype; One-way ANOVA, Tukey post-hoc). The ratio of phosphorylated to non-phosphorylated isoforms is reduced in TT females (center; n = 6/genotype; P = 0.0119, One-way ANOVA, Tukey post-hoc). MTHFR enzymatic activity correlated with total MTHFR protein (right; n = 6/genotype; correlation with activity, P = 0.0005 Pearson r = 0.7354).
MTHFR protein levels were assessed in liver extracts by Western blot. There was no significant effect of sex on MTHFR levels, (Figure 1(c)) as was previously reported. 56 Similarly, there was no significant effect of sex on the ratio of the phosphorylated to non-phosphorylated isoforms of MTHFR (Figure 1(c)). MTHFR levels did not differ significantly due to genotype (Figure 1(d) and (e)). The phosphorylated (P-70) isoform of MTHFR is reported to be less active than the non-phosphorylated (70) isoform.57,58 The ratio of the P-70 to 70 isoforms of MTHFR differed significantly between genotypes and was significantly lower in the TT livers of both males and females when compared to both CC and CT due to the increase in the non-phosphorylated isoform (Figure 1(d) and (e)). Full western blot images are shown in Supplementary Figure 1. There was good correlation between MTHFR activity and expression (Figure 1(d) and (d)), which suggests that the reduced MTHFR activity observed in the mouse model and in people with the TT genotype,9,42 may be due to reduced amounts of MTHFR protein in liver and possibly in other tissues.
With less available MTHFR enzyme activity to convert homocysteine into methionine, more homocysteine remains in the blood and has been shown to promote vascular inflammation.59–61 Therefore, plasma homocysteine levels were assessed in Mthfr677C > T mice at four ages: 6, 12, 18 and 24 months old (Figure 2(a)). Notably, 6 month old TT mice showed the most distinct increase in homocysteine levels compared to littermate controls (Figure 2(a)). Older groups demonstrated sex differences (female mice have overall higher homocysteine levels) but not significant differences between genotypes. However, within older female mice carrying the variant, homocysteine levels still trended at an elevated level. Human data from the Alzheimer’s Disease Neuroimaging Initiative (ADNI) showed that overall, participants within the cohort presented with higher plasma homocysteine based on MTHFR677C > T genotype (Figure 2(b)). Unlike mice, male humans showed higher overall plasma homocysteine levels when the data are stratified by sex (Figure 2(c)). This discrepancy may be diet-related as men in the ADNI study had higher overall Body Mass Index values, (Figure 2(d)) while mice in these studies were fed a standard low-fat chow for the duration of their lives and did not become obese as they aged.
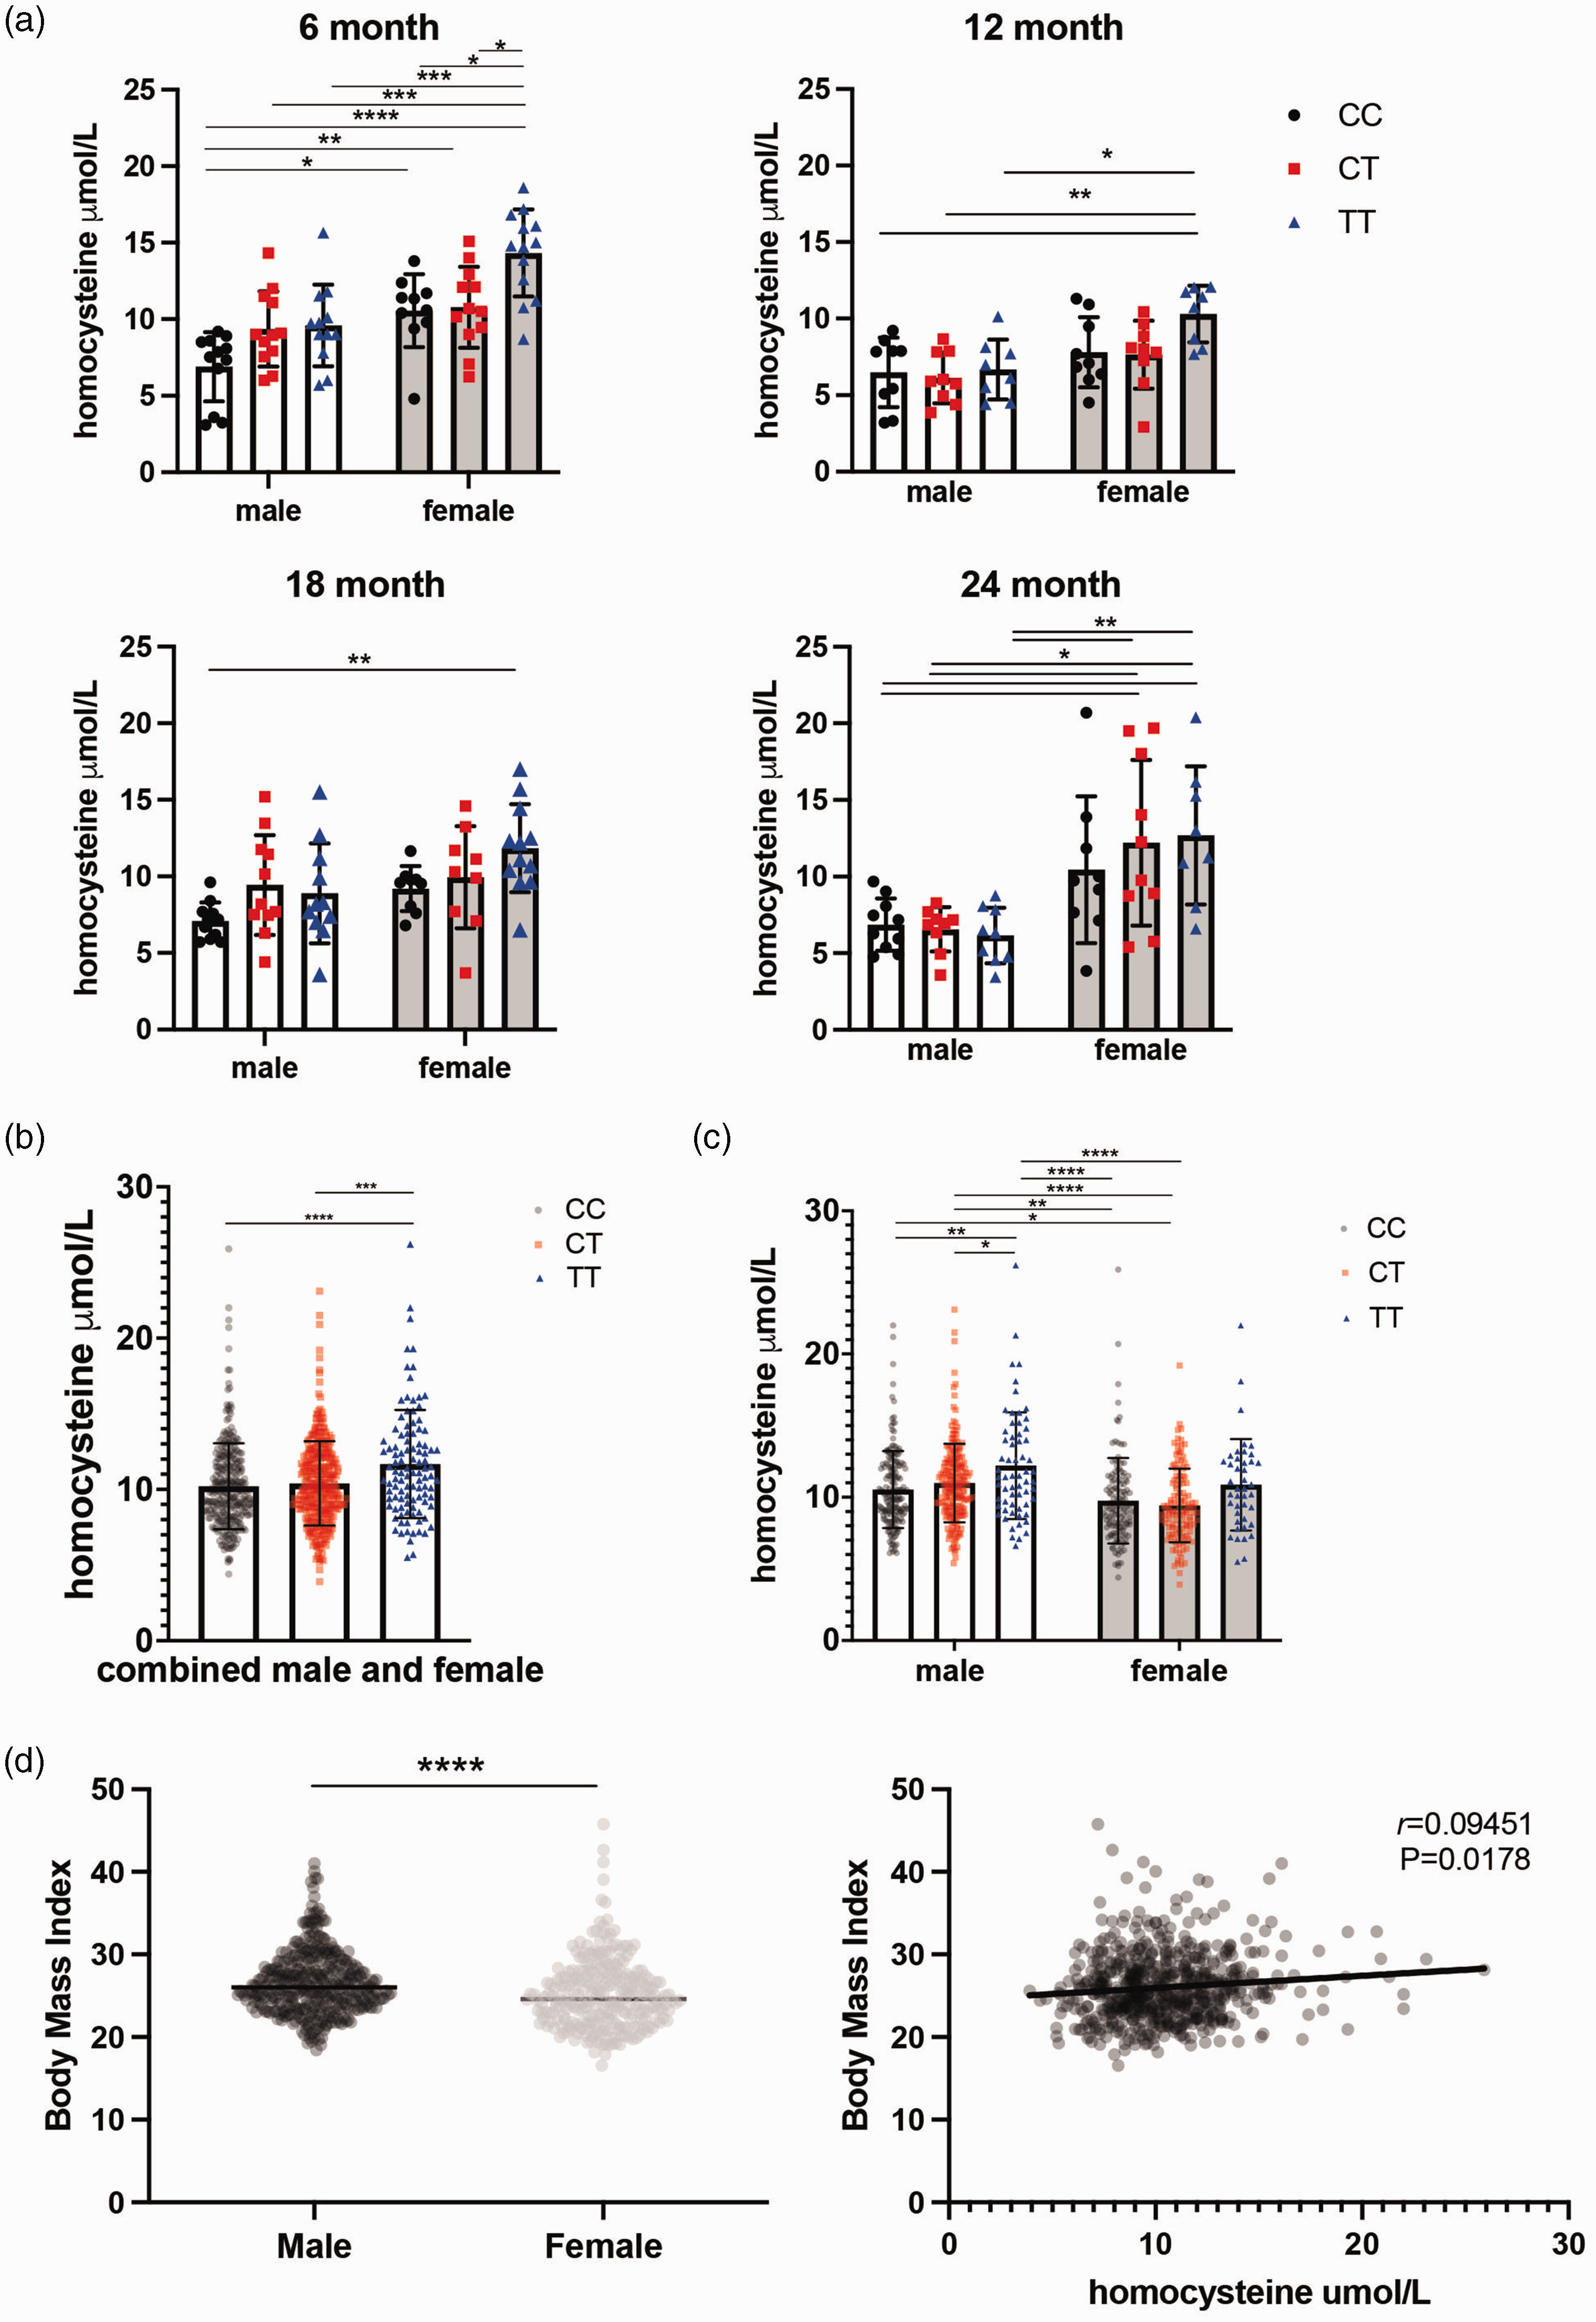
Plasma homocysteine levels are elevated in Mthfr677C>T mice. (a) Plasma homocysteine levels in MthfrC677T mice at 6, 12, 18 and 24 months of age. At 6 months, homocysteine levels are significantly elevated in a genotype-specific manner. At 12, 18 and 24 months, female mice have significantly elevated homocysteine compared to males within the same age group. (n = 8-12/sex/genotype/age; Two-way ANOVA, Tukey post-hoc for each age group. 6 month P = <0.0001 for sex, P = 0.0002 for homocysteine, 95% CI {−4.494 to −2.058} 12 month P = 0.0005 for sex, 95% CI {−3.302 to −0.9893} 18 month P = 0.0379 for sex P = 0.0114 for homocysteine, 95% CI {−3.031 to 0.09010} 24 month P = <0.0001 for sex, 95% CI {−7.242 to −3.255}). (b) Data from a human cohort (ADNI) demonstrates a similar trend in genotype-driven homocysteine elevation (left; n = 442 males, 296 females: P = <0.0001, Kruskal-Wallis test, Dunn’s post-hoc). (c) When males and females are separated, males drive the trend (right; P = <0.0001 for both sex and genotype, Kruskal-Wallis test, Dunn’s post-hoc) and (d) Overall, males within the cohort have a higher body mass index (BMI) than females (left; n = 369 males, 259 females: P = <0.0001, Mann-Whitney) and there is a modest but significant correlation between homocysteine and BMI within the cohort (right; correlation with activity, P = 0.0178 Spearman r = 0.09451).
Because plasma homocysteine levels showed genotype-dependence, plasma from 3–4 month old mice was assessed for additional metabolites within the folate and methionine pathways. Interestingly, no metabolites showed significant differences between genotypes (Supplementary Figure 2).
Mthfr677C > T reduces enzyme activity in brain
Historically, the effects of null mutations in Mthfr have been studied systemically, but we were interested in examining the role of the 677 C > T variant in the brain, hypothesizing that the immune-privileged central nervous system could be more susceptible to variant-induced damage. Published brain RNA-seq data show Mthfr is expressed at low levels in numerous cell types in mouse brain, with the highest expression being in microglia/macrophages, oligodendrocyte precursors and endothelial cells in adult mice (Figure 3(a)). 62 Similarly, available single-cell RNA-seq data show Mthfr is expressed in the majority of mouse brain cell types assessed but most strongly in arterial smooth muscle cells (aSMC), fibroblasts and a subset of endothelial cells but interestingly, contrasting with the brain RNA-seq data, little to no expression was detected in oligodendrocytes (Figure 3(b)).63,64 These data support a complex role for MTHFR in the brain, potentially independent of previously established peripheral/systemic roles.
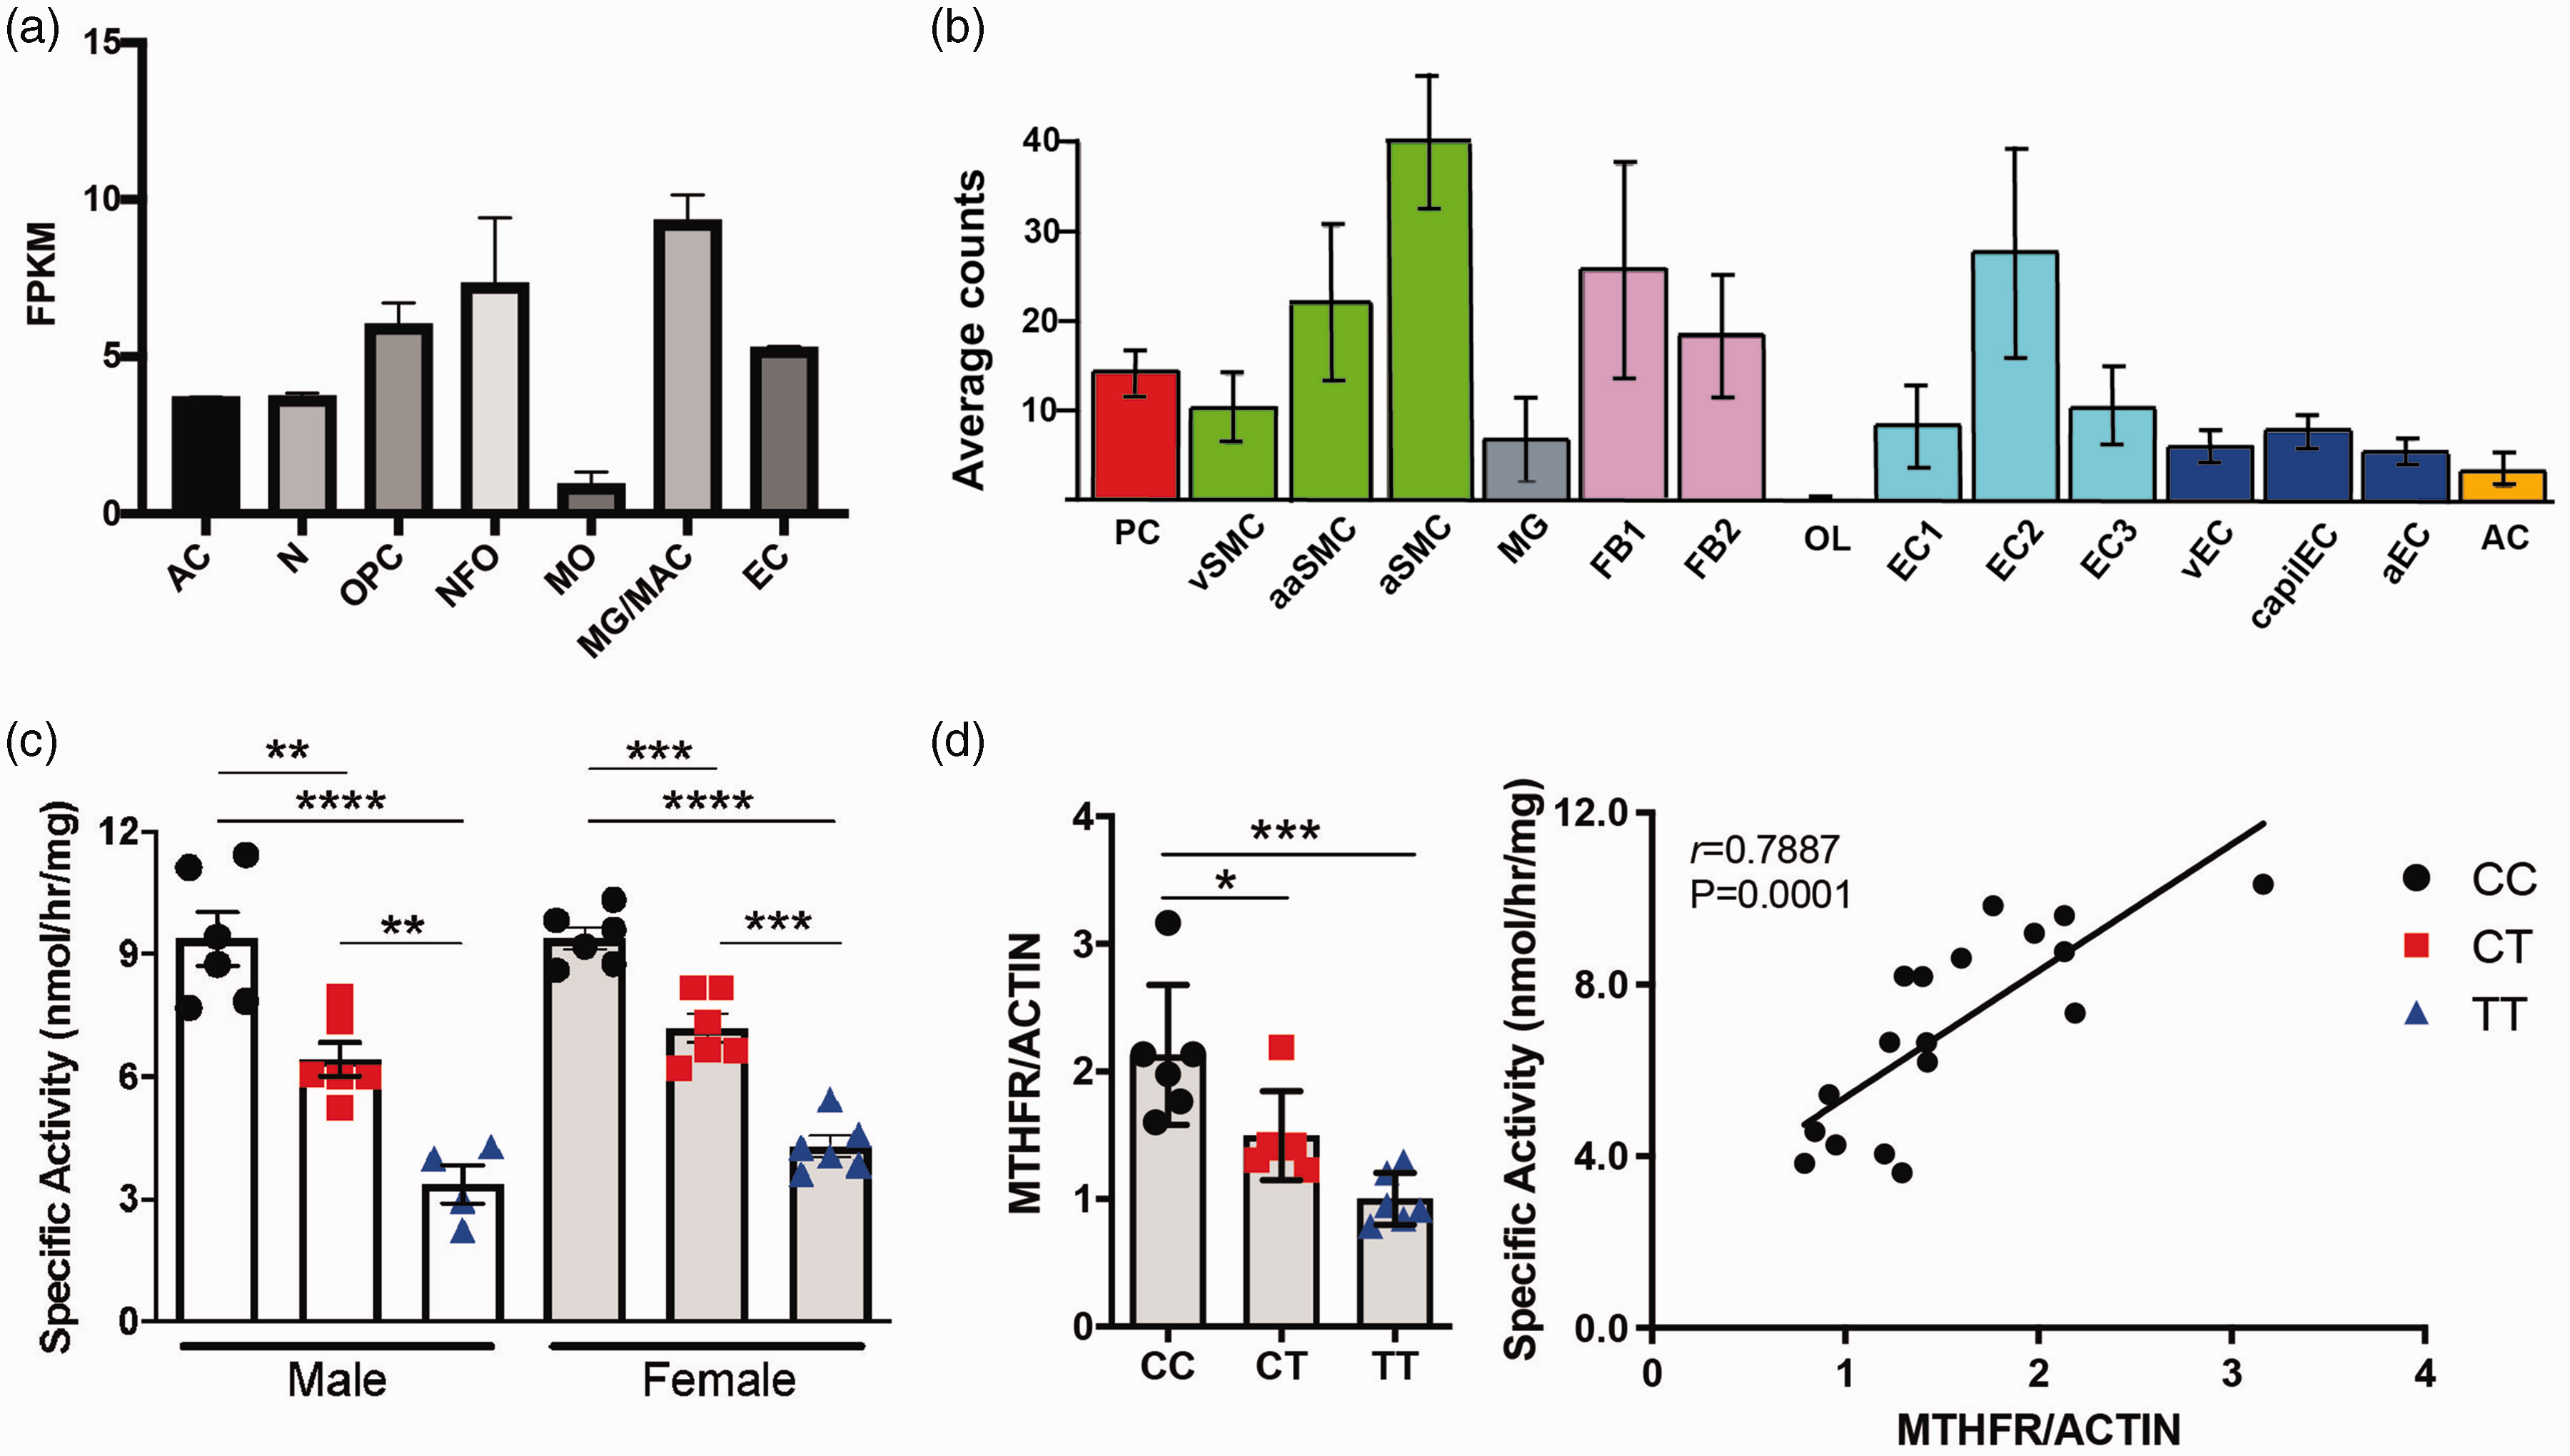
Mthfr677C>T mice show reduced enzyme activity in brain. (a) Numerous cell types in the brain express Mthfr. Data obtained from the Brain RNA-seq database. (b) Single cell sequencing showing expression of Mthfr in cerebrovascular and perivascular cells. Data obtained from the Single-Cell RNA-seq Gene Expression Data. AC = astrocytes, N = neurons, OPC = oligodendrocyte precursor cells, NFO = newly formed oligodendrocytes, MO = myelinating oligodendrocytes, MG = microglia, MAC = macrophages, EC = endothelial cells, PC = pericytes, vSMC = venous smooth muscle cells, aaSMC = arteriolar smooth muscle cells, aSMC = arterial smooth muscle cells, FB1 = fibroblast-like type 1, FB2 = fibroblast-like type 2, OL = oligodendrocytes, EC1 = endothelial cell type 1, EC2 = endothelial cell type 2, EC3 = endothelial cell type 3, vEC = venous endothelial cells, capilEC = capillary endothelial cells, aEC = arterial endothelial cells. (c) MTHFR enzymatic activity measured in brain tissue. Both males and females show significantly reduced activity based on genotype (n = 4–6/sex/genotype; P = <0.0001, One-way ANOVA, Tukey post-hoc) and (d) In brains of female mice, total MTHFR is significantly reduced in both the CT and TT groups (left; n = 6/genotype; P = 0.0002, Kruskal-Wallace test). Enzymatic activity is correlated with MTHFR protein expression (right; correlation with activity, P = 0.0001 Pearson r = 0.7896).
MTHFR activity in brains from 3–4 month old mice demonstrated a similar genotype-based reduction in activity as seen in liver, in both males and females (Figure 3(c)). Brain extracts from 3–4 month old female Mthfr677C > T mice were assessed by Western blot using actin as a loading control. Unlike data from the liver, MTHFR protein expression was reduced in a genotype-specific manner in the TT brain tissue, suggesting that the 677 C > T variant may produce enhanced effects in the central nervous system compared to the liver. Full images are shown in Supplementary Figure 1. Again, there is good correlation between MTHFR activity and expression (Figure 3(d)).
Together, these data show that Mthfr677C > T decreases MTHFR protein expression and enzyme activity in the brain suggesting it may play distinct roles in the brain and periphery.
Mthfr677C > T promotes reduced cerebral blood perfusion
Because we observed metabolic changes in Mthfr677C > T brain, plasma and liver, we next determined whether these effects were sufficient to induce cerebrovascular deficits. In human studies the 677 C > T variant is associated with increased risk for vascular inflammation and alterations to blood flow. Therefore, to quantify the regional changes in brain perfusion, we performed in vivo PET/CT imaging using 64Cu-PTSM, and autoradiography (autorad) was used to confirm the findings (Figure 4(a)). Two statistical approaches – principal component analysis (PCA) and MANOVA – were used to identify significant changes in blood flow, which collectively showed differences based on genotype. PCA compared sex, genotype and age and determined thirteen brain regions that explained 80 percent of the variance in blood flow in all mice and all conditions (Figure 4(b)). Results demonstrating specific regional statistics by MANOVA are listed in Supplementary Table 1. Interestingly, 6 month old mice showed reduced perfusion overall compared to 18 month old mice. While some regions showed a reduction in blood perfusion within both CT and TT mice, a number of regions showed a prominent reduction in the CT group only (Figure 4(b)). Several regions that showed reduced blood perfusion in a genotype-dependent manner are involved in memory, learning, sensory and motor function.
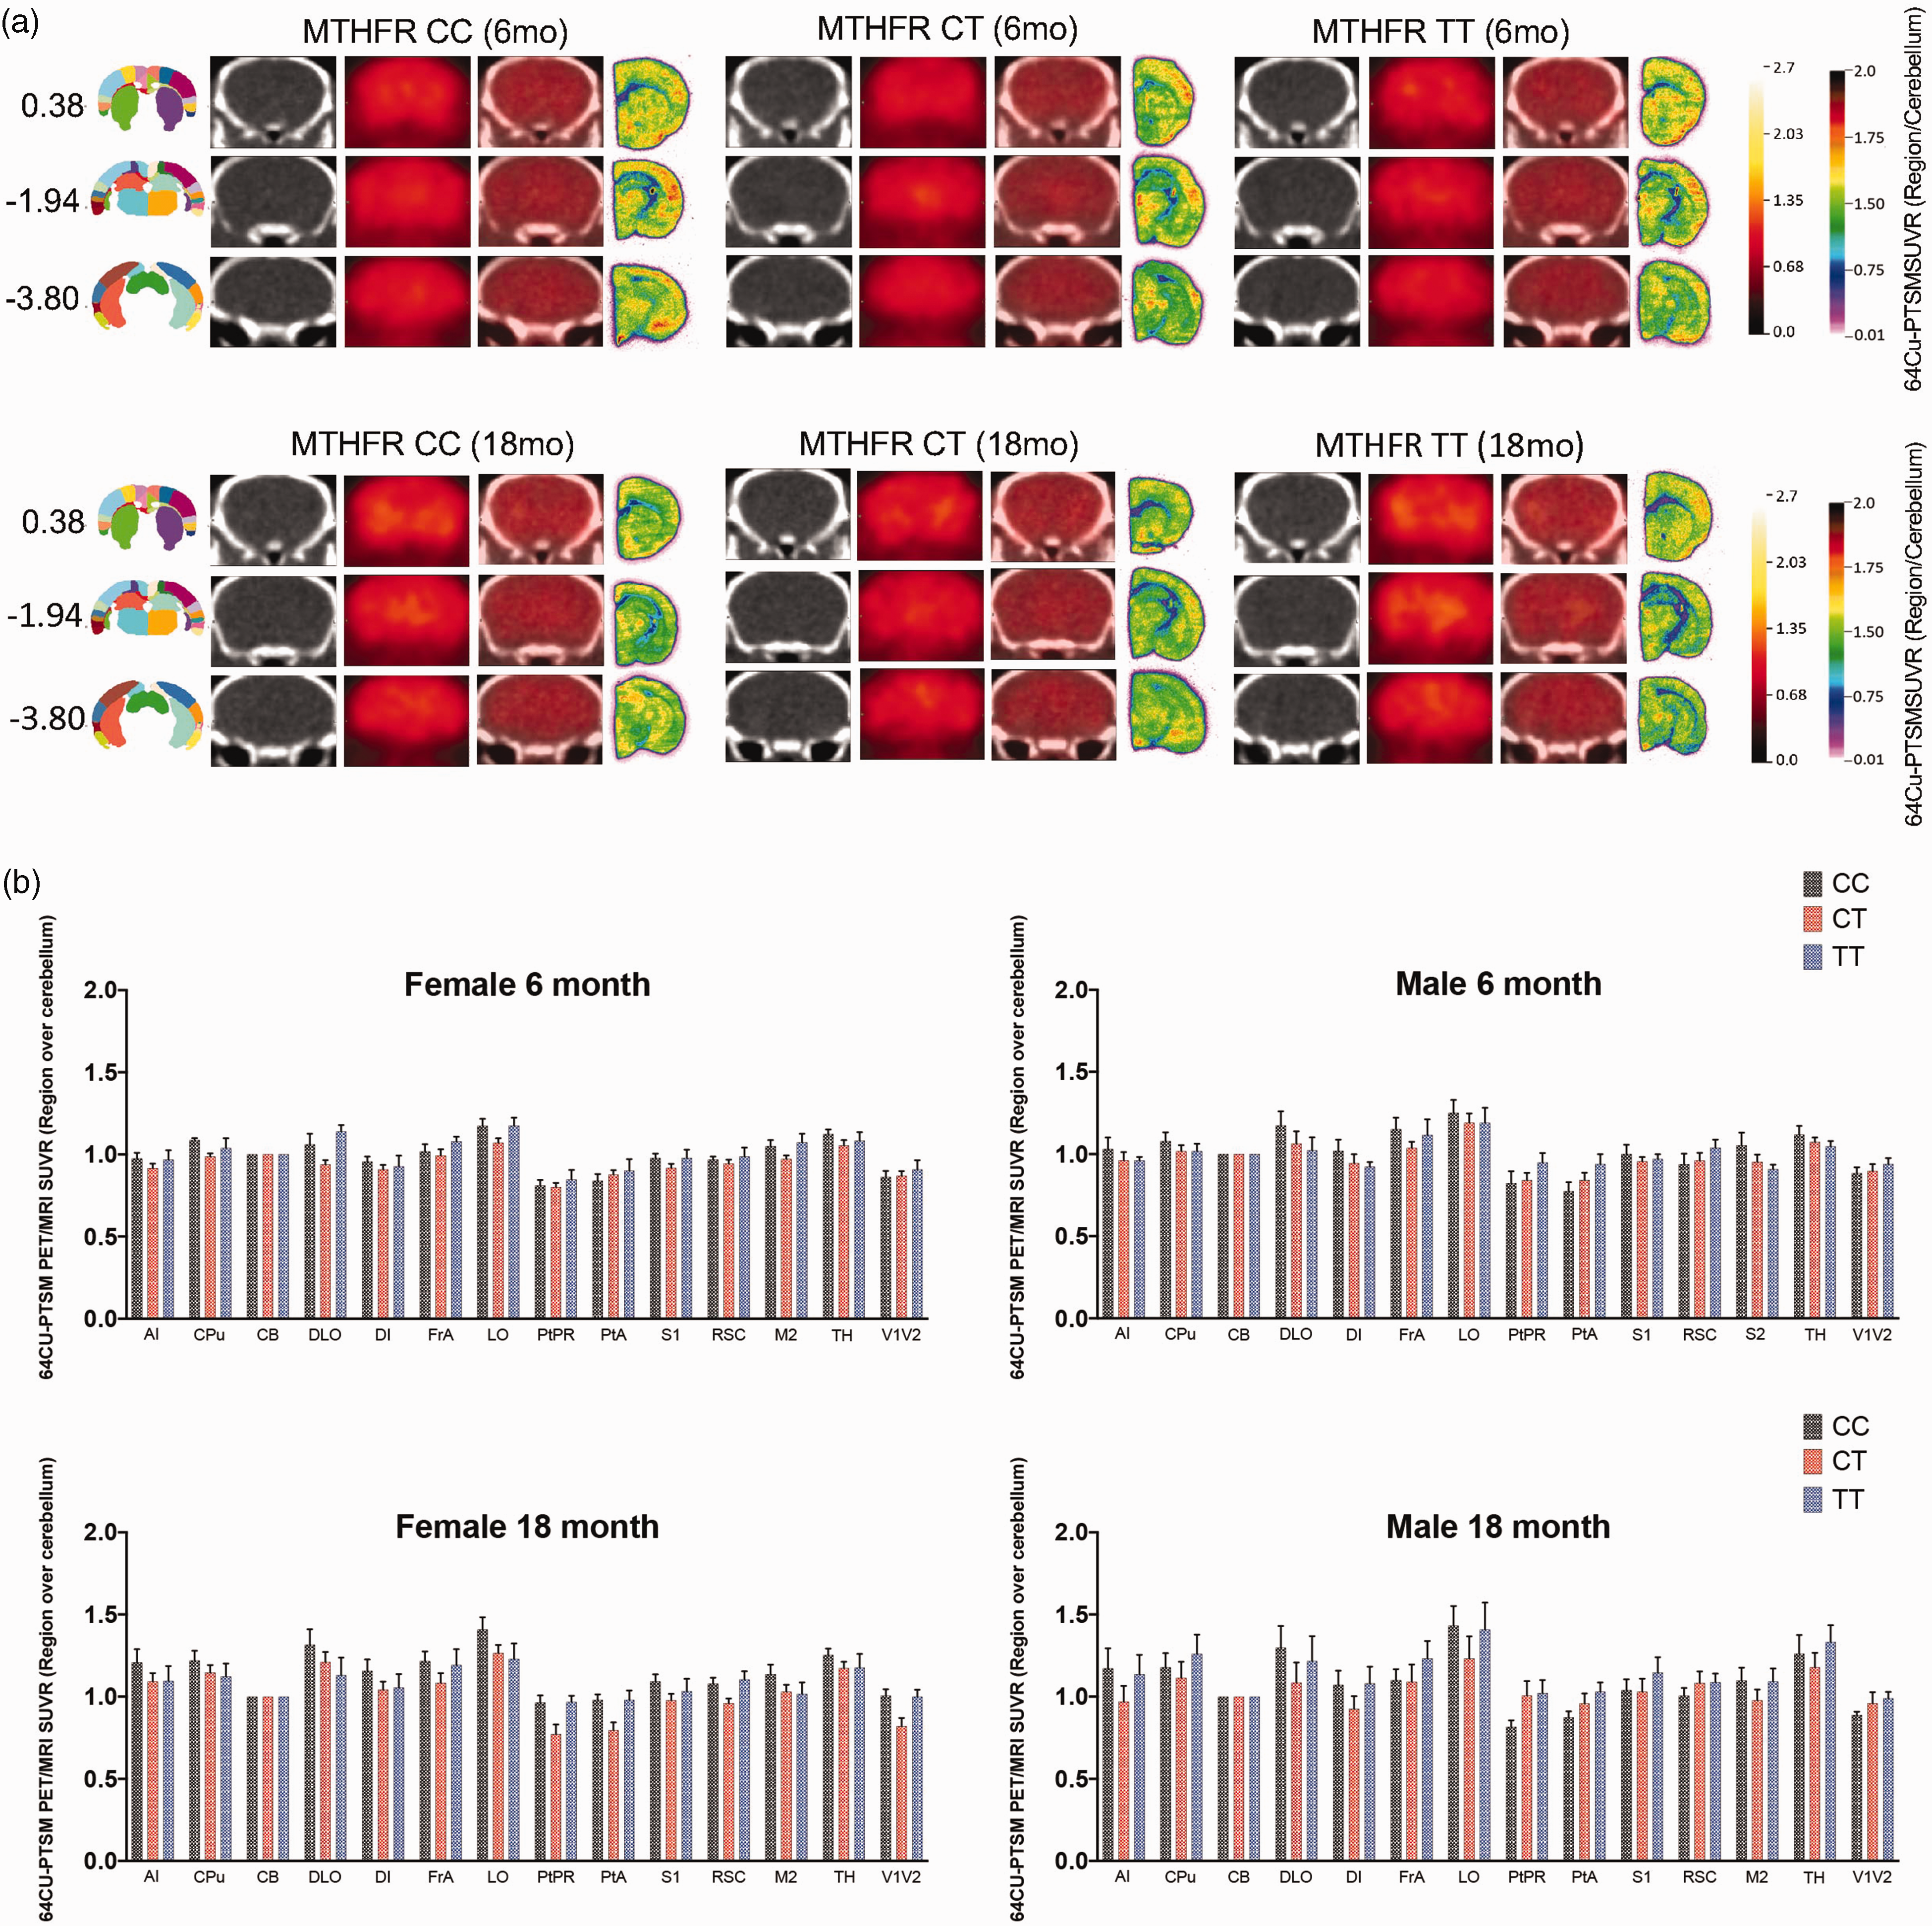
Mthfr677C>T mice show a reduction in cerebral perfusion by PET/CT. (a) Representative images are shown from mice at 6 and 18 months of age. From right to left, the anatomical location of the image as determined by the Allen Mouse Brain Atlas, CT images showing clear locations of identifiable brain structures, PET images showing changes in blood perfusion via tracer concentration, the overlay of the PET and CT, and finally autorad demonstrating radioactive decay on the far right (n = 6/sex/genotype/age) and (b) 13 brain regions were determined by principal component analysis to explain 80% of the variance in blood flow within all mice. Data is presented as brain regions normalized to the cerebellum. Regional abbreviations are as follows: Agranular Insular Cortex (AI) Caudate putamen (CPu) Cerebellum (CB) Dorsolateral orbital cortex (DLO) Dysgranular Insular Cortex (DI) Frontal Association Cortex (FrA) lateral orbital cortex (LO) Parietal Cortex (PtPR) Primary Somatasensory Cortex (S1) Retrosplenial Dysgranular Cortex (RSC) Secondary Somatasensory Cortex (S2) Thalamus (TH) Visual Cortex (V1V2).
Immunohistochemistry and electron microscopy reveal cerebrovascular deficits in Mthfr677C > T mice
Given the expression of Mthfr in multiple vascular related cells including endothelial and smooth muscle cells, and the reduction in blood flow by PET, two key components of the BBB were assessed by immunohistochemistry. Examination of endothelial-associated basement membrane protein Collagen IV (ColIV) and the astrocyte marker GFAP in the frontal, somatosensory and visual cortex revealed genotype-dependent phenotypes (Figure 5(a)). Analysis of ColIV volume per image demonstrated that vascular density was not significantly altered in the visual or somatosensory regions due to sex or age, but a trend of reduced density was observed in both CT and TT mice. However, ColIV+ vascular density was significantly reduced in the frontal cortex of 6-month old CT and TT mice but did not reach significance at 18 months (Figure 5(b)). Analysis of GFAP+ astrocyte volume per image showed a significant increase in astrocyte density in the visual and frontal cortical regions of TT males, with a genotype-specific trend in 6 month old females (Figure 5(c)). All 18 month old groups demonstrated higher numbers of GFAP-expressing astrocytes at baseline, but also showed a genotype-specific trend, suggesting increased astrocyte reactivity in regions with lower vascular density. Iba-1+ microglia as well as PDGFRβ+ pericytes were also counted in the same cortical regions (Supplementary Figure 3a). CT and TT mice consistently show increased numbers of microglia, with significance reached in the visual cortex of 6 month old males, the frontal cortex of 18 month old males and the somatosensory cortex of 18 month old males and females. (Supplementary Figure 3b.) Inversely, CT and TT mice consistently show decreased numbers of pericytes, with significance reached in the frontal cortex of 6 month old females and the visual cortex in 18 month old females (Supplementary Figure 3c).
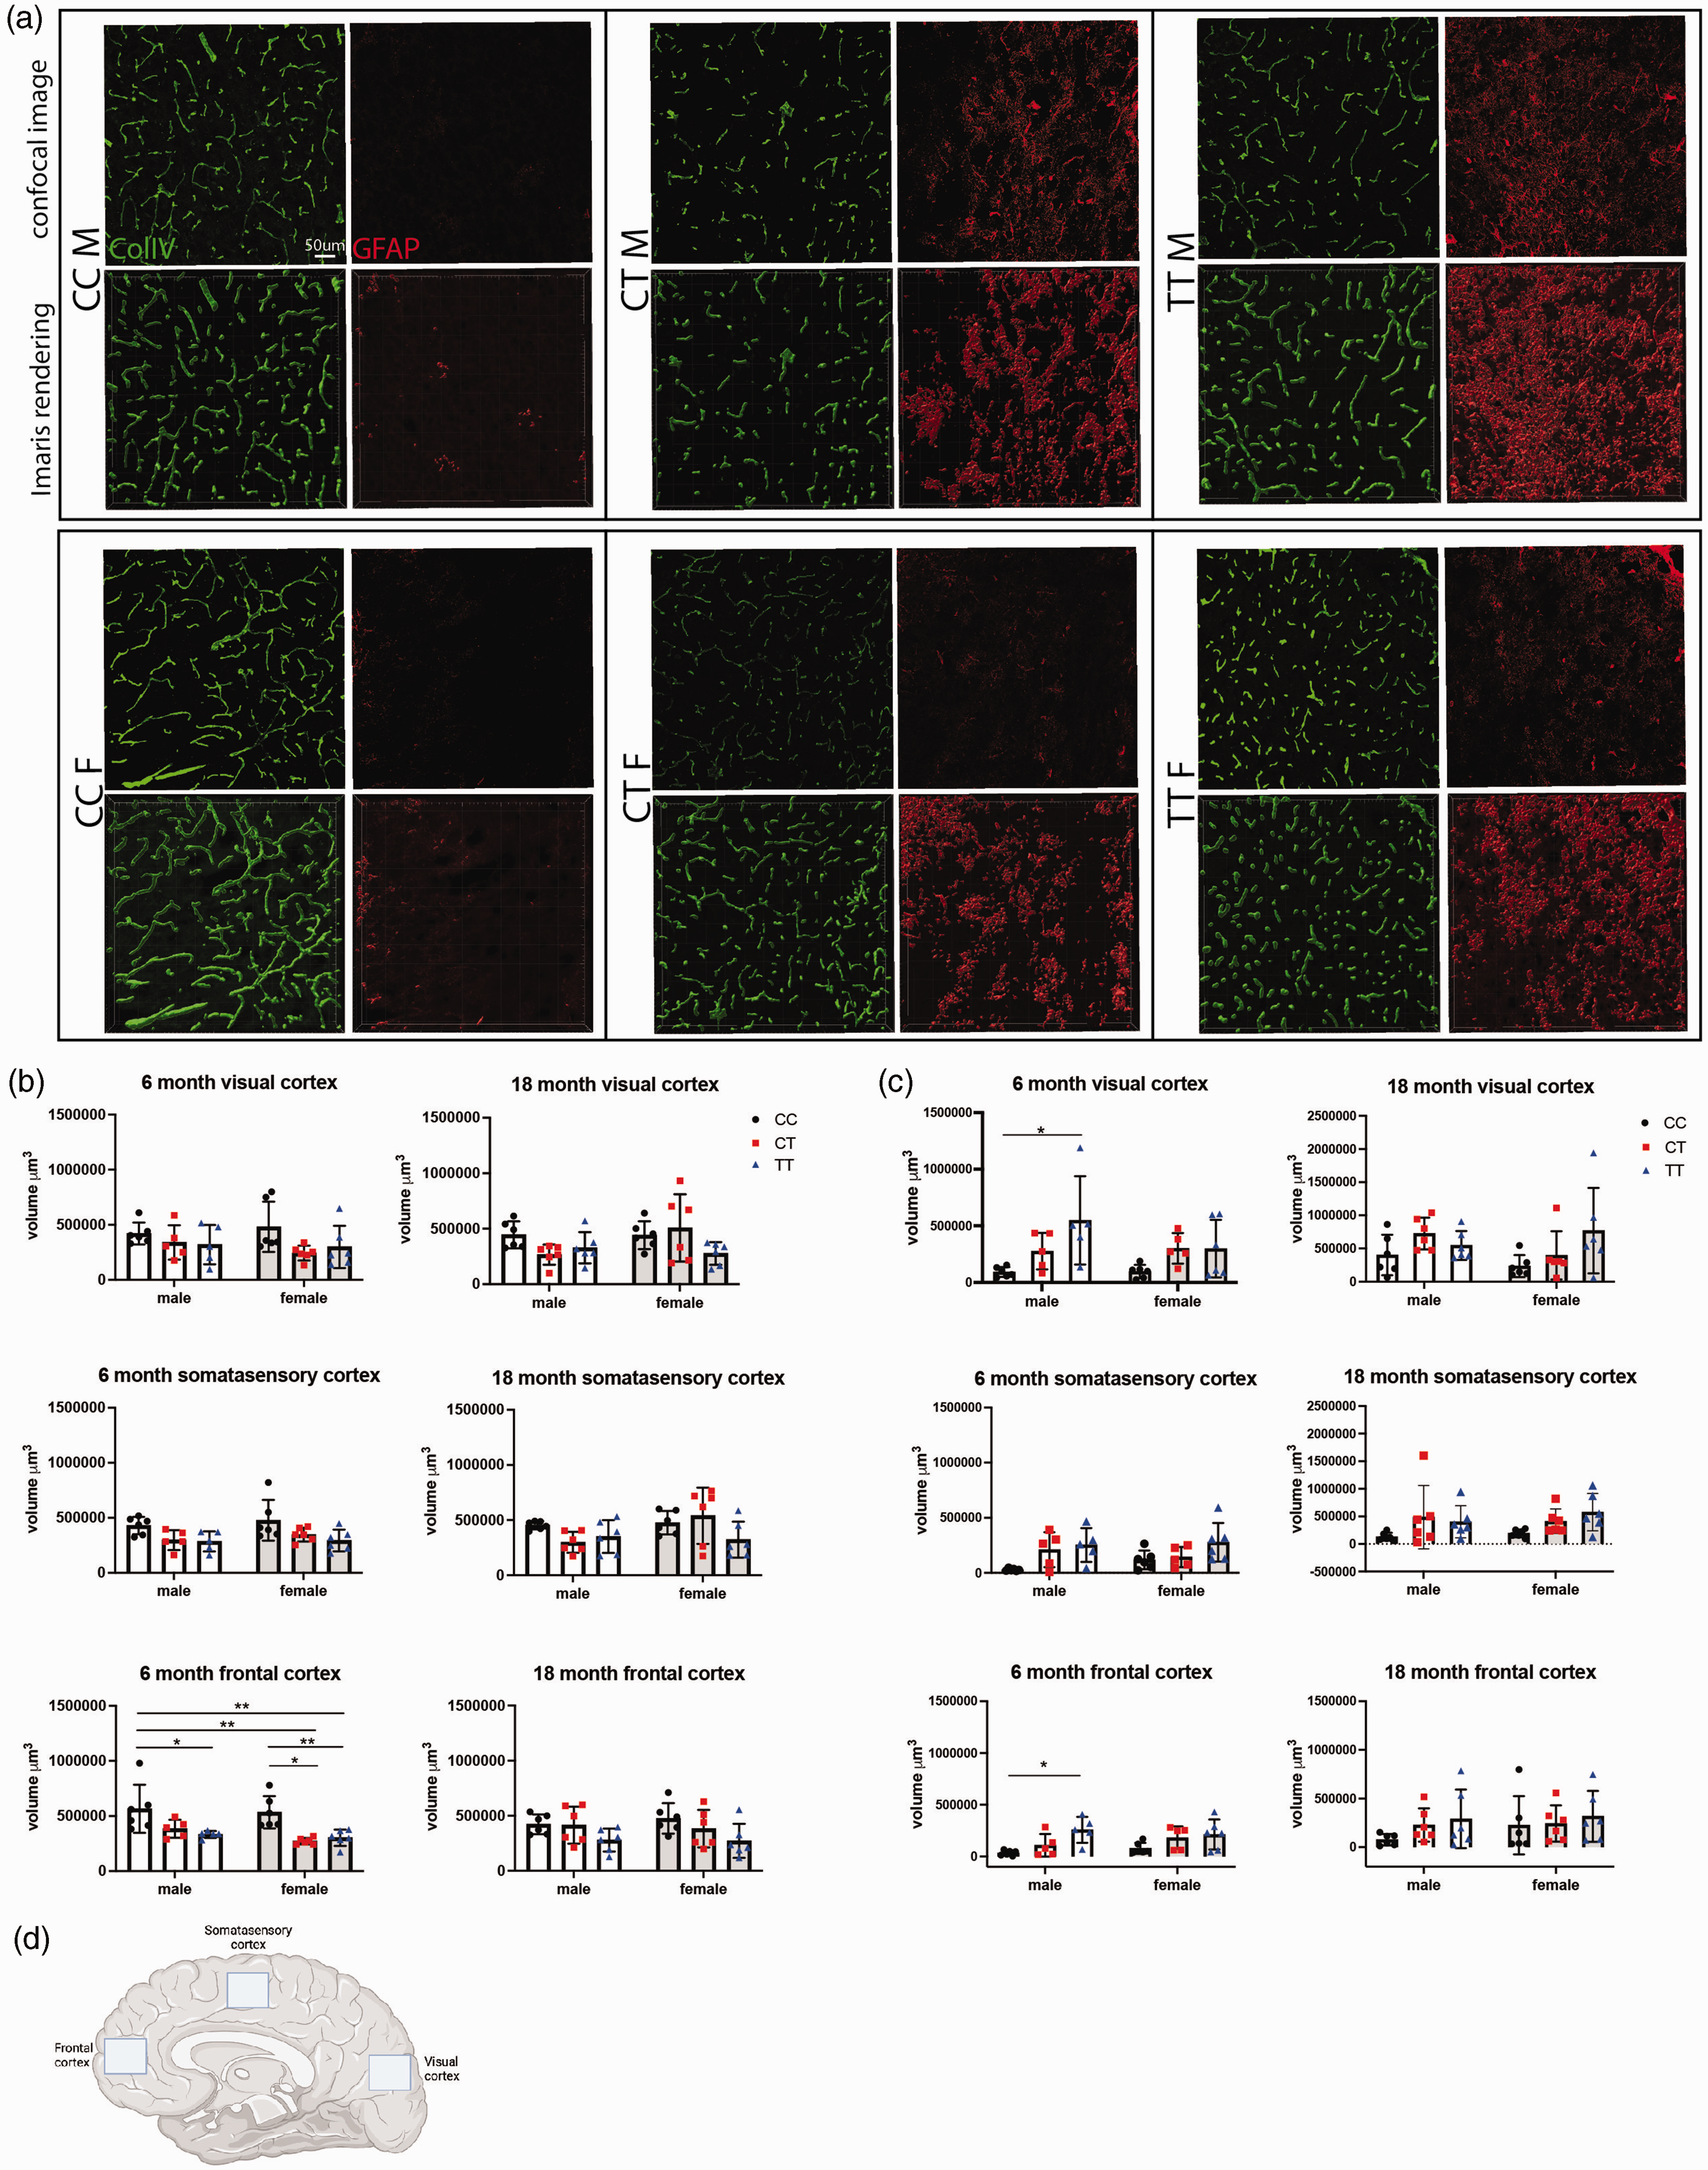
Cerebrovascular density is reduced and GFAP expression increased in Mthfr677C>T mice. (a) From right to left, representative confocal images of immunolabeled Collagen IV-expressing vascular basement membrane, GFAP-expressing astrocytes, and their respective Imaris renderings in 6 month male and female mice from each genotype. (b) Vascular density was assessed in 3 regions of the cortex at 6 and 18 months of age. The volume of ColIV per image was calculated using Imaris software and the sum of the volume/image was used for analysis. 6 month old males and females show significantly reduced vascular volume in the frontal cortex of TT or both CT and TT mice, respectively (n = 6/sex/genotype/age; P = <0.0001 for genotype, 95% CI {−36337 to 89790} Two-way ANOVA, Tukey post-hoc). (c) Astrocyte expression of GFAP was assessed in the same set of images using the same protocol for Imaris analysis. In 6 month old males, there was a significant increase in GFAP-expressing astrocytes in both the visual cortex and the frontal cortex (n = 5–6/sex/genotype/age; visual cortex P = 0.0026 95% CI {−73800–220053}, frontal cortex P = 0.0012 95% CI {−98179 to 48259}, Two-way ANOVA, Tukey post-hoc) and (d) Schematic representing the three locations within the sagittal brain sections that images were taken. Created with BioRender.com
Vascular morphology was further assessed in cross sections of cortical cerebrovasculature from Mthfr677C > T mice at 6 months of age using electron microscopy (Figure 6). Overall, CC mice of both sexes demonstrated healthy vasculature, including presence of endothelial cells surrounding an open lumen. CT and TT mice, however, often showed vessels with a closed or missing lumen, possibly because of either cell loss, or a thickened basement membrane or tunica intima. Additionally, we identified numerous instances of degenerating cells (likely either endothelial cells or pericytes identified by morphology) with an apoptotic phenotype. Furthermore, balloon-like structures that stained only faintly with osmium tetroxide often encircled vessels and are characteristic of swollen astrocytic endfeet. 65 These features were frequently associated with an increased number of activated microglia/monocytes, characterized by high electron density, large rough endoplasmic reticulum, and visibly engulfed cell components, suggesting that these microglia/monocytes were phagocytic when near vasculature. While some samples from mice with CT or TT genotypes contained only one notable abnormality, most contained multiple abnormalities.
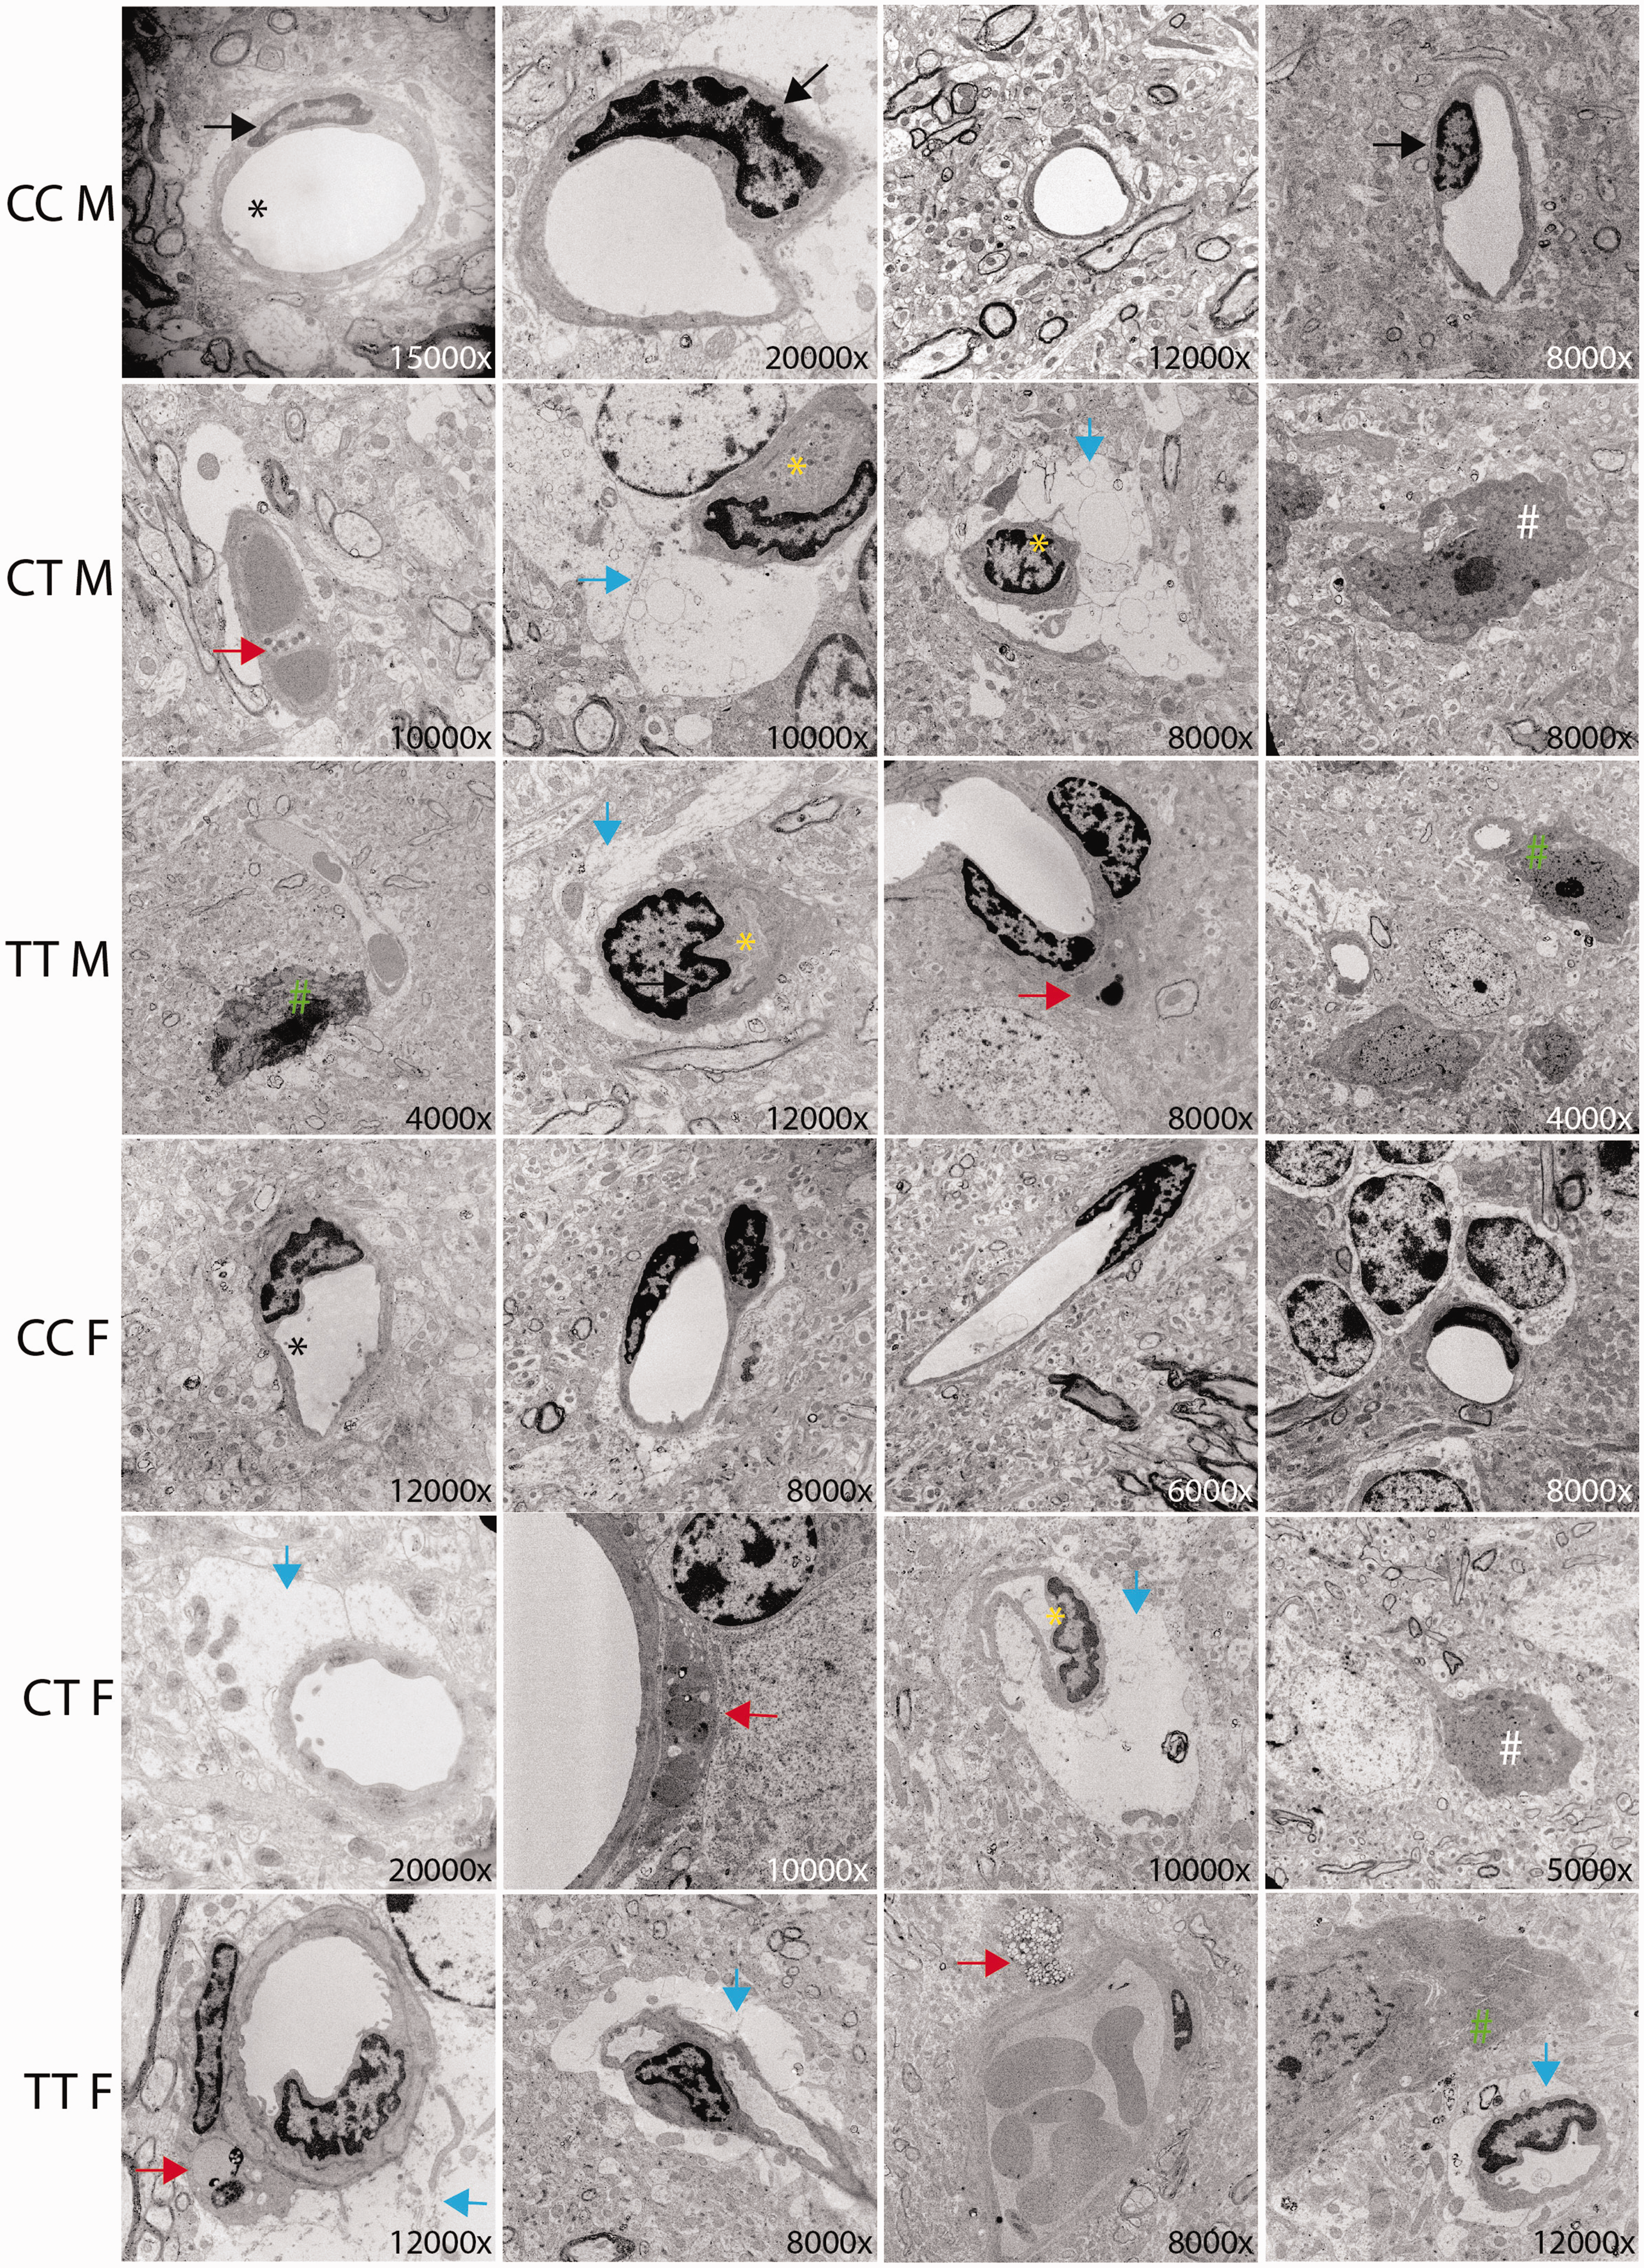
Mthfr677C>T mice demonstrate ultrastructural cerebrovascular deficits in cortex. Cerebrovascular ultrastructure in cortex is visualized using electron microscopy. Images are representative of typical vascular features from each genotype. Magnification is noted in the bottom right corner of each image. Relevant features are noted in the figure by arrows, asterisks, and hashtags including: Black arrow = endothelial cell, Black asterisk = open lumen, yellow asterisk closed lumen, red arrow = cells going through apoptosis, blue arrow = swollen astrocyte endfeet, white hashtag = significant presence of microglia, green hashtag = microglia interacting with a vessel (n = 3/sex/genotype).
Discussion
With an increased focus on vascular contributions to dementias, there is a clear need to increase the number of human-relevant genetic-based mouse models that recapitulate endophenotypes of VCID. In this study we demonstrated that Mthfr677C > T mice phenocopy outcomes observed in humans carrying MTHFR677C > T and identify novel cerebrovascular phenotypes. Depending on ethnicity and geographic location, up to 40 percent of people can be heterozygous and up to 20 percent can be homozygous for the T risk allele. 14 Therefore, it is likely that the 677 C > T variant alone does not promote pathology that directly results in cognitive decline. Baseline cerebrovascular dysfunction may decrease resilience and increase susceptibility when additional genetic and/or environmental risk is introduced. In order to better understand disease initiation and progression, it is critical to consider how multiple systems work in tandem to generate pathology. To this end, MODEL-AD is focused on combining known variants such as APOEE, 4 TREM2R47H and Mthfr677C > T and introducing alternative diets commonly consumed in the western world.
Recapitulating human data, we observed MTHFR enzymatic deficiency in the liver as well as an increase in plasma homocysteine. Future studies will assess MTHFR enzyme activity in Mthfr677C > T leukocytes to confirm human relevance. Total MTHFR protein in the liver was not significantly different based on genotype, but the ratio of the inactive phosphorylated MTHFR isoform (P-70) to the activated non-phosphorylated isoform (70) was genotype-dependent. We speculate that the activated form may be increased in TT mice to compensate for the reduction in enzyme activity. Interestingly, homocysteine levels were significantly elevated in the 6 month old female CT and TT mice but this was not sustained with age. Similar effects have been reported in human studies. 66 It is possible that Mthfr677C > T exerts its greatest effect during development or early life and compensatory mechanisms appear with age. Female mice consistently had higher homocysteine levels than males, regardless of genotype or age. However, data from the ADNI human cohort suggests that in humans, men have slightly higher levels of homocysteine overall as well as significant genotype specific homocysteine elevation. When BMI was stratified by sex, we see that men within the cohort have higher overall BMIs than women. Mthfr677C > T mice are fed a balanced diet with low-fat composition, while diet is not accounted for in the ADNI cohort. It is plausible that diet and corresponding weight changes may have an effect on plasma homocysteine, but future studies will be required to make this assertion.
Historically, MTHFR polymorphisms (677 C > T and 1298 A > C) have been studied in the context of systemic and reproductive dysfunction.67,68 Mild to moderate hyperhomocysteinemia has been previously implicated as a risk factor for hypertension 69 and cardiovascular disease. 70 Presence of these variants, with and without mildly elevated levels of homocysteine, has been studied in relation to several multifactorial disorders including recurrent pregnancy loss, 71 neural tube defects and congenital anomalies, 72 cancer, 73 glaucoma, and neurodevelopmental disorders, notably autism. 74 However, because the 677 C > T variant has been linked to AD or vascular dementia in multiple GWAS, we hypothesized that it is playing a role specifically in the brain. Compared with controls, MTHFR activity in the brain is significantly reduced in Mthfr677C > T mice, with activity being even lower than activity in the liver. MTHFR deficiency may have more adverse effects in brain because the choline-betaine dependent homocysteine remethylation pathway has reduced baseline activity in brain than in liver, thereby potentially comprising methylation capacity. In addition, this variant is stabilized by folate; since liver has greater folate stores than brain, MTHFR protein from T variant carriers may be less susceptible to degradation in liver compared to brain. Clinical studies have shown that sex-dependent metabolic changes occur in serum and cerebral spinal fluid of AD patients75,76 so disparities in this study may represent an unexplored avenue for sex-dependent metabolism in the brain.
Mthfr677C > T mice demonstrated brain region-specific reduction in perfusion including the Dorsolateral Orbital Cortex (DLO), Lateral Orbital Cortex (LO) and Dysgranular Insular Cortex (DI). In humans, the DLO is important for executive functions including working memory, cognitive flexibility, planning, inhibition, and abstract reasoning. The LO is part of the prefrontal cortex that has extensive connections with sensory areas as well as limbic system structures involved in emotion and memory. The DI is one of the more complex anatomical hubs and mediates a wide variety of brain functions including emotion regulation, learning and memory and social interactions. Therefore, perturbations of tissue perfusion in Mthfr677C > T mice is likely to increase susceptibility to a decline in ADRD-relevant cognitive functioning. The notion that a change in perfusion is altered by the introduction of a single variant emphasizes the role of Mthfr677C > T in regulating vascular function and underlines the concept of additive risk. Subsequent studies will assess cognition and use in-depth MRI to examine brain structure and function to more precisely align findings to specific VCID-relevant diseases.
Regional brain perfusion can be reduced in the brain for a number of reasons, including occlusive pathology, intrinsic cellular dysfunction, reduced neurovascular connectivity/function, as well as fewer vessels overall. TT male and CT and TT female mice show significantly reduced vascular density by immunohistochemistry at 6 months in the frontal cortex, as well as a trend in reduced density within the somatosensory and visual cortices at both 6 and 18 months of age. Because the phenotype appears by 6 months of age and does not appear to be age-related, this suggests a possible developmental difference/delay. It is feasible that aberrant signaling in the brain either disrupts initial vasculogenesis or encourages degeneration following development. GFAP-expressing astrocytes are significantly increased in male TT brains in both the visual and frontal cortices at 6 months and trending in other groups. Further, an increased presence of Iba1-expressing microglia, as well as decreased presence of PDGFRβ-expressing pericytes in CT and TT cortex suggests regional damage. Increased presence of activated astrocytes along with increased microglia in regions where there is a noted reduction in vascular density and pericyte dropout suggests the presence of an inflammatory microenvironment.
Evidence of vascular abnormalities as well as an increased astrocyte and microglial presence in the frontal cortex of CT and TT brains was further corroborated by electron microscopy. A significant number of imaged vessels (determined by morphology and presence of endothelial cells) demonstrated a severely reduced or absent lumen, which could contribute to reduced blood flow. Reduced luminal size may result from thickening of endothelial or mural cell layers, narrowing the diameter, or a dysfunction of these cells’ contractility. While some vascular cells could be experiencing intrinsic dysfunction that cannot be ascertained from ultrastructural imaging, others in CT and TT cortex demonstrated a clear apoptotic phenotype within endothelial cells and pericytes. Loss of endothelial cells and their tight junction proteins has long been associated with damage to the BBB. Cell death increases stress on surrounding endothelial cells to maintain the function of an intact barrier. Pericytes are also critical components of the neurovascular unit and play a key role in the regulation of blood flow, vessel contractility, and inhibition of vesicular transcytosis through endothelial cells. Pericyte dysfunction and dropout has been associated with Alzheimer’s disease in a number of studies77–79 with some demonstrating degeneration by observing pericyte debris in cerebral spinal fluid.77,80
Astrocytes are known to support BBB integrity by maintaining the tight junctions between endothelial cells and supporting connections between neurons and vascular cells at the neurovascular unit.81,82 While they serve a protective role by containing damage, excessive or sustained astrocyte reactivity can contribute to chronic inflammation and neuronal dysfunction.83,84 It is unclear by EM whether the increase in astrocyte endfeet encircling vessels in the cortex of CT and TT mice represents a protective or damaging effect. The observed increase in microglia across brain regions also suggests an inflammatory environment, but again whether microglia are clearing debris from degenerating cells or inducing degeneration when interacting with the vascular cells remains to be determined.
In conclusion, the Mthfr677C > T mouse model demonstrates morphological and functional vascular deficits, enhanced glial cell activity and disrupted metabolism in the brain by 6 months of age. These findings represent a foundation from which to further explore phenotypes induced by the risk variant alone. Given that publicly available transcript data sets (both bulk and single cell) show Mthfr expression in multiple cell types in the brain including microglia, smooth muscle cells, endothelial cells and fibroblasts,61,62 cell type specific approaches will be required. Experiments examining the Mthfr677 > T risk variant under different genetic and environmental conditions are underway. A better understanding of lower-level genetic risk aids in building a more dimensional model to study the complex pathology of Alzheimer’s disease and other neurodegenerative diseases.
Supplemental Material
sj-jpg-1-jcb-10.1177_0271678X221122644 - Supplemental material for The 677C > T variant in methylenetetrahydrofolate reductase causes morphological and functional cerebrovascular deficits in mice
Supplemental material, sj-jpg-1-jcb-10.1177_0271678X221122644 for The 677C > T variant in methylenetetrahydrofolate reductase causes morphological and functional cerebrovascular deficits in mice by Alaina M Reagan, Karen E Christensen, Leah C Graham, Amanda A Bedwell, Kierra Eldridge, Rachael Speedy, Lucas L Figueiredo, Scott C Persohn, Teodoro Bottiglieri, Kwangsik Nho, Michael Sasner, Paul R Territo, Rima Rozen and Gareth R Howell in Journal of Cerebral Blood Flow & Metabolism
Supplemental Material
sj-jpg-2-jcb-10.1177_0271678X221122644 - Supplemental material for The 677C > T variant in methylenetetrahydrofolate reductase causes morphological and functional cerebrovascular deficits in mice
Supplemental material, sj-jpg-2-jcb-10.1177_0271678X221122644 for The 677C > T variant in methylenetetrahydrofolate reductase causes morphological and functional cerebrovascular deficits in mice by Alaina M Reagan, Karen E Christensen, Leah C Graham, Amanda A Bedwell, Kierra Eldridge, Rachael Speedy, Lucas L Figueiredo, Scott C Persohn, Teodoro Bottiglieri, Kwangsik Nho, Michael Sasner, Paul R Territo, Rima Rozen and Gareth R Howell in Journal of Cerebral Blood Flow & Metabolism
Supplemental Material
sj-jpg-3-jcb-10.1177_0271678X221122644 - Supplemental material for The 677C > T variant in methylenetetrahydrofolate reductase causes morphological and functional cerebrovascular deficits in mice
Supplemental material, sj-jpg-3-jcb-10.1177_0271678X221122644 for The 677C > T variant in methylenetetrahydrofolate reductase causes morphological and functional cerebrovascular deficits in mice by Alaina M Reagan, Karen E Christensen, Leah C Graham, Amanda A Bedwell, Kierra Eldridge, Rachael Speedy, Lucas L Figueiredo, Scott C Persohn, Teodoro Bottiglieri, Kwangsik Nho, Michael Sasner, Paul R Territo, Rima Rozen and Gareth R Howell in Journal of Cerebral Blood Flow & Metabolism
Supplemental Material
sj-xlsx-4-jcb-10.1177_0271678X221122644 - Supplemental material for The 677C > T variant in methylenetetrahydrofolate reductase causes morphological and functional cerebrovascular deficits in mice
Supplemental material, sj-xlsx-4-jcb-10.1177_0271678X221122644 for The 677C > T variant in methylenetetrahydrofolate reductase causes morphological and functional cerebrovascular deficits in mice by Alaina M Reagan, Karen E Christensen, Leah C Graham, Amanda A Bedwell, Kierra Eldridge, Rachael Speedy, Lucas L Figueiredo, Scott C Persohn, Teodoro Bottiglieri, Kwangsik Nho, Michael Sasner, Paul R Territo, Rima Rozen and Gareth R Howell in Journal of Cerebral Blood Flow & Metabolism
Supplemental Material
sj-xlsx-5-jcb-10.1177_0271678X221122644 - Supplemental material for The 677C > T variant in methylenetetrahydrofolate reductase causes morphological and functional cerebrovascular deficits in mice
Supplemental material, sj-xlsx-5-jcb-10.1177_0271678X221122644 for The 677C > T variant in methylenetetrahydrofolate reductase causes morphological and functional cerebrovascular deficits in mice by Alaina M Reagan, Karen E Christensen, Leah C Graham, Amanda A Bedwell, Kierra Eldridge, Rachael Speedy, Lucas L Figueiredo, Scott C Persohn, Teodoro Bottiglieri, Kwangsik Nho, Michael Sasner, Paul R Territo, Rima Rozen and Gareth R Howell in Journal of Cerebral Blood Flow & Metabolism
Supplemental Material
sj-pdf-6-jcb-10.1177_0271678X221122644 - Supplemental material for The 677C > T variant in methylenetetrahydrofolate reductase causes morphological and functional cerebrovascular deficits in mice
Supplemental material, sj-pdf-6-jcb-10.1177_0271678X221122644 for The 677C > T variant in methylenetetrahydrofolate reductase causes morphological and functional cerebrovascular deficits in mice by Alaina M Reagan, Karen E Christensen, Leah C Graham, Amanda A Bedwell, Kierra Eldridge, Rachael Speedy, Lucas L Figueiredo, Scott C Persohn, Teodoro Bottiglieri, Kwangsik Nho, Michael Sasner, Paul R Territo, Rima Rozen and Gareth R Howell in Journal of Cerebral Blood Flow & Metabolism
Footnotes
Funding
The author(s) disclosed receipt of the following financial support for the research, authorship, and/or publication of this article: We would like to acknowledge funding support from the Diana Davis Spencer Foundation (Howell), BrightFocus Foundation (grant no. A2020677F) (Reagan), the Canadian Institutes of Health Research (grant no. PJT173521) (Rozen), National Institute on Aging (grant no.U54AG054345) (MODEL-AD). Collection and sharing of human data used in this study was funded by the Alzheimer’s Disease Neuroimaging Initiative (ADNI) (National Institutes of Health Grant U01AG024904) and DODADNI (Department of Defense award number W81XWH-12-2-0012). ADNI is funded by the National Institute on Aging, the National Institute of Biomedical Imaging and Bioengineering, and through generous contributions from the following: AbbVie, Alzheimer’s Association; Alzheimer’s Drug Discovery Foundation; Araclon Biotech; BioClinica, Inc.; Biogen; Bristol-Myers Squibb Company; CereSpir, Inc.; Cogstate; Eisai Inc.; Elan Pharmaceuticals, Inc.; Eli Lilly and Company; EuroImmun; F. Hoffmann-La Roche Ltd and its affiliated company Genentech, Inc.; Fujirebio; GE Healthcare; IXICO Ltd.; Janssen Alzheimer Immunotherapy Research & Development, LLC.; Johnson & Johnson Pharmaceutical Research & Development LLC.; Lumosity; Lundbeck; Merck & Co., Inc.; Meso Scale Diagnostics, LLC.; NeuroRx Research; Neurotrack Technologies; Novartis Pharmaceuticals Corporation; Pfizer Inc.; Piramal Imaging; Servier; Takeda Pharmaceutical Company; and Transition Therapeutics. The Canadian Institutes of Health Research is providing funds to support ADNI clinical sites in Canada. Private sector contributions are facilitated by the Foundation for the National Institutes of Health (![]() ). The grantee organization is the Northern California Institute for Research and Education, and the study is coordinated by the Alzheimer’s Therapeutic Research Institute at the University of Southern California. ADNI data are disseminated by the Laboratory for Neuro Imaging at the University of Southern California.
). The grantee organization is the Northern California Institute for Research and Education, and the study is coordinated by the Alzheimer’s Therapeutic Research Institute at the University of Southern California. ADNI data are disseminated by the Laboratory for Neuro Imaging at the University of Southern California.
Acknowledgements
We would like to thank Amanda Hewes and Melanie Maddocks for their day-to-day support, and Dylan Garceau, the MODEL-AD team, and JAX’s Genetic Engineering Technologies for development of the Mthfr677C > T model. We thank Todd Hoffert of JAX’s Clinical Assessment for establishing an in-house homocysteine assay. We would like to thank Paula Ashcraft and Brandi Wasek (Baylor Scott & White Research Institute) for the analysis of metabolites related to the folate and methionine cycles.
Authors’ contributions
AMR, LCG and GRH conceived the study. AMR established and aged the experimental cohorts, harvested tissue and performed immunohistochemistry, confocal imaging, electron microscopy. KEC and RR performed enzyme activity assays. AAB, KE, RS, LLF, SCP and PRT performed PET/CT. TB performed metabolite analysis. KN provided ADNI raw data. AMR and GRH wrote the manuscript that was edited and approved by all authors.
Declaration of conflicting interests
The author(s) declared no potential conflicts of interest with respect to the research, authorship, and/or publication of this article.
Supplemental material
Supplemental material for this article is available online.
References
Supplementary Material
Please find the following supplemental material available below.
For Open Access articles published under a Creative Commons License, all supplemental material carries the same license as the article it is associated with.
For non-Open Access articles published, all supplemental material carries a non-exclusive license, and permission requests for re-use of supplemental material or any part of supplemental material shall be sent directly to the copyright owner as specified in the copyright notice associated with the article.