
Abstract
This study investigated the influence of acute reductions in arterial O2 content (CaO2) via isovolumic haemodilution on global cerebral blood flow (gCBF) and cerebrovascular CO2 reactivity (CVR) in 11 healthy males (age; 28 ± 7 years: body mass index; 23 ± 2 kg/m2). Radial artery and internal jugular vein catheters provided measurement of blood pressure and gases, quantification of cerebral metabolism, cerebral CO2 washout, and trans-cerebral nitrite exchange (ozone based chemiluminescence). Prior to and following haemodilution, the partial pressure of arterial CO2 (PaCO2) was elevated with dynamic end-tidal forcing while gCBF was measured with duplex ultrasound. CVR was determined as the slope of the gCBF response and PaCO2. Replacement of ∼20% of blood volume with an equal volume of 5% human serum albumin (Alburex® 5%) reduced haemoglobin (13.8 ± 0.8 vs. 11.3 ± 0.6 g/dL; P < 0.001) and CaO2 (18.9 ± 1.0 vs 15.0 ± 0.8 mL/dL P < 0.001), elevated gCBF (+18 ± 11%; P = 0.002), preserved cerebral oxygen delivery (P = 0.49), and elevated CO2 washout (+11%; P = 0.01). The net cerebral uptake of nitrite (11.6 ± 14.0 nmol/min; P = 0.027) at baseline was abolished following haemodilution (−3.6 ± 17.9 nmol/min; P = 0.54), perhaps underpinning the conservation of CVR (61.7 ± 19.0 vs. 69.0 ± 19.2 mL/min/mmHg; P = 0.23). These findings demonstrate that the cerebrovascular responses to acute anaemia in healthy humans are sufficient to support the maintenance of CVR.
Introduction
Carbon dioxide (CO2) and, to a lesser extent, oxygen (O2) are amongst the most potent regulators of cerebral blood flow (CBF) in humans.1,2 Increases and decreases in the partial pressure of arterial CO2 (PaCO2) elicit concomitant changes in CBF,2,3 in order to maintain cerebral tissue “washout” of CO2 and regulate cerebral acid-base balance.4–9 Reductions in the partial pressure of arterial O2 (PaO2) elevate CBF2,3,10 in order to sustain cerebral delivery of O2 (CDO2); 11 while reductions of arterial O2 content (CaO2: anaemic hypoxia) independent of PaO2, also augment CBF12–16 or O2 extraction17,18 such that metabolism is maintained. In short, these homeostatic responses to changes in CO2 and O2 act to regulate conditions appropriate for stable cerebral metabolism.
Relative to reductions of CaO2 independent of PaO2, anaemia is a hallmark of multiple disease states with well-documented cerebrovascular dysregulation, including sickle cell disease19,20 and chronic renal failure.21–23 For example, sickle cell disease increases the risk of stroke, which may be related to a reduction in cerebrovascular vasodilatory capacity19,20,24 secondary to elevations in resting CBF.19,20,24 Similarly, CVR is reduced in chronic kidney disease patients with anaemia concomitant to elevations in resting CBF. 21 While pre-clinical studies have demonstrated that brain parenchymal O2 tension, and CBF responses to hypercapnia are preserved during subacute anaemia in rats through elevated basal CBF, 25 CDO2 is impaired in human chronic kidney disease patients despite similarly increased CBF. 22 Whether the differences in CBF regulation observed with anaemia are related to anaemia per se or a consequence of the disease state underlying said anaemia remains to be determined.
Work in healthy humans assessing the effects of isovolumic haemodilution on functional responses in the peripheral circulation has demonstrated increased endothelium-mediated vasodilation (i.e. brachial artery reactive hyperemia flow-mediated dilation;26,27) and maintained O2 delivery to working skeletal muscles.28,29 Furthermore, in healthy newborn baboons, CVR varies inversely with hematocrit (Hct) after haemodilution and haemoconcentration. 30 Whether the slope of the CBF response to changes in CO2 [cerebrovascular reactivity (CVR)] would be steepened during acute anaemia in healthy humans given the absence of pathology associated vascular dysfunction remains unknown. Based on the aforementioned evidence, anaemia – in the absence of pathology related impairments in vasodilatory signalling 31 – may lead to a steepening of CO2 CVR due to a reduction in haemoglobin (Hb)-mediated nitric oxide (NO) scavenging.26,27,32 Given the complex roles of NO33–36 and cerebral acid-base balance4–9 in cerebrovascular regulation we quantified blood-borne markers of NO uptake/release, cerebral metabolism, and cerebral CO2 washout to provide insight into the influence of anaemia on CVR. We hypothesized that acute experimental haemodilution in healthy humans would increase CBF and CVR, while CDO2, CO2 washout, and cerebral metabolism would be preserved.
Methods
Ethical approval
This study was conducted in the Centre for Heart, Lung and Vascular Health at the University of British Columbia Okanagan and adhered to the standards outlined in the Declaration of Helsinki (except registry in a database) and the Canadian Tri-council Policy Statement for Integrity in Research. Institutional approval was received from the University of British Columbia Clinical Research Ethics Board (CREB ID: H16-01028). All participants provided written informed consent prior to participation in this study.
Participants
Eleven healthy males were recruited to participate in this study (age; 28 ± 7 years: body mass index; 23 ± 2 kg/m2). Participants attended the laboratory at 0600 hr or 1300 hr having abstained from alcohol, caffeine, and exercise for 24 hours, fasted for at least 4 hours, but drank water ad libitum. All participants were free of overt cardiovascular, cerebrovascular, respiratory, neurological, and metabolic disease, and all were non-smokers with no history of smoking, and not taking prescription medicine related to any aforementioned conditions.
Experimental protocol
Participants rested in the supine position upon arrival and were instrumented with radial artery, antecubital vein, and internal jugular vein catheters. Using sterile technique, a 20 G arterial catheter (Arrow, Markham, ON) was advanced into the left radial artery under local anesthesia (Lidocaine, 1.0%). This technique was assisted via ultrasound guidance. A 13 G central venous catheter (Cook Medical, Bloomington, IN) was advanced into the right internal jugular vein under sterile conditions and local anesthesia with ultrasound guidance. The catheter was then advanced up to 15 cm cephalad. 37 The same technique, performed by our group has been previously demonstrated to lead to catheter tip placement in the jugular bulb, superior to the facial vein. 11 Further, correct placement was additionally determined by participants noting a sensation in their ear upon full insertion of the catheter. 37 Fulfilment of these techniques leads to ≤3% contamination by extra-cerebral blood. 37 Finally, an 18 G venous catheter (Insyte™ Autoguard™, Becton Dickinson, USA) was inserted into the median antecubital vein. Following catheterization, the remainder of the monitoring equipment was set-up while the participant then rested quietly for 20 minutes (see below).
Using dynamic end-tidal forcing (DEF), subjects completed a stepwise steady-state hypercapnic test to assess CVR both pre- and post- an isovolumic haemodilution protocol. Following five minutes of steady room-air breathing to assess baseline PETCO2 and PETO2 values, subjects breathed for two minutes with DEF control at baseline end-tidal values. Then PETCO2 was elevated in three sequential step-wise increments to +3, +6, and +9 mmHg PETCO2 above baseline. Each stage of elevated PETCO2 lasted 5-minutes following the attainment of steady end-tidal gases (three breaths within ±1mmHg of target PETCO2) and all cerebrovascular, haemodynamic, cardiorespiratory variables, and arterial blood samples were collected in within the last 1–2 minutes of each stage following attainment of physiologic steady state. 38 Following completion of the test, participants returned to room air breathing.
After pre-haemodilution CVR testing to reduce hematocrit and thereby reduce CaO2, whole blood was transferred into an Anticoagulant Citrate Phosphate Dextrose Solution BLOOD-PACK™ (4R0012MC, Fenwal, USA) through a non-pyrogenic plasma transfer kit (4C2240, Fenwal, USA) to collect up to 450 mL of whole blood per BLOOD-PACK for short term storage at room temperature on an orbital agitator. This blood was replaced with an equal volume of 5% human serum albumin (Alburex® 5%) in two increments that amounted to a total removal and replacement of ∼20% of blood volume. The magnitude of haemodilution was verified by measuring the resulting change in hematocrit. Following haemodilution, CVR was re-conducted (see supplemental Figure 1 for protocol schematic).
Experimental measures
Cardiorespiratory measures
All cardiorespiratory variables were sampled continuously at 1 KHz via an analogue-to-digital converter (Powerlab, 16/30; ADInstruments, Colorado Springs, CO). Heart rate (HR; ADI bioamp ML132), radial artery blood pressures, and jugular venous blood pressures (Truwave Transducer, Edwards Life Sciences) were measured as previously described. 11 The partial pressures of end-tidal CO2 (PETCO2) and O2 (PETO2) were sampled at the mouth and recorded by a calibrated gas analyzer (model ML206, ADInstruments), while respiratory flow was measured by a pneumotachograph (MLT1000L; ADInstruments) paired with a spirometer (FE141; ADInstruments) and connected in series to a bacteriological filter. All data were interfaced with LabChart (Version 7).
Cerebral vascular measurements
Diameter and blood velocity of the right internal carotid artery (ICA) and left vertebral artery (VA) were measured using a 10 MHz multi-frequency linear array duplex ultrasound (Terason uSmart 3300, Teratech, Burlington, MA). Specifically, B-mode imaging was used to measure arterial diameter, while pulse-wave mode was used to concurrently measure blood velocity. Diameter and velocity of the ICA were measured at least 1.5 cm distal to the common carotid bifurcation to eliminate recordings of turbulent and retrograde flow and non-uniform shear. The VA blood velocity and diameter were measured between C4 and C5 or C5 and C6. Care was taken to ensure that the insonation angle (60°) was unchanged throughout each test. Further, upon acquisition of the first ultrasound image (i.e., resting baseline) there was no alteration of B-mode settings to avoid any artificial changes in arterial wall brightness/thickness. All recordings were made in accordance with published technical recommendations.
39
Volumetric blood flow in the ICA and VA were quantified using the following equation:
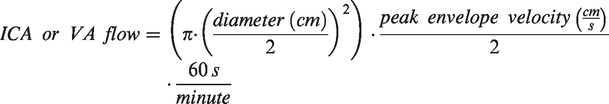
Volumetric global cerebral blood flow (gCBF) was subsequently calculated as:

Blood velocity in the right middle cerebral artery (MCAv) and left posterior cerebral artery (PCAv) were measured using a 2 MHz transcranial Doppler ultrasound (TCD; Spencer Technologies, Seattle, WA). The TCD probe was fixed to a headpiece (model M600 bilateral head frame, Spencer Technologies) and secured into place. The MCA and PCA were insonated through the middle trans-temporal window, using previously described location and standardization techniques. 40
All recordings were screen captured and stored as video files for offline analysis. This analysis involved concurrent determination of arterial diameter and peak blood velocity at 30 Hz, using customized edge detection and wall tracking software (BloodFlow Analysis, Version 5.1) designed to mitigate observer bias. 41
Blood sampling & analyses
For the measurement of arterial blood gases, ∼1.0 mL of radial arterial blood was drawn into a pre-heparinized syringe (SafePICO, Radiometer, Copenhagen, Denmark) and analyzed immediately at 37°C using a commercial blood gas analyzer (ABL90 FLEX, Radiometer). This analysis included measurement of the partial pressure of arterial oxygen (PaO2), PaCO2, arterial oxygen saturation (SaO2), arterial oxygen content (CaO2), [Hb] and Hct. Arterial blood was also analyzed for whole blood viscosity. Arterial blood for viscosity measurement was drawn into a Lithium Heparin Vacutainer® (Becton Dickinson, USA). Blood viscosity was measured in duplicate within 15 min of blood sample acquisition at three shear rates (45, 90, and 225 s−1) at 37.0°C with a temperature controlled cone-and-plate viscometer (Model DV2T; Brookfield Amtek, Middleboro, MA, USA). 42
For NO analyses, arterial and jugular bulb blood samples were drawn into K2EDTA Vacutainers® (Becton Dickinson, USA). Whole blood was then immediately centrifuged at 600 g for 10 minutes at a temperature of 4.0°C. Plasma was aliquoted into cryovials, flash frozen in liquid N2, and stored at −80°C.
Ozone-based chemiluminescence (Sievers NOA™ 280i, Analytix Ltd, Durham, UK) was employed to measure plasma
Statistical analyses
Hematological, blood gas, and cerebral metabolism parameters at rest pre and post haemodilution were compared using two-tailed paired t-tests. Blood gas parameters for the hypercapnia trials pre and post haemodilution were analyzed with linear mixed effects models. Trial (pre/post haemodilution) and stage (baseline, +3, +6, +9 PaCO2) were included as fixed effects while participants were included as a random effect. When significant interaction effects were detected, post-hoc tests were conducted with multiple comparisons adjusted for with the Bonferroni correction.
All CBF (VA flow, ICA flow, & gCBF) and shear stress responses to hypercapnia pre- and post-haemodilution were analyzed with linear mixed effects models (Fixed effects: PaCO2 and pre/post haemodilution; Random effect: participants). When significant interaction effects were detected, post-hoc tests were conducted with multiple comparisons adjusted for with the Bonferroni correction. As the haemodilution protocol would be expected to cause a set-point change in absolute CBF due to the well-established relationships between CaO2, [Hb], and CBF (e.g., Brown et al., 1985), we also analyzed CBF responses by assessing the delta changes in CBF from baseline in each trial. This approach was taken to account for the elevation in CBF that occurred secondary to haemodilution, but prior to the hypercapnia. The change in CBF and shear stress from baseline (i.e. delta values) were compared using linear mixed effects model with trial (pre/post haemodilution) and stage (baseline, +3, +6, +9 PaCO2) as fixed effects. Participants were included as a random effect. When significant interaction effects were detected, post-hoc tests were conducted with multiple comparisons adjusted for with the Bonferroni correction. Further, CVR slopes were calculated using linear regression and compared pre- to post-haemodilution with two tailed paired t-tests.
To support existing literature on the relationships between CBF and: CaO2, Hb, Hct, PaCO2, pH, and CPP, we conducted repeated measures correlations using the rmcorr package for R 45 on those variables at three time points (pre-haemodilution baseline, mid-haemodilution check-point, and post haemodilution baseline), to quantify the intra-individual relationships between those variables and CBF.
To determine whether significant a–v differences and net exchange (uptake/release) of
Linear mixed model analyses were performed with the Statistical Package for the Social Sciences (SPSS, Version 24), t-tests were conducted using Excel (Microsoft, Version 16.16.9), and repeated measures correlations were conducted using R. 46 All figures were generated using GraphPad (Prism, La Jolla, CA, Version 8.1.1). Shapiro–Wilk normality testing of the fundamental stimuli (PaCO2, PaO2, CaO2) and measured responses upon which conclusions were based (ICA flow, VA flow, gCBF), confirmed that the data were normally distributed.
Statistical significance was set a priori at P < 0.05 and actual P values are reported herein (unless P < 0.001).47,48 This invasive study resulted in a relatively small sample size, as such there may be an increased risk of type 2 error, and we conduct multiple comparisons which in itself may predispose to an increased risk of type 1 error; so, in addition to significance testing, individual data are displayed for the sake of transparency and improved ease of data interpretation, of particular utility where sample sizes are low and P-values approach the P = 0.05 cut-off. Data are presented as means and standard deviations.
Results
Baseline, pre and post haemodilution
Intervention parameters
Isovolumic haemodilution reduced Hct (P < 0.001; Figure 1(b)) and [Hb] by 18 ± 2% (P < 0.001; Figure 1(a)). Since PaO2 (P = 0.32; Figure 1(c)) and SaO2 (P = 0.78; Figure 1(d)) were unchanged, the reduction in [Hb] resulted in an 18 ± 2% reduction in CaO2 (P < 0.001; Figure 1(e)). The PaCO2 was not different between pre- and post-haemodilution baselines (P = 0.21; Figure 1(f)), however, haemodilution caused reductions in arterial plasma CO2 content (see supplemental materials for calculations) (P < 0.001), total arterial content of CO2 (CaCO2) (P < 0.001; Figure 1(g)), and arterial [
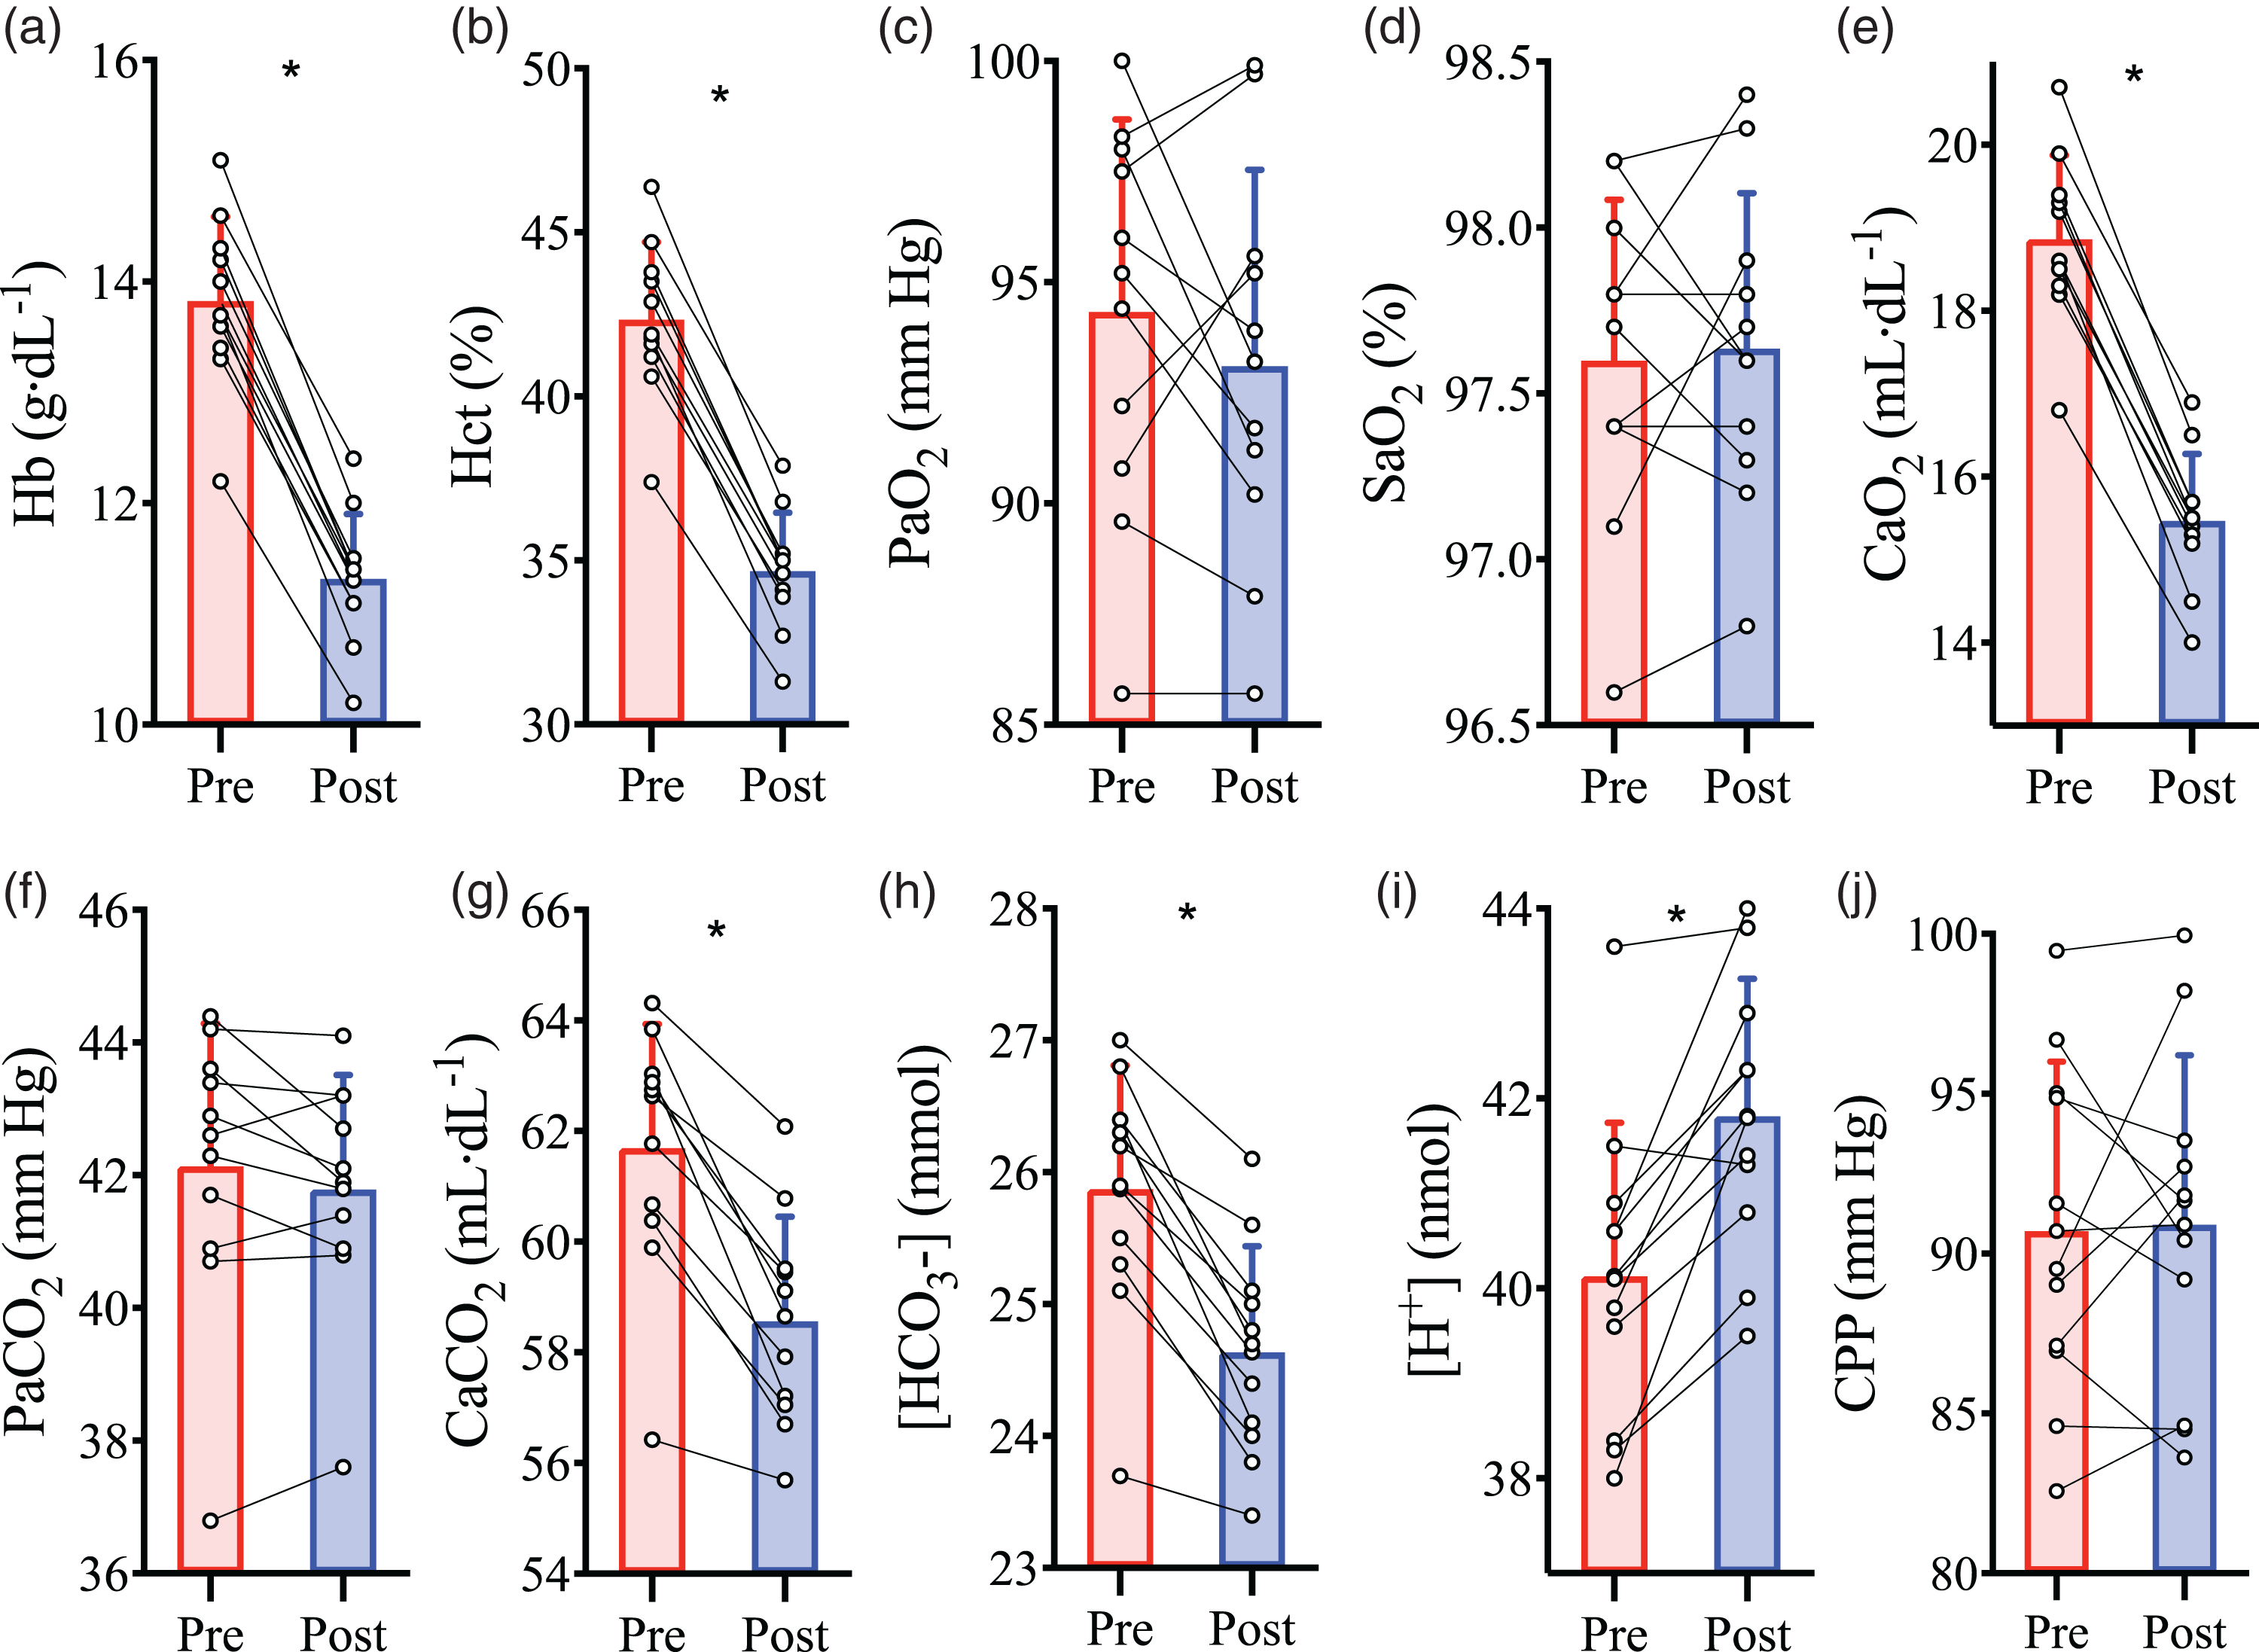
Intervention parameters at baseline prior to and following haemodilution. Pre-haemodilution mean and standard deviation data presented in red, post-haemodilution mean and standard deviation data presented in blue, with individual data overlaid for both. (a) haemoglobin concentration ([Hb]), (b) hematocrit (Hct), (c) partial pressure of arterial O2 (PaO2), (d) arterial oxygen saturation (SaO2), (e) arterial O2 content (CaO2), (f) partial pressure of arterial CO2 (PaCO2), (g) total arterial content of CO2 (CaCO2), (h) arterial bicarbonate ion concentration ([HCO3−]), (i) arterial hydrogen ion concentration ([H+]), and (j) cerebral perfusion pressure (CPP), depicted at baseline pre- and post-haemodilution. Asterisk (*) symbols indicate a change (P < 0.05) from pre to post haemodilution, compared using paired two-tailed t-tests. N = 11.
Cerebrovascular parameters during CVR prior to and following haemodilution.
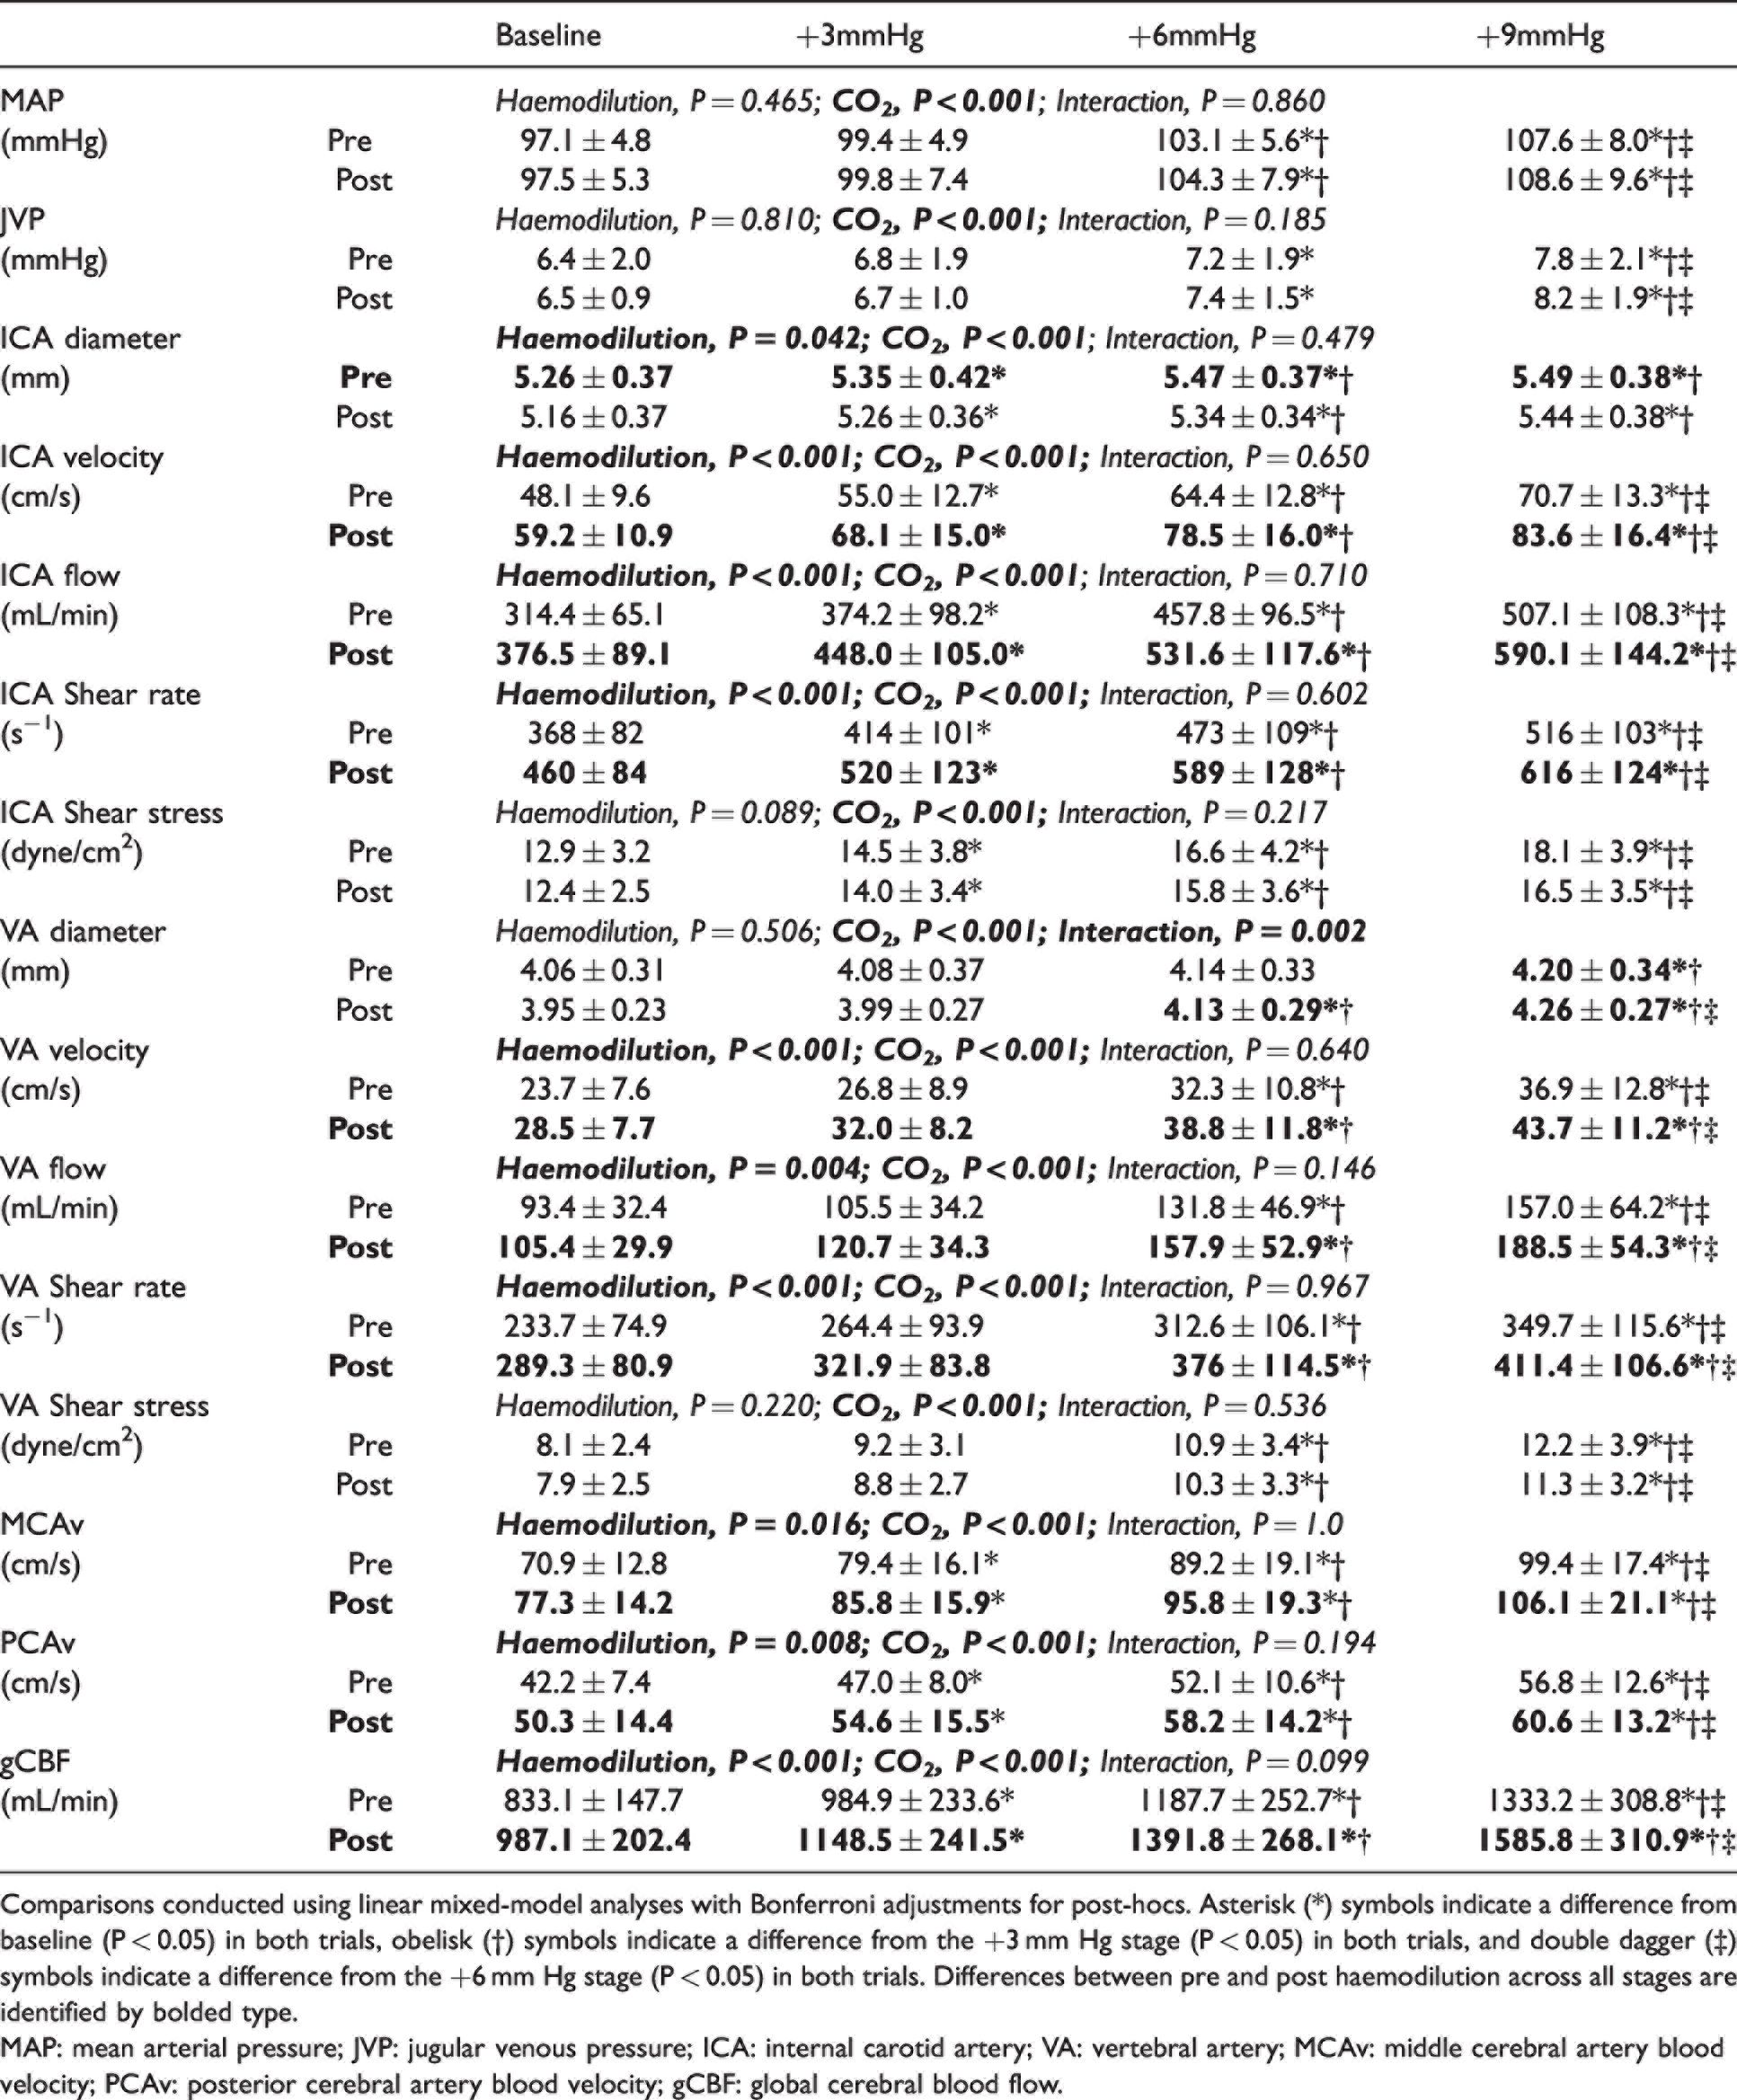
Comparisons conducted using linear mixed-model analyses with Bonferroni adjustments for post-hocs. Asterisk (*) symbols indicate a difference from baseline (P < 0.05) in both trials, obelisk (†) symbols indicate a difference from the +3 mm Hg stage (P < 0.05) in both trials, and double dagger (‡) symbols indicate a difference from the +6 mm Hg stage (P < 0.05) in both trials. Differences between pre and post haemodilution across all stages are identified by bolded type.
MAP: mean arterial pressure; JVP: jugular venous pressure; ICA: internal carotid artery; VA: vertebral artery; MCAv: middle cerebral artery blood velocity; PCAv: posterior cerebral artery blood velocity; gCBF: global cerebral blood flow.
Viscosity, shear rates and stresses
At all measured shear rates, whole blood viscosity was lower following haemodilution (45 s−1; 4.2 ± 0.3 vs. 3.1 ± 0.4 cP, P < 0.001: 90 s−1; 3.9 ± 0.3 vs. 2.9 ± 0.3 cP, P < 0.001: 225 s−1; 3.5 ± 0.2 vs. 2.8 ± 0.2 cP, P < 0.001). Basal ICA and VA shear rates were both higher post-haemodilution (368.2 ± 82.4 vs. 459.5 ± 84.0 s−1, P < 0.001; and 233.7 ± 74.9 vs. 289.3 ± 80.9 s−1, P = 0.004, respectively). The decreased viscosity and increased shear rates resulted in ICA and VA shear stress being unchanged from baseline (12.9 ± 3.2 vs. 12.4 ± 2.5 dyne/cm2, P = 0.26; and 8.1 ± 2.4 vs. 7.9 ± 2.5 dyne/cm2, P = 0.68, respectively).
Cerebral blood flow and metabolism parameters
Haemodilution caused an elevation in basal gCBF (833 ± 148 vs. 987 ± 202 ml/min; P = 0.002; Figure 2(a)). This increase in gCBF served to maintain CDO2 (P = 0.49; Figure 2(c)) in the face of the reduced CaO2 in order to preserve metabolism (cerebral metabolic rate of O2 (CMRO2); P = 0.49; Figure 2(d): cerebral metabolic rate of CO2 (CMRCO2); P = 0.57; Figure 2(g)) and oxygen extraction fraction (OEF) (p = 0.99; Figure 2(b)). The rise in gCBF and the maintenance of metabolism resulted in elevated CO2 washout (P = 0.01; Figure 2(f)), which was also reflected in the decrease of fraction of CO2 inserted into jugular blood (CO2IF; see supplemental materials for calculations) (P = 0.04; Figure 2(e)).
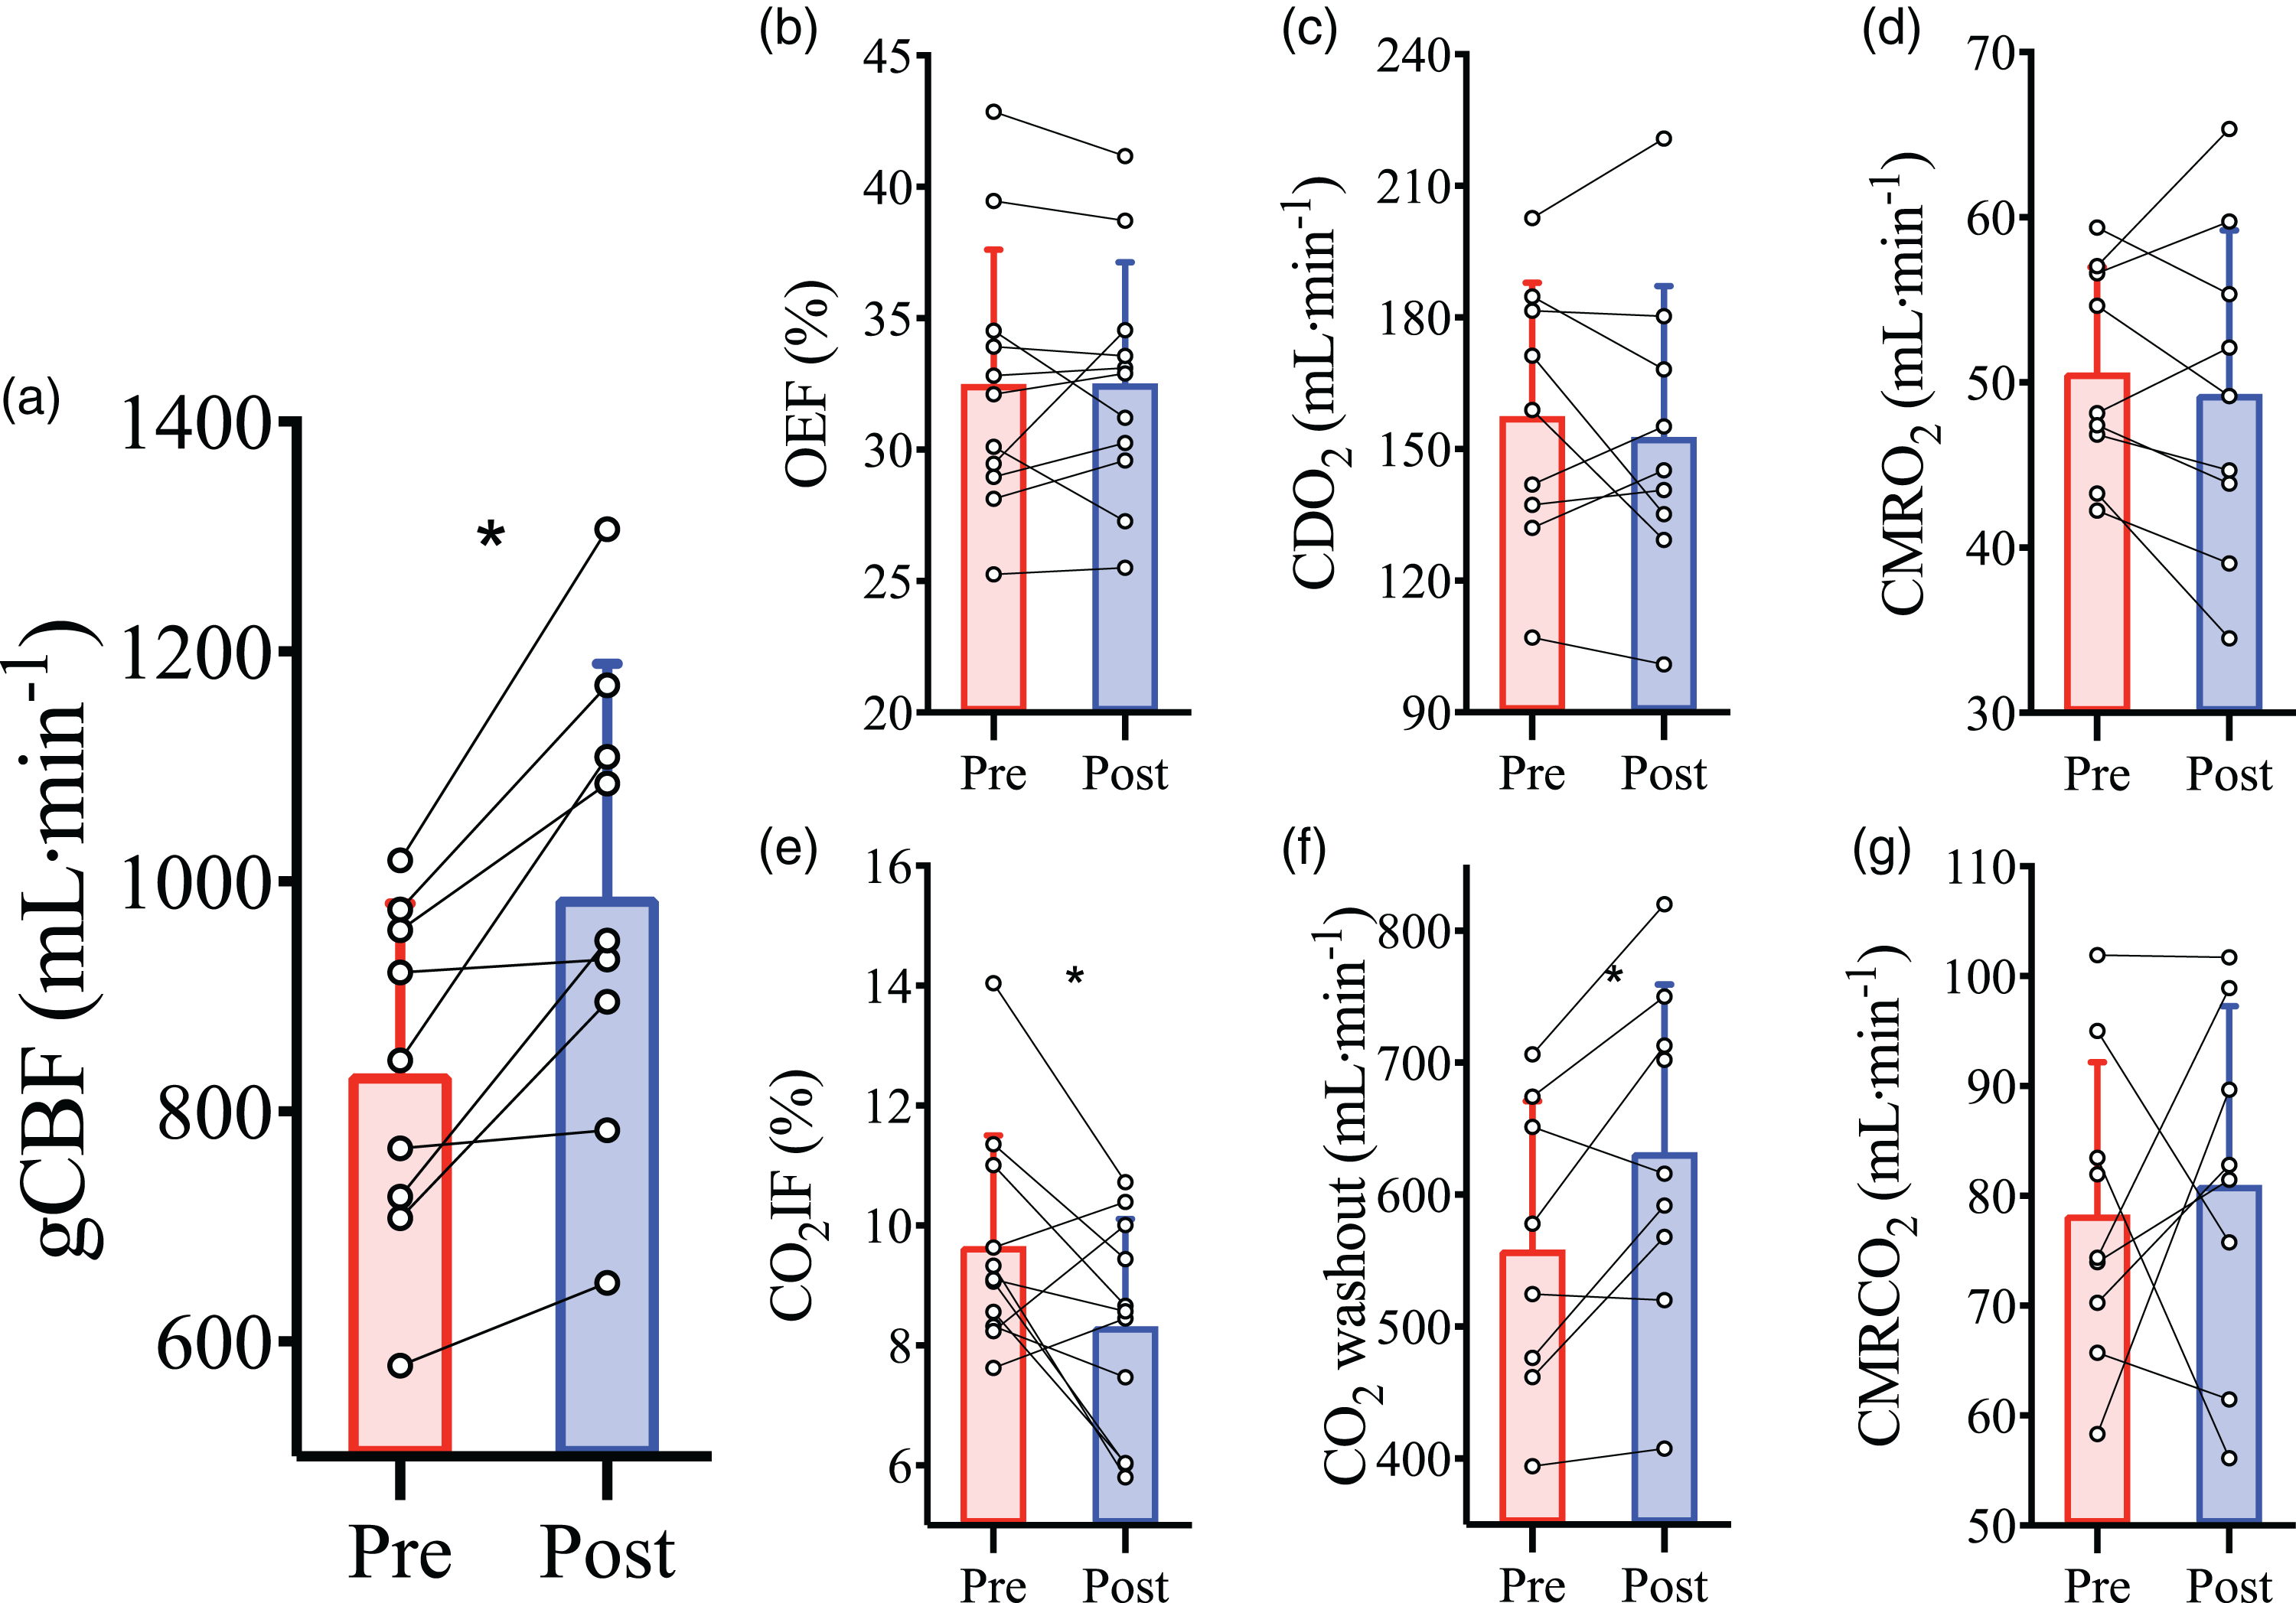
Cerebral blood flow and metabolism at baseline prior to and following haemodilution. Pre-haemodilution mean and standard deviation data presented in red, post-haemodilution mean and standard deviation data presented in blue, with individual data overlaid for both. (a) global cerebral blood flow (gCBF), (b) O2 extraction fraction (OEF), (c) cerebral delivery of O2 (CDO2), (d) cerebral metabolic rate of O2 consumption (CMRO2), (e) CO2 insertion fraction (CO2IF), (f) cerebral washout of CO2 content (CO2 washout) and (g) cerebral metabolic rate of CO2 production (CMRCO2), at baseline pre- and post-haemodilution. Asterisk (*) symbols indicate a change (P < 0.05) from pre to post haemodilution, compared using paired two-tailed t-tests. N = 9 for a, c, d, f, and g; while n = 11 for b and e.
NO exchange
There was a positive cerebral a–v difference (25.9 ± 30.1 nM; P = 0.023; one-sided t-test) and net uptake (11.6 ± 14.0 nmol/min; P = 0.027; one-sided t-test) for plasma
Repeated measures correlations
We conducted repeated measures correlations assessing within-participant relationships between gCBF and parameters known to influence CBF, using values taken at baseline, mid-haemodilution checkpoint, and post-haemodilution baseline. There were intra-individual relationships between gCBF and: CaO2 (R2 = −0.44, P = 0.007), Hb (R2 = −0.45, P = 0.006), Hct (R2 = −0.44, P = 0.007), pH (R2 = −0.32, P = 0.029), and CaCO2 (R2 = −0.38, P = 0.015). As PaCO2 was clamped between stages and unchanged by haemodilution, there was no relationship with gCBF (P = 0.31) or CPP (P = 0.43).
Cerebrovascular reactivity, pre and post haemodilution
Intervention parameters
By design, PaCO2 was elevated during the CVR test at each stage of hypercapnia (CO2 stage, P < 0.001) and each stage was matched between pre- and post-haemodilution (trial, P = 0.414; Supplemental Figure 3 A). The PaO2 was matched between pre- and post-haemodilution at each of stage of hypercapnia (trial, P = 0.342; Supplemental Figure 3B), while CaO2 was lower following haemodilution (trial, P < 0.001; Supplemental Figure 3 C). During CVR, neither MAP, JVP, nor CPP were different pre- versus post-haemodilution (trial, P = 0.465, P = 0.810, and P = 0.581, respectively), though all were elevated from baseline at the +6 and +9 mmHg PaCO2 stages (CO2 stage, all P < 0.001; Table 1).
Cerebral blood flow
Hypercapnia led to an increase in gCBF at each PaCO2 stage (CO2 stage, P < 0.001; Figure 3(a)). Post-haemodilution, gCBF was elevated at each stage compared to pre-haemodilution (trial, P < 0.001; Figure 3(a) and Table 1). To account for this is in the subsequent determination of CVR, we also compared gCBF change from baseline, which abolished the gCBF pre- versus post-haemodilution difference (trial, P = 0.198, Figure 3(b)). Shear stress did not differ between the pre- and post-haemodilution CVR trials (Table 1).
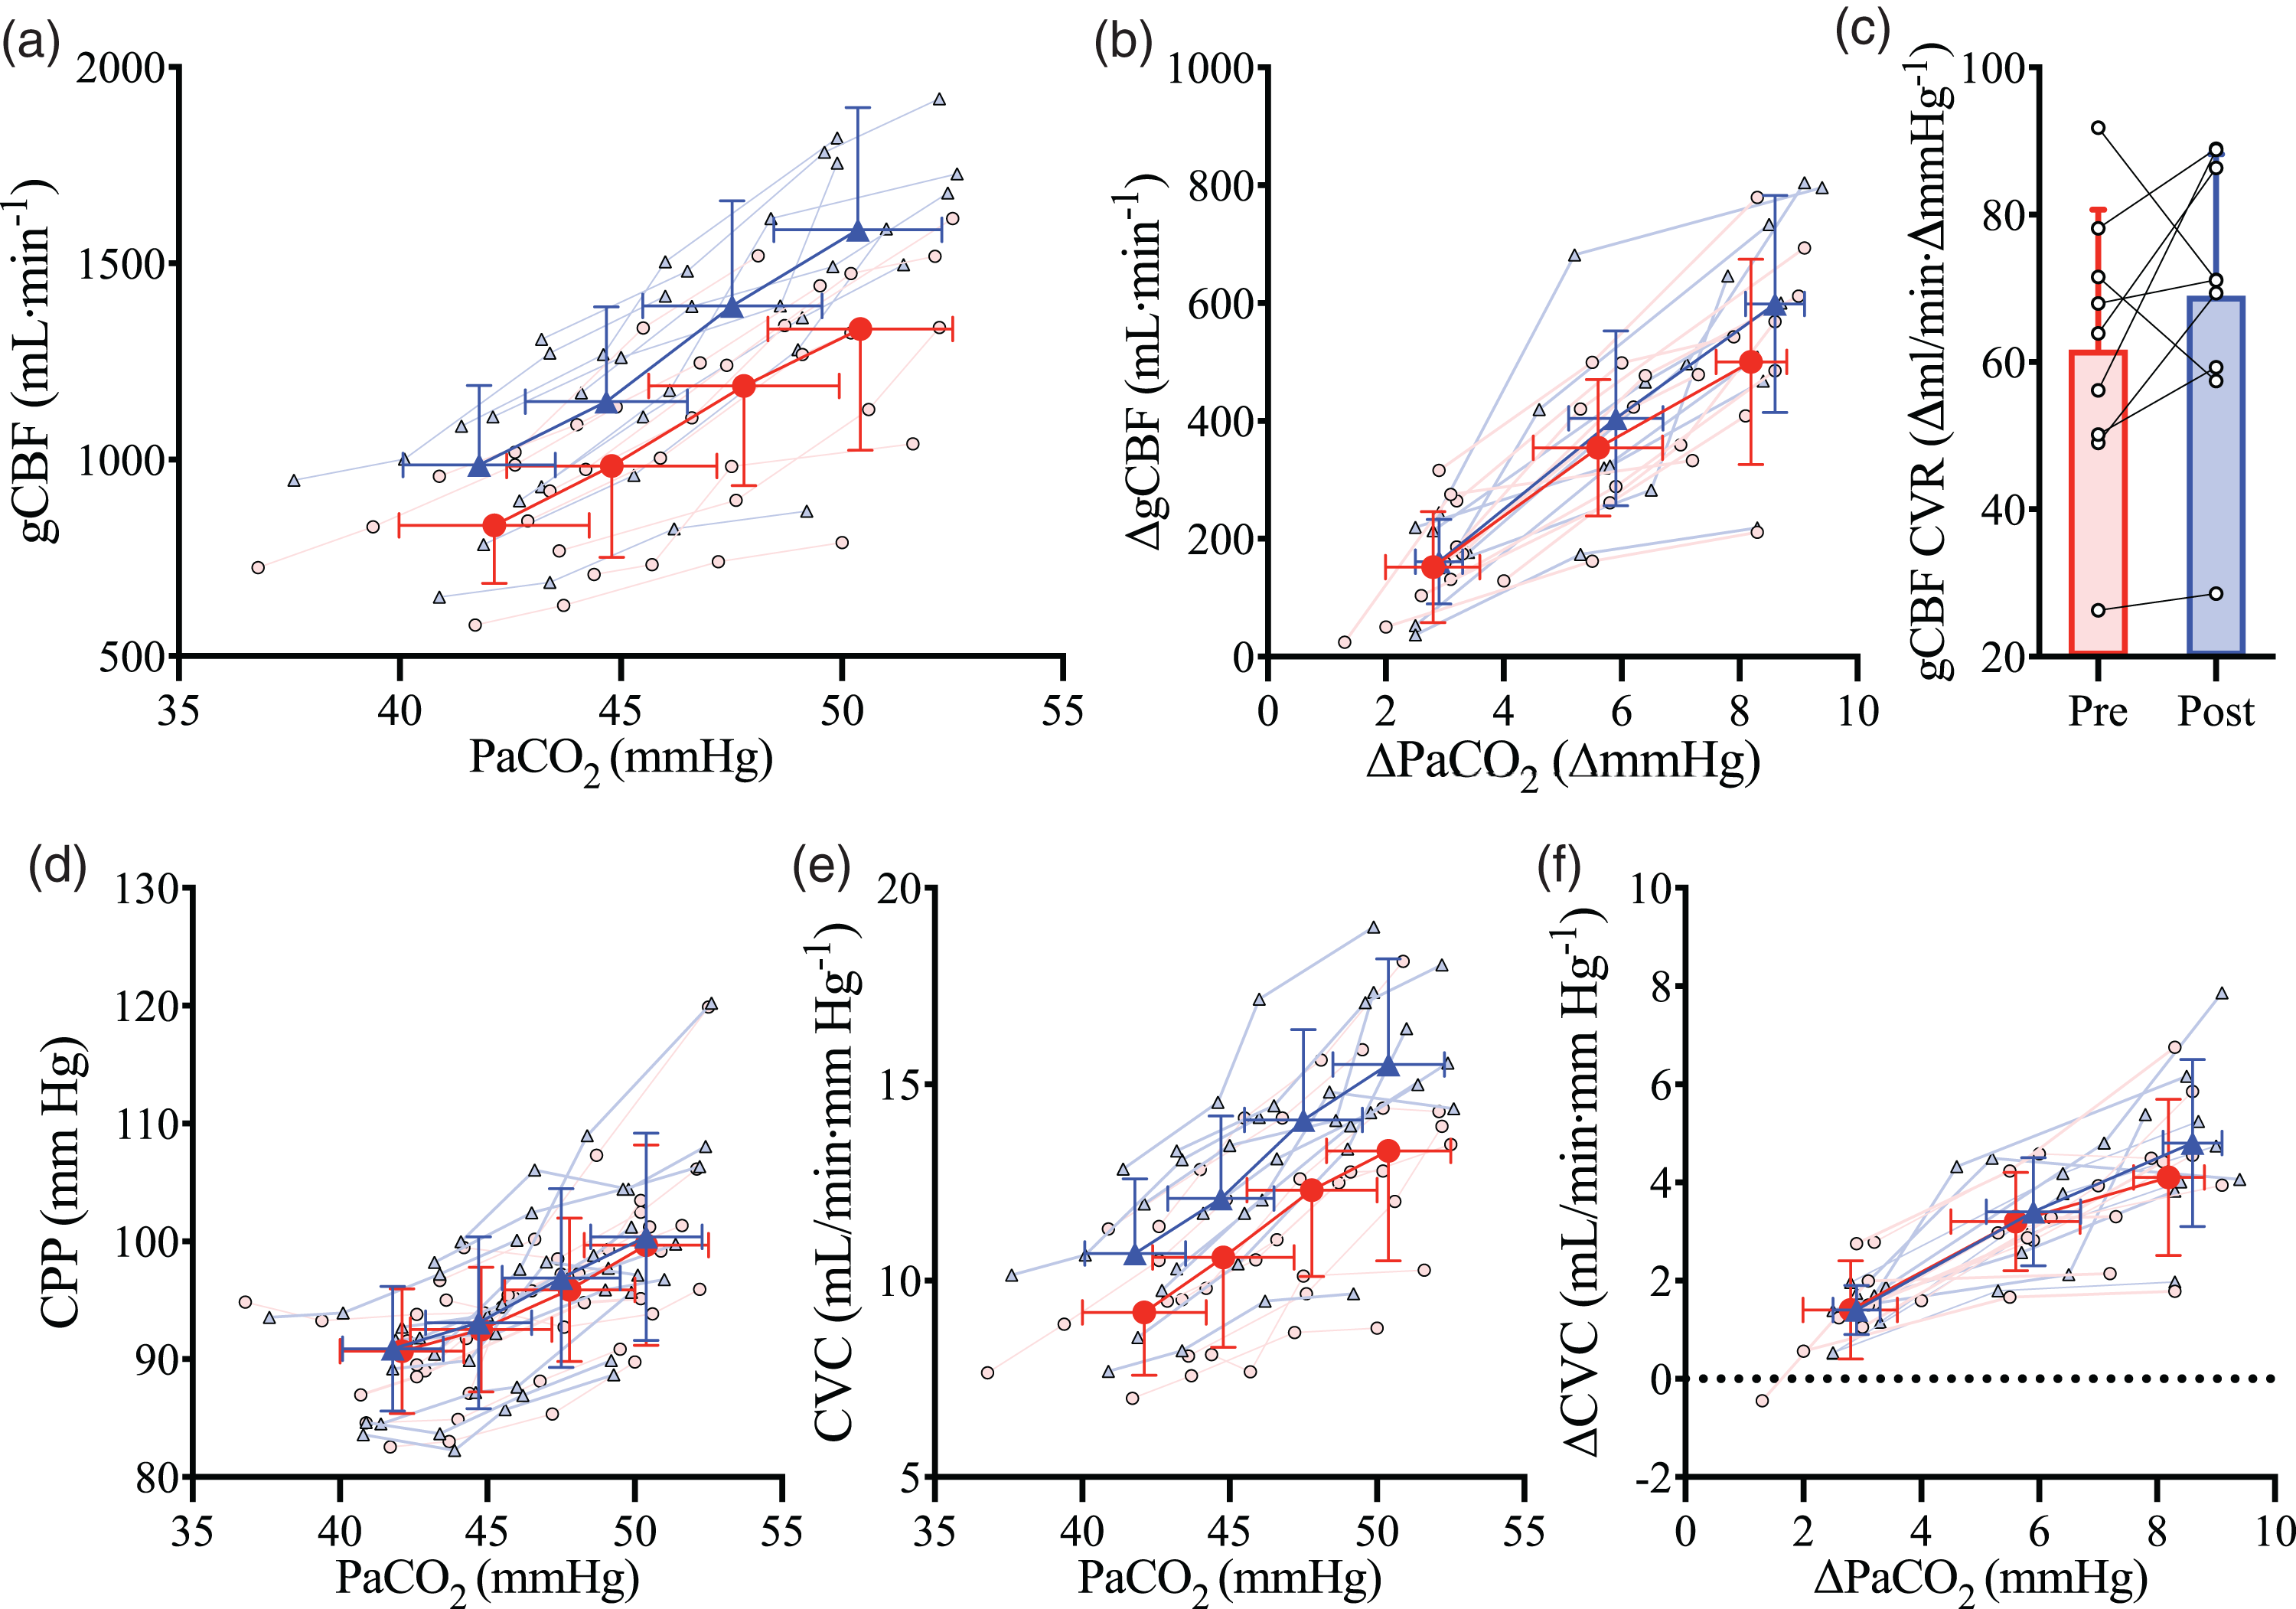
The relationship between global cerebral blood flow and arterial carbon dioxide. Mean and standard deviation for pre- (red circles/bar) and post- (blue triangles/bar) haemodilution, with individual data for both. (a) global cerebral blood flow (gCBF) at four stages of partial pressure of arterial CO2 (PaCO2), (b) gCBF changes from baseline with changes in PaCO2 from baseline, (c) cerebrovascular reactivity of gCBF (gCBF CVR) pre and post haemodilution, (d) cerebral perfusion pressure (CPP) at four stages of PaCO2, (e) cerebral vascular conductance (CVC) at four stages of PaCO2 and (f) CVC changes from baseline with changes in PaCO2 from baseline. N = 9.
Cerebrovascular reactivity
While absolute gCBF was elevated throughout post-haemodilution compared to pre-haemodilution, the gCBF CVR response to PaCO2 was not different between trials (P = 0.24; Figure 3(c)), nor was gCBF CVR calculated using absolute delta gCBF (P = 0.14), or percent delta gCBF (P = 0.77). Similarly, CVR did not differ when gCBF was indexed against jugular venous partial pressure of CO2 (PjvCO2; P = 0.39), CaCO2 (P = 0.10), or jugular venous content of CO2 (CjvCO2) (P = 0.87), further demonstrating that CVR was not differentially affected by haemodilution at each stage of PaCO2. Finally, CVR of MCAv and PCAv were also unchanged (P = 0.59 and P = 0.25, respectively) with haemodilution. Table 2 presents all CVR slopes indexed against PaCO2.
Cerebrovascular reactivity slopes in response to elevations in PaCO2.
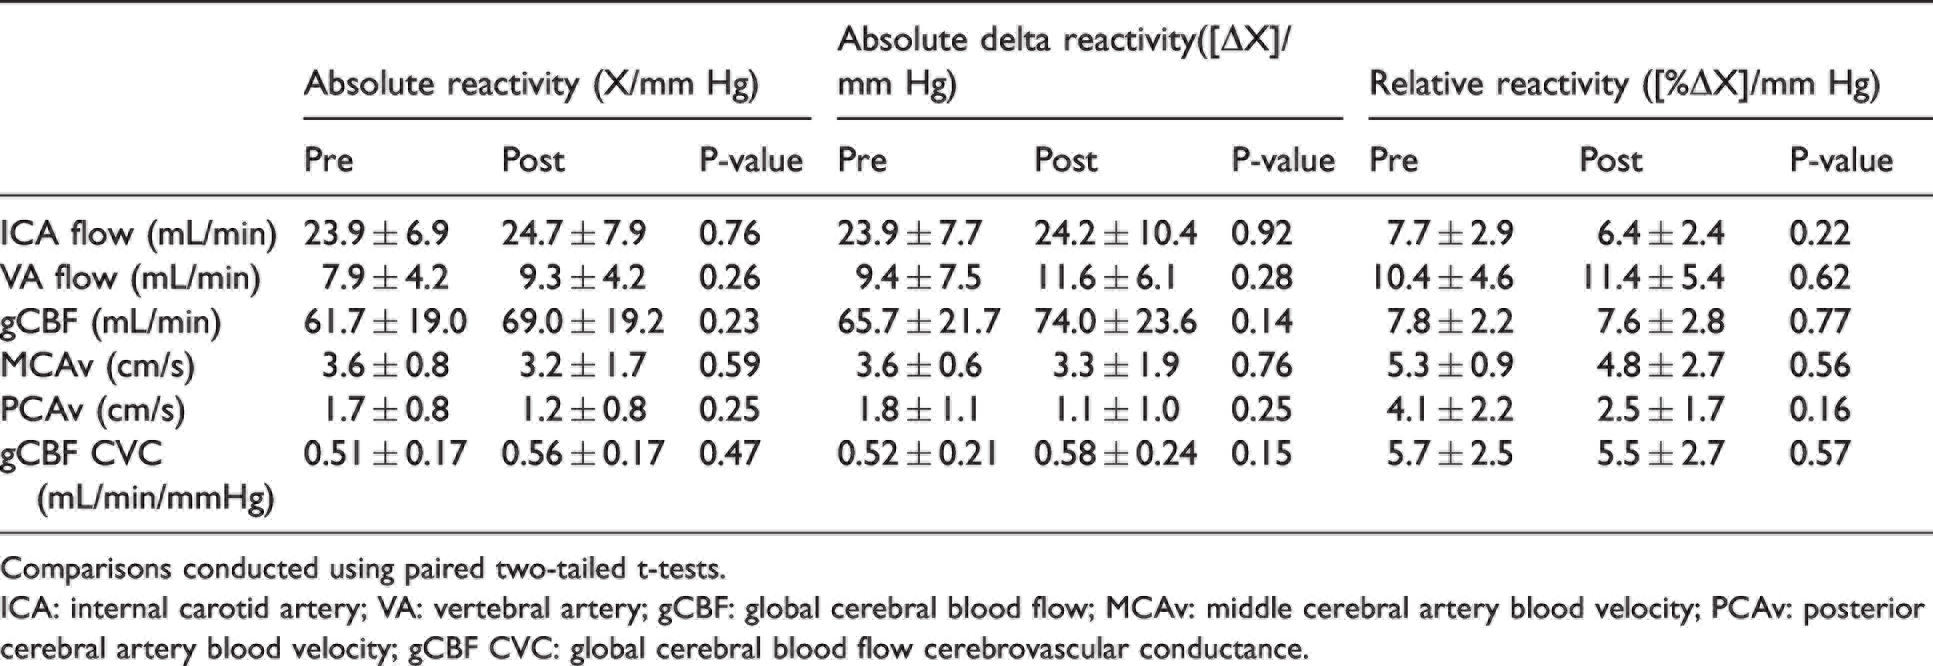
Comparisons conducted using paired two-tailed t-tests.
ICA: internal carotid artery; VA: vertebral artery; gCBF: global cerebral blood flow; MCAv: middle cerebral artery blood velocity; PCAv: posterior cerebral artery blood velocity; gCBF CVC: global cerebral blood flow cerebrovascular conductance.
Metabolism parameters
The Ca-jvO2 difference was lower post-haemodilution (trial, P < 0.001), as a result of the reduction in CaO2, and was narrowed at each step increase in PaCO2 (CO2 stage, P < 0.001) as a result of the increase in gCBF at each stage. There was a significant interaction effect (trial*CO2, P = 0.012) whereby during both pre- and post-haemodilution Ca-jvO2 was reduced (all P < 0.001) at each stage, and post-haemodilution Ca-jvO2 was lower than pre-haemodilution within each CVR stage (all P < 0.001; Figure 4(a)). Despite the reduced CaO2, the overall elevation in gCBF post-haemodilution served to maintain CDO2 comparably to pre-haemodilution throughout the CVR test (trial, P = 0.260; Figure 4(b)). As such, OEF was also unchanged between trials (trial, P = 0.525) and lower at each stage of CVR compared to baseline (CO2 stage, P < 0.001; Figure 4(c)). CMRO2 was not different between trials (trial P = 0.175) and was lower (CO2 stage, P < 0.001; Figure 4(d)) at the +9 mm Hg PaCO2 stage compared to baseline (P = 0.002) and +3 mm Hg (P = 0.034) stages. When determined as the change from baseline, a difference between trials remained for Ca-jvO2 (trial, P = 0.041).
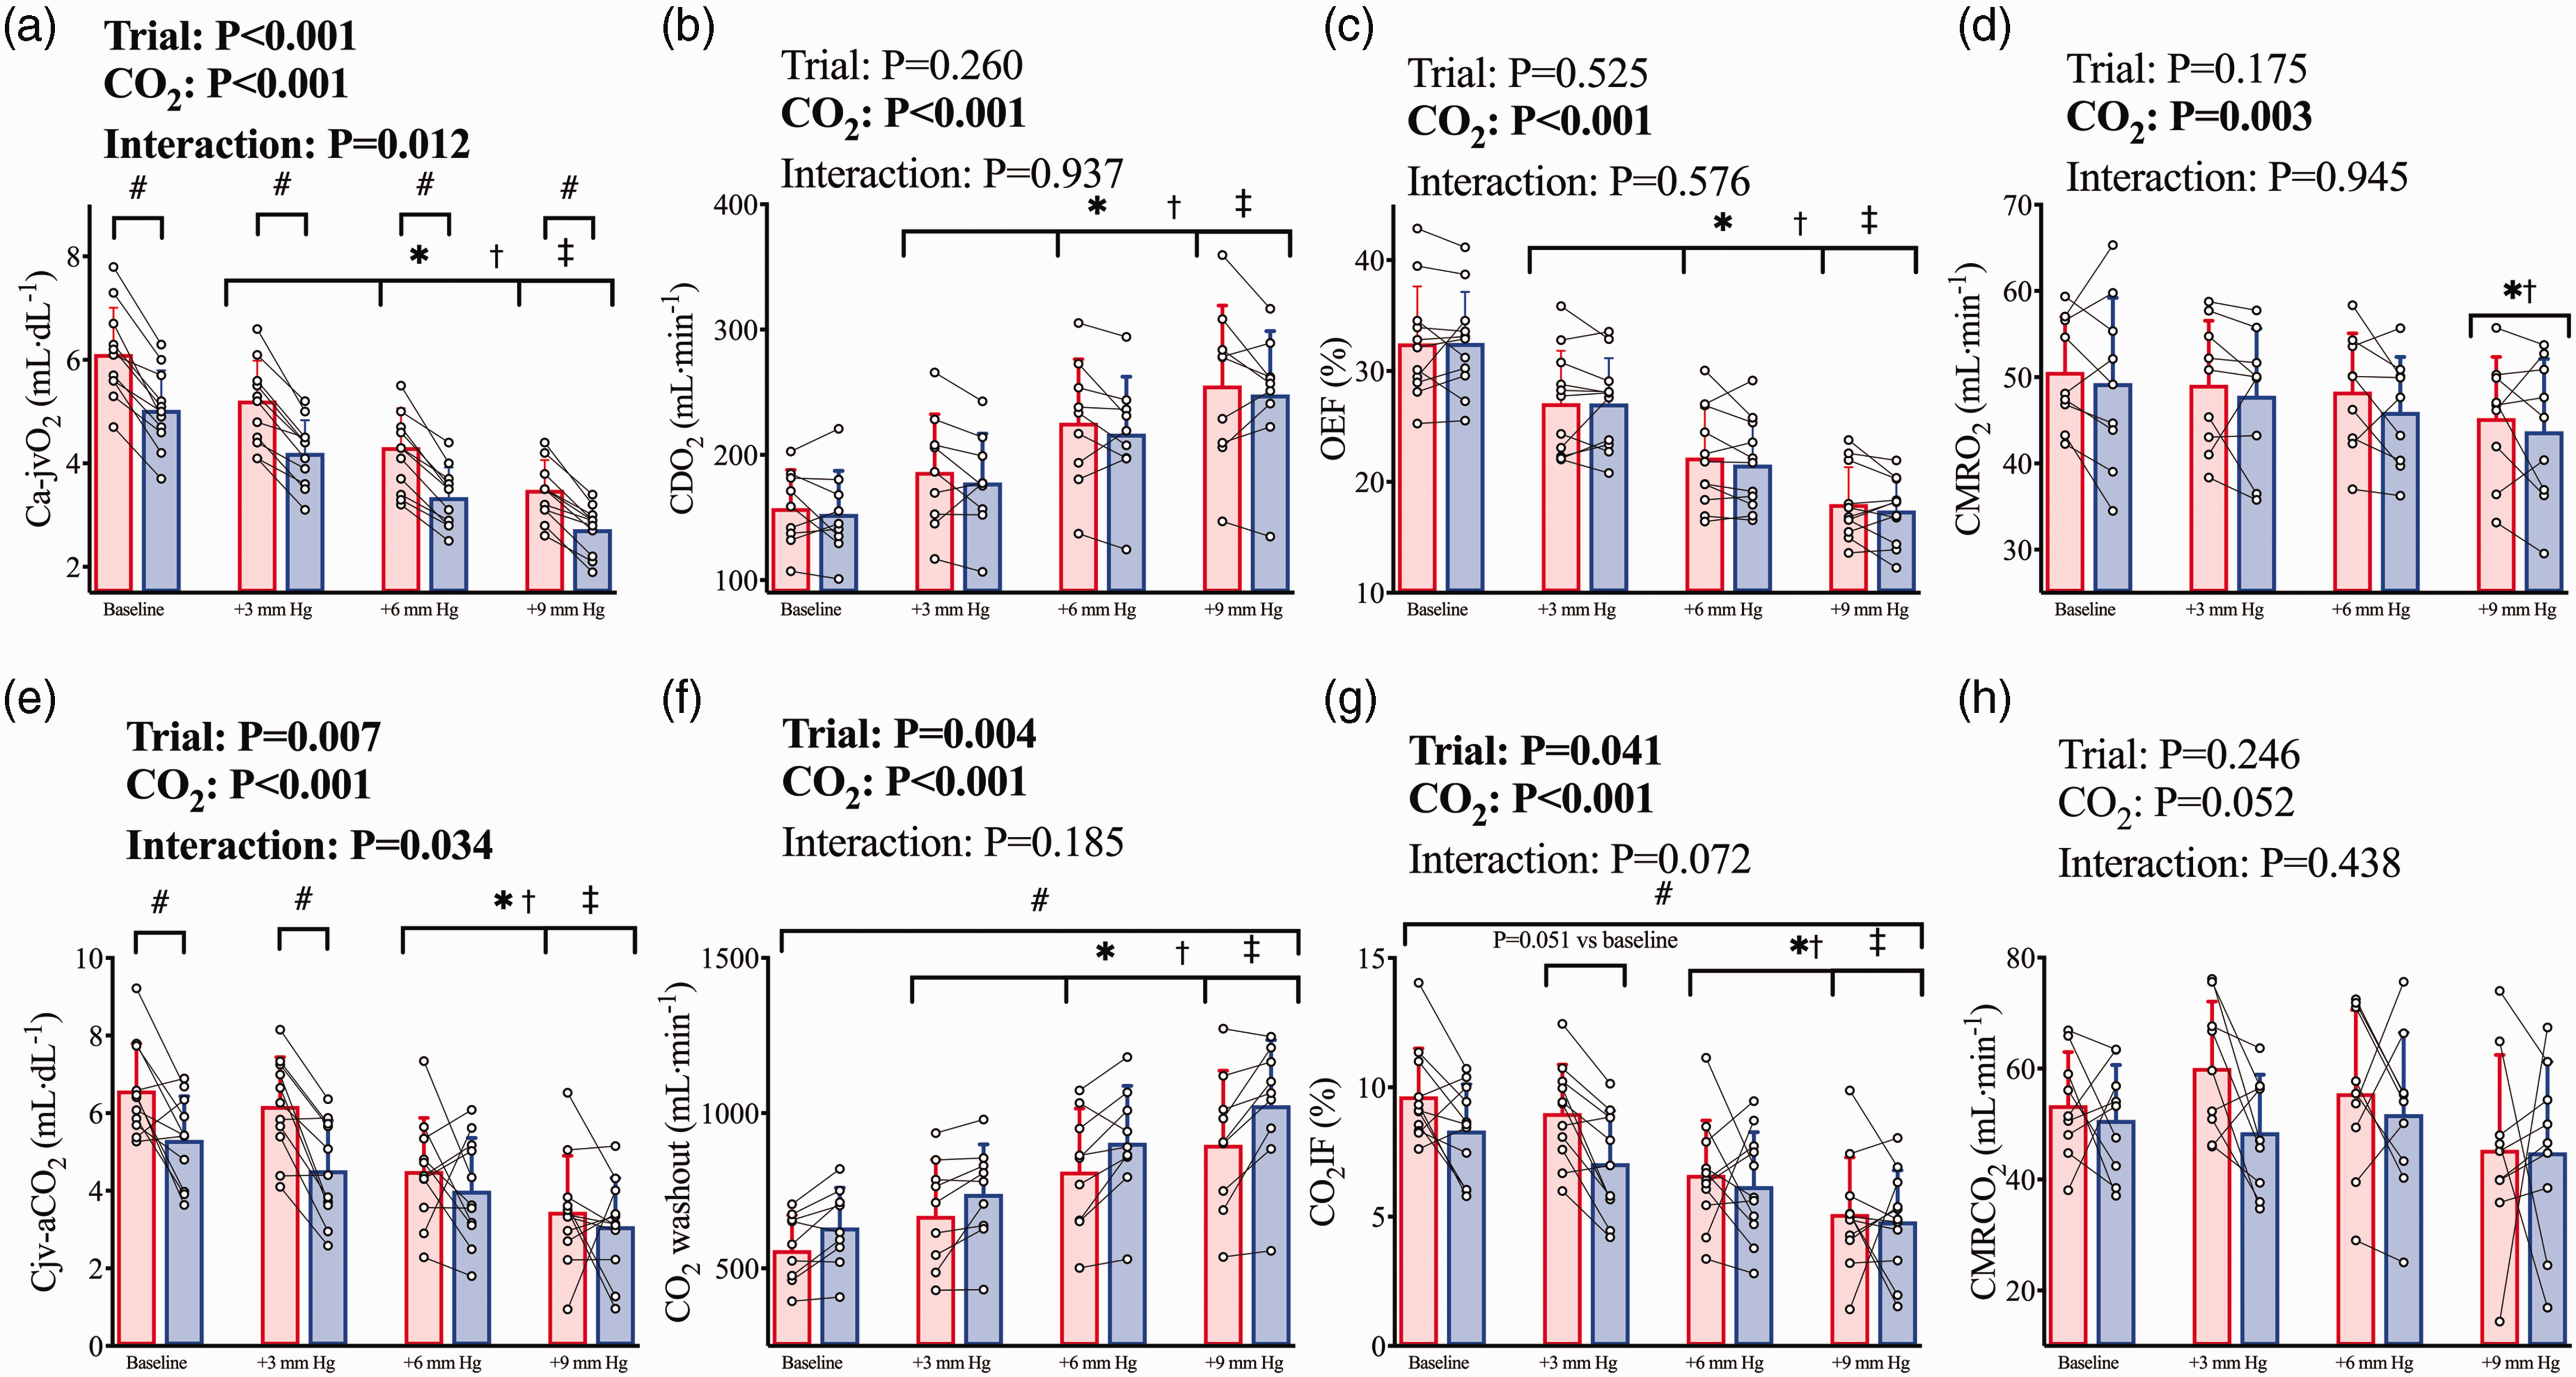
Cerebral metabolism during hypercapnia prior to and following haemodilution. Pre-haemodilution mean and standard deviation data presented in red, post-haemodilution mean and standard deviation data presented in blue, with individual data overlaid for both. (a) cerebral arteriovenous O2 content difference (Ca-jvO2), (b) cerebral O2 delivery (CDO2), (c) O2 extraction fraction (OEF), (d) cerebral metabolic rate of oxygen consumption (CMRO2), (e) cerebral veno-arterial CO2 content difference (Cjv-aCO2), (f) cerebral washout of CO2 content (CO2 washout), (g) CO2 insertion fraction (CO2IF), and (h) cerebral metabolic rate of CO2 production (CMRCO2). Comparisons conducted using linear mixed-model analyses with Bonferroni adjustments for post-hocs. Asterisk (*) symbols indicate a difference from baseline (P<0.05) in both trials, obelisk (†) symbols indicate a difference from the +3 mm Hg stage (P < 0.05) in both trials, and double dagger (‡) symbols indicate a difference from the +6 mm Hg stage (P < 0.05) in both trials. While hash symbols (#) indicate a difference (P < 0.05) between pre and post haemodilution in all CVR stages. Where an interaction effect is indicated, these symbols refer to changes between stages within trials, and differences between trials within stages. N = 11 for A, C, E, and G; while n = 9 for b, d, f, and h.
During CVR, the Cjv-aCO2 difference was lower post-haemodilution (trial*CO2, P = 0.034) at baseline (P = 0.004) and +3 mmHg PaCO2 (P < 0.001) stages but not +6 or +9 mmHg stages (Figure 4(e)). The overall elevation in gCBF post-haemodilution elevated CO2 washout across all stages (trial, P = 0.004), and the expected CVR response elevated gCBF in tandem with the elevated PaCO2 at each stage, thereby increasing absolute CO2 washout at each stage (CO2 stage P < 0.001; Figure 4(f)). Correspondingly, CO2IF was lower post-haemodilution (trial, P = 0.041) and reduced at each step increase in PaCO2 (CO2 stage, P < 0.001; Figure 4(g)). CMRCO2 was maintained between trials (trial P = 0.246) and was nominally unchanged with hypercapnia (CO2 stage, P = 0.052; Figure 4(h)). When determined as the change from baseline, the interaction effect remained for Cjv-aCO2 (trial*CO2, P = 0.026), but the effect of trial was abolished for CO2IF (trial, P = 0.385) and CO2 washout (trial, P = 0.366). Finally, while PaCO2 and PjvCO2 were both elevated at each stage of CVR (Figure 5(a)), the rise in CaCO2 (Figure 5(b)) was not matched with a corresponding rise in total CO2 content of the cerebral effluent (CjvCO2). Indeed, although CjvCO2 was reduced following haemodilution (trial, P < 0.001), it was unchanged across PaCO2 stages in either trial (CO2 stage, P = 0.190; Figure 5(c)).
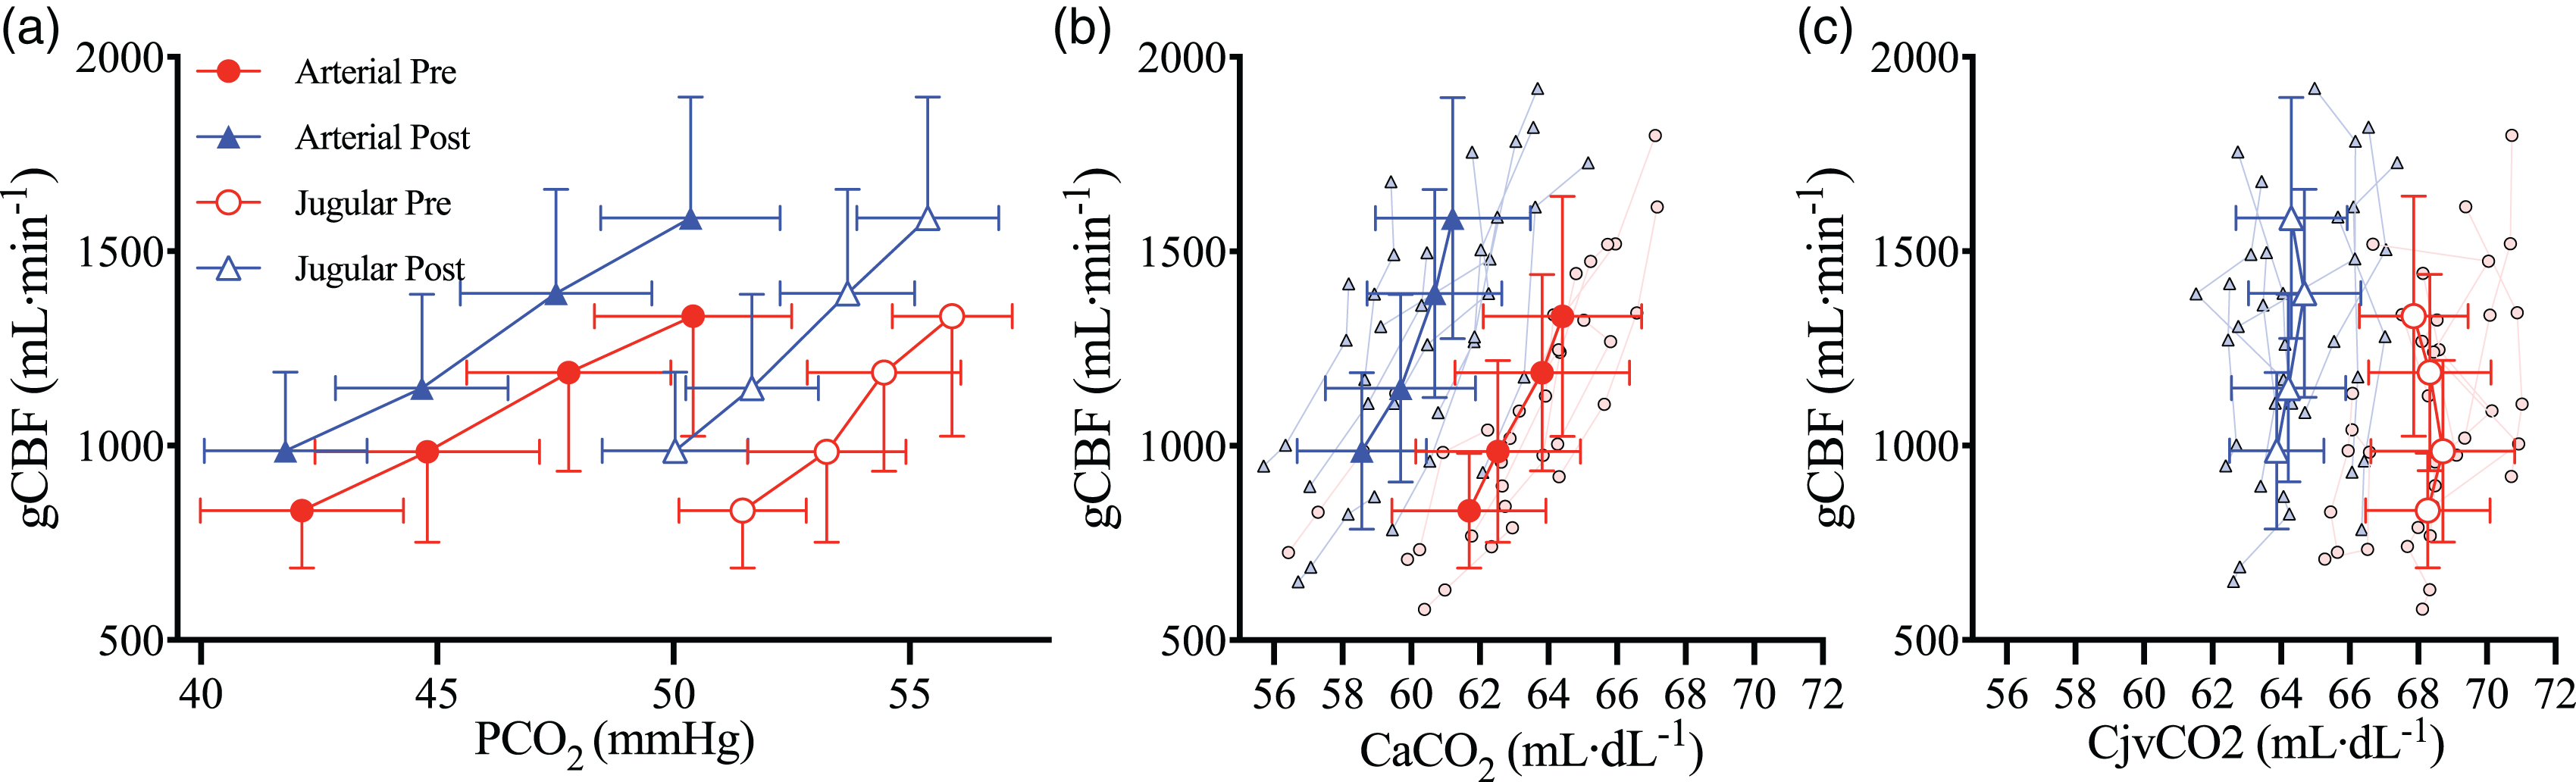
Cerebral CO2 tensions and contents during hypercapnia prior to and following haemodilution. Solid red circles and blue triangles represent arterial blood pre and post haemodilution, respectively, while empty red circles and blue triangles represent jugular venous blood pre and post haemodilution, respectively. (a) global cerebral blood flow (gCBF) against the partial pressures of CO2 in arterial (PaCO2) and jugular venous (PjvCO2) bloods, (b) gCBF against the arterial content of CO2 (CaCO2), and (c) gCBF against the jugular venous content of CO2 (CjvCO2). All data are mean and standard deviations, with individual data overlaid for b, c, and d. N = 9.
Discussion
The purpose of this study was to investigate the influence of acute isovolumic haemodilution on CBF and cerebrovascular reactivity to CO2 in healthy humans. Cerebrovascular regulation was preserved following haemodilution, indicated by an unaltered CVR. Furthermore, CBF increased following haemodilution to an extent adequate to preserve CDO2 and thereby maintain the requirements of CMRO2, which also resulted in increased CO2 washout. This preservation of cerebrovascular function coincided with an abolishment of cerebral net uptake of
Along with the principal regulators of CBF [i.e., blood pressure, metabolism, blood gases1,3,6,49,50] a number of other factors have been implicated in CBF control. For example, both animal and human studies have reported effects of changes in blood viscosity, Hct, [Hb], and NO bioavailability on CBF.26,32,33,51–56 Based on these studies, we hypothesized that haemodilution would steepen the CVR response. However, our findings demonstrate CVR is unchanged with haemodilution (Figure 3), which is in agreement with previous rodent studies, 25 and with Tu & Liu 16 who found that following acute isovolumic haemodilution in healthy humans, CBF was elevated while cerebrovascular reactivity to acetazolamide was reduced in the cortex but not in white matter, the putamen, or thalamus (differences in stimulus and mechanisms acknowledged). Below, we place the related findings in the context of the contributory roles of viscosity, Hct, [Hb], and NO and highlight the implications of elevations in CBF on central pH balance.
Regulation of CBF in the setting of acute anaemia
Following the removal and replacement of whole blood with albumin (a non-oxygen-carrying protein), Hct was reduced by 20%, which caused an approximate 20% reduction in CaO2 (Figure 1). Concomitant with this mild anaemia, gCBF was elevated by approximately 18% (Figure 2). While it has been well established that CBF is inversely related to CaO2 10,
51
indicating the increase in basal CBF following anaemia was likely driven by hypoxic vasodilation, other factors that may concurrently influence CBF cannot be disregarded. Indeed, in addition to the reductions in [Hb] and CaO2 (Figure 1(a) and (e), respectively), haemodilution was also associated with an increase in arterial [H+] and a reduction in arterial [
As the reduction in CaO2 coincided with reduced Hct, there is further potential for alterations in blood viscosity per se – consequent to the changes in Hct - to alter CBF regulation. In rodents, extreme elevations in whole blood viscosity substantially affect CBF during haemodilution and hypercapnia 52 and exhaust available vasodilator reserve, thereby abolishing hypercapnic CVR. 55 Yet, in vivo in humans, viscosity appears to have a lesser role in CBF regulation compared to the effects of changes in CaO2.51,63 For example, to isolate the changes in whole blood viscosity from CaO2, Brown and Marshall56,63 investigated the influence of a reduction in blood viscosity secondary to plasmapheresis of paraproteinemic patients on CBF. The authors observed no change in CBF following a large reduction in plasma viscosity, and thus whole blood viscosity with which there was no accompanying change in CaO2;56,63 this is consistent with animal studies showing the greater degree of contribution of CaO2 to changes in CBF during haemodilution. 18 Further, haemodilution-induced anaemia has been shown to increase CBF to a much lesser extent than carbon monoxide inhalation, 12 despite the decreased blood viscosity associated with haemodilution that is absent with carbon monoxide inhalation [acknowledging the potential for the confound of direct vasodilator influences of carbon monoxide]. 64
The majority of studies assessing the effects of hematocrit on CVR have been conducted in animals25,30,53,65,66 or in humans in the clinical setting of cardiovascular pathology.
54
Relative to human investigations, while Ševerdija et al.
54
found no difference in hypercapnic CVR between high and low hematocrit groups (
It is known that Hb is a powerful scavenger of NO,32,67–69 thus reductions in Hb could hypothetically affect CBF through reduced scavenging
32
and improved NO bioavailability. Equivalent findings relative to the peripheral circulation have recently been demonstrated, i.e., NO-dependent shear-mediated dilation of the brachial artery was augmented following a haemodilution induced reduction in Hb.26,27 While the notion of a reduction in Hb scavenging of NO was a notable aspect of our hypothesis building, the contribution of NO to CVR remains a contentious topic. Reviews on the summarized evidence of CVR regulatory mechanisms6,70–72 and combined recent investigations33,73–76 suggest that while NO plays a fundamental role in basal CBF regulation, it has a merely permissive rather than obligatory role during hypercapnia in humans (though evidence to the contrary also exists77,78). In other words, while hypercapnia stimulates cerebrovascular NO production
33
and downstream secondary messenger activity,
79
inhibition of this NO production has no influence on the CVR response.
33
As such, any reductions in Hb NO scavenging may plausibly have had some effect on CBF during baseline, but minimal or no impact on responses during CVR. Indeed, given arterial-to-venous differences of
Haemodilution decreased viscosity, and in conjunction with a concomitant increase in shear rate at each stage, shear stress was unaltered pre-to-post-haemodilution at each stage of hypercapnia. While supra-physiologically increased viscosity exhausts available cerebrovascular vasodilator reserve and thereby abolishes CVR in rats, 55 the modest reduction in arterial viscosity per se during haemodilution would be unlikely to steepen CVR responses. Conversely, it may be expected that the anaemia-induced elevation of CBF might blunt CVR through encroaching on cerebrovascular reserve. 20 However, CVR was not blunted, and – at least according to our volumetric measures - the haemodilution-induced elevation in gCBF did not exhaust cerebrovascular reserve in the large arteries (e.g. ICA and VA diameters were reduced and unchanged, respectively, following haemodilution; Table 1). While anaemia demanded CBF elevation in order to maintain CDO2 (Figure 2) presumably via vasodilation at the level of the pial arteries and microcirculation, this was achieved without vasodilation of the large arteries (relative to pre-haemodilution), but rather through faster velocities (Table 1) while the decrease in viscosity meant that cerebral vascular shear stress was maintained at roughly pre-haemodilution magnitude (Table 1).
Teleological perspective
The elevation in CBF with haemodilution was associated with an increase in CO2 washout (Figure 2), which is relevant to maintaining central pH.4,5 From a teleological perspective, in the setting of acute anaemia, elevated basal gCBF suffices to not only maintain CDO2, but also likely maintains central pH. The finding of unchanged CjvCO2 across all stages of CVR during both trials (Figure 5) further supports this conception. That total CO2 in the cerebral effluent blood is unchanged with increased PaCO2 is evidence of the efficacy of CVR mechanisms; indeed, it belies the function of CVR to maintain cerebral tissue acid-base balance. Whether or not the impaired CVR observed in anaemic pathologies is related to a disturbance in CO2 washout or central pH remains unknown. In the absence of a concomitant increase in gCBF, the reduction in the CO2 carrying capacity of the blood with isovolumic haemodilution would have resulted in build-up of CO2 causing cerebral tissue acidosis. Further, whether the contemporaneous increase in CO2 washout was merely coincidental or in fact a contributing influence in the increase in basal gCBF is also unknown.
Experimental considerations
We only studied male participants. Inclusion of both sexes is vital to a full understanding of the roles of NO, Hb, Hct, and viscosity in CBF regulation and for physiological research generally. 81 Thus the results of the current study cannot be extrapolated to females and future research is needed to address this limitation. 81 Abundant opportunities are available for future research regarding this matter to assess possible sex-related differences, the influence of androgens and estrogens, across the female menstrual cycle, pre versus post menopause, and pre versus post puberty. Furthermore, the sample size was relatively small compared to some of the larger clinical trials assessing the effect of anemia on CBF, and as such may be underpowered for the comparisons of some variables.
We acknowledge that as a variable for the assessment of cerebrovascular function, total content of CO2 likely only has significance in settings where some aspect of blood CO2 transport (i.e., Hb, [H+], [HCO3−], etc.) is altered – e.g., anaemia or other pathologies, high altitude, exercise, etc. During single CVR tests, calculation of total CO2 content will provide little benefit over PaCO2, however in this study, it provided insight into the underlying factors allowing for the maintenance of CVR. Finally, the degree of anemia achieved in this investigation was relatively mild compared to that found in some severe pathologies, as such our findings may not hold true for more moderate or severe anemias. Nonetheless, mild anemia in clinical populations has been associated with impaired CVR compared to healthy controls, with hemoglobin concentrations comparable to the current study (e.g. 10.3 g/dL in chronic renal failure patients; our study, 11.3 g/dL post-hemodilution). 21 Thus, in those instances of mild anaemia where CO2 reactivity is impaired, our findings suggest it is likely impaired not because of anaemia per se, but other pathologic factors associated with the disease (e.g. perhaps a hemolytic component and cell free Hb are more important in determining impairments in CVR in pathologically chronic anaemia).
Conclusion
Acute experimental anaemia increased gCBF to maintain CDO2 and preserve CMRO2; this led to – or was in conjunction with – the maintenance of hypercapnic CVR. Therefore, we conclude that in the setting of acute experimental anaemia, absent pathology, cerebral metabolism and the CBF response to reduced CaO2 are robust enough to also allow for normal vascular regulation by CO2. This indicates that reductions of CVR seen in pathology are more likely the result of the direct vascular effects of disease states rather than due to the effects of anaemia per se.
Abbreviations
CaCO2 – arterial content of arterial CO2
CaO2 – arterial content of O2
CBF – cerebral blood flow
CDO2 – cerebral delivery of O2
CjvCO2 – jugular venous content of CO2
CMRCO2 – cerebral metabolic rate of CO2
CMRO2 – cerebral metabolic rate of O2
CO – cardiac output
CO2 – carbon dioxide
CPP – cerebral perfusion pressure
CVR – cerebrovascular reactivity to CO2
DEF – dynamic end-tidal forcing
gCBF – global cerebral blood flow
H+ – hydrogen ions
Hb – hemoglobin
HCO3− – bicarbonateions
Hct – hematocrit
HR – heart rate
ICA – internal carotid artery
JVP – jugular venous pressure
MAP – mean arterial pressure
MCAv –middle cerebral artery blood velocity
NO – nitric oxide
O2 – oxygen
OEF – oxygen extraction fraction
PaCO2 – arterial partial pressure of CO2
PaO2 – arterial partial pressure of O2
PCAv – posterior cerebral artery blood velocity
PETCO2 – end-tidal partial pressure of CO2
PETO2 – end-tidal partial pressure of O2
PjvCO2 – jugular venous partial pressure of CO2
PjvO2 – jugular venous partial pressure of O2
RSNO – S-nitrosothiols
SaO2 – arterial O2 saturation
TCD – transcranial doppler ultrasound
VA – vertebral artery
Supplemental Material
sj-pdf-1-jcb-10.1177_0271678X221119442 - Supplemental material for Cerebral O2 and CO2 transport in isovolumic haemodilution: Compensation of cerebral delivery of O2 and maintenance of cerebrovascular reactivity to CO2
Supplemental material, sj-pdf-1-jcb-10.1177_0271678X221119442 for Cerebral O2 and CO2 transport in isovolumic haemodilution: Compensation of cerebral delivery of O2 and maintenance of cerebrovascular reactivity to CO2 by Jay MJR Carr, Philip N Ainslie, David B MacLeod, Joshua C Tremblay, Daniela Nowak-Flück, Connor A Howe, Mike Stembridge, Alexander Patrician, Geoff B Coombs, Benjamin S Stacey, Damian M Bailey, Daniel J Green and Ryan L Hoiland in Journal of Cerebral Blood Flow & Metabolism
Footnotes
Data availability
Funding
The author(s) disclosed receipt of the following financial support for the research, authorship, and/or publication of this article: P.N.A. was funded by the Natural Sciences and Engineering Research Council of Canada and a Canada Research Chair. R.L.H. is funded through a Michael Smith Foundation for Health Research Trainee fellowship and a Craig H. Neilsen Foundation Postdoctoral Fellowship.
Declaration of conflicting interests
The author(s) declared no potential conflicts of interest with respect to the research, authorship, and/or publication of this article.
Authors’ contributions
R.L.H., D.B.M., J.C.T., D.N-F. C.A.H., M.S., A.P., G.B.C., B.S., D.M.B., D.J.G., and P.N.A. were involved in data collection. J.M.J.R.C., R.L.H., and P.N.A. were involved in data analyses, subsequent interpretation, and drafting the article. All authors critically reviewed the article. All authors approved the final version of this article and agree to be accountable for all aspects of the work. All persons designated as authors qualify for authorship, and all those who qualify for authorship are listed.
References
Supplementary Material
Please find the following supplemental material available below.
For Open Access articles published under a Creative Commons License, all supplemental material carries the same license as the article it is associated with.
For non-Open Access articles published, all supplemental material carries a non-exclusive license, and permission requests for re-use of supplemental material or any part of supplemental material shall be sent directly to the copyright owner as specified in the copyright notice associated with the article.