
Abstract
Pathological process in Parkinson’s disease (PD) is accompanied with functional and metabolic alterations. The time-varying properties of functional coherence and their coupling to regional perfusion are still rarely elucidated. To investigate early disruption of dynamic regional homogeneity (dReho) and neurovascular coupling in cognitively normal PD patients, dynamic neuronal synchronization and regional perfusion were measured using dReho and cerebral blood flow (CBF), respectively. Neurovascular coupling was assessed by CBF-ReHo correlation coefficient and CBF/ReHo ratio. Multivariate pattern analysis was conducted for the differentiating ability of each feature. Relative to healthy controls (HC) subjects, PD patients demonstrated increased dReho in middle temporal gyrus (MTG), rectus gyrus, middle occipital gyrus, and precuneus, whereas reduced dReho in putamen and supplementary motor area (SMA); while higher CBF/dReho ratio was located in putamen, SMA, paracentral lobule, and postcentral gyrus, whereas lower CBF/dReho ratio in superior temporal gyrus, MTG, precuneus, and angular gyrus (AG). Global and regional CBF-Reho decoupling were both observed in PD groups. The CBF/Reho ratio features achieved more powerful classification performance than other features. From the view of dynamic neural synchronization and neurovascular coupling, this study reinforced the insights into neural basis underlying PD and the potential role in the disease diagnosis and differentiation.
Introduction
Parkinson’s disease (PD) is a prevalent neurodegenerative disorder with selective depletion of nigrostriatal dopaminergic neurons and pathophysiological dysfunction of striatal-thalamic-cortical loops, resulting in cardinal motor disturbance manifested as resting tremor, rigidity, bradykinesia, and postural instability. 1 Despite these remarkable features, PD is also highly heterogeneous due to its accompanying non-motor symptoms that arise from the involvement of cortical regions through other neural substrates (acetylcholine, serotonin, and noradrenaline). 2 However, clinical manifestations fail to reflect early disruptions in specific brain regions that are linked to PD severity and progress because pathological changes have already advanced before the onset of symptoms. 3 Promisingly, neuroimaging studies have documented aberrant functional activities and altered regional perfusion that are linked to dopaminergic and non-dopaminergic dysfunction, thus providing extensive understanding on potential neurodegenerative mechanisms in PD.4–6
As an advanced neuroimaging approach, resting state functional magnetic resonance imaging (fMRI) is widely employed in PD entities for in vivo insights into spontaneous neural activities by analyzing blood-oxygen-level-dependent (BOLD) signals. 4 Functional abnormalities have been reported in regional activity and functional connectivity in certain region or network that corresponds to motor control, visual processing, and executive function in PD.7–10 Given that the neural system is dynamic and shows inherently temporal activity during energy consumption, emerging research emphasize the importance of neural activity with time-varying properties to complement deficiencies in static features on the assumption of stationary status during scanning.11,12 Recent PD investigations have focused on dynamic functional connectivity patterns and large-scale networks and yielded convincing insights into disease severity, subcortical networks disruption, cognitive impairment, and sleep behavior disorder.13–15 However, studies are lacking on the temporal signature of regional neural activity, known as the crucial component of brain function, in PD, and the validation of its differentiating performance between PD patients and healthy control (HC) individuals.
In addition to functional alterations, the impaired distribution of regional perfusion in PD, which is termed as PD-related pattern (PDRP), has also been identified by radiotracer approaches.16,17 Recent studies further revealed that PDRP could be alternatively observed by arterial spin labelling (ASL) non-invasively, providing the quantified values of cerebral blood flow (CBF).18,19 Indeed, spontaneous neural activation is tightly linked to regional cerebral perfusion that reflects glucose oxidative metabolism, also known as neurovascular coupling, one of the pivotal neural mechanisms to maintain the homeostasis of the cerebral microenvironment. The disrupted coupling has been proved to be a major cause of dysfunction in pathological conditions, such as Alzheimer’s disease, 20 stroke, 21 hypoxia, 22 and traumatic brain injury. 23 Although neural substrates theoretically influence neurovascular coupling as vasoactive mediators in PD, the union of information from neuronal activity and cerebral perfusion needs further investigation to depict the dysregulating mechanism in PD with comprehensive in vivo insights, rather than the previous perspectives on the basis of separate imaging modality.
Increasing literatures indicate that the local temporal features of neuronal activity could be acquired robustly by applying the sliding window method.12,24,25 Furthermore, Liang et al. 26 achieved the exploration of the neurovascular coupling by integrating fMRI data on BOLD and ASL. Consequently, both dynamic pattern and neurovascular coupling have been verified to be associated with cognitive function. Whether these early alterations underlie the pathology of PD before the onset of global cognitive impairments remains poorly delineated. By enrolling PD patients in early-stage with normal global cognition, the current study thus aimed to investigate the time-varying synchrony of reginal neuronal activity captured from dynamic regional homogeneity (dReHo) and further detect neurovascular coupling at whole gray matter (GM) and regional level. The classification performance of these abnormalities between PD patients and HC subjects was also analyzed by utilizing multivariate pattern analysis (MVPA). The hypothesis is that the early disruption of local dynamic synchrony and decoupling of neurovascular unit (NVU) could clarify the neurodegenerative process in PD and achieve better differentiating performance between PD patients and HC subjects.
Materials and methods
The study was performed in accordance with the latest version of the Declaration of Helsinki and approved by the ethics committee of Nanjing Medical University, and written informed consent was obtained from each subject before their participation in this study.
Participants
A total of 122 participants including 62 right-handed PD patients from movement disorder clinic and 60 matched (age, sex, years of education, and handedness) HC subjects from community were enrolled from May 2020 to Apr 2021. For the PD group, disease severity and stage were evaluated using the Movement Disorder Society (MDS)-sponsored revision of the Unified Parkinson's Disease Rating Scale (MDS-UPDRS) part III (UPDRS-III) and Hoehn and Yahr (H-Y) scale, respectively. Levodopa equivalent daily dose (LEDD) was also calculated. Mini-mental State Examination (MMSE) scale and Montreal Cognitive Assessment (MoCA) scale were employed for global cognition assessment among all participants. Antiparkinsonian drugs were abstained for at least 12 hours prior to the clinical evaluations and MRI acquisition. Interview and clinical assessments were conducted structurally by two experienced neurologists.
The diagnostic criterion of PD patients was referred to clinical criteria of the Movement Disorder Society and employed the clinically probable PD, which balances sensitivity and specificity, as level of diagnostic certainty. 27 PD patients were included with H-Y scale less than II, disease duration within 60 months, and an optimized daily dose of antiparkinsonian medications for at least 4 weeks to detect early alterations. The exclusion criteria for all participants were as follows: (1) family history of PD, dementia, or hypertension; (2) complaint of cognitive impairment with MMSE score <27 or MoCA score <26; (3) additional neuropsychological disorders (e.g. Alzheimer's disease, schizophrenia, depression, and epilepsy) or cerebrovascular accidents (e.g. stroke and intracranial hemorrhage); (4) any complications or lesions involving to central nerve system (e.g. diabetes mellitus, hyperthyroidism, tumor, and brain trauma); (5) history of alcoholism or substance abuse; any condition contraindicating to MRI scanning (e.g. metal foreign body or implant, claustrophobic, and hyperpyrexia) or inducing severe head movement (e.g. hearing or visual loss); (6) years of education <9. The detailed demographic and clinical information for the two groups are listed in Table 1.
Demographic characteristics and scores of clinical assessments.
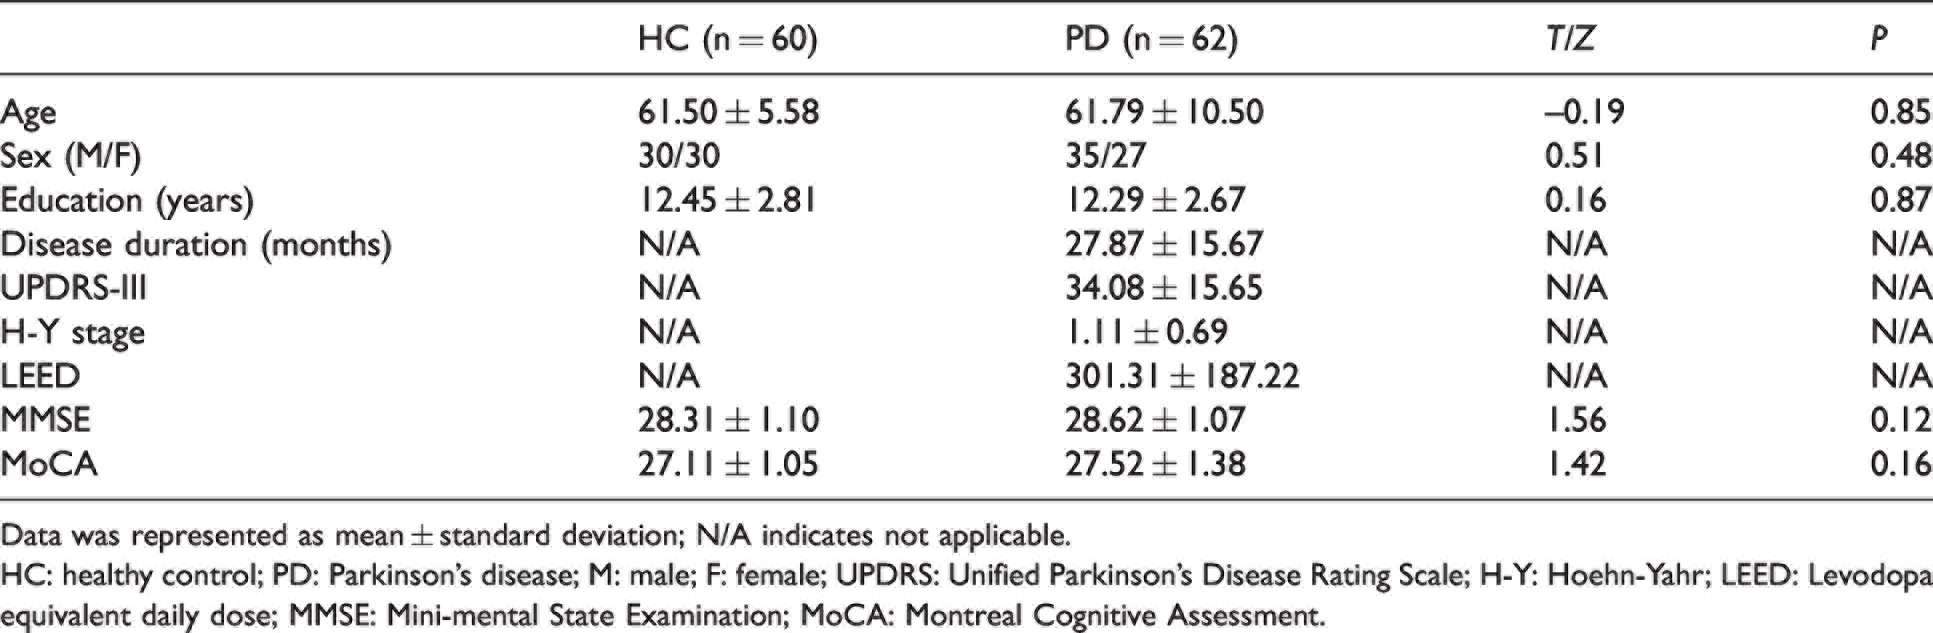
Data was represented as mean ± standard deviation; N/A indicates not applicable.
HC: healthy control; PD: Parkinson’s disease; M: male; F: female; UPDRS: Unified Parkinson’s Disease Rating Scale; H-Y: Hoehn-Yahr; LEED: Levodopa equivalent daily dose; MMSE: Mini-mental State Examination; MoCA: Montreal Cognitive Assessment.
MRI data acquisition
All participants received a 3.0-tesla MRI scanning (Discovery MR750, GE Medical Systems, Milwaukee, WI, USA) equipped with a commercial eight-channel phased array head coil. Prior to scanning, the subjects were instructed to abstain from any vasoactive drugs for at least 24 hours. During the acquisition, the individuals lie in a supine position wearing headphones while keeping eyes closed without moving and awake without thinking about things. All participants were also instructed to relax as much as possible and keep breathing steadily. In addition to this, the heart rate and breathing frequency were also monitored by pulse oximeter and respiratory belt for individual. Functional images were acquired using a gradient recalled echo echo-planar imaging sequence with the following parameters: repetition time (TR) 2,000 ms, echo time (TE) 30 ms, flip angle 90°, slice thickness 4 mm without gap, field of view (FOV) 240 × 240 mm2, matrix size 64 × 64, voxel size 4.0 × 4.0 × 4.0 mm3, number of time points 240, each frame included 35 continuous slices that covered the whole brain volume. The slices were parallel to the anterior/posterior commissure, and the total scan time was 8 minutes and 30 seconds. Perfusion images were acquired using a background suppressed three-dimensional pseudocontinuous ASL (pCASL) sequence with the following parameters: TR 10.5 ms, TE 4.9 ms, flip angle 111°, slice thickness 4 mm without gap, FOV 240 × 240 mm2, matrix size 128 × 128, labeling duration 1,500 ms, post-labeling delay 2,025 ms, number of excitations 3, number of slices 36, 8 arms with 512 points per arm, total scan time 4 minutes and 44 seconds, and units: ml/100 g/min. This sequence also included a fluid-suppressed proton density acquisition with the same image dimensions as the pCASL but without radio frequency labeling for CBF quantitation and image registration. Structural data (high-resolution T1-weighted images) were also obtained using 3D whole-brain brain volume imaging sequence with the following parameters: TR 12 ms, TE 5.1 ms, inversion time 450 ms, flip angle 15°, slice thickness 1 mm, no gaps, FOV 240 × 240 mm2, matrix size 256 × 256, voxel size 1 × 1 × 1 mm3, number of slices 172, and total scan time 5 minutes and 20 seconds.
Functional data preprocessing and analysis
fMRI data were preprocessed by Data Processing and Analysis of Brain Imaging toolbox (DPABI, Version 4.5, http://rfmri.org/dpabi) on the basis of Statistical Parametric Mapping (SPM, Version 12, http://www.fil.ion.ucl.ac.uk) running on Matlab 2018a software (MathWorks, Natick, MA, USA). The procedures for each subject were as follows: removing of the first 10 time points to ensure magnetization equilibrium; slice timing of the remaining 230 volumes to correct time differences; realignment to correct head motion by excluding individuals with displacement >2 mm or rotation >2.0°; spatial normalization of the functional images based on T1 structural images transformation (co-registration and segmentation) to non-linearly co-register to Montreal Neurological Institute (MNI) space at a resampling of 3 × 3 × 3 mm3; linearly detrending of time series; and regression of nuisance covariates (Friston-24 motion parameters, white matter signals, cerebrospinal fluid signals, and global signals).
ReHo was applied to assess regional signal synchronizations. 28 For each individual, Kendall’s coefficient concordance (KCC) was calculated to measure the similarity between the time series of a functional voxel and its 26 neighboring voxels within a whole-brain mask. The generated ReHo map was further z-scored for standardization by subtracting the global mean value of gray matter (GM) and then dividing by the standard deviation (SD) and was defined as static ReHo (sReHo) parameter. The processed sReHo maps were spatially smoothed by a Gaussian kernel with full-width at half-maximum (FWHM) of 6 mm.
The dynamic ReHo (dReHo) was processed by Dynamic Brain Connectome toolbox (DynamicBC, Version 2.0, http://www.restfmri.net/forum/DynamicBC) on the theory of sliding window approach. 29 Given that window parameter is crucial for calculating dynamic properties, 39 windows within whole-length time series were generated by setting the window length to 50TR (100 s) and step size to five TR (10 s), which were verified as the optimal parameters to minimize spurious fluctuations.12,30,31 The ReHo map within each window was separately calculated to produce a set of ReHo maps for each subject. The dynamic synchronization of ReHo was computed using the SD of all ReHo maps across 39 moving windows and then standardized by z-scores transformation, which was regarded as dReHo parameter. The processed dReHo maps were spatially smoothed by a Gaussian kernel with full-width at half-maximum of 6 mm.
Perfusion data preprocessing and analysis
Individual CBF maps were acquired using FuncTool software (Version 4.6, GE Medical Systems, Milwaukee, WI, USA) based on a general kinetic model for ASL 32 and then preprocessed using SPM 12 running in MATLAB R2018a. 33 Motion and magnetic field B0 inhomogeneity was corrected by removing subjects who translated and rotated higher than 2 mm and 2°; 34 spatially normalizing the CBF maps based on T1 structural image transformed (co-registration and segmentation) to non-linearly co-register to MNI space at a resampling of 3 × 3 × 3 mm3; removing non-brain tissues from each co-registered CBF map; standardize CBF map by z-scored; and smooth z-scored CBF (z-CBF) maps with a 6 × 6 × 6 mm3 FWHM Gaussian kernel. A relative increase in perfusion with respect to other groups was interpreted as preserved perfusion.
Neurovascular coupling quantitation
Correlation analyses between the regional synchronization of neuronal activity (dReHo map, sReHo map) and local cerebral perfusion (z-CBF map) across voxels were conducted at whole GM level 35 and regional level, 36 respectively, to quantitatively evaluate the neurovascular coupling. Automated anatomical labeling (AAL) atlas 37 was utilized for the region-based analysis by dividing the whole GM into 90 independent regions. With the original values of metrics, the CBF/ReHo ratio (defined as metabolic energy per unit of neuronal activity) 26 of each voxel within GM mask was computed and further z-scored to increase normality.
Statistical analysis
The normality distribution of demographic characteristics and clinical assessments was checked by using Kolmogorov–Smirnov method. The intergroup difference of age and was analyzed by using independent-samples T test. The comparison of sex between PD and HC groups was conducted by Chi-squared (χ2) test. Mann–Whitney U test was applied for the comparisons between groups in years of education and scores of clinical scales. SPSS software (version 19.0, SPSS Inc., Chicago, IL, United States) was utilized for the above statistical analyses. A P value <0.05 was defined as statistically significant.
The intergroup differences of metrics (sReHo, dReHo, z-CBF, and CBF/ReHo ratio) were analyzed in a voxel-wise manner within GM mask by using SPM 12 software and assessed with a cluster-defining threshold of P <0.001 (uncorrected) and a following familywise error (FWE) corrected cluster significance of P <0.05. The differences of correlation coefficients between groups were compared using independent-samples T test in SPSS 19.0 software. The significant intergroup differences from the above after comparisons were defined as regions of interests (ROIs). The mean values of each ROI in PD group were extracted. Spearman rank correlation test using SPSS 19.0 software was further applied to explore the potential associations between values of these ROIs and scores of clinical assessments. A statistically significant threshold was set at P value <0.05. Bonferroni correction for multiple comparisons in the correlation analyses was also performed. Age, sex, years of education, and GM volume (obtained from segmentation of T1 structural images) were taken as the covariates for the above analyses.
Classification performance analysis
The classification performances of aberrant metrics (sReHo, dReHo, z-CBF, and CBF/ReHo ratio) in distinguishing PD patients from HC subjects were identified by step-wised multivariate pattern analysis (MVPA). 12 Two sets of ROIs extracted from each subject were adopted as feature vectors. As a stable strategy for small sample size and minimizing overfitting possibility,38,39 leave-one-out cross-validation (LOOCV) was used to verify the ability of classifiers in both classification analyses. In each LOOCV loop (n = 101 loops), one subject’s data were selected as the testing set, and the remaining subjects’ data (n − 1) were labeled as the training set. The accuracy, sensitivity, specificity, and classification weights were calculated for classifier ability assessment. Permutation test (5000 times) was utilized to identify the statistical significance.
Results
Demographics and clinical assessments
The PD patients were included at early stage (H-Y stage, mean 1.11 ± 0.69) with relative short disease duration (mean 27.87 ± 15.67 months). No significant differences in age, sex, and years of education were found between HC subjects and PD patients (P>0.05). The two groups were assessed with normal global cognition and matched in scores of MMSE and MoCA (P>0.05). The detailed demographic characteristics and scores of clinical assessments are shown in Table 1.
Alterations of neuronal synchronization and correlations to clinical characteristics
Relative to HC subjects, the statistically higher dReHo variability in PD patients were distributed in bilateral middle temporal gyrus (MTG), left rectus gyrus, left middle occipital gyrus, and left precuneus, and their statistically lower dReHo variability was found in bilateral putamen and right supplementary motor area (SMA) (Figure 1(a)). The significant intergroup differences of brain regions in dReHo are listed in Supplementary Table S1. The values of dReHo in right putamen were significantly correlated to the scores of UPDRS-III (rho = –0.28, P = 0.030). Statistical association was found between the values of dReHo in left MTG and disease duration (rho = −0.32, P = 0.011) (Figure 1(b) and (c)). None of correlations were survived after Bonferroni correction (P <0.0063).
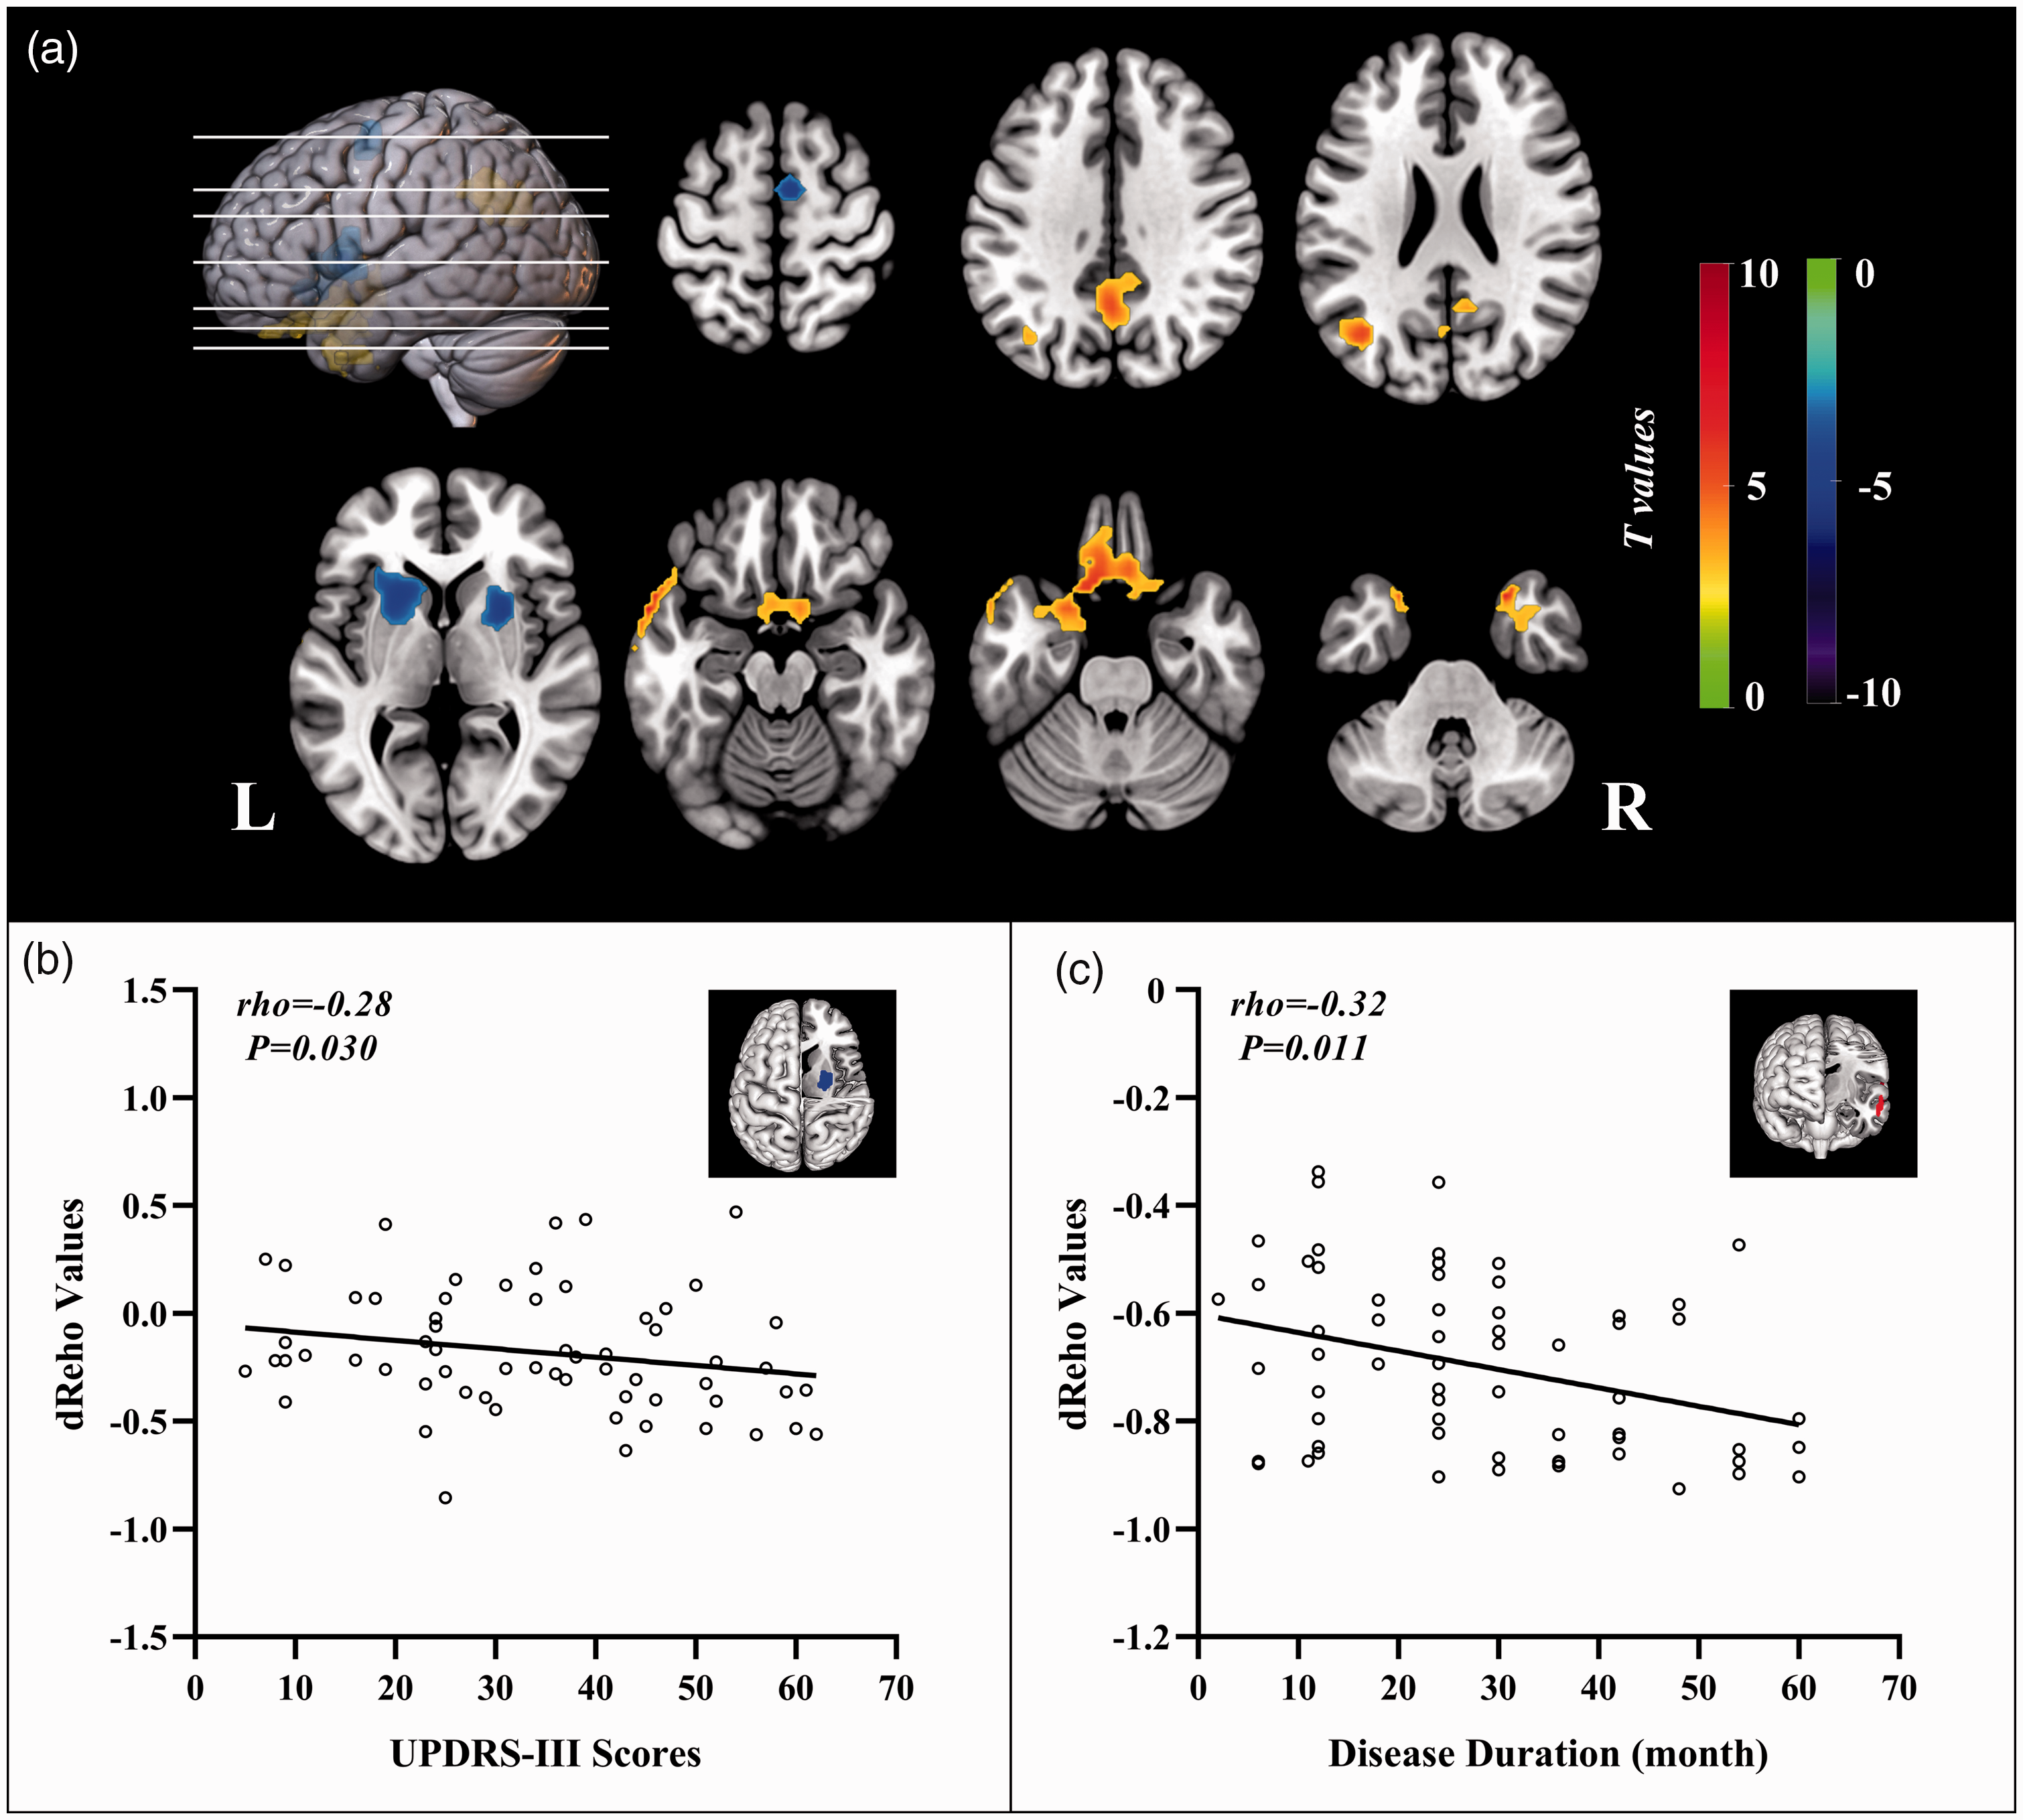
The distribution of brain regions with significant intergroup differences in dynamic ReHo and correlations to clinical assessments. Voxel-based analysis demonstrates the survived clusters between PD and HC groups (a). These clusters are referred to multiple comparisons correction using the FWE rate (a cluster-defining threshold of P = 0.001 and a corrected cluster significance of P < 0.05). Significantly increased value in the group is shown with warm color, while significantly decreased value in the group is shown with cold color. For PD group: correlations (b) between the scores of UPDRS-III (X-axis) and dReHo values in right putamen (Y-axis); correlations (c) between the disease duration (X-axis) and dReHo values in left temporal middle gyrus (Y-axis).
Compared with the HC group, the PD group exhibited statistically increased sReHo in right inferior temporal gyrus (ITG) and left superior frontal gyrus (SFG) but significantly reduced sReHo in bilateral lingual gyrus (LG) and bilateral postcentral gyrus (PG) (Supplementary Figure S1a). The statistically different brain regions in sReHo between the two groups are listed in Supplementary Table S2. The values of sReHo in bilateral LG were significantly linked to disease duration (rho = 0.26, P = 0.039) (Supplementary Figure S1b), which was not survived after Bonferroni correction (P <0.010).
Changes of neurovascular coupling at whole GM and regional levels
Statistical global and regional correlations were observed between CBF and ReHo in each group (P <0.05). Nevertheless, PD patients had significantly reduced global coupling of CBF-dReHo (rPD = 0.23, rHC = 0.27; P = 0.016) and CBF-sReHo (rPD = 0.31, rHC = 0.37; P = 0.010) compared with the HC subjects (Figure 2(a)). In terms of region-based analysis, significant intergroup differences of correlations (CBF-dReHo, CBF-sReHo) were found with downstream trend in thalamus, motor and somatosensory cortex, and temporal and occipital cortex (Figure 2(b) and (c), Supplementary Table S3). Meanwhile, upregulated correlations in striatum regions were observed in regional CBF-dReHo analysis (Figure 2(b)).
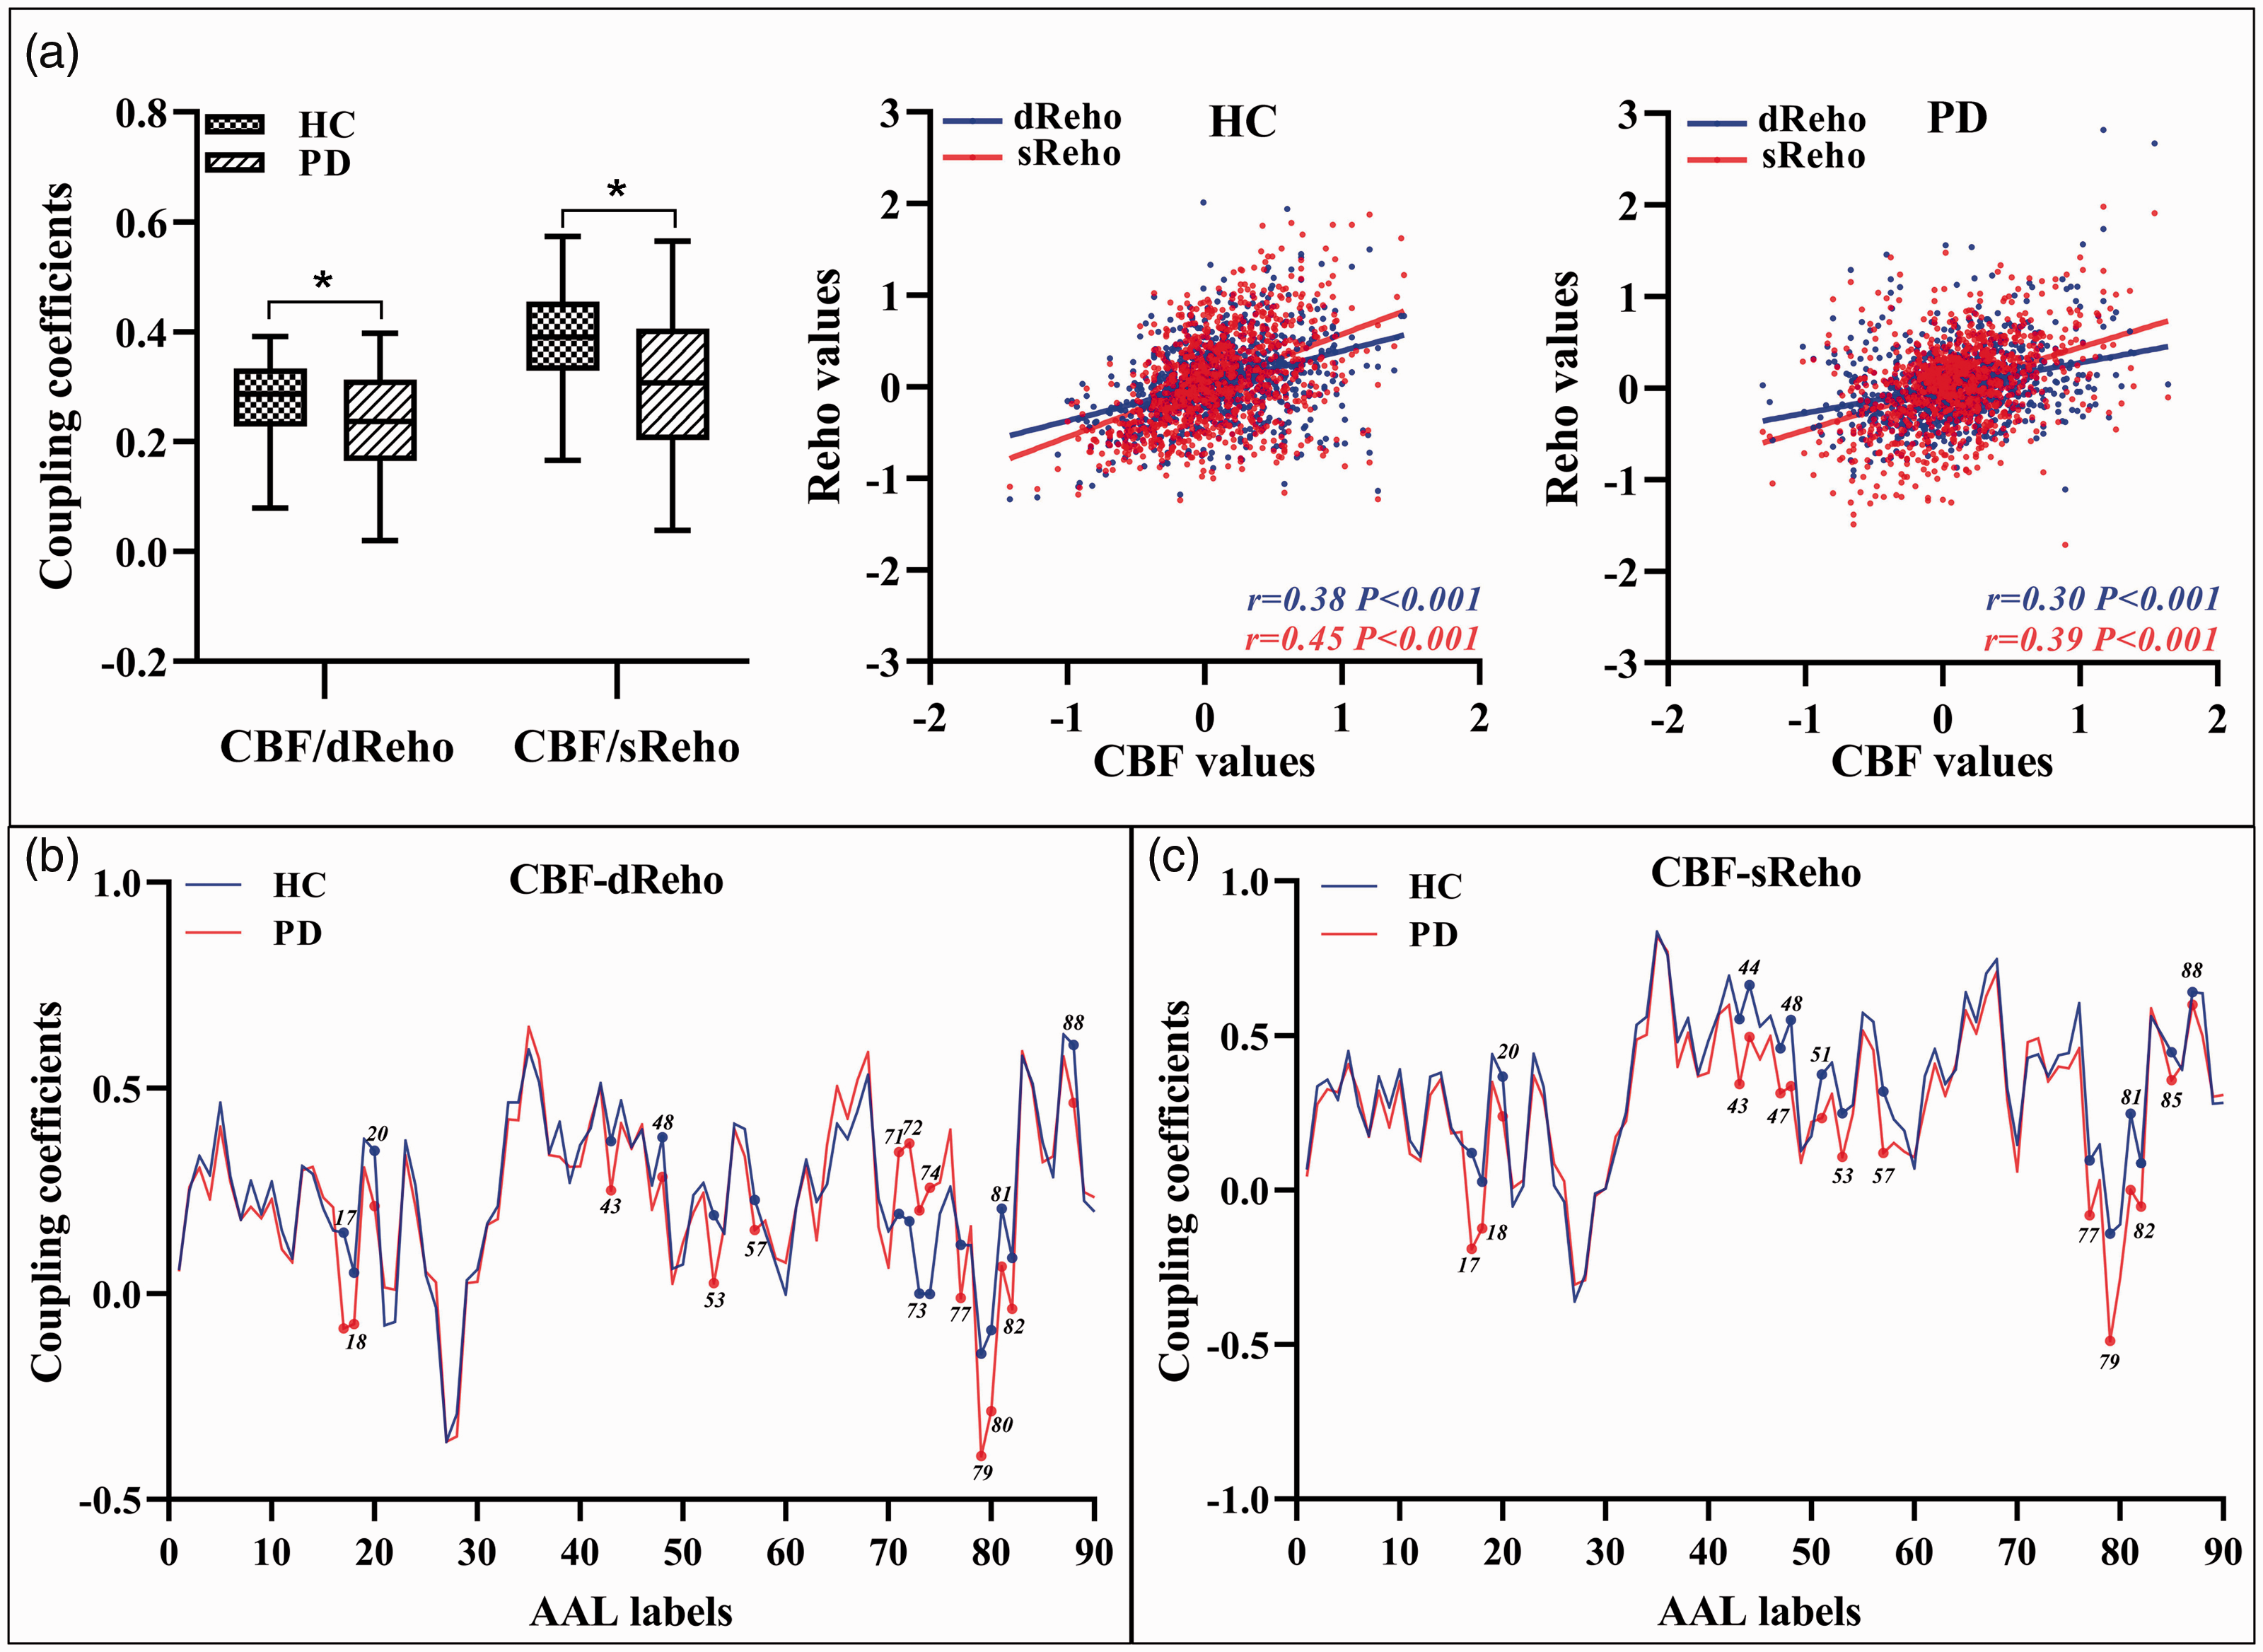
Neurovascular coupling alterations at whole gray matter level and regional level. The mean whole gray matter level CBF-ReHo coupling in PD and HC groups; and scatter plots of the spatial correlations across voxels between CBF and ReHo in representative individual (a);
Variation of CBF/ReHo ratio and linkages to clinical characteristics
For PD patients, statistical differences were found for the higher CBF/dReHo ratio in bilateral putamen, bilateral PG, right SMA, and left paracentral lobule (PL) and the lower ratio in left superior temporal gyrus (STG), left MTG, bilateral precuneus, and bilateral angular gyrus (AG) (Figure 3(a)). The significant intergroup differences of brain regions in CBF/dReHo ratio are listed in Supplementary Table S4. The values of ratio in right putamen were significantly linked to UPDRS-III scores (rho = 0.39, P = 0.0020), which was survived after Bonferroni correction (P <0.0045). The values of ratio in right AG and precuneus were significantly linked to disease duration (rho = 0.34, P = 0.0060; rho = 0.29, P = 0.021) (Figure 3(b) to (d)), which were not survived after Bonferroni correction (P <0.0045). The trend of brain regions exhibited significant intergroup differences in CBF/dReHo ratio as shown in Figure 4.
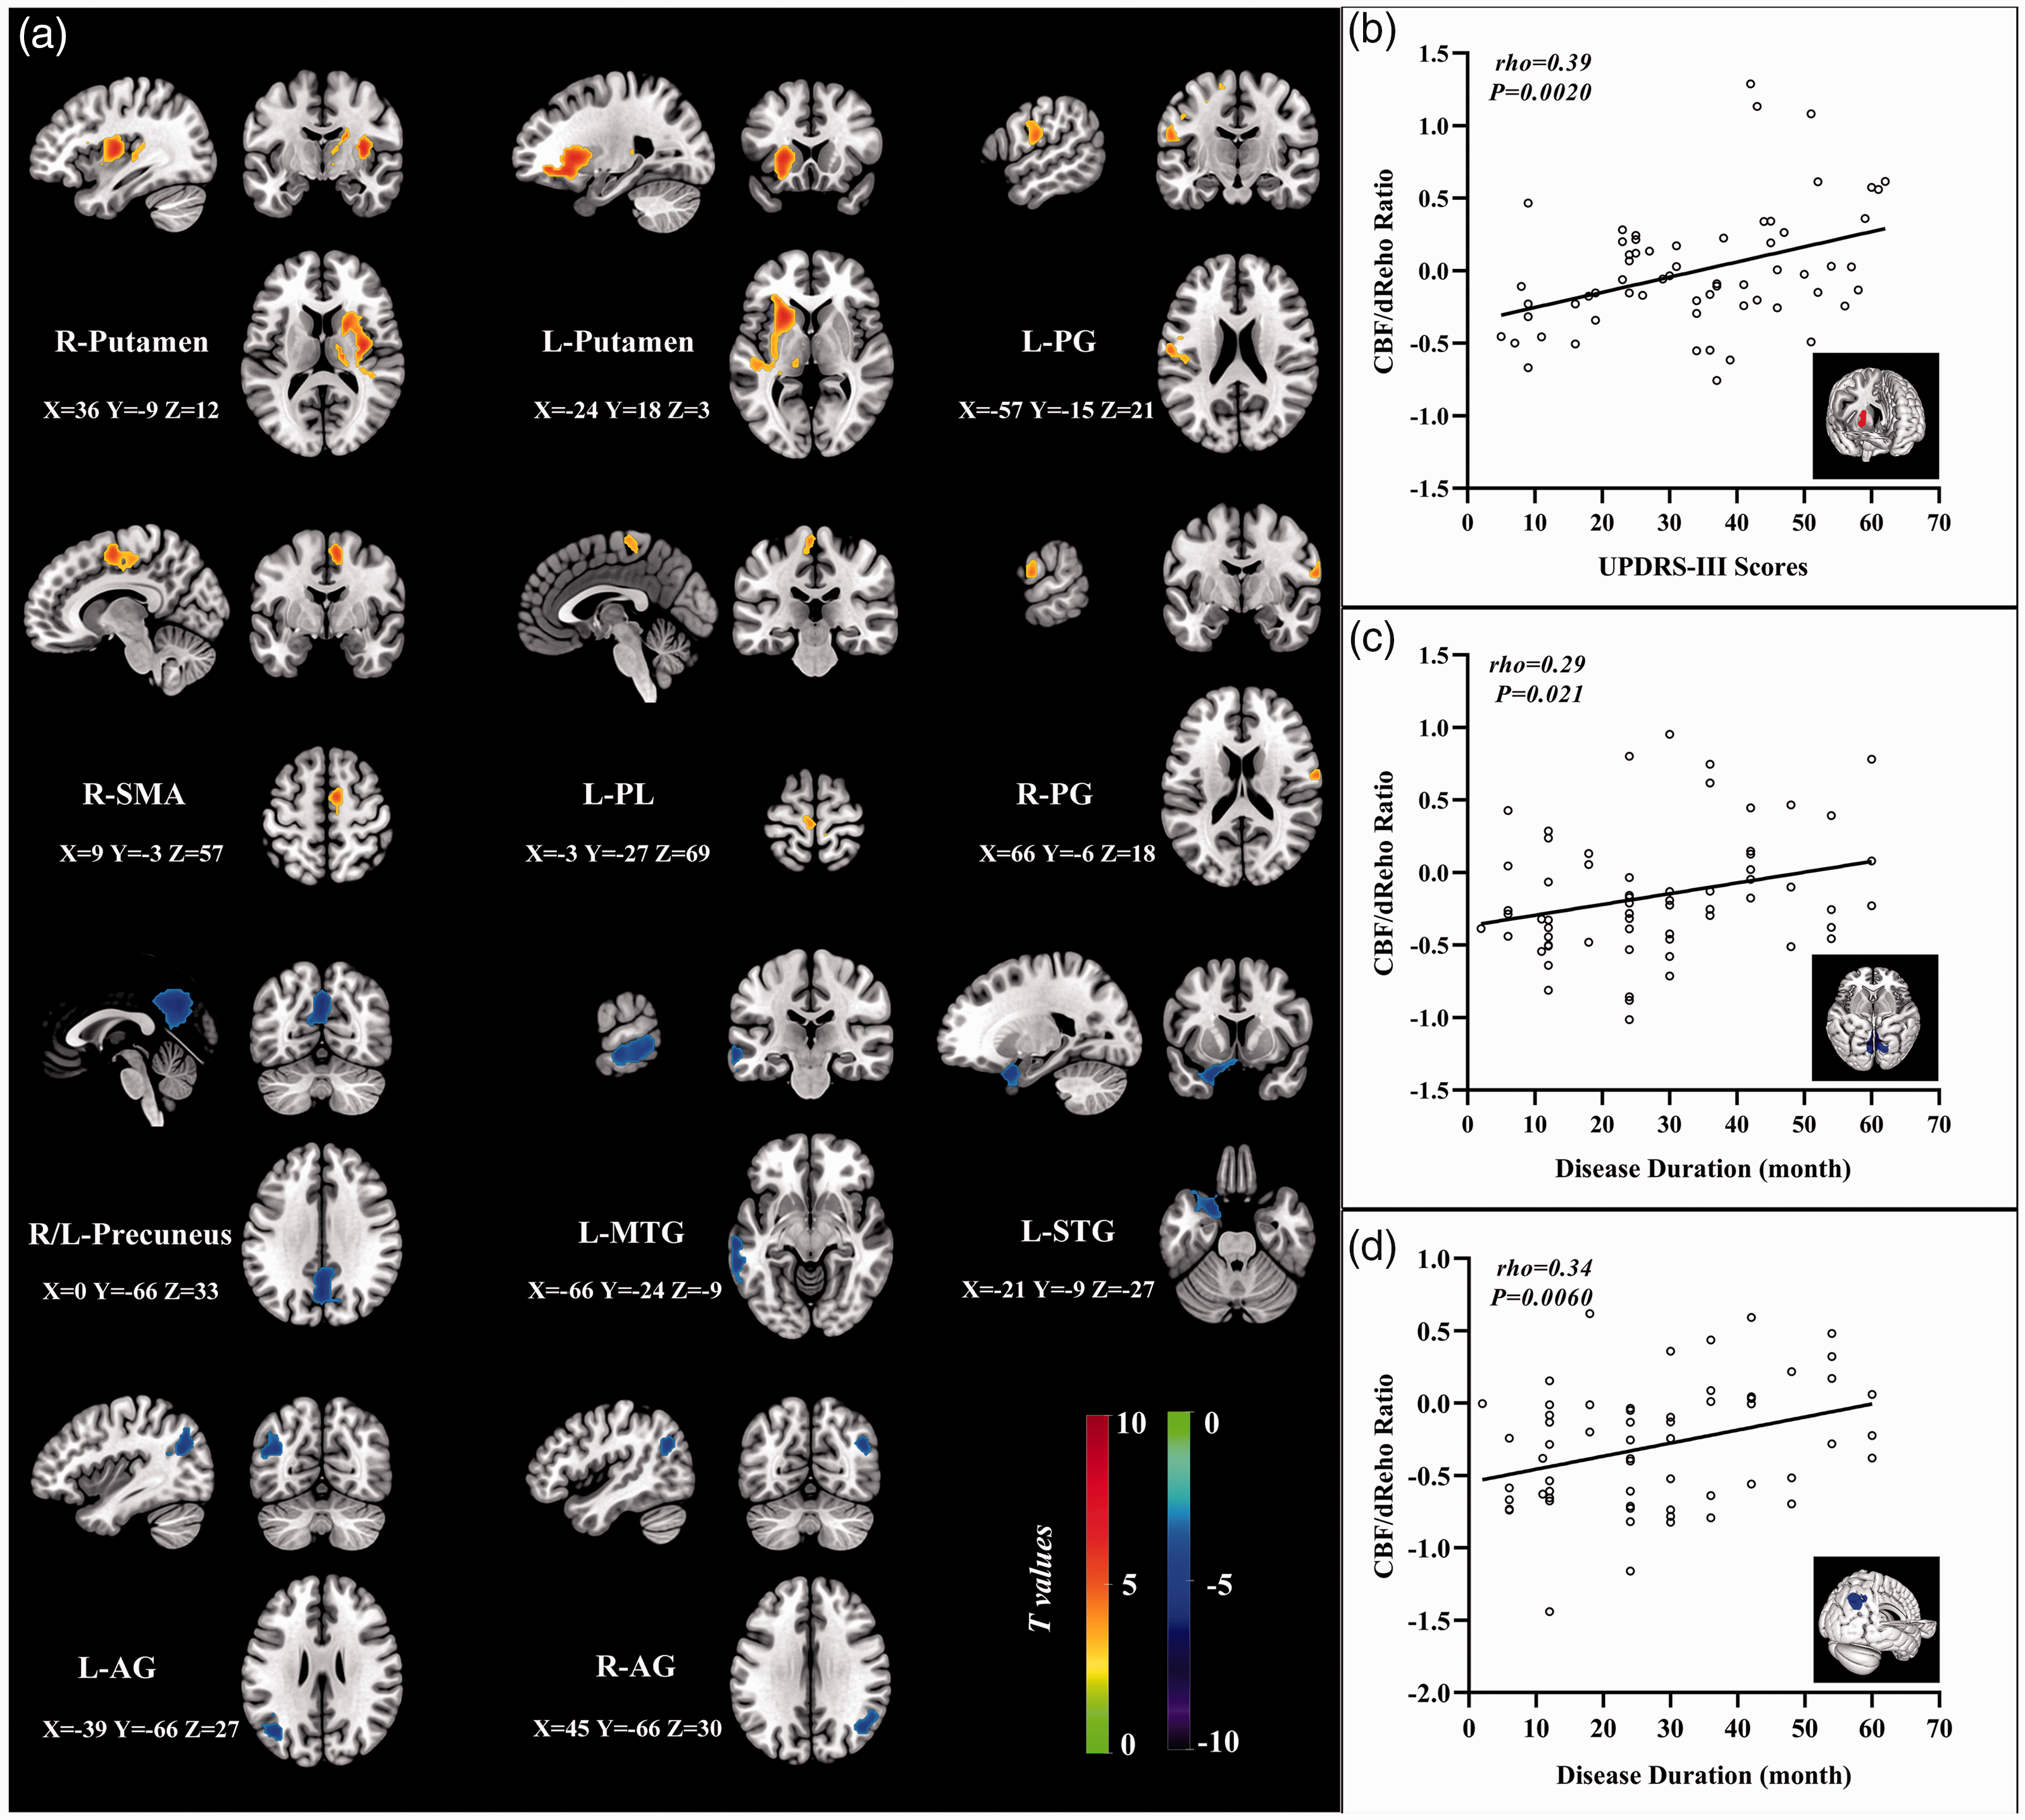
The distribution of brain regions with significant intergroup differences in CBF/dReHo ratio and correlations to clinical assessments. Voxel-based analysis demonstrates the survived clusters between PD and HC groups (a). These clusters are referred to multiple comparisons correction using the FWE rate (a cluster-defining threshold of P = 0.001 and a corrected cluster significance of P < 0.05). Significantly increased value in the group is shown with warm color, while significantly decreased value in the group is shown with cold color. For PD group: correlations (b) between the scores of UPDRS-III (X-axis) and CBF/dReHo ratio in right putamen (Y-axis); correlations (c) between the disease duration (X-axis) and CBF/dReHo ratio in right AG (Y-axis); correlations (d) between the disease duration (X-axis) and CBF/dReHo ratio in bilateral precuneus (Y-axis).
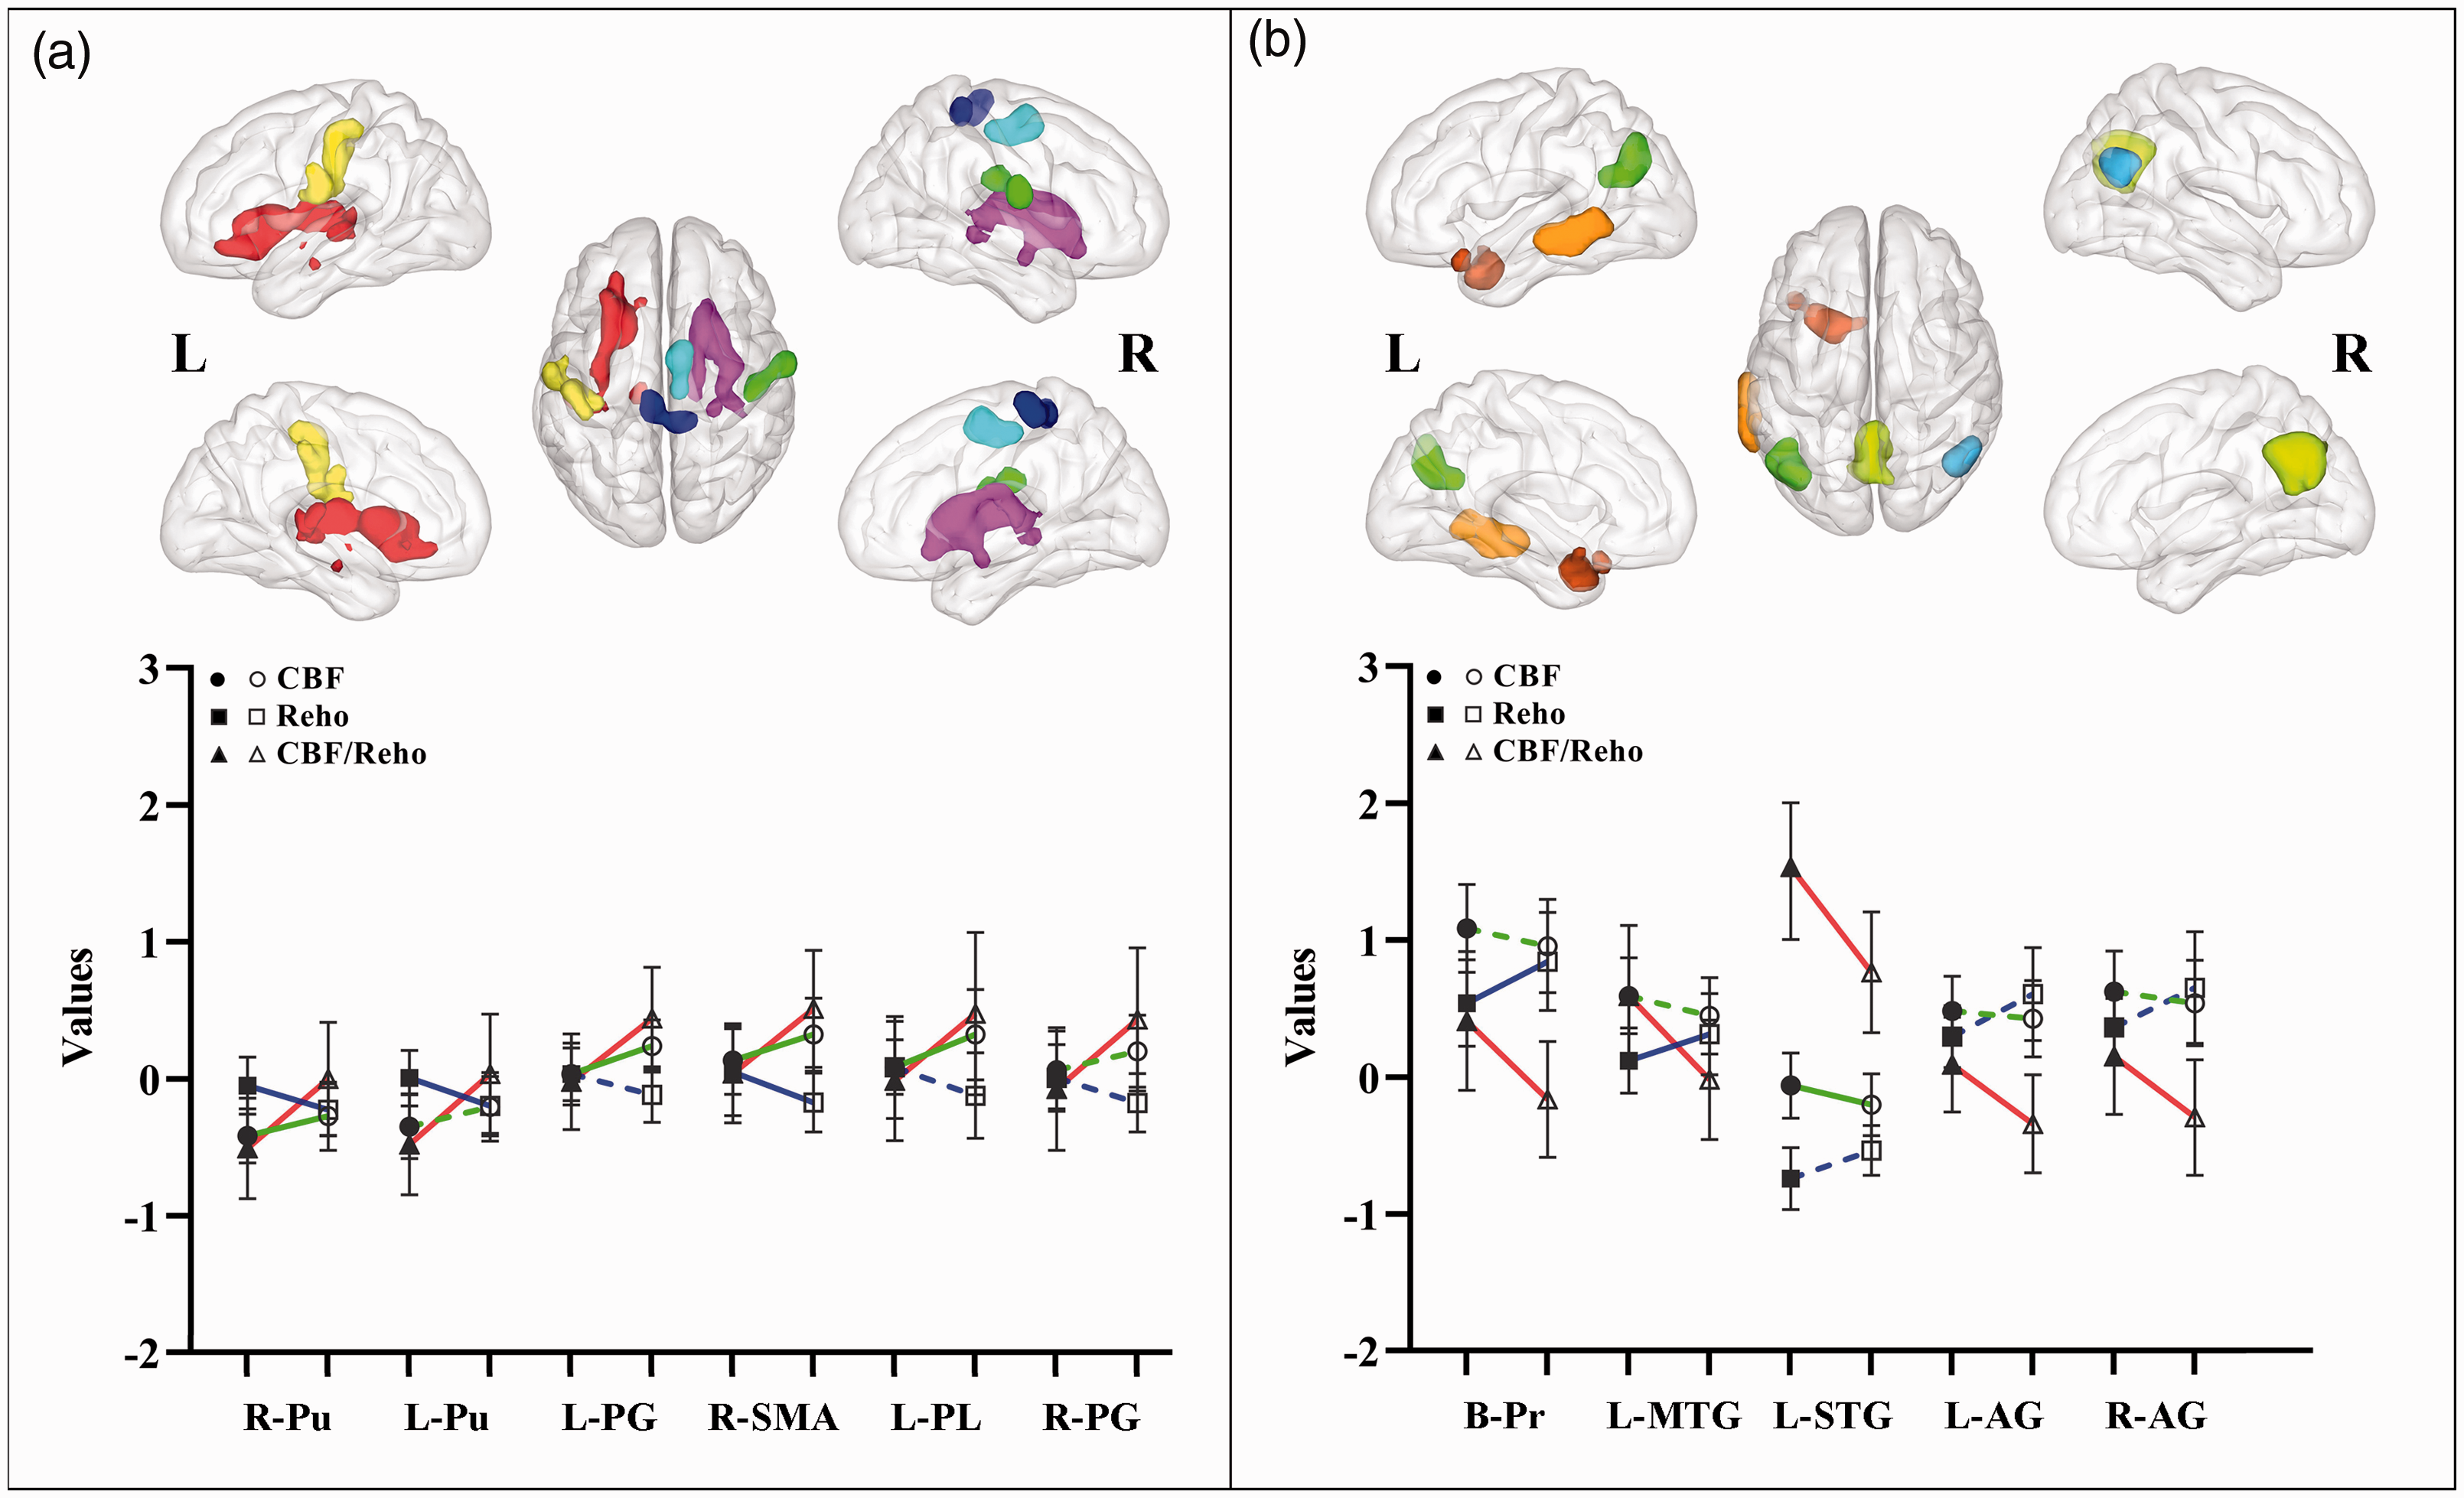
The trend of brain regions with significant intergroup differences in CBF/dReHo ratio. In the voxel-based analyses of PD and HC groups, the CBF/dReHo ratio in regions of significant increased (a) and in regions of significant decreased (b). The solid symbol refers to HC group, whereas blank symbol refers to PD group. Solid line indicates significant intergroup differences, whereas dotted line indicates non-significant differences.
Compared with the HC group, the PD group showed statistically increased CBF/sReHo ratio in bilateral LG, bilateral putamen, bilateral PG, and right SMA but statistically decreased static ratio in left STG, bilateral MTG, and left AG (Supplementary Figure S2a). The significantly different brain regions in CBF/sReHo ratio between two groups are listed in Supplementary Table S5. Significant linkages were observed between the values of ratio in right putamen and scores of UPDRS-III (rho = 0.34, P = 0.0070) and between the values of ratio in left LG and in left AG and disease duration (rho = –0.32, P = 0.012; rho = 0.29, P = 0.023) (Supplementary Figure S2b-d). The trend of brain regions exhibited significant intergroup differences in CBF/sReHo ratio as shown in Supplementary Figure S3. None of correlations were survived after Bonferroni correction (P <0.0045).
Distribution of impaired CBF and relationships with clinical characteristics
Compared with the HC subjects, the PD group had statistically higher z-CBF values in the right putamen, left PG, right thalamus, left PL, and right SMA but statistically lower z-CBF value in right insula, left superior frontal gyrus, and left STG (Supplementary Figure S4a). The significant intergroup differences of brain regions in CBF are listed in Supplementary Table S6. The values of z-CBF in left SFG were significantly correlated to UPDRS-III scores (rho = –0.30, P = 0.019) (Supplementary Figure S4b), which was not survived after Bonferroni correction (P <0.0071).
Classification performance of MRI features
With the statistically different ReHo values as features, the clustering results revealed the superiority of dReHo (accuracy 78.69%, sensitivity 76.67%, and specificity 80.65%) over sReHo (accuracy 72.95%, sensitivity 71.67%, and specificity 74.19%) (Figure 5(a) and (b)). Classification analysis also showed that CBF/ReHo ratio features were better than any separated metrics of ReHo and CBF (accuracy 81.15%, sensitivity 81.67%, and specificity 80.65%). The features of CBF/dReHo ratio (accuracy 90.16%, sensitivity 91.67%, and specificity 88.71%) achieved more powerful performance than those of CBF/sReHo ratio (accuracy 82.79%, sensitivity 81.67%, and specificity 83.87%) (Figure 5c–d). Permutation tests for the classification analyses all indicated a less than 0.0001 risk of being wrong.
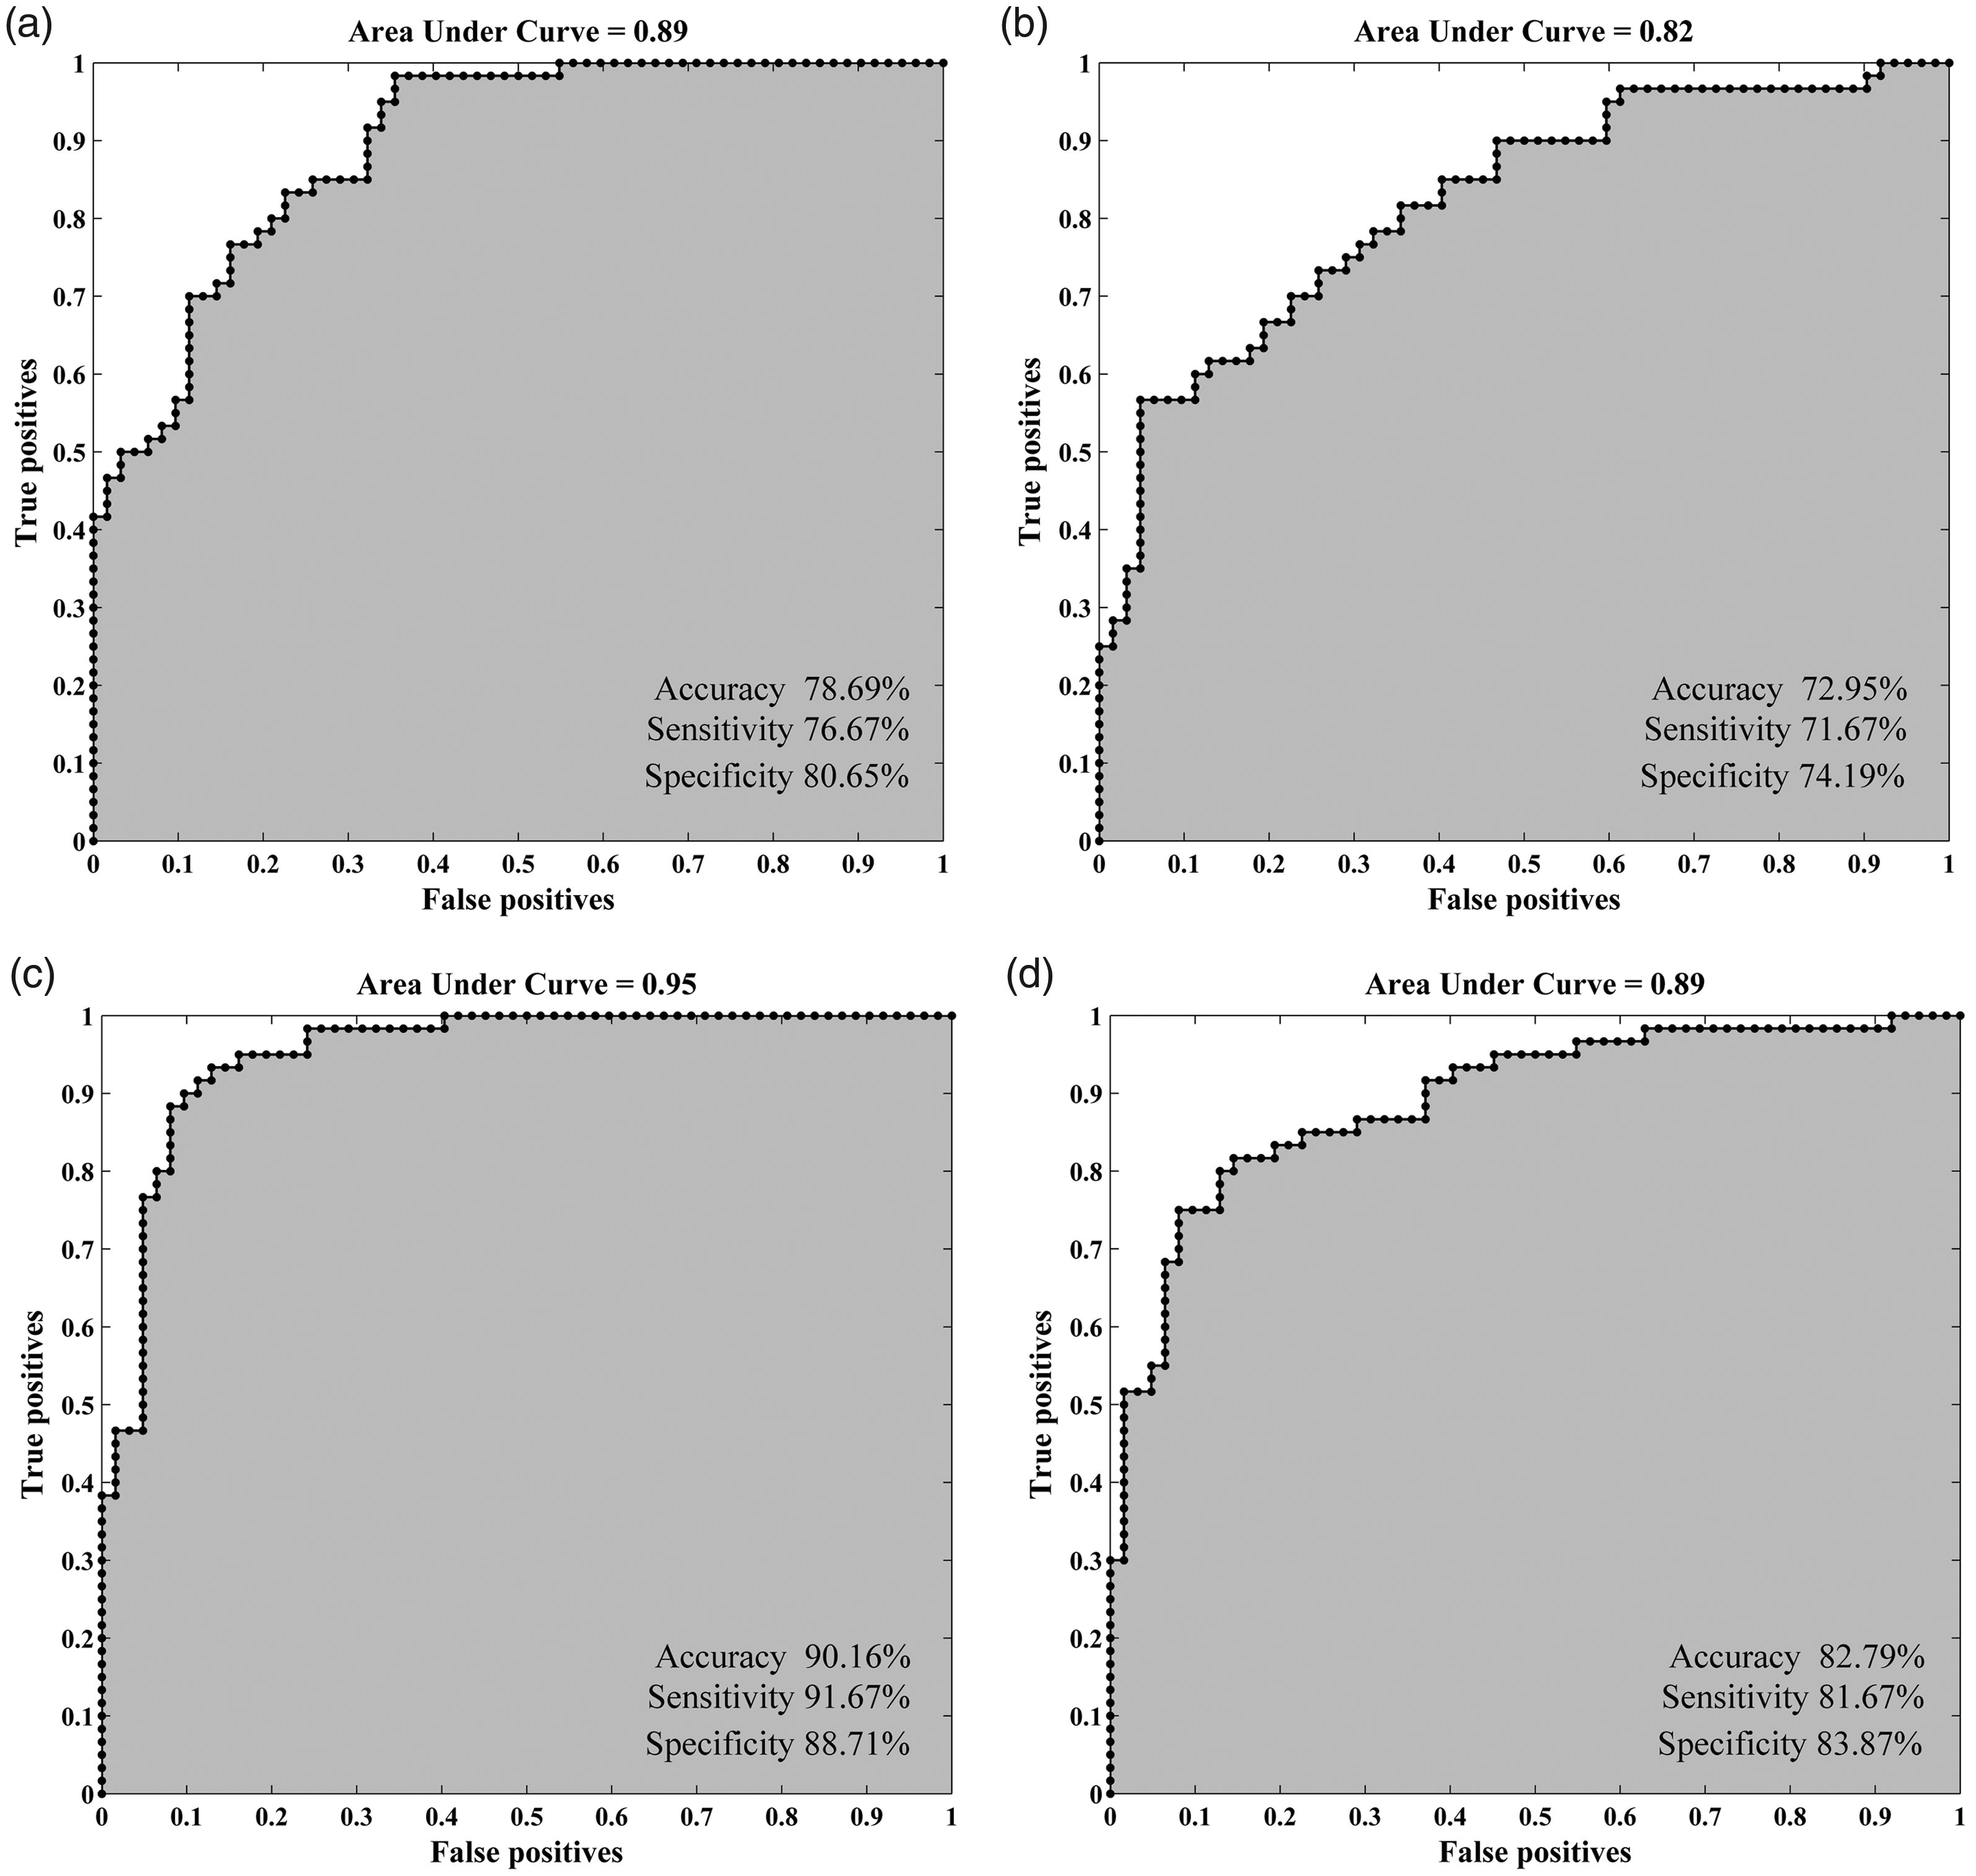
Classification performance of the MRI features. (a) the clustering results of dynamic ReHo features; (b) the clustering results of static ReHo features; (c) the clustering results of CBF/dReHo ratio features; (d) the clustering results of CBF/sReHo ratio features.
Discussion
For the PD group, dynamic synchronization pattern was identified as increased dReHo variability in regions of default mode network (DMN) and visual cortices, as well as reduced dReHo variances in motor-related regions. Accompanied by prominently global and regional CBF-ReHo decoupling, as compared with HC subjects, PD patients have higher CBF/ReHo ratio mainly in motor and somatosensory cortices and lower ratio mainly in temporal and parietal cortices. This study further revealed that dynamic features have better distinguishing ability than static features and verified that the classification performance could be further enhanced with features from CBF/ReHo ratio. The findings may reinforce the insights into early pathophysiological mechanism underlying PD from the standpoint of regional dynamic pattern and neurovascular coupling.
As the internal determinants of functional status, the spontaneous neuronal activities and interactions in neural systems vary dynamically and could be characterized via advanced algorithm on the basis of BOLD signals.29,40 The presence of impaired functional segregation and disrupted global integration in PD subtypes could be delineated efficiently by exploring the alterations of dynamic connections among brain regions.13–15 The identification of dynamic patterns within regional neuronal activity has been recently proposed, further validated by prominent findings associated to pathological mechanism, and consequently denoted as complementary to time-varying properties. However, the time-varying characteristics of local neuronal activity in PD need further elucidation because only one report explored the temporal fluctuation of local neuronal activity in PD patients by using the dynamic amplitude of low-frequency fluctuations (ALFF). 41 In the present study, dReHo was employed as an indicator of dynamic functional coherence with respect to neuronal activation and provided supporting evidence from the perspective of regional similarity. Moreover, the confounding effect of cognitive adaption on time-varying properties in PD revealed that the dynamic functional network, which was intact in PD patients with normal cognition, had deteriorated in PD patients with mild cognitive impairment. 42 By contrast, the early impaired time-varying synchronization of regional activity was observed in the regions involved in motor dysfunction among PD patients before the onset of global cognitive impairment. This dynamic pattern of functional coherence thus could provide potential details of regional synchronization complementary to those of static alterations.
Substantial correlations between ReHo and CBF across voxel at global and regional level were found in the HC group in accordance to the theory that neuronal activity and blood supply are tightly coupled on physiological conditions. 43 Although these correlations survived in PD patients, the disproportionate neurovascular coupling in this group potentially indicated the compromised coordination of NVU during the neurodegenerative process. Coupling analysis at the regional level further specified the decoupling in the individual region of PD. The weakened correlations in the motor-specific regions were in accordance with dopaminergic denervation, the hallmark pathology implicated in PD that induces functional or metabolic impairment through neuroinflammatory and oxidative stress reactions. An intriguingly increased CBF-ReHo coefficient in the neostriatum (putamen and caudate), the cardinal hub of basal ganglia circuitry, was discovered by using the dynamic index of regional neuronal activity. One conceivable explanation for this upregulation is the complementary mechanism for prominently decreased dopamine concentrations in the nigrostriatal pathway at early stage. Autopsy studies revealed that cholinergic transmitter system still proceeds at the early stage in PD, thus generating consequent degradation mainly in posterior cortices that are engaged in visual–spatial function and memory.1,3 Consistent to these autopsy findings, the posterior cortices with reduced coefficients in the present study suggested that cholinergic deficits could also potentially mediate the disturbance of NVU in PD. Integrating technical characteristics of other imaging modalities (electroencephalography, transcranial Doppler sonography),44,45 future studies with multi-modalities are warranted to confirm the relationship between neurotransmitters and NVU for the elucidation of the heterogeneity in PD.
The ratio of blood supply to neuronal activity could comprehensively depict the NVU modulations in voxel-wise manner and has been introduced as a quantitative imaging marker for cognitive dysfunction assessment.35,46,47 In accordance with previous investigations utilizing BOLD48,49 or ASL, 50 the present study obtained significantly altered ReHo and CBF in the vulnerable regions that involved in the management of movement coordination (putamen), control of motor initiation and execution (SMA), and modulation of sensorimotor integration (PG) for PD patients at voxel level. Given that regional hyper-metabolism corresponds to synaptic activation regardless of its excitatory or inhibitory properties, 51 this inverse trend of NVU indicated that the decreased neuronal synchronization (lower ReHo) in motor-related regions is ascribed to the inhibitory effect that is activated via high metabolic supply (high z-CBF). Furthermore, this pathological interaction could be efficiently reflected by CBF/ReHo ratio as confirmed by the overlapped regions with significantly high ratio and the correlations between the ratios in right putamen and disease severity. Impairment of the motor circuits and cardinal motor dysfunction are the pronounced features implicated in PD. Therefore, these prominent findings are meaningful for the elucidation of pathophysiological course within motor loop in PD. Higher dReHo in precuneus and MTG, the major components of the DMN engaged in internally directed cognition, 52 were monitored along with the decreasing trend of CBF, resulting to the deviated CBF/ReHo ratio. This finding was supported by previous reports that revealed neuronal excitability 48 or hypoperfusion 53 in DMN. Given the correlations between regions in DMN and disease duration, it’s reasonable to consider that the coexistent pattern of disrupted perfusion and cognitive compensation in DMN is manifested before the appearance of cognitive decline symptoms.
By employing MVPA, a pattern-classification algorithm for sensitive quantification of discriminative features at voxel level, we confirmed the superiority of dReHo over sReHo in the differential ability between PD patients with normal global cognition and HC subjects. The classification performance of dReHo in this study was close to that in previous report using dALFF (accuracy 80.36%, sensitivity 85.71%, and specificity 75%), 41 thereby supporting that regional dynamic neural activity could sensitively reflect the intrinsic functional performance of the neural system.12,54 Meanwhile, Liu et al. 55 just mentioned that the CBF/ReHo ratio could be superior to any separated approach for the detection of neurovascular coupling variation. The current research verified the classification performance of CBF/ReHo ratio with dynamic and static neuronal synchronization for the first time, highlighting that the CBF/ReHo ratio is powerful in the differentiation between PD patients and HC subjects. Whereas, more advanced approaches (deep learning, unsupervised learning) at individual level are still needed. Additionally, given that dynamic features are computed on the basis of static properties, the overlapped distribution of abnormalities may emphasize the importance of these involved regions in the pathology or process of PD. In contrast to negative CBF and ReHo results analyzed in voxel-wised manner, the significant intergroup difference of neuronal and metabolic alterations and the associations to clinical characteristics in several regions could be promisingly detected by CBF/ReHo ratio within the same statistical threshold, thereby benefiting from the amplification effect of ratio in regions with opposite trends of CBF and ReHo in PD patients. Nevertheless, the complicated consequence of decoupling could occur in regions with the same trend of alterations due to the synergistic or antagonistic response of NVU depending on the pathological status. 43 Therefore, the complementary information of every metrics is essential for probing the pathological modifications in PD.
Several limitations must be considered. First, although our findings are potentially meaningful with some enlightenments, the relatively small sample size might restrict the statistic power since several significant correlations failed to survive after Bonferroni correction. Future studies with large data set are warranted. Second, MMSE and MoCA scale were utilized for the evaluation of global cognition. Precise assessments of every cognitive domain are further recommended in longitudinal studies to identify the correlations between dynamic changes (functional and neurovascular) and cognitive impairments in PD. Third, although the sliding window was strictly set referring to the criteria (minimum length>1/fmin) and was previously validated, the optimal parameters still require further verification. In addition, the eye movements might still occur occasionally even with closed eyes and introduce potential bias for data analysis, which could be minimized by surveillance of eye movements via eye tracker. Finally, the influence of dopaminergic therapy could not be completely eliminated even by performing the clinical evaluations and MRI scanning on the OFF state. Additionally, despite of pronounced alterations in several brain regions, the asymmetric effects as well as motor-related subtypes (tremor dominant, postural instability and gait difficulty) were not analyzed in this preliminary study. Studies focusing on naive PD entity and follow-up investigations would yield compelling findings to understand the underlying mechanisms.
Conclusion
In conclusion, PD patients at early stage exhibit an impaired dynamic pattern of neuronal synchronization and disrupted neurovascular coupling before the onset of global cognitive impairment. These conditions are characteristically linked to motor dysfunction and disease duration. With the integrated BOLD and ASL approaches, the features of CBF/ReHo achieved powerful classification performance with improved accuracy for differentiation between PD patients and HC subjects. This research provided a new avenue to probe into the early functional abnormalities in PD, thus emphasizing the importance of temporal features in complementally investigating pathophysiological processes and the potential role of neurovascular decoupling in the neurodegenerative mechanism underlying PD.
Supplemental Material
sj-pdf-1-jcb-10.1177_0271678X221098503 - Supplemental material for Early disturbance of dynamic synchronization and neurovascular coupling in cognitively normal Parkinson’s disease
Supplemental material, sj-pdf-1-jcb-10.1177_0271678X221098503 for Early disturbance of dynamic synchronization and neurovascular coupling in cognitively normal Parkinson’s disease by Song’an Shang, Jing Ye, Jingtao Wu, Hongying Zhang, Weiqiang Dou, Vijaya Prakash Krishnan Muthaiah, Youyong Tian, Yingdong Zhang, Yu-Chen Chen and Xindao Yin in Journal of Cerebral Blood Flow & Metabolism
Footnotes
Funding
The author(s) disclosed receipt of the following financial support for the research, authorship, and/or publication of this article: Funding support for the research project was provided by the Natural Science Foundation of Jiangsu Province (No. BK20201118); National Natural Science Foundation of China (NSFC81571652); Science and Technology Project of Yangzhou (YZ2018059); “333 Project” of Jiangsu Province (BRA2017154).
Acknowledgements
The authors want to thank Dr. Xiaomin Xu from Nanjing First Hospital for her help in data analysis.
Declaration of conflicting interests
The author(s) declared no potential conflicts of interest with respect to the research, authorship, and/or publication of this article.
Authors’ contributions
Designed Research: S.S., J.Y., Y.T., Y.Z., Y.C., and X.Y.
Performed Research: S.S., V.M., and J.W.
Analyzed Data: J.Y., H.Z., and W.D.
Writing–Original Draft: S.S., and J.Y.
Writing–Review and Edit: Y.C., and X.Y.
Supplemental material
Supplemental material for this article is available online.
References
Supplementary Material
Please find the following supplemental material available below.
For Open Access articles published under a Creative Commons License, all supplemental material carries the same license as the article it is associated with.
For non-Open Access articles published, all supplemental material carries a non-exclusive license, and permission requests for re-use of supplemental material or any part of supplemental material shall be sent directly to the copyright owner as specified in the copyright notice associated with the article.