
Abstract
Cardiorespiratory fitness is thought to have beneficial effects on systemic vascular health, in part, by decreasing arterial stiffness. However, in the absence of non-invasive methods, it remains unknown whether this effect extends to the cerebrovasculature. The present study uses a novel pulsed arterial spin labelling (pASL) technique to explore the relationship between cardiorespiratory fitness and arterial compliance of the middle cerebral arteries (MCAC). Other markers of cerebrovascular health, including resting cerebral blood flow (CBF) and cerebrovascular reactivity to CO2 (CVRCO2) were also investigated. Eleven healthy males aged 21 ± 2 years with varying levels of cardiorespiratory fitness (maximal oxygen uptake (
Keywords
Introduction
Physical exercise is well known for its cardiovascular benefits, 1 yet the challenge remains of identifying how exercise is beneficial to the brain. Although studies using ultrasound methods have reported increases in resting cerebral blood flow (CBF) velocity 2 and cerebrovascular reactivity 3 associated with cardiorespiratory fitness, these methods often lack spatial specificity, reliability and consistency across individuals. 4 More recently, advances in arterial spin labelling (ASL) magnetic resonance imaging (MRI) have started to offer non-invasive measures of cerebrovascular function with enhanced spatial sensitivity for quantifying individual differences in cerebral dynamics compared to ultrasound methods. 5
Cerebral arterial compliance (AC) permits the arteries and arterioles to buffer pressure pulsations that arise from the heart, smoothing blood flow to the capillaries. Cerebrovascular reactivity (CVR) refers to dilation or constriction of vessels to control CBF, relying on complex signalling processes. In the healthy brain, compliance and reactivity work together to regulate local blood flow, protect against fluctuations in blood pressure and preserve autoregulation. 6 Formation of arterial plaques or vessel stiffening, which occur naturally in ageing and disease, 7 can disrupt these vascular mechanisms thereby putting the downstream microvasculature at risk; a potential contributor to small vessel disease 8 and cognitive decline. 9
Ultrasound imaging with simultaneous arterial applanation tonometry of the arterial waveform has shown that central arterial stiffness is reduced in those who exercise regularly.10,11 Due to a limited ability to assess diameters of intracranial arteries, however, ultrasound techniques are currently restricted to providing information about blood velocity and not volume or flow. One ultrasound method, transcranial Doppler (TCD) sonography, is only able to inform us about compliance of a distal vascular bed and not the local stiffness profile of the larger cerebral vessels themselves. 12 Optical imaging methods have also demonstrated a relationship between cardiorespiratory fitness and cerebral AC, as well as a regional correspondence with age and cognitive function. 13 This method has the advantage, over TCD, of extracting cerebral pulsatile waveform measurements from the arteries over which they are placed 14 yet despite this spatial advantage, the limited penetration of optical imaging precludes examination of the deeper vasculature.
Due to the added spatial resolution, MRI methods therefore allow more precise quantification of the local arterial wall properties rather than those distal to the site of measurement. ASL MRI is primarily used to map CBF. However, using novel ASL methods that measure changes in arterial blood volume (aBV) within cerebral arteries throughout the cardiac cycle, 15 it is possible to estimate AC in the major cerebral arteries.
The present study examined the association between cardiorespiratory fitness (
Materials and methods
Participants
Eleven healthy males, aged 21 ± 2 years old, provided informed consent under ethical approval from the University of South Wales and Cardiff University School of Psychology Ethics Committees. All experiments were performed in accordance with the guidelines stated in the Cardiff University Research Framework (version 4.0, 2010). We specifically chose to exclude females as oestrogen levels (during the menstrual cycle, menopause, and hormone replacement therapy) have been associated with intracranial vasodilatation and increased CBF. 22 In order to recruit a wide fitness range, participants who engaged in >150 min per week of self-reported moderate-to-vigorous intensity recreational aerobic activity were recruited from running and cycling clubs, while general University wide advertisement and word of mouth were used to recruit more sedentary participants. Clubs that involved higher impact sports, e.g. rugby, were excluded in this study to avoid complications that may arise from a history of concussion.
Subjects underwent a detailed clinical examination that included 12-lead functional diagnostic exercise electrocardiography (ECG) and were excluded if they showed signs of, or reported, any cardiovascular, cerebrovascular or respiratory disease. Participants were also screened by self-report for any neurological or psychiatric illnesses, regular smoking or prescribed medication. Individual differences in haematocrit (Hct) were assessed by sampling capillary blood from the middle finger. Samples were centrifuged for 10-min via ultracentrifugation and a micro-haematocrit reader (Hawksley and Sons Ltd, Sussex, England) used to quantify Hct. Three samples were acquired and mean Hct reported.
Study design
All participants took part in two separate testing sessions. Participants first underwent cardiorespiratory fitness testing at the University of South Wales and were then followed up for a second visit at Cardiff University Brain Research Imaging Centre, where they underwent 3 T MRI. Prior to each visit, participants were asked to refrain from drinking caffeinated drinks, taking any recreational drugs or engaging in any exhaustive exercise that may elevate heart rate and subsequently confound CBF measurements.
Cardiorespiratory fitness testing
The
Online respiratory gas analysis (Medgraphics, MA, USA) was performed during an incremental cycling exercise test to volitional exhaustion on an electronically braked, semi-recumbent cycle ergometer (Lode Corival, Cranlea & Company, UK) for the specific determination of ventilation,
MRI data acquisition
All scanning was carried out using a 3 T GE HDx scanner (GE Healthcare, Milwaukee, WI, USA) equipped with an 8-channel receive-only head coil. All participants underwent whole-brain T1-weighted structural scans (3D FSPGR, 1 × 1 × 1 mm 3 voxels, TI = 450 ms, TR = 7.8 ms, TE = 3 ms) for registration purposes.
Middle cerebral artery compliance and grey matter CBF
A multi-inversion time (MTI) pulsed ASL acquisition was performed at rest. A Proximal Inversion with Control of Off-Resonance Effects (PICORE) ASL sequence was used to improve the profile of the labelling slice. A QUIPSS II (quantitative imaging of perfusion using a single subtraction) cut-off was also applied at 700 ms 25 to reduce the sensitivity of the arterial transit time. Ten inversion times (TIs) were acquired, whereby short (TIs = 250, 350, 450, 550, 650 ms) medium (TI’s = 750, 850 ms) and long TIs (TI’s = 1000, 1500, 2000 ms) were acquired as separate scans in which the label (width = 200 mm) was applied 10 mm below the most proximal slice. Images were acquired with similar parameters to those described elsewhere 17 using a spiral readout single shot gradient echo sequence (TE = 2.7 ms) with the following acquisition parameters: a variable repetition time (1000 ms to 3400 ms), eight control–tag pairs per TI, 12 slices, slice gap = 1 mm, voxel size = 3 × 3 × 7 mm3. Total acquisition time was ∼18 min. For quantification of perfusion, a (M0) calibration scan was acquired without labelling in which the same acquisition parameters were applied as above, but with a long TR.
CVR
A breath-hold paradigm was carried out as described elsewhere. 26 Participants were instructed to complete five end-expiration breath-holds (15 s each) interleaved with 30 s periods of paced breathing at a rate of 12 breaths per minute. 27 After each breath-hold, the subject was cued to exhale first to obtain a measure of peak end-tidal CO2. Total scan duration was approximately 4 min during which quantitative arterial spin labelling (pASL) and BOLD-weighted images were acquired with a single-shot PICORE QUIPSS II 25 pulse sequence (TR = 2.2 s, TI1 = 700 ms, TI2 = 1500 ms, 20-cm tag width, and a 1-cm gap between the distal end of the tag and the most proximal imaging slice) with a dual-echo gradient echo (GRE) readout 28 and spiral acquisition of k-space (TE1 = 2.7 ms, TE2 = 29 ms, flip angle = 90°, field of view (FOV) = 22 cm, 64 × 64 matrix). Twelve slices of 7 mm thickness were imaged, with an inter-slice gap of 1 mm.
Physiological monitoring
Throughout scanning, the cardiac pulse was recorded using a finger plethysmograph and a pneumatic belt just below the ribcage was used to measure the respiratory cycle. Expired gas content was monitored continuously via a nasal cannula, whereby end-tidal O2 and CO2 data were recorded using a rapidly responding gas analyser (AEI Technologies, PA, USA) to provide representative measures of arterial partial pressures of both gases at the prevailing barometric pressure. Brachial artery blood pressure (BP) was measured at three time-points across the scan session using an MRI-compatible BP cuff (OMRON, Tokyo, Japan).
MRI data analysis
Physiological noise correction
Physiological noise correction was carried out on the raw data using a modified RETROICOR pipeline. 29 For the raw CBF data, the first and second harmonics of the cardiac and respiratory cycles (and the interaction term) were calculated, as well as variance related to end-tidal CO2, end-tidal O2, heart rate, and respiration volume per time (RVT) 30 using a general linear model framework and subsequently regressed from the raw CBF signal. For the MCAC data, only respiratory noise correction was performed.
MCAC quantification
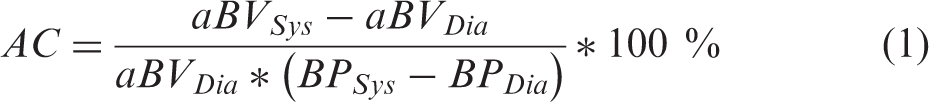
AC measurements were carried out using the methods described by Warnert et al. 17 (equation (1)). Arterial blood volume (aBV) within the bilateral middle cerebral arteries (MCA) was assessed in systole and diastole. Brachial artery blood pressure cuff recordings were averaged over three time points to calculate average systolic and diastolic BP for each subject. Only data from short TIs (250–850 ms) were necessary for deriving aBV to ensure that signal being measured was originating from the arteries rather than the tissue. To determine systole and diastole, the cardiac cycle was divided into five phases using the finger plethysmography trace. The short TI images were retrospectively organized into the five cardiac phases and an arterial input function was fitted voxel-wise for each of the five phases. The cardiac phases with the maximum and minimum blood volumes, averaged over both MCAs, were used as systole and diastole, respectively.
Equation (1) was used to calculate AC (%/mmHg). Voxel-wise differences between aBVSys and aBVDia were calculated, normalised for the aBV in diastole to produce AC values of percentage change in aBV/mmHg (%/mm Hg). Masks of the bilateral MCA were obtained at the level of the M1 segments, branching from the circle of Willis, by thresholding the aBV images (aBV > 0.1 % of the voxel) and masking out the anterior and posterior arteries.
Grey matter CBF quantification
The full MTI time series was used for quantification of resting CBF. Signal within the ventricles (M0,CSF) was used to estimate M0,blood 31 and subsequently modelled to calculate whole-brain perfusion maps based on the entire MTI dataset using FSL BASIL toolbox (FMRIB Software Library, Oxford, UK). Due to the inherently low SNR in ASL imaging, an ROI approach was chosen, a priori, in favour of a voxel-wise CBF analysis. Grey matter ROIs were computed by performing whole brain automated segmentation of the T1-weighted structural image using the FSL FAST toolbox. 32 Segmented grey matter masks were spatially down-sampled into functional space, and binarised to produce an individual grey matter specific mask for each subject. Whole-brain GM masks were applied to CBF maps to produce a median GM CBF estimate.
CVR quantification
Simultaneously acquired CBF and BOLD time-series images were corrected for head motion with MCFLIRT, 33 brain-extracted 34 and spatially smoothed with a Gaussian kernel of 6 mm using SUSAN. 35 BOLD images were calculated from the second echo data using interpolated surround averaging of the tag and control images to yield a BOLD-weighted time-series, as described previously. 36 The first echo data were used to calculate a subtraction time-series 37 from which CBF was quantified using the standard single-compartment CBF model. 25 BOLD and CBF time-series data were converted to percentage change in the signal relative to the baseline (mean) of the time-series to produce a %ΔBOLD and %ΔCBF time-series, respectively. Signal was averaged across whole-brain grey matter. A regression analysis was performed to measure %ΔBOLD and %ΔCBF per mmHg change in absolute end-tidal CO2 with a third order polynomial included to remove slow signal drift. Temporal lag-fitting (time-shift steps of 0.1 s) was also carried out, to account for the delay between end-tidal CO2 increase in response to breath-holding and the subsequent blood flow response. 26 CVR was thus defined as the beta-weight from the regression model, where BOLD and CBF were measured in units of %BOLD/mmHg or %CBF/mmHg, respectively.
Statistical analysis
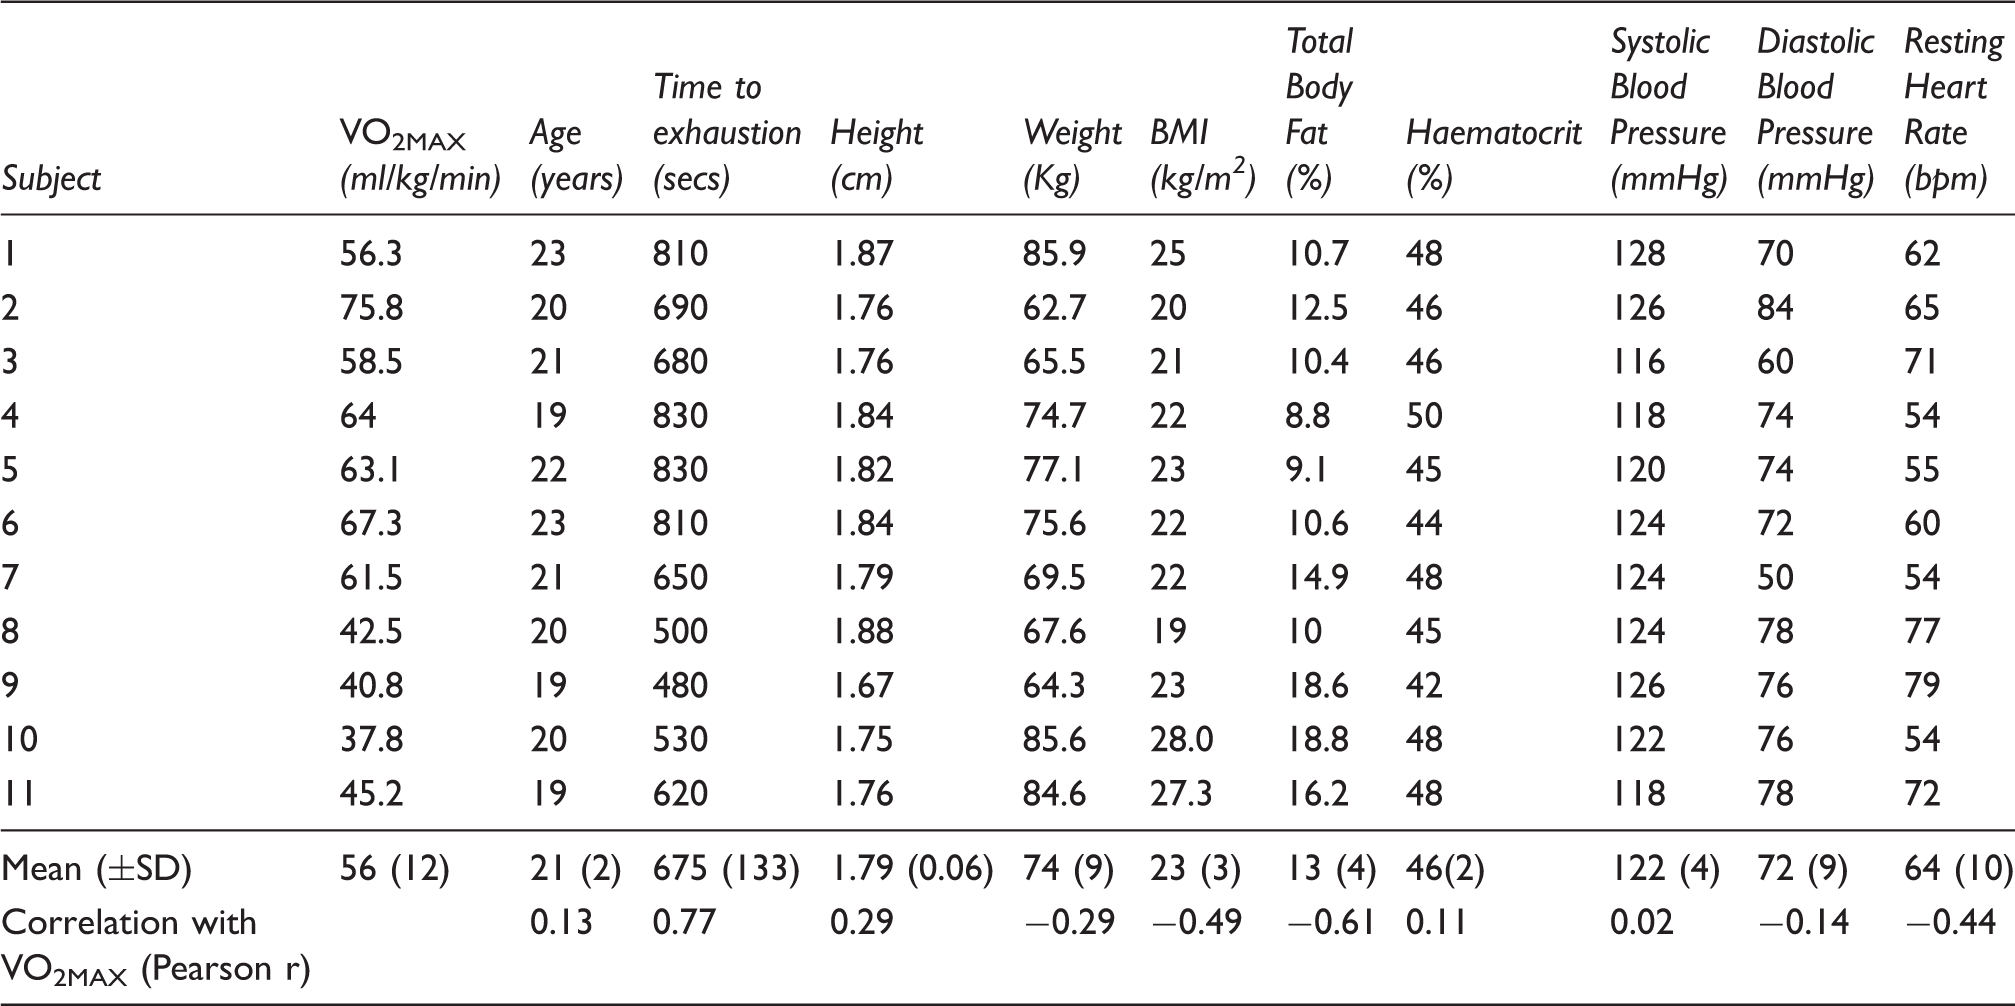
Anthropomorphic measures for all subjects.
Results
Physiological measures
VO2MAX was associated with longer time to exhaustion (p = 0.006). Those recruited from cycling (circles) and running (triangles) showed higher VO2MAX and time to exhaustion than community controls (diamonds).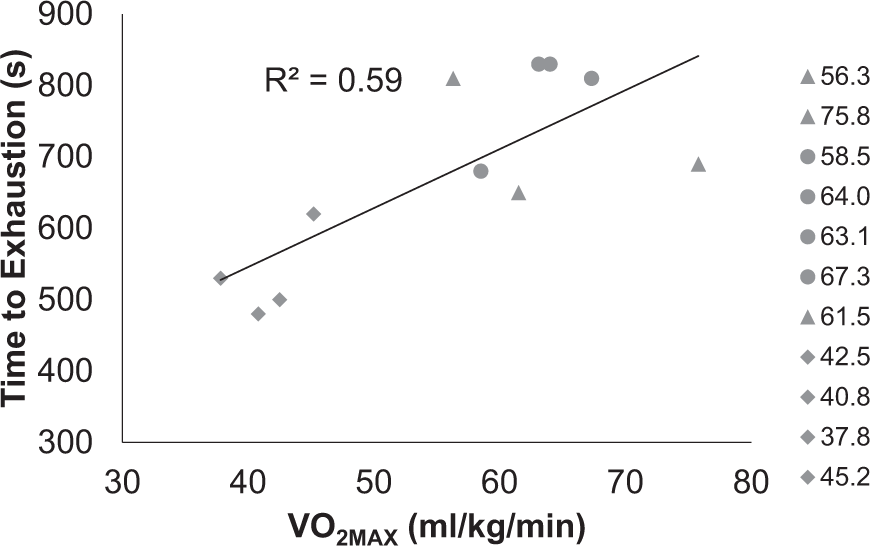
Resting heart rate was not predictive of MCAC (R2 = 0.10, F (1, 7) = 0.75, β = − 0.006, p = 0.42, 95% CI [−0.02, 0.01]), global GM CBF (R2 = 0.001, F (1, 6) = 0.006, β = 0.23, p = 0.94, 95% CI [−0.70, 0.74]) or CVR measures (BOLD R2 = 0.01, F (1, 8) = 0.10, p = 0.76, 95% CI [−0.001, 0.009]); CBF R2 = 0.06, F (1, 8) = 0.53, p = 0.49, 95% CI [−0.18, 0.09]). Hct was not correlated with any of the MRI measures (MCAC (r (7) = −0.15, p = 0.71); global GM CBF (r (6) = 0.07, p = 0.87); CBF CVR (r (8) = 0.41, p = 0.24); or BOLD CVR (r (8) = 0.35, p = 0.33).
MCAC
Nine participants contributed to the MCAC analysis as two were removed due to severe head movement, observed during visual inspection of MR images, that could not be rectified by volume removal. Averaged over all participants, we calculated bilateral MCAC to be 0.41 ± 0.16 %/mmHg. Linear regression revealed strong evidence of an association between Increased 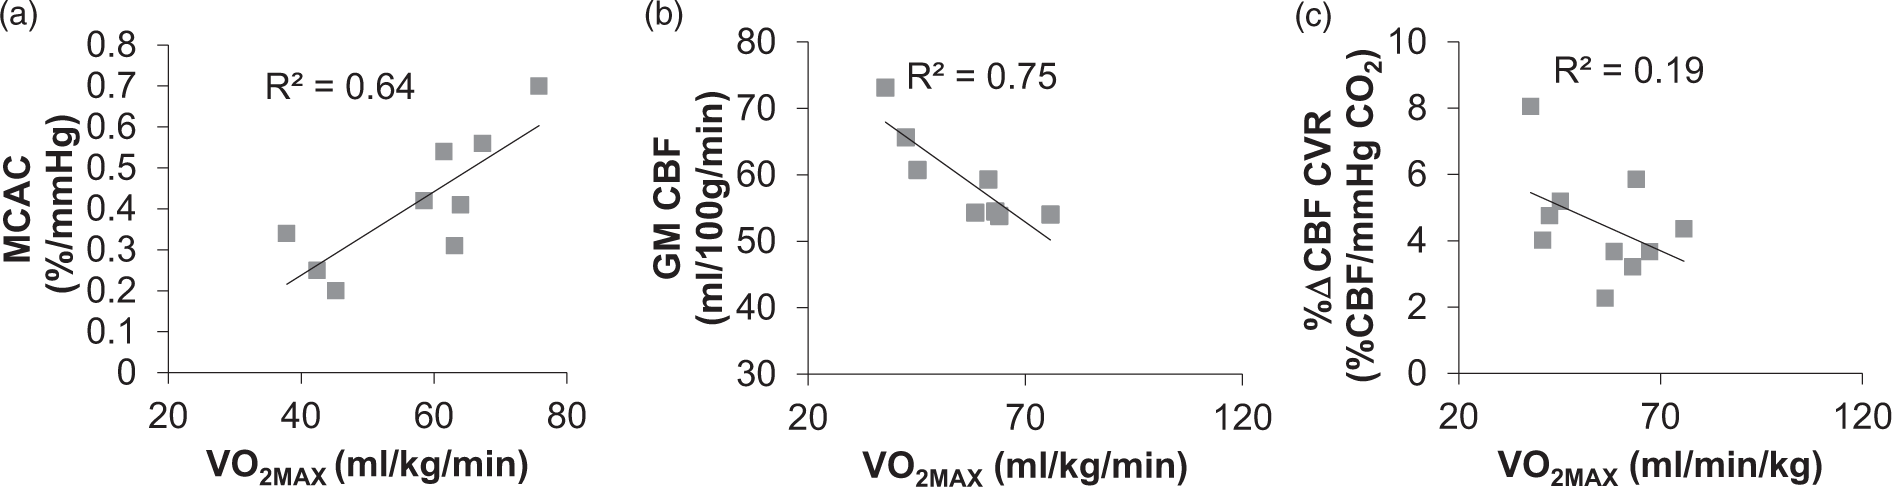
Retrospective synchronisation of images across the cardiac cycle was inspected to ensure that there was not a bias between the number of tag and control images for a particular TI or cardiac phase. A repeated-measures ANOVA revealed that the number of tag and control images did not differ between TI (F (6,48) = 1.3, p = 0.30) or cardiac phase (F (1,8) = 0.7, p = 0.43), nor was there an interaction between the number of images within each cardiac phase at each TI (F (6,48) = 0.54, p = 0.78). On average, for a single TI, there were 6 tag and 7 control images in diastole, and 6 tag and 6 control images in systole.
Grey matter CBF
Whole-brain GM averaged CBF values ranged from 53.8 to 73.1 ml/100 g/min (59.4 ± 6.7). Eight participants contributed to baseline CBF analysis (three were excluded due to severe head motion). Linear regression revealed an inverse relationship between
CVR
CVR data were excluded for one participant because the subject was unable to breathe through his nose, so that 10 subjects contributed to the CVR analysis. BOLD data demonstrated better signal-to-noise (SNR) than CBF measurements in response to breath-holding (see Figure 3(a)). However, CBF CVR was positively correlated with the BOLD CVR measurements across whole-brain GM (R2 = 0.52, β = 12, F (1,8) = 8.8, p = 0.01, 95% CI [0.034, 0.078; see Figure 3(b)]. Both measurements showed a decline in CVR with increasing (a) BOLD and (b) CBF responses to the breath-hold task within a grey matter mask. Coloured lines represent individual subject data; black lines reflect the average response across participants. BOLD time-series showed better signal-to-noise than CBF. (c) BOLD CVR (%ΔBOLD/mmHg PET CO2) was strongly associated with CBF CVR (%ΔCBF/mmHg PET CO2) were positively correlated (p = 0.01).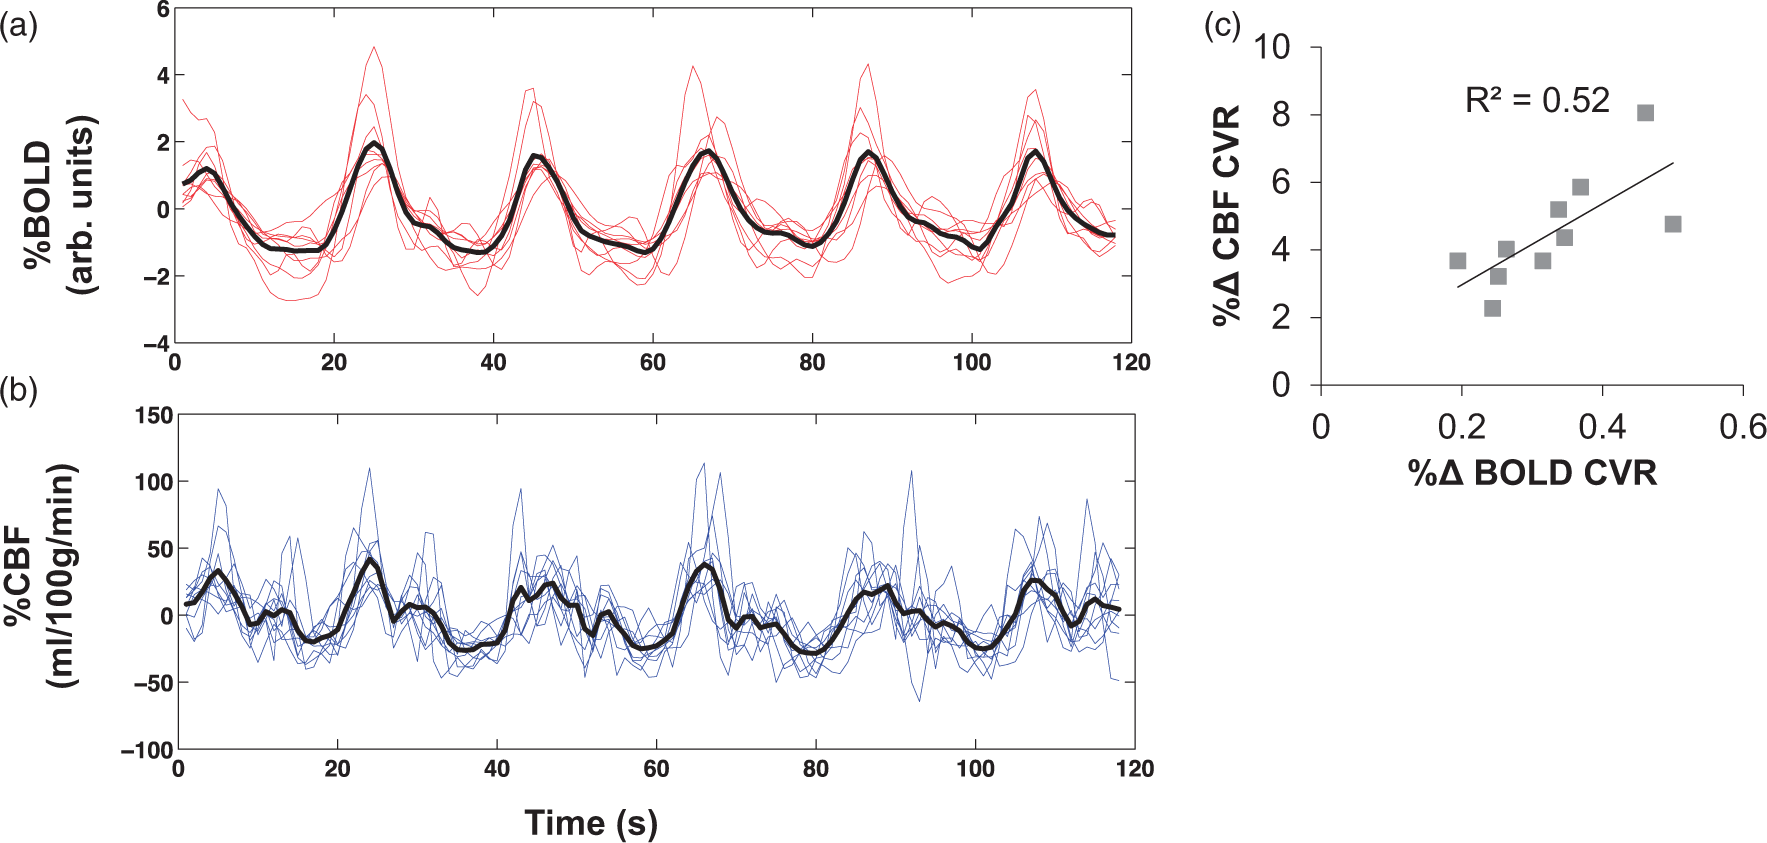
Relationship between MCAC, whole-brain CBF and CVR
MCAC was not correlated with either BOLD CVR (r (7) = −0.20, p = 0.68, 95% CI [−0.89, 0.44]), CBF CVR (r (7) = −0.14, p = 0.78, 95% CI [−0.54, 0.39]), nor with resting grey matter perfusion (r (7) = −0.45, p = 0.30, 95% CI [−0.73, −0.33]). There was, however, evidence for a positive association between resting grey matter perfusion with both CBF CVR (r (6) = 0.76, p = 0.49, 95% CI [0.04, 0.95] and BOLD CVR (r (6) = 0.78, p = 0.38, 95% CI [−0.35, 0.97]).
Discussion
Whilst the benefits of physical activity on cognition and mental health are well recognised, the physiological mechanisms by which exercise exerts its beneficial effects on the brain remain poorly understood. In this study, we demonstrate that ASL MRI is a useful tool for understanding how fitness may influence vascular function, in particular, cerebral AC.
MCAC
The present study utilised a novel, non-invasive, measure of MCAC based on pASL MRI to demonstrate the link between cardiorespiratory fitness and cerebral AC in a sample of young males whose fitness ranged from ‘fair' to ‘superior' for men aged between 20–29.
38
We showed that MCAC was higher in individuals with higher
It has been suggested that the ability of cerebral arteries to dampen changes in pulse pressure may prevent downstream tissue damage where vessels are vulnerable to deterioration. 8 Higher MCAC, as measured here, can be thought to reflect healthy, more ‘elastic’ vessel walls than those with lower MCAC, a possible marker of better cerebrovascular health in those with high cardiorespiratory capacity. Damage to the microvasculature has been associated with poorer memory, processing speed and executive function.13,39,40 ‘Training’ the vessel through increasing AC could give rise to some of the cognitive benefits that have been reported as a result of exercise, by preventing age-related arterial stiffening and reducing a down-stream deleterious effect of pulsatile flow on the microvasculature within the tissue bed.
Our MRI results corroborate indirect evidence from the ultrasound literature that shows an increase in extracranial compliance with cardiorespiratory fitness. 41 Validation of this link using our ASL methods lends support for future interventional exercise studies, where the mechanisms underpinning MCAC can be explored in different ages, and with different types and modes of exercise. Resistance training has been found previously to reduce AC, or have no effect on, carotid artery compliance, whereas aerobic training leads to increased AC. 42 Similarly, high intensity interval training (HIIT) differs from continuous moderate intensity exercise on measures of arterial stiffness.43–45 It has been proposed that a moderate or higher load of training may be required to influence endothelial function in healthy people 46 where repeated shear stress stimulation is required to drive adaptation 47 and arterial remodelling of endothelial and vascular smooth muscle cells that are located within the medial layer of the arterial wall 48 and regulate vascular function. 6 Although our participants were recruited from cycling and running clubs to ensure a broad range of cardiorespiratory fitness, the volume, intensity duration and mode of training were not controlled for. Further research into the effects of specific types of exercise on AC in the brain using this novel MRI method is warranted to elucidate these potentially variable effects.
Our cross-sectional design explored
Average MCA compliance across participants in the present study was 0.41% ± 0.16% per mmHg which is consistent, albeit slightly lower than reported previously in a sample of five participants (right MCAC =0.57% ± 0.20%; left MCAC = 0.50% ± 0.30% per mmHg). 17 The current findings demonstrate variation in cerebral AC in the MCA; however, using MRI it is also possible to investigate the posterior and anterior cerebral arteries.15,17 Unfortunately, due to the scan duration and sample size used in this study, SNR was too low to assess compliance in these smaller arteries.
Grey matter CBF
At the time of writing, this is the first study to assess resting CBF using ASL in a cohort of young adults in the moderate-to-high fitness range. We report a reduction in resting CBF with increased fitness levels, a finding which contrasts with a handful of studies from the ultrasound literature, whereby fitness has been positively associated with cerebral blood velocity2,3,19 and flow in children, 18 older adults 19 and patients with coronary artery disease. 20
Across adulthood, age decreases cerebral metabolic rates of oxygen (CMRO2) and glucose by ∼5% per decade, and reduced metabolic rate is coupled with lower CBF.50,51 It has been proposed that exercise could ameliorate age-related cognitive decline52,53 by enhancing vasodilatory signalling via nitrous oxide synthase activity, promoting endothelial repair mechanisms and angiogenesis to effectively meet the demands of the metabolising cerebral tissue.54,55 It is widely assumed, but less well proven, that these mechanisms lead to a net increase in resting CBF in the healthy adult brain following exercise. In this study, we find that CBF is lower in young males with higher cardiorespiratory fitness.
Interpretation should be made cautiously given the modest size of the present study; however, there are a number of possible mechanisms that could drive the negative association between cardiorespiratory fitness and CBF. These include reduction of arteriolar luminal diameter, changes in capillary density and an alteration of tissue oxygen extraction. The former seems unlikely, since exercise has been shown to decrease the intima media thickness (IMT) of the arterial wall, thereby increasing lumen diameter and allowing for an increase in blood flow through the artery (Sandrock et al., 2008). 56 It is also unlikely that lower CBF in fitter subjects is due to a reduction of capillary density, since a number of preclinical studies have provided evidence of increased vessel density in the rodent brain following exercise.57–59 It is possible that such an increase in vessel surface area with increased capillary number could reduce the demand for CBF, 59 where shorter diffusion distances mean nutrient extraction is facilitated. This raises the possibility that fitter individuals have more efficient gas exchange from the capillary bed, permitting a reduction in the amount of flow needed to meet metabolic oxygen demand.
It has been shown elsewhere that a reduction in CBF seen during exercise was accompanied by an increase in oxygen extraction, resulting in a maintained cerebral metabolic rate of oxygen consumption (CMRO2).
60
Future research could use calibrated fMRI measures of oxygen extraction and CMRO261–64 in highly fit individuals, to assess whether efficiency of nutrient supply via the cerebral microvasculature can explain the inverse relationship between
CVR
To date, studies that have investigated the relationship between CVR and fitness have relied upon either ultrasound methods2,3 or BOLD measurements22,66 which have found opposing results. Since the BOLD signal does not represent blood flow, BOLD CVR alone is not sufficient for understanding the mechanisms at play.
67
The current study used pulsed ASL methods that allowed simultaneous measurement of BOLD and CBF, to assess whether differences in BOLD previously reported are likely to be due to a change in blood flow. In line with the BOLD MRI literature, whole-brain grey matter CVR showed an inverse trend with
Within the healthy brain, an increase in arterial CO2 is expected to produce a rapid vasodilatory response, yielding an elevation in CBF. This vascular reactivity is thought to be an adaptive physiological response, such that a decline in reactivity could be considered maladaptive. Nonetheless this, and previous studies, have found a negative trend whereby CVR is lower in fitter subjects. For example, BOLD CVR was found to decrease in a study of elderly masters athletes with increased
Hct levels are associated with variation in task-based BOLD estimates. 65 We did not observe a relationship between Hct levels and BOLD- or CBF-based CVR in this study, however we exercise caution when interpreting MRI measures in light of Hct, since blood and MRI measures were acquired on separate days.
It is possible that the breath-hold paradigm used here may not have been sensitive enough to detect a clear difference in CVR in this sample. Targeted gas challenges tend to provide a more robust measure of CVR, as CO2 is directly manipulated 27 and comparable levels of hypercapnia can be achieved between subjects. However, breath-hold offers greater experimental convenience. It has been previously shown that breath-holds are a reliable measure of BOLD CVR, even when breath-holding is poor. 26 SNR is inherently lower in CBF than BOLD data. Nevertheless, we observed a clear relationship between BOLD and CBF CVR measures supportive of a similar underlying mechanism.
Unlike the multi inversion time ASL scheme used for estimating baseline CBF, an inherent limitation of the PASL single inversion time approach used for measuring CVR is that it assumes all the labelled blood has flowed into the imaging slice. This acquisition scheme was chosen for time efficiency and because we were interested in the dual-echo (i.e. CBF and BOLD) readout. However, it is possible that bias in CVR estimates may be introduced where differing amounts of the labelled bolus arrive in the imaged slice during normo- and hyper-capnia.
Limitations
Care should be taken when generalizing these findings since the cohort used here was small. Our study design specifically recruited those across a range of moderate-high
An inherent limitation of using
We did not address potential genetic and other environmental factors that could mediate the relationship between fitness and vascular health. However, emerging evidence suggests that the process of arterial stiffening may have a genetic component 68 that may be relevant when looking at individual differences in response to exercise.
Conclusions and future research
In conclusion,
Footnotes
Funding
The author(s) disclosed receipt of the following financial support for the research, authorship, and/or publication of this article: HVF received support from the Neuroscience and Mental Health Research Institute Scholarship from Cardiff University. RGW and DMB acknowledge the support of the Higher Education Funding Council for Wales. DMB acknowledges financial support from the JPR Williams Trust. DMB is supported by a Royal Society Wolfson Research Fellowship (#WM170007).
Acknowledgements
The authors would like to thank Dr Alan Stone and Peter Hobden for their imaging assistance and Dr Catherine Foster for her contribution to the conceptual development.
Declaration of conflicting interests
The author(s) declared no potential conflicts of interest with respect to the research, authorship, and/or publication of this article.
Authors’ contributions
HF performed recruitment, MRI imaging, analysis and write up. HF, CM, DB and RW were involved in study concept and design. EW and HF played a major role in MRI data acquisition, data processing; data analysis and interpretation. CM and DB were involved in subject recruitment and responsible for acquisition of