
Abstract
Anaplerosis occurs predominately in astroglia through the action of pyruvate carboxylase (PC). The rate of PC (Vpc) has been reported for cerebral cortex (or whole brain) of awake humans and anesthetized rodents, but regional brain rates remain largely unknown and, hence, were subjected to investigation in the current study. Awake male rats were infused with either [2-13C]glucose or [1-13C]glucose (n = 27/30) for 8, 15, 30, 60 or 120 min, followed by rapid euthanasia with focused-beam microwave irradiation to the brain. Blood plasma and extracts of cerebellum, hippocampus, striatum, and cerebral cortex were analyzed by 1H-[13C]-NMR to establish 13C-enrichment time courses for glutamate-C4,C3,C2, glutamine-C4,C3, GABA-C2,C3,C4 and aspartate-C2,C3. Metabolic rates were determined by fitting a three-compartment metabolic model (glutamatergic and GABAergic neurons and astroglia) to the eighteen time courses. Vpc varied by 44% across brain regions, being lowest in the cerebellum (0.087 ± 0.004 µmol/g/min) and highest in striatum (0.125 ± 0.009) with intermediate values in cerebral cortex (0.106 ± 0.005) and hippocampus (0.114 ± 0.005). Vpc constituted 13–19% of the oxidative glucose consumption rate. Combination of cerebral cortical data with literature values revealed a positive correlation between Vpc and the rates of glutamate/glutamine-cycling and oxidative glucose consumption, respectively, consistent with earlier observations.
Introduction
The majority of excitatory and inhibitory neurotransmission in brain employs neurotransmitter glutamate and γ-aminobutyric acid (GABA), respectively, and availability of these transmitters is crucial for brain function. Molecules of neurotransmitter glutamate and GABA and their glutamine precursors are lost by oxidation, diffusion through the extracellular space to blood or employed to remove excess ammonia.1–4 Any loss requires a balanced de novo synthesis. In brain de novo synthesis from glucose occurs via pyruvate carboxylase (PC), a mitochondrial enzyme confined to astroglia.5–10 PC catalyzes the carboxylation of pyruvate, the end-product of glycolysis, to form and increase the pool of the Tricarboxylic Acid (TCA) cycle intermediate oxaloacetate (OAA). The process of increasing the TCA cycle carbon pool is termed anaplerosis and forms the basis for de novo synthesis of glutamine, a precursor for neurotransmitter glutamate and GABA.11–18
The quantitative significance of anaplerosis to brain glucose metabolism has been addressed in magnetic resonance spectroscopy studies of rodents in vitro and in vivo,19–30 as well as in humans,31–33 but only for whole brain (excluding cerebellum) or cerebral cortex. Some studies indicate that metabolic flux through PC (Vpc), like glucose oxidation and neurotransmitter cycling, varies with level of brain activity,27,30 i.e. higher in the awake animal and lower under anesthesia, suggesting a more central role for PC in energy metabolism. Other studies show no change in Vpc over baseline with stimulation,25,34,35 hence a correlation between Vpc and brain activity may depend on the mechanism underlying the changed brain activity level.
Anaplerosis via PC has been measured using different isotopic labels and substrates, including H14CO2, [1-13C]glucose and [2-13C]glucose.19,30,33,36,37 While highly specific, the measurement of fixed carbon from H14CO2 provides net flux through PC but no information on competing metabolic pathways, like flux through pyruvate dehydrogenase (Vpdh). In contrast, labeling brain amino acids from 13C-glucose, when coupled with nuclear magnetic resonance (NMR) spectroscopy or mass spectrometry (MS) detection and metabolic modeling, provides quantitative flux estimates of Vpc, as well as Vpdh and several other fluxes relevant to the energetic status of neural tissue. However, [1-13C] and [2-13C]glucose assay Vpc differently, with differing specificities. Of the two, the assay of Vpc using [2-13C]glucose possesses the highest specificity and sensitivity, as labeling of the reporter amino acid, glutamine-C2 and -C3, is not confounded by PDH metabolism of [2-13C]pyruvate, nor influenced negatively by cycling between OAA and fumarate, as experienced with the [3-13C]pyruvate made from [1-13C]glucose.
Anaplerosis in terms of CO2 fixation of pyruvate in brain was first demonstrated in the early 1960's by Berl and co-workers38,39 and the enzyme which catalyzed this activity, PC, subsequently described. 40 For a history of the work leading to the localization of PC in astroglia, see. 41 Early estimates of in vivo anaplerosis in whole brain using [2-14C]pyruvate or its precursor [2-14C]lactate, suggested that under physiologically normal conditions this pathway constitutes 9–14% of overall pyruvate metabolism.42,43 More recent studies employing [1-13C]glucose (and H14CO2) or [2-13C]glucose and NMR reported values for Vpc of 0.17–0.18 µmol/g/min and 0.04–0.09 µmol/g/min for the whole brain or cerebral cortex of the awake and anesthetized rat brain, respectively.19,20,25–27,30,36 These rates corresponded to ∼10–20% of their respective rates of glucose oxidation, and, hence, are within the range of earlier estimates. However, despite the importance of anaplerosis to neurotransmitter homeostasis and normal brain function, its magnitude and relationship to glucose oxidation and neurotransmitter cycling across brain regions, and activities during wakefulness remains largely unknown. This reflects our current poor understanding of the anabolic and catabolic (i.e., glutamate/GABA oxidation) processes that determine anaplerosis over the lifespan. 44
In the present study, we determined the rates of anaplerosis (Vpc), neurotransmitter cycling and glucose oxidation in neurons and astroglia of four brain regions in awake rats receiving timed infusions of either [1-13C] or [2-13C]glucose, followed by rapid euthanasia. Tissue extracts of the water-soluble metabolites were prepared and measured using 1H-[13C]NMR. The metabolic fluxes were determined by fitting a three-compartment metabolic model (glutamatergic and GABAergic neurons, and astroglia) simultaneously to the time courses of amino acid 13C-enrichments produced during the [1-13C] and [2-13C]glucose infusions.
Materials and methods
Animal preparation and sample processing
Rat experiments were conducted in accordance with the guideline of the National Institutes of Health Guide for the Care and Use of Laboratory Animals and the AVMA Guidelines for the Euthanasia of Animals (2013 Edition), under protocols approved by the Institutional Animal Care and Use Committee of Yale University. All efforts were made to minimize animal suffering according to the Animal Welfare Act administered by USDA. Furthermore, this manuscript is in compliance with the ARRIVE guidelines for how to report animal experiments.
Male Sprague-Dawley rats (210 ± 11 g, n = 57) were acclimatized at least 1 day (5[4-7] days) following arrival from Harlan Laboratories Ltd. (Indianapolis, IN, USA), then fasted overnight and prepared with tail vein catheters under isoflurane anesthesia. Animals were allowed to recover from anesthesia for at least 30 min prior to infusion with 0.75 M [1-13C]glucose or [2-13C]glucose (99 atom%, Cambridge Isotope Laboratories, Cambridge, MA, USA) dissolved in saline (0.9% NaCl). The 13C-glucose solution was delivered as a 15 sec bolus followed by an exponentially decreasing rate adjusted every 30 sec for the next 8 min and then kept at a steady rate for the remaining infusion time as described previously. 45 Following 8, 15, 30, 60 or 120 min infusion (5–7 rats/time point/glucose isotope in order to obtain a reasonable estimation of the true means) rats were quickly sedated (<50 sec) with isoflurane (2–3%) and euthanized by Focused Beam Microwave Irradiation to the head (FBMI; Model TMW 6402 C, Muromachi Microwave Fixation System, 1.15–1.35 sec, 4.5 kW), arresting brain metabolism. 46 The brain was removed and dissected into four regions; cerebellum (CB), hippocampus (HP), striatum (ST) and cerebral cortex (CX). Blood was sampled from the caudal vena cava following FBMI into heparin-treated tubes, centrifuged (2500 rpm, 15 min, 4 °C), and the plasma collected. Experiments were terminated and samples and/or data excluded when experimental procedures failed, e.g. faulty catheter or problematic FBMI (four of total 61 animals did not complete experiments), or sample processing (total metabolite concentrations were not determined for some extracts due to unintended lack of internal standard). No randomization protocol was used to assign animals to a specific 13C-substrate and infusion length prior to the procedures; however, care was taken in order to interchange between these parameters on and between experimental days. Investigators were not blinded to the experimental treatment (i.e. 13C-isotope infused) or the processing and analysis of the data.
Blood plasma and brain samples were frozen in liquid N2 and stored at −80°C for subsequent analysis. Blood plasma was prepared for NMR analysis by filtering thawed samples (Nanosep, 10kD) at 5000 rpm and diluting (1:4) with 90:10 v/v D2O:H2O, 0.25 mM TSP and 2.0 mM formic acid in 50 mM KPO4 buffer (pH = 7.0). Brain samples (24–312 mg) were prepared for NMR analysis as follows: Frozen brain tissue was weighed, extracted in ice-cold 0.1 M HCl in methanol (1:2 tissue weight/volume) and 800 µL 10 mM KPO4/90% ethanol solution (first extract) and homogenized using an OMNI Bead Ruptor24 (Omni International, GA, USA) followed by centrifugation at 13,000 rpm (30 min, 4 °C). The pellet was re-homogenized using 1 mL of 6.7 mM KPO4/60% ethanol solution, centrifuged, and supernatants combined. [2-13C]Glycine was added in the first extraction step as an internal concentration reference. Sample tubes were cooled on dry ice throughout the extraction procedure. The supernatants were filtered through Chelex-100 resin, lyophilized, and reconstituted in 90:10 v/v D2O:H2O, 0.25 mM TSP, 50 mM KPO4 buffer (pH = 7.0).
Nuclear magnetic resonance analysis of brain extract and blood samples ex vivo
Fully relaxed 1H-[13C]-NMR spectra of plasma and brain extracts were acquired at 11.7 T (1H resonance frequency of 500.13 MHz) using a Bruker AVANCE spectrometer (Bruker Corp., Billerica, MA, USA). 1H-[13C]-NMR spectra were acquired as two subspectra – one involving broadband 13C-inversion pulses applied in alternate scan blocks, whereas 13C-decoupling was applied in both. Subtraction of the scans obtained with 13C-inversion (12C−13C) from those without inversion (12C + 13C) gave the difference spectrum (2 × 13C), containing only 13C-coupled 1H resonances at twice the true intensity. 47 The total carbon isotope composition was given by the 12C+13C subspectrum. The percentage 13C-enrichment (PE) was calculated as the ratio, (13C/(12C+13C))×100, followed by subtraction of 1.1% to remove 13C arising from natural abundance.
Absolute concentrations of metabolites in brain tissue extracts were determined relative to [2-13C]glycine, added during tissue extraction as an internal concentration reference. In plasma, formate was added as internal standard during sample preparation. The isotopic 13C enrichments of glutamate (Glu) C2, C3, and C4, GABA C2, C3 and C4, glutamine (Gln) C3 and C4, and aspartate (Asp) C2 and C3 were calculated from the ratio of the areas of these resonances in the 1H-[13C]-NMR difference spectrum (2×13C only) and the non-edited spectrum (12C+13C).48,49 Representative 1H-[13C]-NMR spectra are provided in Figure 1.
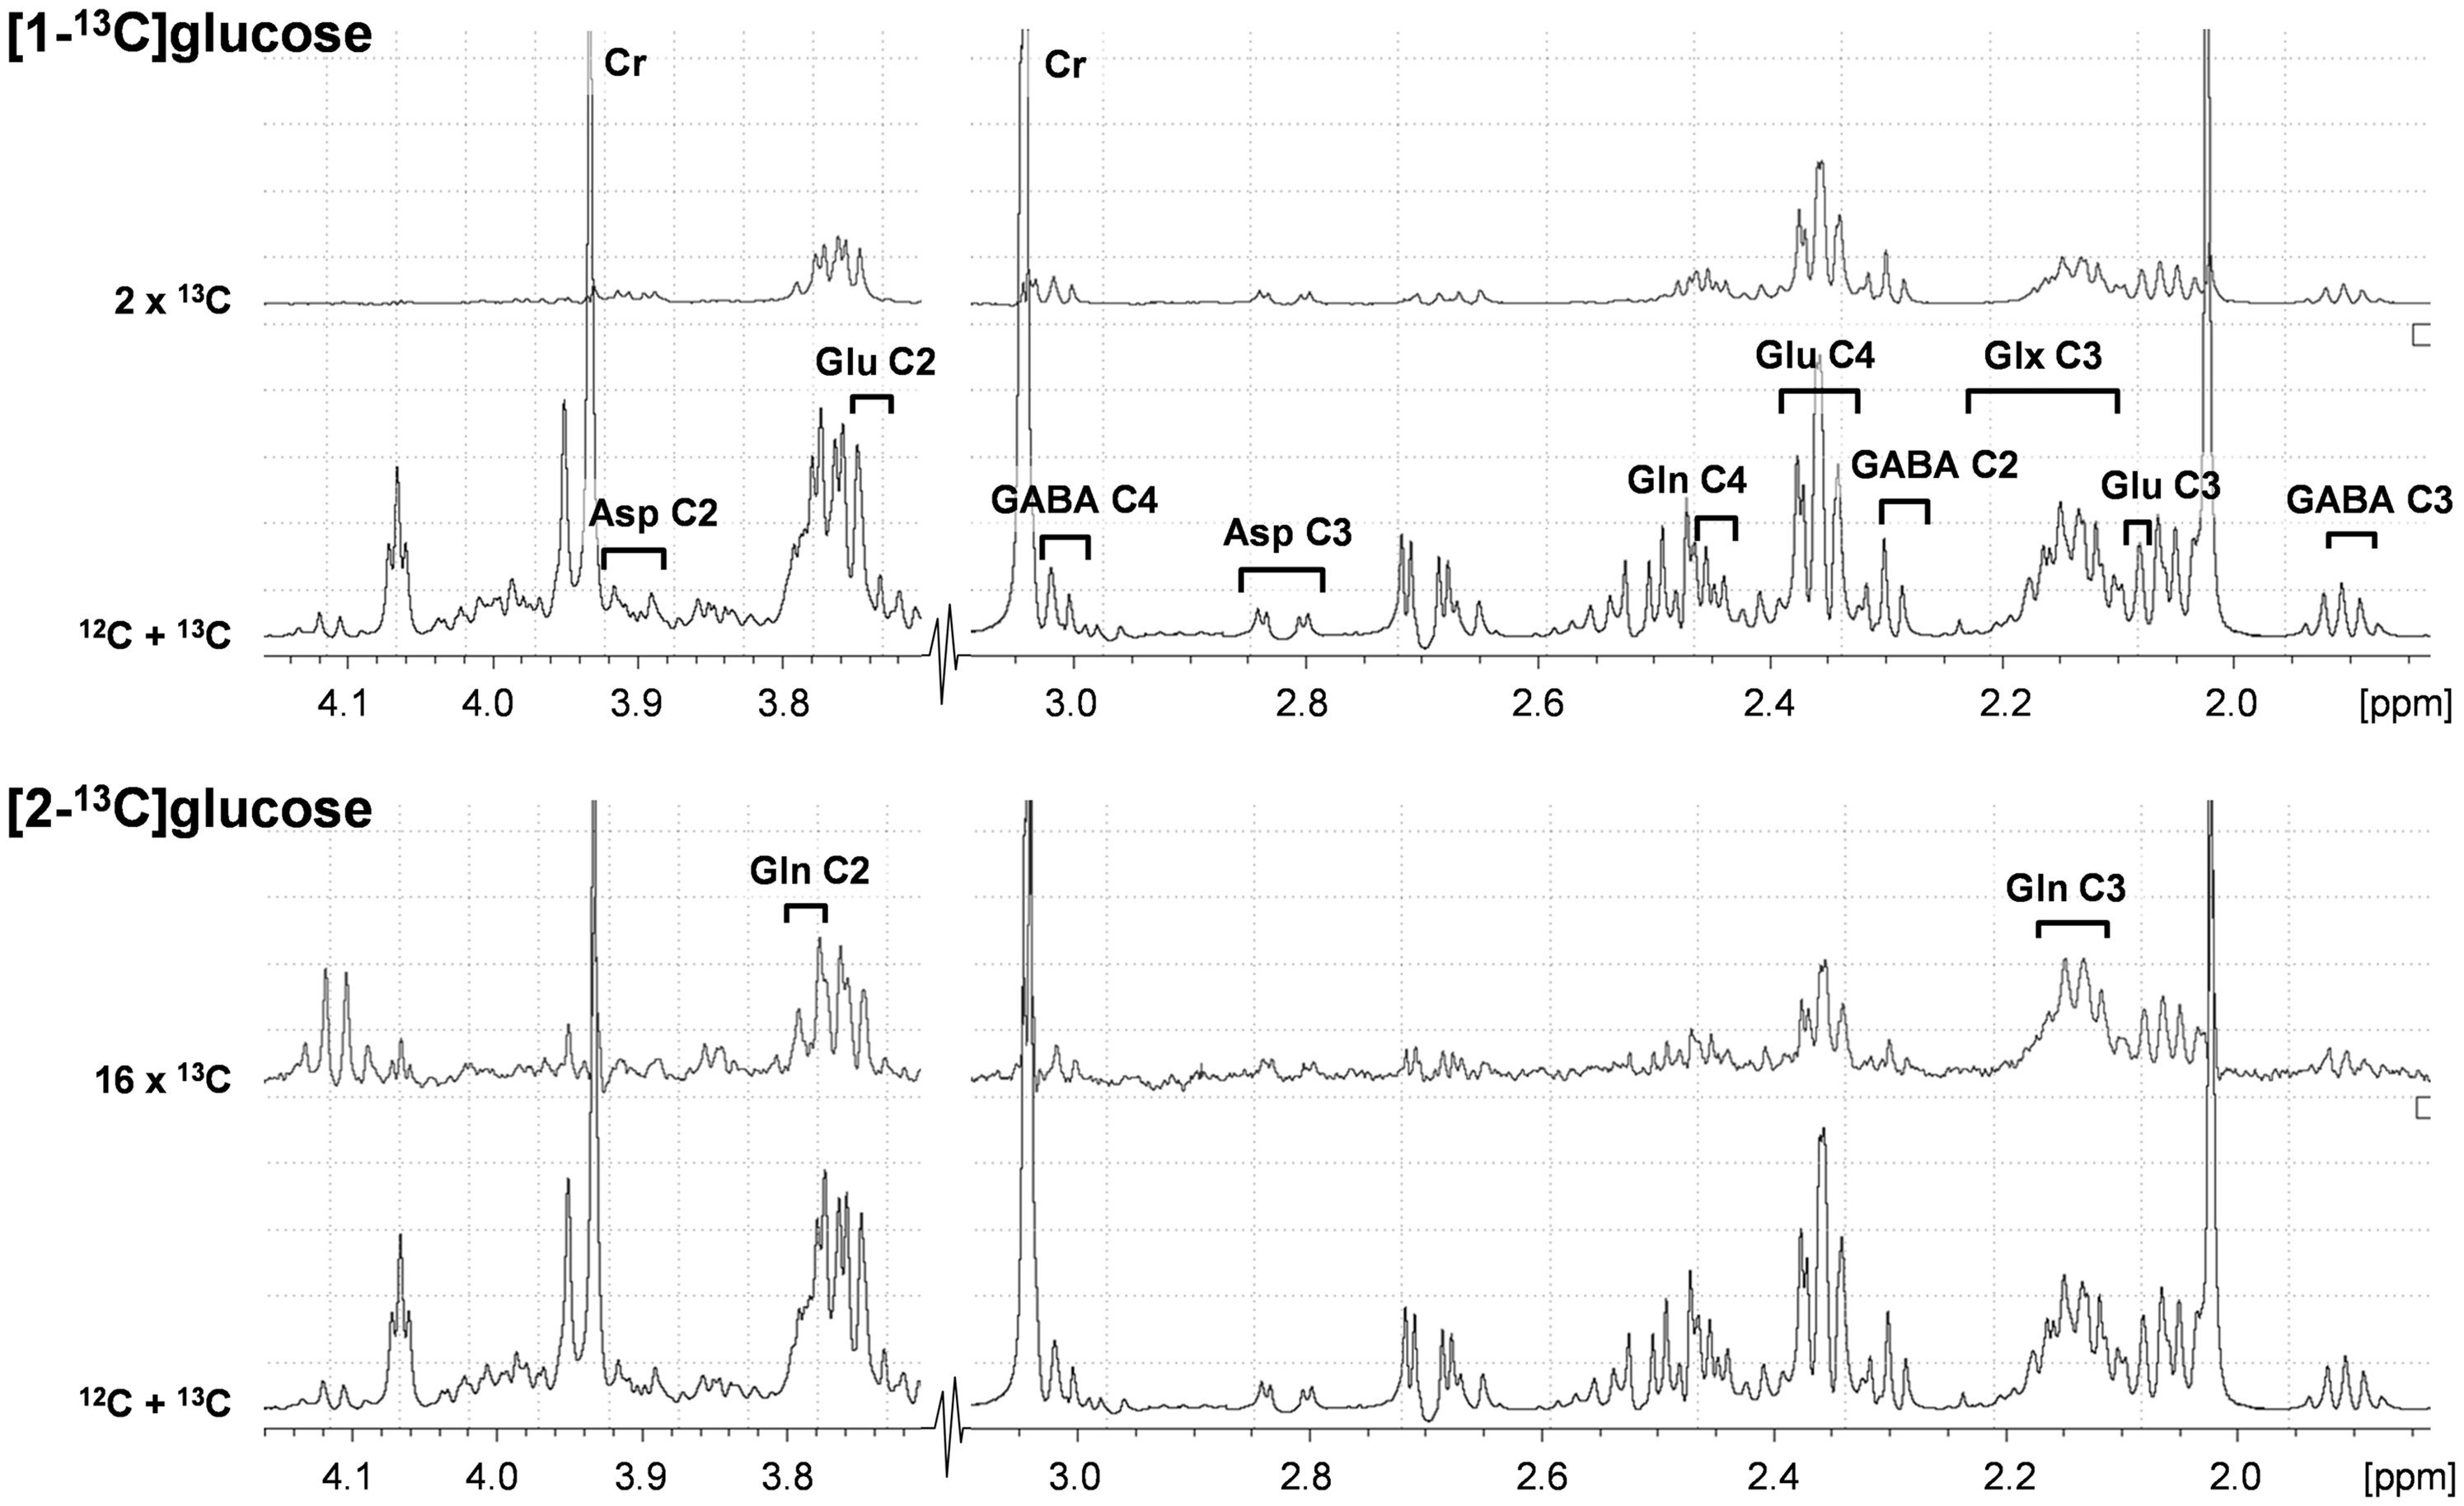
Representative 1H-[13C]NMR spectra from rat cerebral cortex obtained ex vivo following infusion with [1-13C]glucose (upper two traces) or [2-13C]glucose (lower two traces). 12C+13C indicates total spectra, and difference spectra have been multiplied to emphasize peaks, hence denoted 2x13C and 16x13C. Numbers indicate carbon position in glutamate (Glu), glutamine (Gln), glutamate+glutamine (Glx), γ-aminobutyric acid (GABA), and aspartate (Asp).
13C-labeling of plasma glucose (H1α at 5.24 ppm and H2α at 3.24 ppm) were determined using 1H-NMR without 13C-decoupling. The PE of glucose-C1α and glucose-C2α were calculated by dividing the areas of the 13C-satellites with the total area (12C+13C) of their respective resonances. In addition, a portion of the plasma was used to measure the total glucose concentration (Glucose Analyzer GM9D, Analox Instruments Ltd., Stourbridge, UK).
Description of the metabolic model and determination of metabolic rates
Three-compartment metabolic model: The time courses of 13C-labeling of glutamate (Glu), glutamine (Gln), GABA and aspartate (Asp), were fitted with a metabolic model consisting of three compartments; astroglia and GABAergic and glutamatergic neurons. In this model [1-13C]glucose (Figure 2(a)) enters the brain and is metabolized through glycolysis to C3-labeled pyruvate (Pyr). Mitochondrial metabolism of Pyr-C3 by PDH produces C2-labeled acetyl-CoA, which enters the TCA cycle to form C4-labeled α-ketoglutarate (αKG). Isotopic exchange between αKG and Glu produces C4-labeled Glu, which is the precursor of C2-labeled GABA. Neurotransmitter Glu-C4 and GABA-C2, generated in the neurons are released from the pre-synaptic terminals during depolarization, and subsequently taken up by surrounding astroglia, in which C4-labeled Gln is generated by glutamine synthetase (GS). Finally, Gln is transferred back to the neuron, thereby completing the Glu/GABA-Gln cycle. Continuation of the carbon through the TCA cycle labels the C2 and C3 of Glu and Gln and the C3 and C4 of GABA.
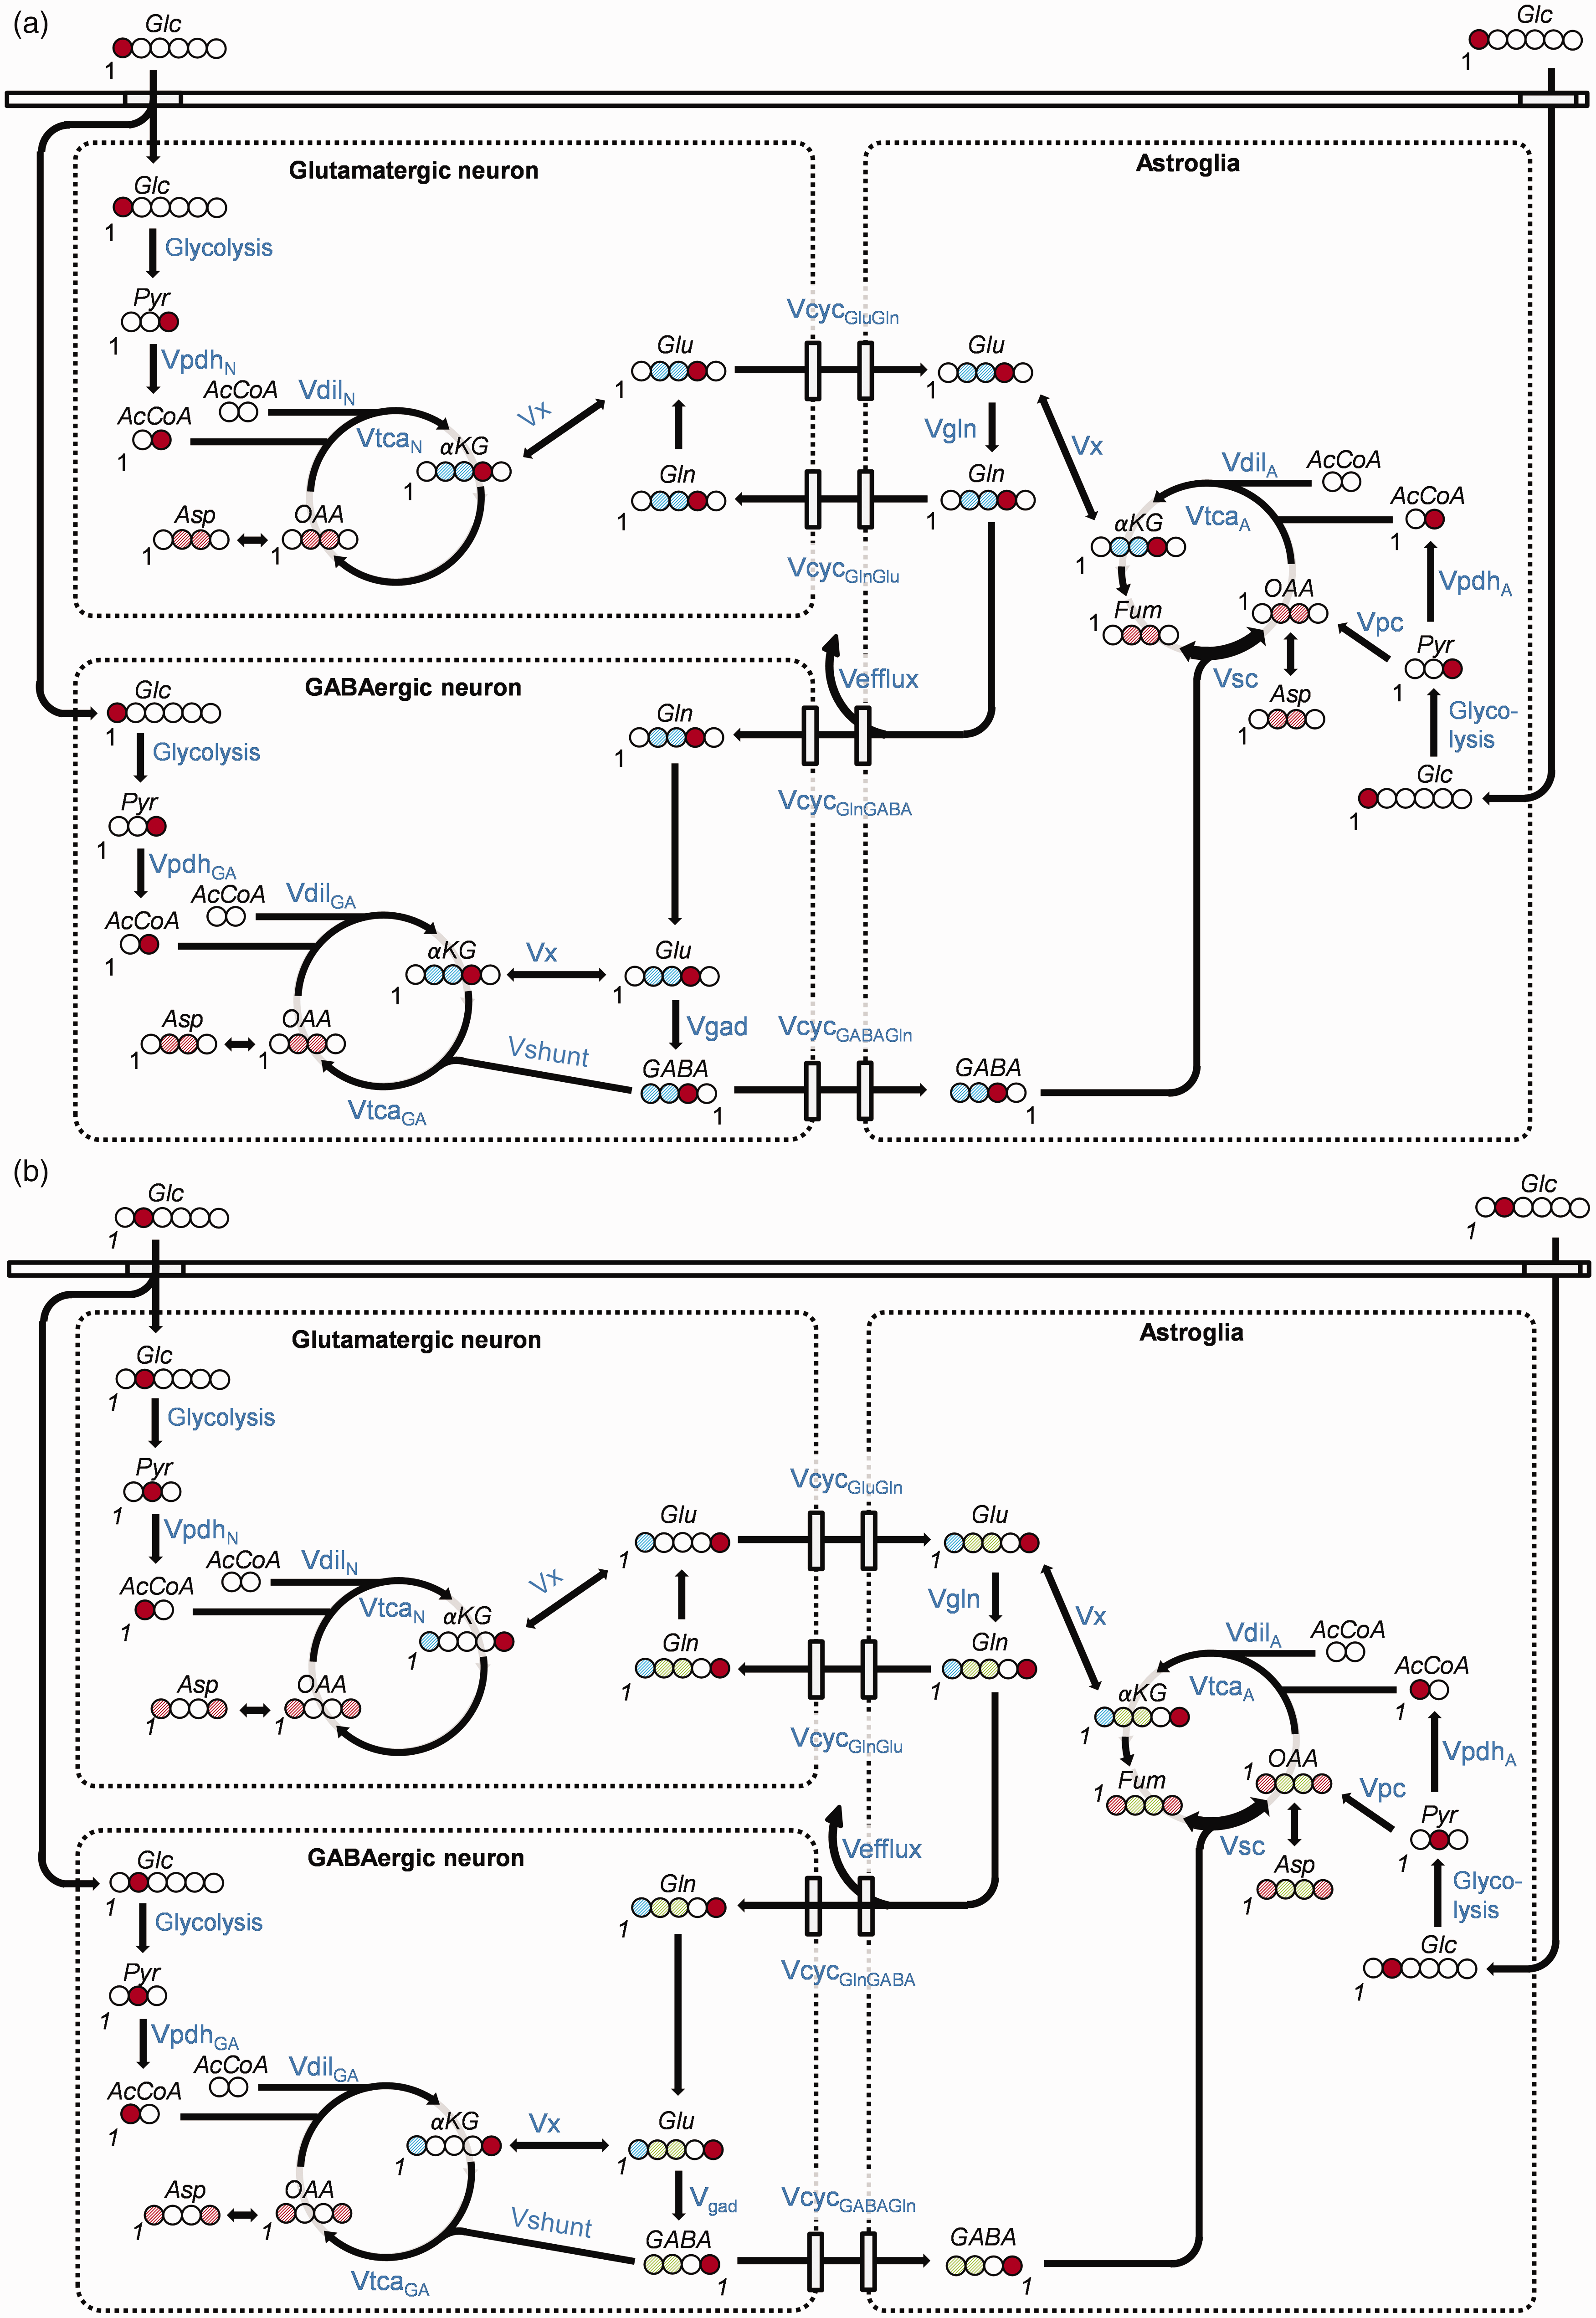
Schematic diagram of the labeling of cerebral metabolites from (a) [1-13C]glucose and (b) [2-13C]glucose, respectively. Circles represent carbon atoms. Whole filled circles: 100% 13C-enrichment at this carbon-position of the molecule; Same colorContinued.diagonally striped circles: 13C-labeling is split between these positions; Red: Labeled position after first turn of the TCA cycle; Blue: Labeled position of the second turn of the TCA cycle; Green: Label position after entry of pyruvate carbons into the TCA cycle via pyruvate carboxylase (PC). The number ‘1’ denotes the position of carbon number one in each molecule. All metabolic pathways are named in blue letters and illustrated by black arrows. Abbreviations: Glc: glucose; Pyr: pyruvate; AcCoA: Acetyl-Coenzyme A; αKG: α-ketoglutarate; OAA: oxaloacetate; Fum: fumarate; Asp: aspartate; Glu: glutamate; Gln: glutamine; GABA: gamma-aminobutyric acid; Vpdh: rate of pyruvate dehydrogenase; Vdil: rate of dilution; Vtca: rate of tricarboxylic acid cycle; Vefflux: rate of loss of carbon from the astrocytic TCA cycle via efflux of Gln from the brain, partly balanced by entry of glutamine from the blood at the rate VdilGln (not shown); VcycGluGln: rate of Glu/Gln-cycle; VcycGABAGln: rate of GABA/Gln-cycle; Vpc: rate of pyruvate carboxylase; Vgad: rate of glutamate decarboxylase, GABA synthesis, Vgln: rate of glutamine synthesis; Vshunt: rate of the GABA shunt, i.e. GABA degradation in the GABAergic neuron; Vx: rate of aminotransferase. Designations ‘GA’, ‘A’ and ‘N’ after a pathway rate indicates rate in the GABAergic neuronal, astroglial and glutamatergic neuronal compartments, respectively.
In astroglia, Pyr labeled at C3 from [1-13C]glucose also gives rise to C3-labeled oxaloacetate (OAA) through the astroglia-specific enzyme pyruvate carboxylase (PC). Forward metabolism through the TCA cycle (OAA → citrate → isocitrate → αKG) labels αKG at C2, followed by labeling of Glu and Gln at C2, and GABA at C4. However, back-cycling of the label from OAA to fumarate—a symmetrical molecule—can occur, scrambling (sc) the label to generate C3- and C2-labeled fumarate and OAA, which occurs at the rate Vsc. Forward metabolism of C3- and C2-labeled OAA in the TCA cycle leads to C2- and C3-labeled αKG, Glu and Gln, and C4- and C3-labeled GABA. Labeling at the same carbon positions occurs in the second turn of the TCA cycle after the initial entrance of labeling via PDH.
When [2-13C]glucose (Figure 2(b)) is metabolized to C2-labeled Pyr through glycolysis, TCA cycle entry via PDH forms C1-labeled acetyl-CoA, labeling αKG at C5, followed by Glu and Gln at C5, and GABA at C1. The second turn of the TCA cycle labels Glu and Gln at C1, and leaves GABA unlabeled.
Thus, because C3 and C2-labeling in Glu and Gln, and C3 and C4-labeling in GABA can only occur via PC, [2-13C]glucose makes it possible to distinguish PC-derived labeling from labeling via PDH.23,33,36 In addition, because OAA exchanges with Asp through the action of aspartate aminotransferase, 13C-labeling in OAA is reflected in Asp.
The metabolic model consisted of 104 coupled differential equations and algebraic equations describing mass and isotope balance for C1 and C2-labeled glucose utilization in parallel three-compartment models consisting of glutamatergic and GABAergic neurons, and astroglia.50–52 The model was fitted simultaneously to the time course data sets from the [2-13C]glucose and [1-13C]glucose infusions using CWave 3.553,54 running in MATLAB (The MathWorks, Natick, USA). A copy of CWave can be requested from the software developer and co-author Graeme Mason per mail or e-mail (
Two-compartment metabolic model: To assess the potential impact of the three-compartment metabolic model (inclusion of GABA metabolism) on the interpretation of the study findings, the time courses of 13C-labeling of glutamate (Glu), glutamine (Gln) and aspartate (Asp) were fitted by a metabolic model consisting of two compartments of glutamatergic neurons and astrocytes. 36 This model follows the description of the three-compartment model above but without the GABA pathway and its associated equations.
Statistics
All data were tested for normality using the Shapiro-Wilk test and results are reported as mean ± standard deviations (SD) or median and interquartile range (IQR), [Q3-Q1], as appropriate. Student’s t-test and ANOVA were used to compare physiological parameters, and non-parametric statistical analysis, corrected for multiple comparisons, were used for data which passed or did not pass the test for normality, respectively. Test specifications are given along with the statistical output. Statistical analysis were performed using GraphPad Prism software version 9.1.0 for Windows (GraphPad Software, La Jolla, California, USA). Correlation analyses were performed using Spearman’s correlation test in Microsoft Excel 2010 or GraphPad Prism.
The uncertainties in the model parameters and their distributions were determined in CWave by Monte-Carlo simulations with 1,000 iterations (three-compartment model) or 500 iterations (two-compartment model).54-56 Briefly, 1,000 (or 500) simulated noisy data sets were generated by adding the standard deviation of the scatter about the least square fit, and the data sets were fitted with the model to generate 1,000 (or 500) sets of values for the model. These values were used to estimate the distributions of uncertainty of each parameter.
Results
Plasma glucose and glutamine
Blood plasma collected shortly after euthanasia did not vary significantly in total glucose concentrations when comparing [1-13C]glucose and [2-13C]glucose infused rats (12.7 ± 1.8 mM and 13.2 ± 1.2 mM, respectively, Student’s t-test, p = 0.2; time course plasma glucose data available in supplementary information Figure S1), confirming that the concentration of glucose in the infused solutions and the infusion schemes used for the two sets of experiments were indeed identical. Likewise, glutamine concentrations in plasma were not significantly different (0.80 ± 0.09 mM and 0.79 ± 0.06 mM, respectively, Student’s t-test, p = 0.6), confirming similar physiological conditions of the rats in the two sets of experiments.
The PE of plasma glucose-C1 and -C2 increased rapidly after the start of the respective infusions (52 ± 4% and 41 ± 2% at 8 min). PE remained stable throughout the time points measured, with the exception of a small but significant rise seen at 120 min for glucose-C1 (58 ± 3%, Student’s t-test, p = 0.02) and at 60 and 120 min for glucose-C2 (46 ± 3% and 49 ± 1%; p < 0.01). Average PE from [1-13C]glucose infused rats was higher compared to rats receiving [2-13C]glucose (53 ± 4% and 44 ± 3% respectively, p < 0.0001). As explained with Figure S1, the difference may have arisen from inaccuracies in the percent enrichment of the starting materials. The brain extract amino acid enrichments were normalized to the plasma glucose enrichments before they were introduced in the metabolic model, eliminating the effects of differences in glucose PE’s on model output. More specifically, for each animal, the percentage 13C-enrichment values of each brain metabolite carbon position was divided by the percentage 13C-enrichment at plasma glucose C1 or C2, as appropriate and multiplied by 100. Minor glucose-C1 enrichment was observed in plasma of [2-13C]glucose infused animals, hence, the plasma [1-13C]glucose enrichments were also normalized to plasma glucose-C2 enrichment and included in the metabolic model. Raw data are provided in supplementary information as a Microsoft Excel file.
Assessment of source of glutamate and glutamine-C4 labeling in [2-13C]glucose-infused rat brain
Labeling above natural abundance was found in brain regions of rats infused with [2-13C]glucose, e.g. in CX following 120 min infusion, labeling reached an average of 3.4% at Glu-C4, 2.9% at Gln-C4 and 2.7% at GABA-C2 (Figure 3). As described previously, 36 labeling of these carbon positions may come from the pentose phosphate pathway or pyruvate recycling through malic enzyme (ME) in brain, or scrambling of the glucose label by the liver. Enrichment of glucose-C1 was detected in the respective plasma samples (3.6 ± 1.9 to 5.0 ± 0.7% during the 8-120 min infusions; Figure S1), indicating significant scrambling of the label in glucose by the liver, which we included in the modeling as an additional driver. Considering the combined dilutional fluxes given in supplementary information Table S4 into neuronal Glu at the level of Pyr or acetyl-CoA (VdilN/VtcaN, 10%) and Gln (VdilGln/VtcaN, 19%), the CX glucose-C1 enrichment (and assuming equivalent label at C6) could provide 3–4% of the labeling at Glu-C4 observed in rats infused with [2-13C]glucose. This result was independent of the number of compartments comprising the model (compare Table S4 with Table S5, and see Figure S6-9 in supplementary information). Although the pentose phosphate pathway flux was not determined, its contribution to overall glucose metabolism is thought to be small (∼1–5%).36,57,58 Thus, the labeling of Glu-C4 and its products following infusion with [2-13C]glucose can be explained totally by the combination of plasma glucose-C1 enrichment, the dilution and activity of the pentose phosphate cycle.
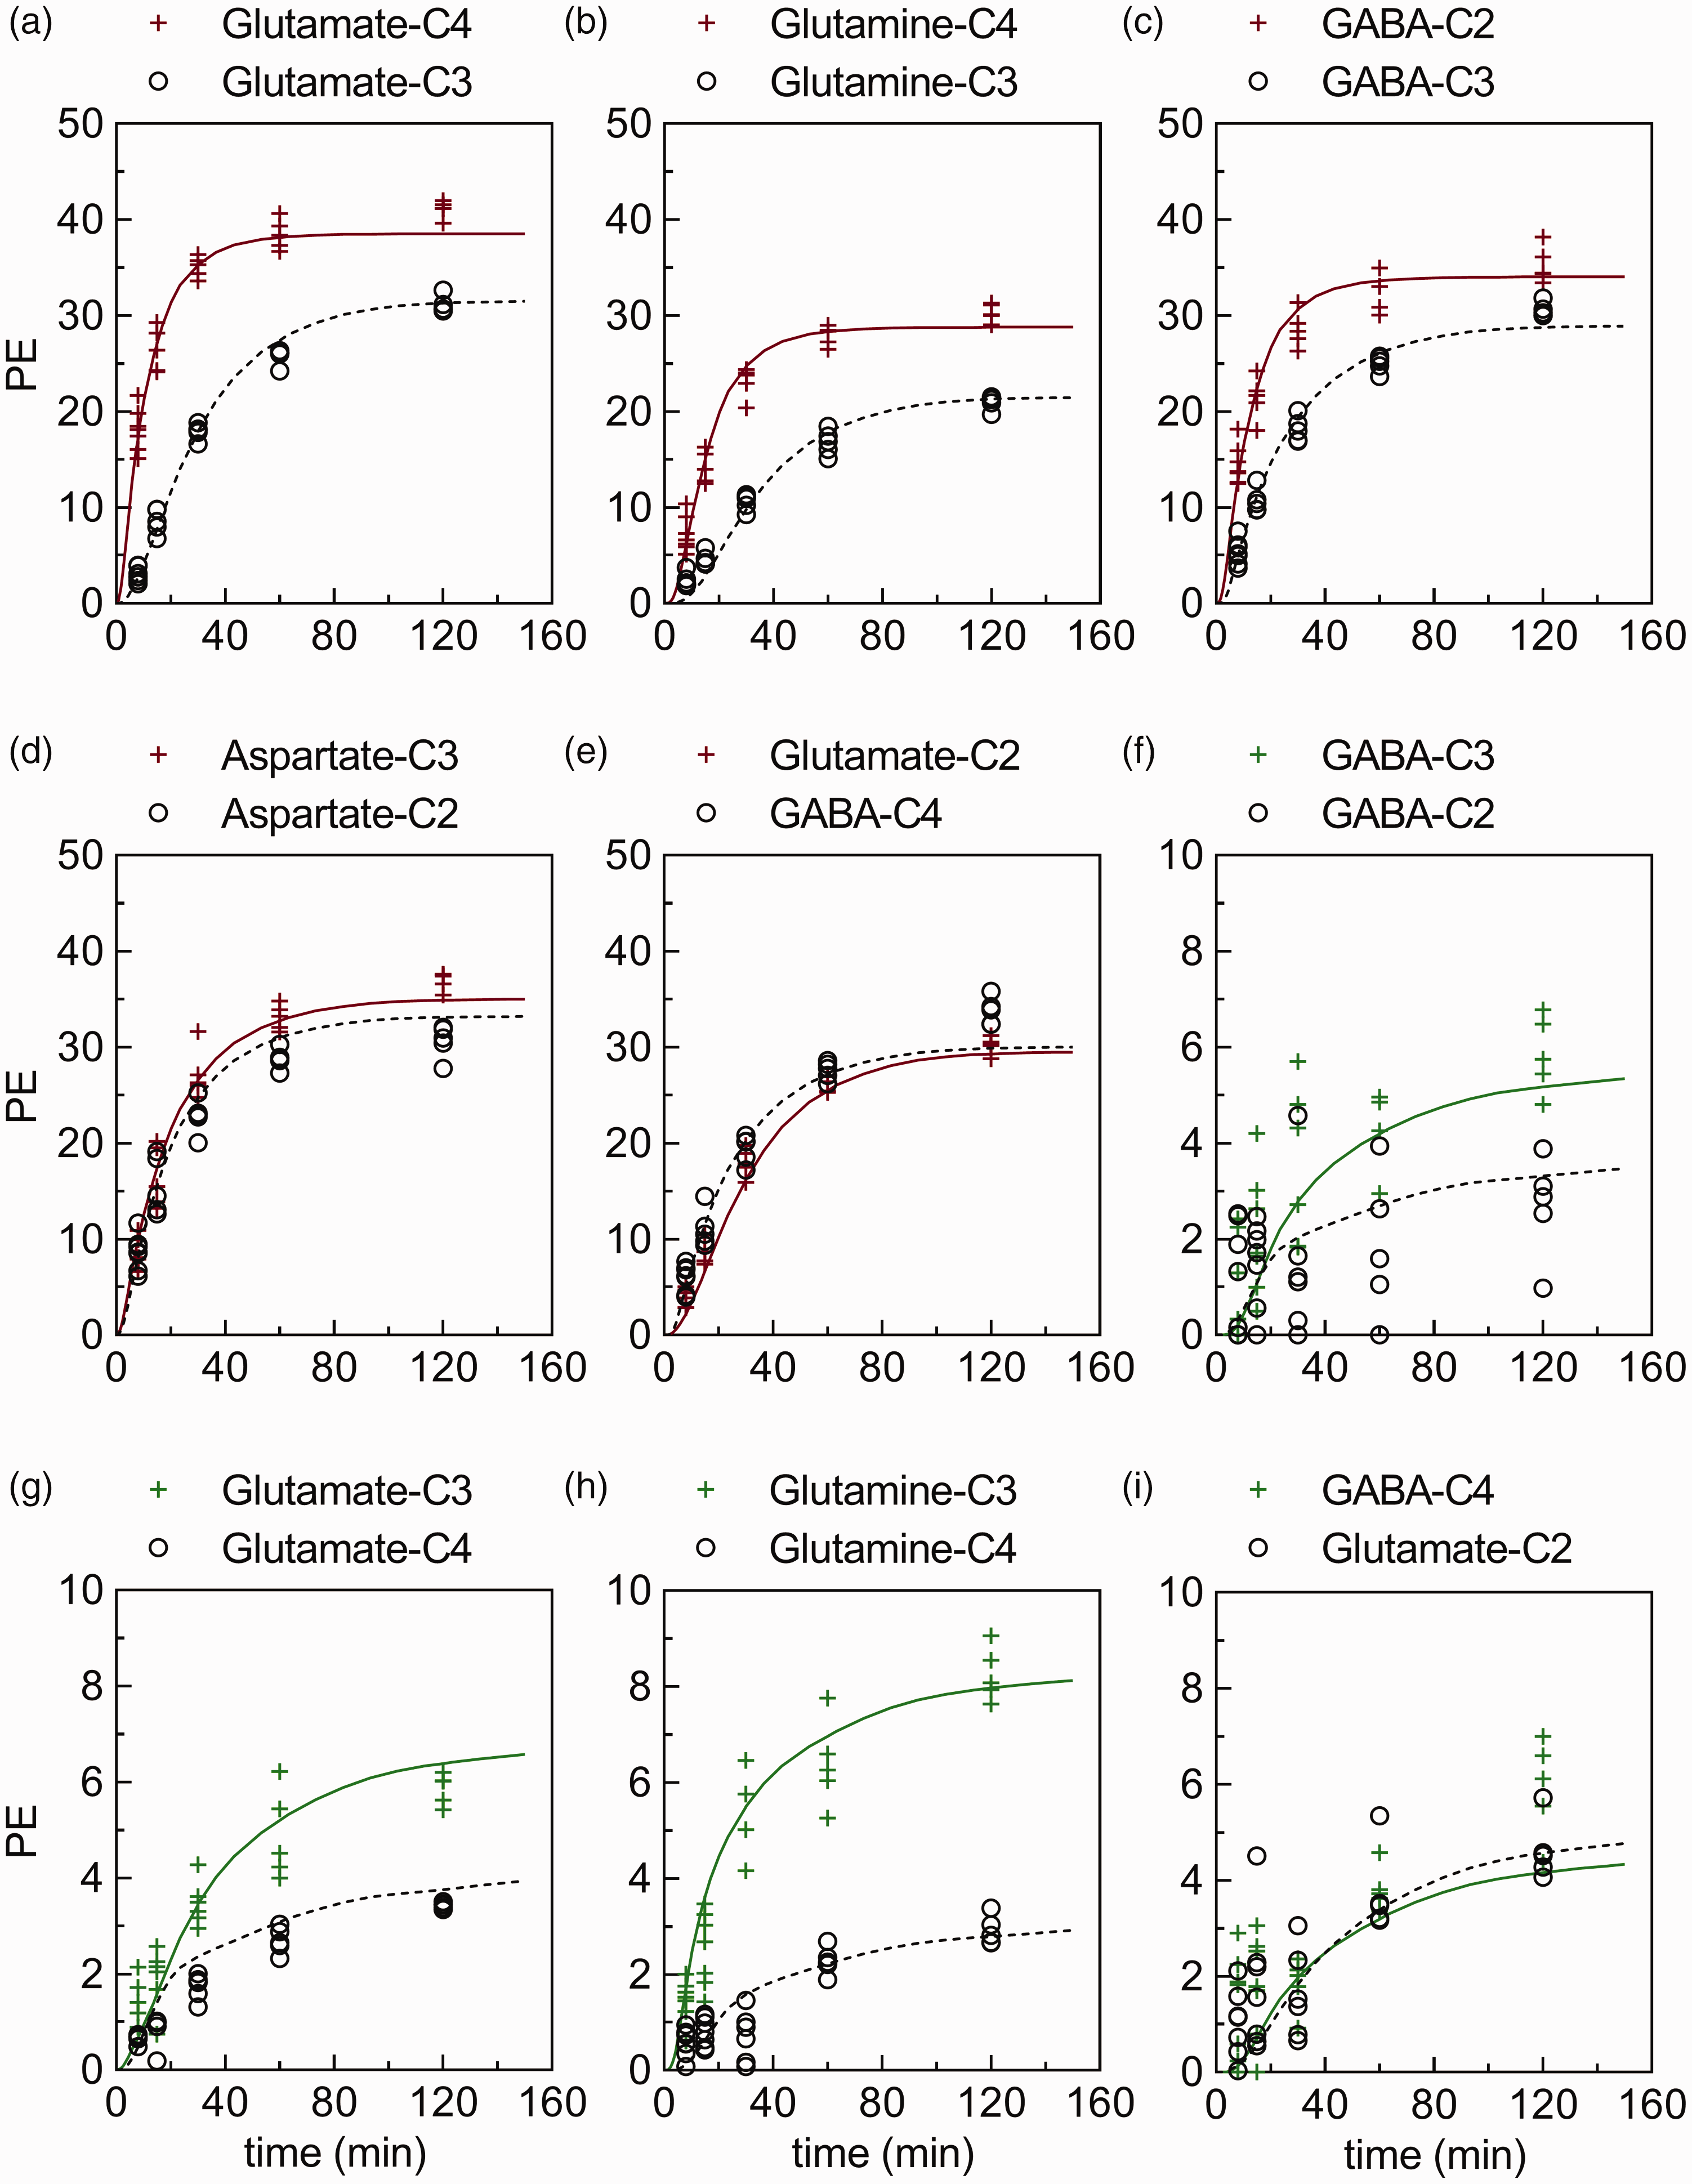
Best fits of the metabolic model (full red/green or dotted black lines) to experimental time course data from cerebral cortex (red/green plus and black circle symbols, respectively). The time courses for percentage 13C-enrichment (PE) of (a–e) glutamate-C4,C3,C2, glutamine-C4,C3, GABA-C2,C3,C4, and aspartate-C2,C3 from [1-13C]glucose or (f–i) glutamate-C4,C3,C2, glutamine-C4,C3, and GABA-C2,C3,C4 from [2-13C]glucose infused rats obtained with 1H-[13C]NMR. The time courses representing the cerebellum, hippocampus and striatum can be found in supplementary information Figure S2, Figure S3 and Figure S4, respectively. The majority (84 of 90) of time course data sets from cerebral cortex (n = 5–7 for each time point) passed the Shapiro-Wilk test for normality.
Brain tissue metabolite 13C-labeling and metabolic rates
As expected, brain region extracts from rats infused with [1-13C]glucose or [2-13C]glucose showed a time dependent increase in PE at all carbon positions measured, i.e. Glu-C2,C3,C4, Gln-C3,C4, and GABA-C2,C3,C4, and Asp-C2,C3. By 120 min of infusion with [1-13C]glucose, labeling at Glu-C4, Gln-C4 and GABA-C2 reached 30–40% (Figure 3), and formed the primary basis for estimating principal metabolic rates such as the rate of PDH, the TCA cycle and neurotransmitter cycling. In contrast to the labeling pattern seen with [1-13C]glucose, brain extracts from rats infused with [2-13C]glucose revealed that by 120 min of infusion, PE at Gln-C3, Glu-C3 and GABA-C3, which result predominantly from PC activity, reached 6–8%, clearly demonstrating that flux through this pathway is a smaller fraction of total glucose metabolism (Figure 3). Raw data are provided in supplementary information as a Microsoft Excel file.
The least-squares fitting of the three-compartment metabolic model to the labeling data from the [1-13C] and [2-13C]glucose infusions yielded estimates of Vpc and other fluxes. Examples of the best fits of the model for Glu-C2, C3, and C4, Gln-C3 and C4, GABA-C2, C3, and C4 and Asp-C2 and C3 time course data obtained for CX following [1-13C] and/or [2-13C]glucose infusions appear in Figure 3 (for the three other brain regions see supplementary information Figure S2, Figure S3 and Figure S4). Highly enriched carbon positions of large pool metabolites (e.g. Glu-C4 during infusions with [1-13C]glucose) exhibited relatively smaller scatter (%SD) compared to smaller pools with less labeling (e.g. GABA-C4 during [2-13C]glucose infusions), and thus were fitted with greater certainty by the metabolic model. The absolute scatter in terms of mM 13C had the same magnitude for all metabolites measured (data not shown).
The metabolic rates derived by modeling of data from the four brain regions are summarized in Figure 4. Additional rates appear in Table S4 of supplementary information and Table S1 presents the mathematical relationships for the model.
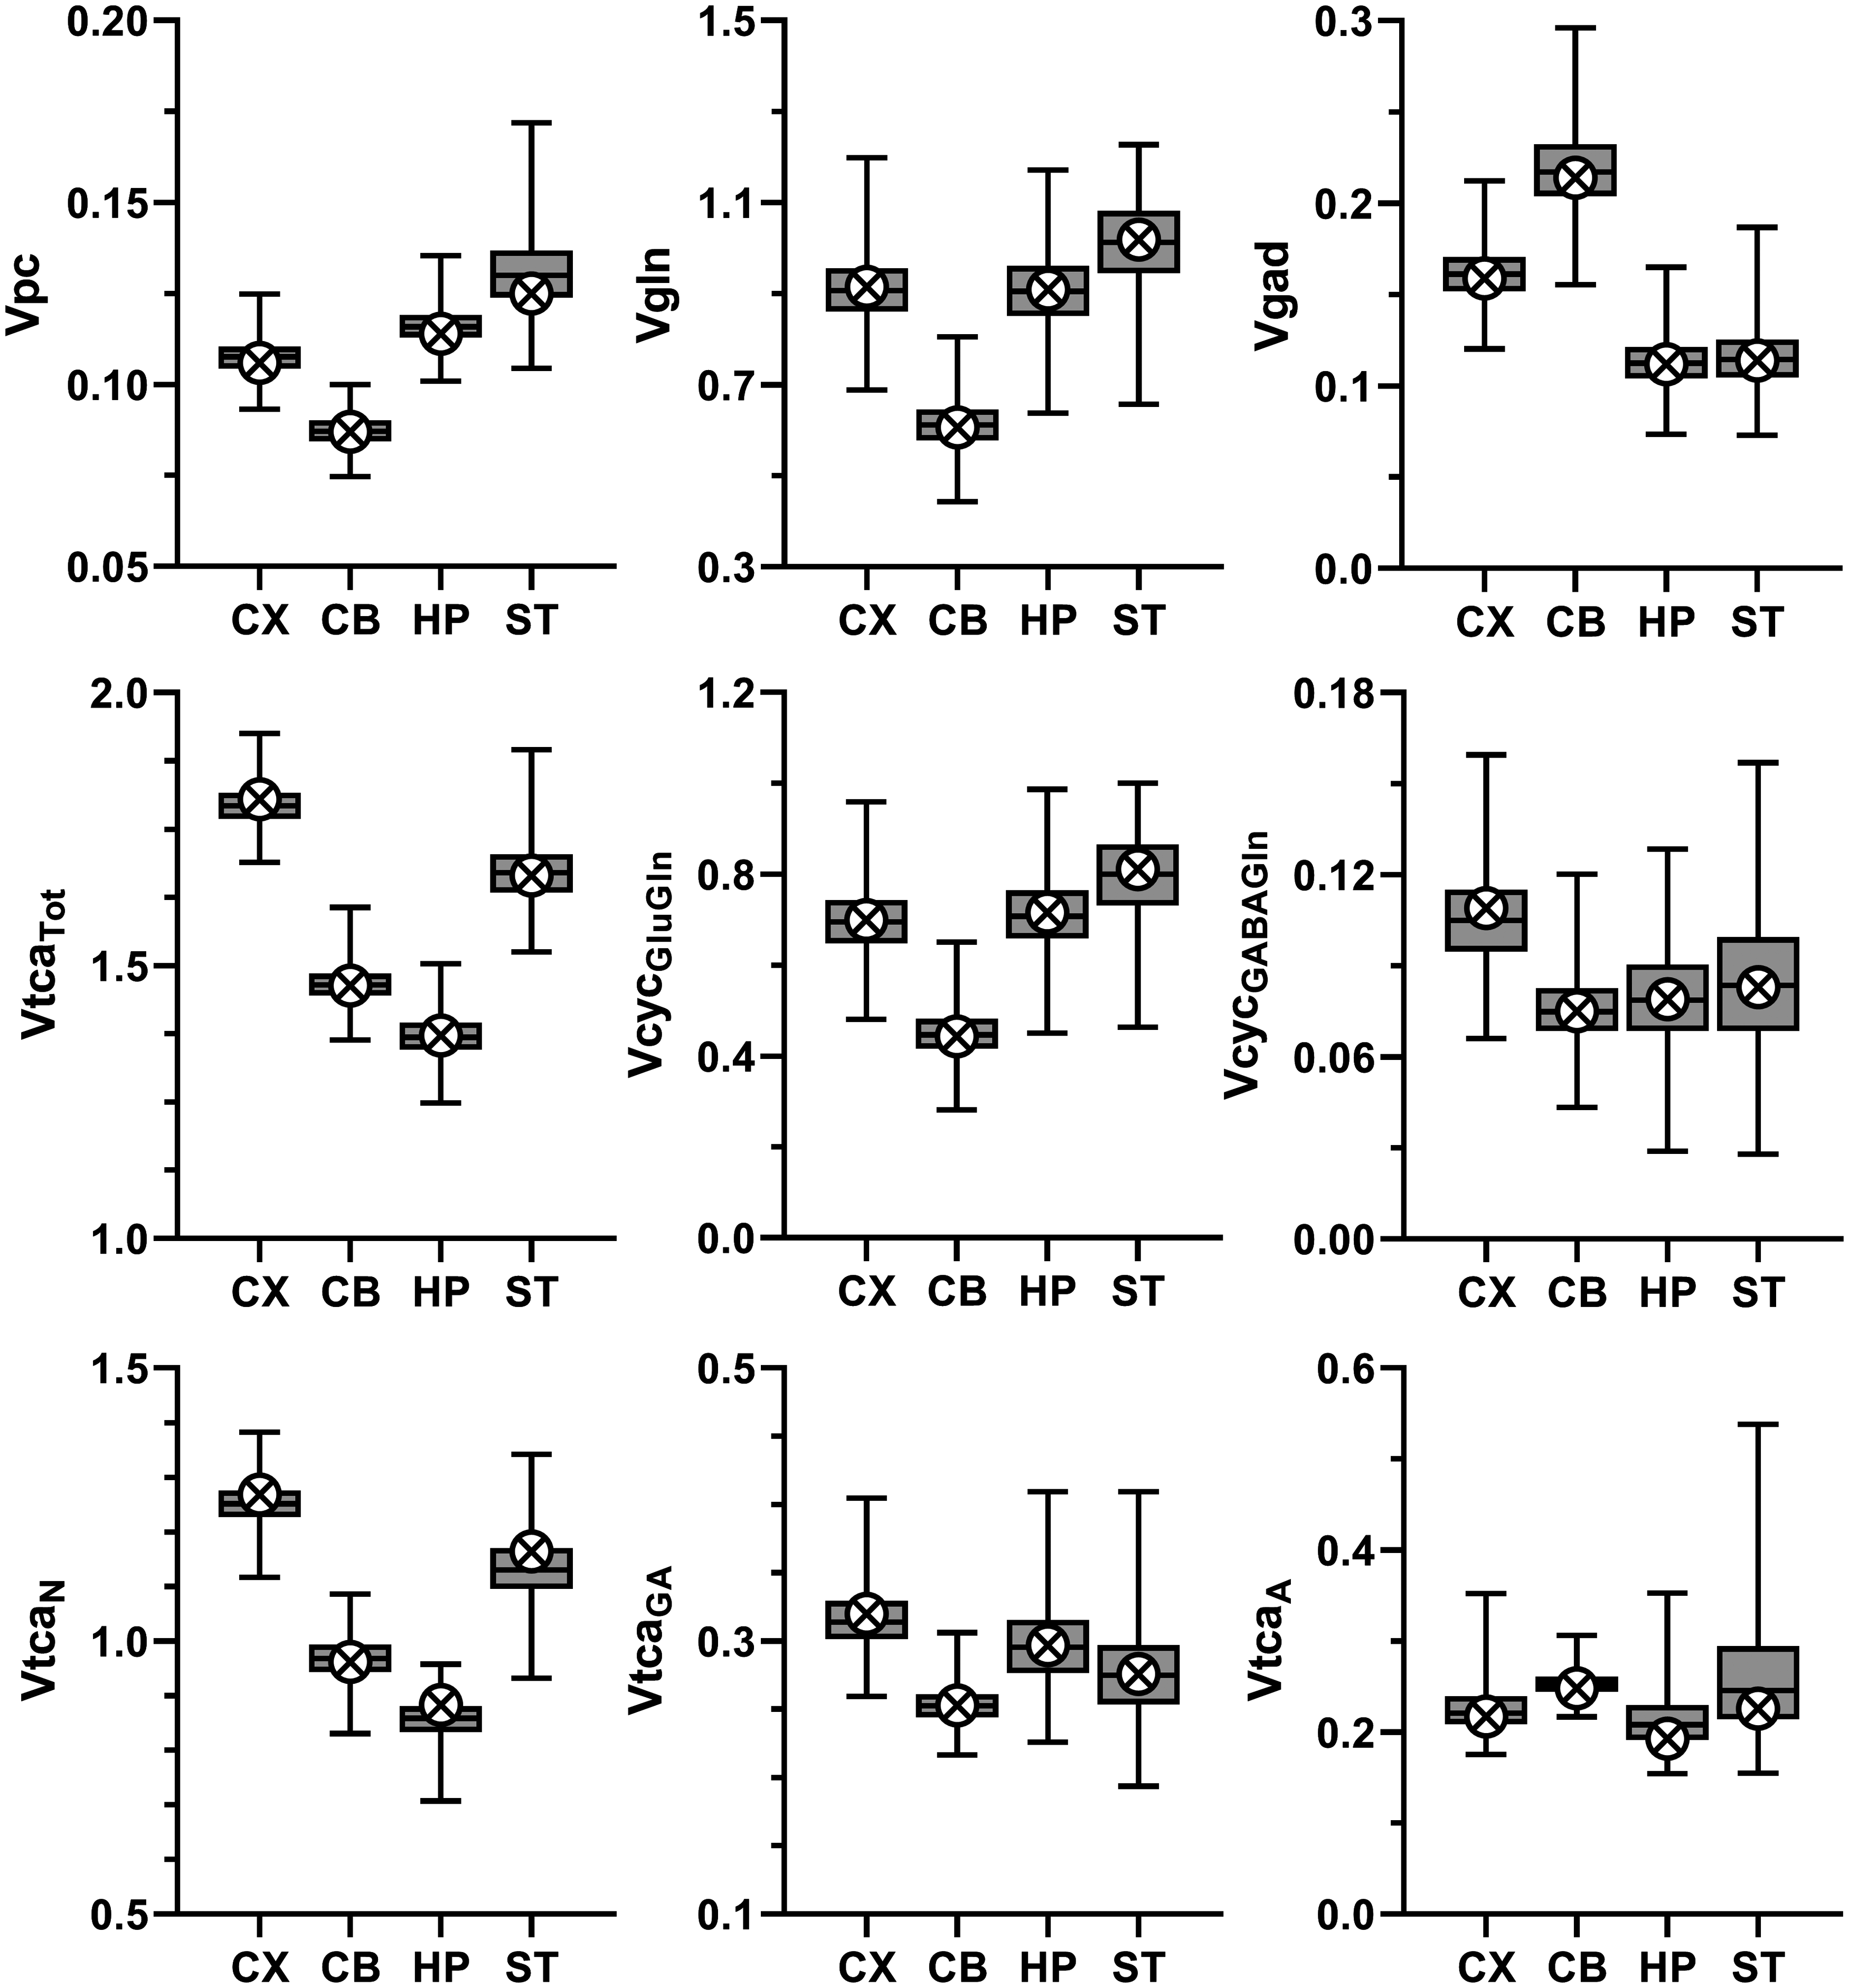
Selected metabolic rates (µmol/g/min) for cerebral cortex (CX), cerebellum (CB), hippocampus (HP) and striatum (ST) reported as best estimate (crossed circles) obtained from fitting of data to the three-compartment model and box-and-whiskers reporting minimum, 25th percentile, median, 75th percentile, and maximum for the frequency distribution determined from the Monte-Carlo analysis (MC). Definitions: Vpc, rate of anaplerosis via pyruvate carboxylase; Vgln, rate of glutamine synthesis via glutamine synthetase; Vgad, rate of GABA synthesis via glutamate decarboxylase (GAD); VtcaTot (=VtcaN + VtcaA + VtcaGA), rate of total TCA cycle; VtcaN, VtcaGA and VtcaA rate of TCA cycling in glutamatergic and GABAergic neurons, and astroglia, respectively; VcycGluGln, rate of glutamate-glutamine cycling; VcycGABAGln, rate of GABA-glutamine cycling. VcycGluGln, VcycGABAGln and VtcaN were iterated, whereas the other rates shown were calculated as specified in the model equations given in supplementary information Table S1. In supplementary information, additional rates appear in Table S4 and the frequency distribution for Vpc for all four brain regions are shown in Figure S5.
Vpc varied approximately 44% across the four brain regions investigated, being lowest in CB and highest in ST, with intermediate values in CX and HP. Relative to total oxidative glucose consumption of neurons and astroglia (CMRglc(ox)), Vpc constituted 13-19% and was lowest in CX and CB (∼13%), intermediate in ST (16%), and highest in HP (19%). These results were independent of the number of model compartments (three versus two), producing the same regional pattern of absolute and relative Vpc values (Table 1), while differing by −2 to 7% (Vpc) and −4 to 10% (Vpc/CMRglc(ox)), respectively (Table S4 versus Table S5). In contrast to the negligible effect on Vpc, Vgln and Vcyc, both astroglial and neuronal TCA cycle fluxes were increased for most brain regions by the addition of the third (GABAergic) compartment to the model, with exception of VtcaA for CB, which was reduced (Table 1).
Differences in best fit solutions of the three-compartment metabolic model compared to a two-compartment model for the selected fluxes.
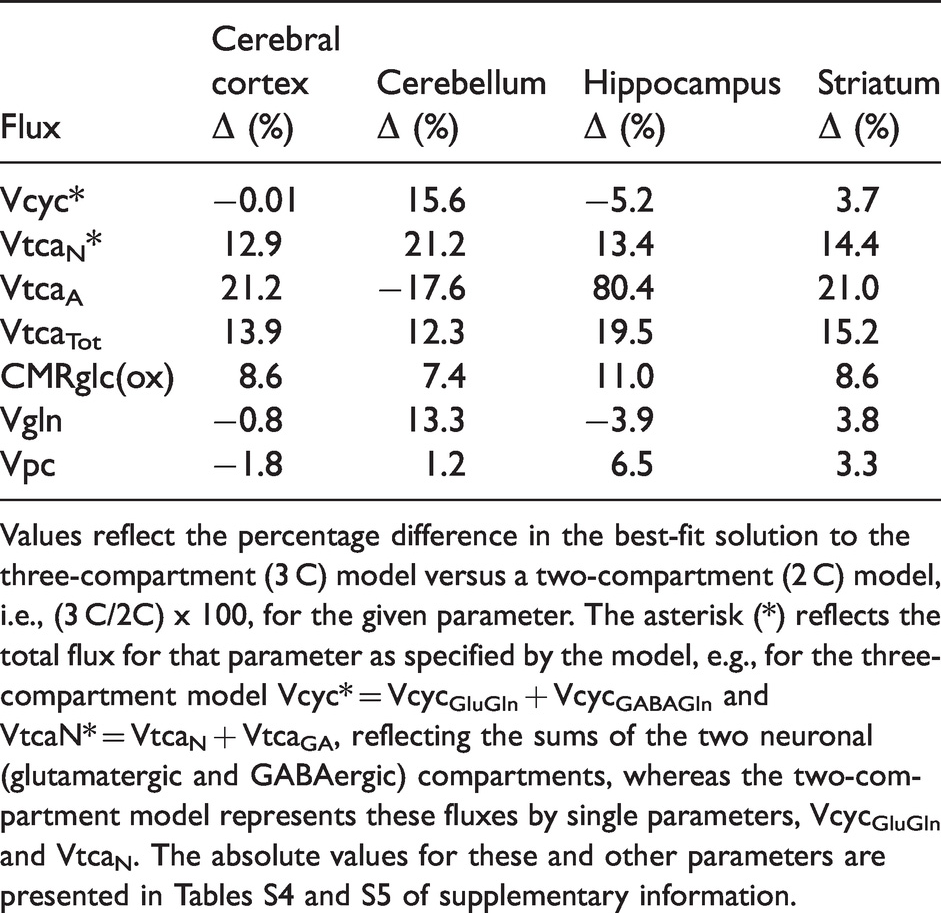
Values reflect the percentage difference in the best-fit solution to the three-compartment (3 C) model versus a two-compartment (2 C) model, i.e., (3 C/2C) x 100, for the given parameter. The asterisk (*) reflects the total flux for that parameter as specified by the model, e.g., for the three-compartment model Vcyc* = VcycGluGln + VcycGABAGln and VtcaN* = VtcaN + VtcaGA, reflecting the sums of the two neuronal (glutamatergic and GABAergic) compartments, whereas the two-compartment model represents these fluxes by single parameters, VcycGluGln and VtcaN. The absolute values for these and other parameters are presented in Tables S4 and S5 of supplementary information.
When the CX data from the current study are grouped with literature values from studies of whole brain or cerebral cortex of anesthetized and awake rats, a positive linear correlation was seen between Vpc and both VcycTot (Figure 5(a)) and CMRglc(ox) (Figure 5(b)). In both cases, the corresponding fluxes for CB, HP and ST fell within the very broad confidence intervals of the best-fit lines, respectively. Moreover, linear regression analysis that included the CX data along with literature values from studies of rats over a large range of neural activities revealed the strong linear correlation previously reported between the rates of total neuronal TCA cycling (VtcaN+GA) and total neurotransmitter cycling (VcycTot) (Figure 5(c)). Notably, the CX and other regions fell near the trend line in the plot of VtcaTot versus VcycTot, although the CI is unreliable at high flux values due to paucity of available data for rats under awake conditions. Further details for this meta-analysis including statistical results are provided in Figure 5 and its legend.
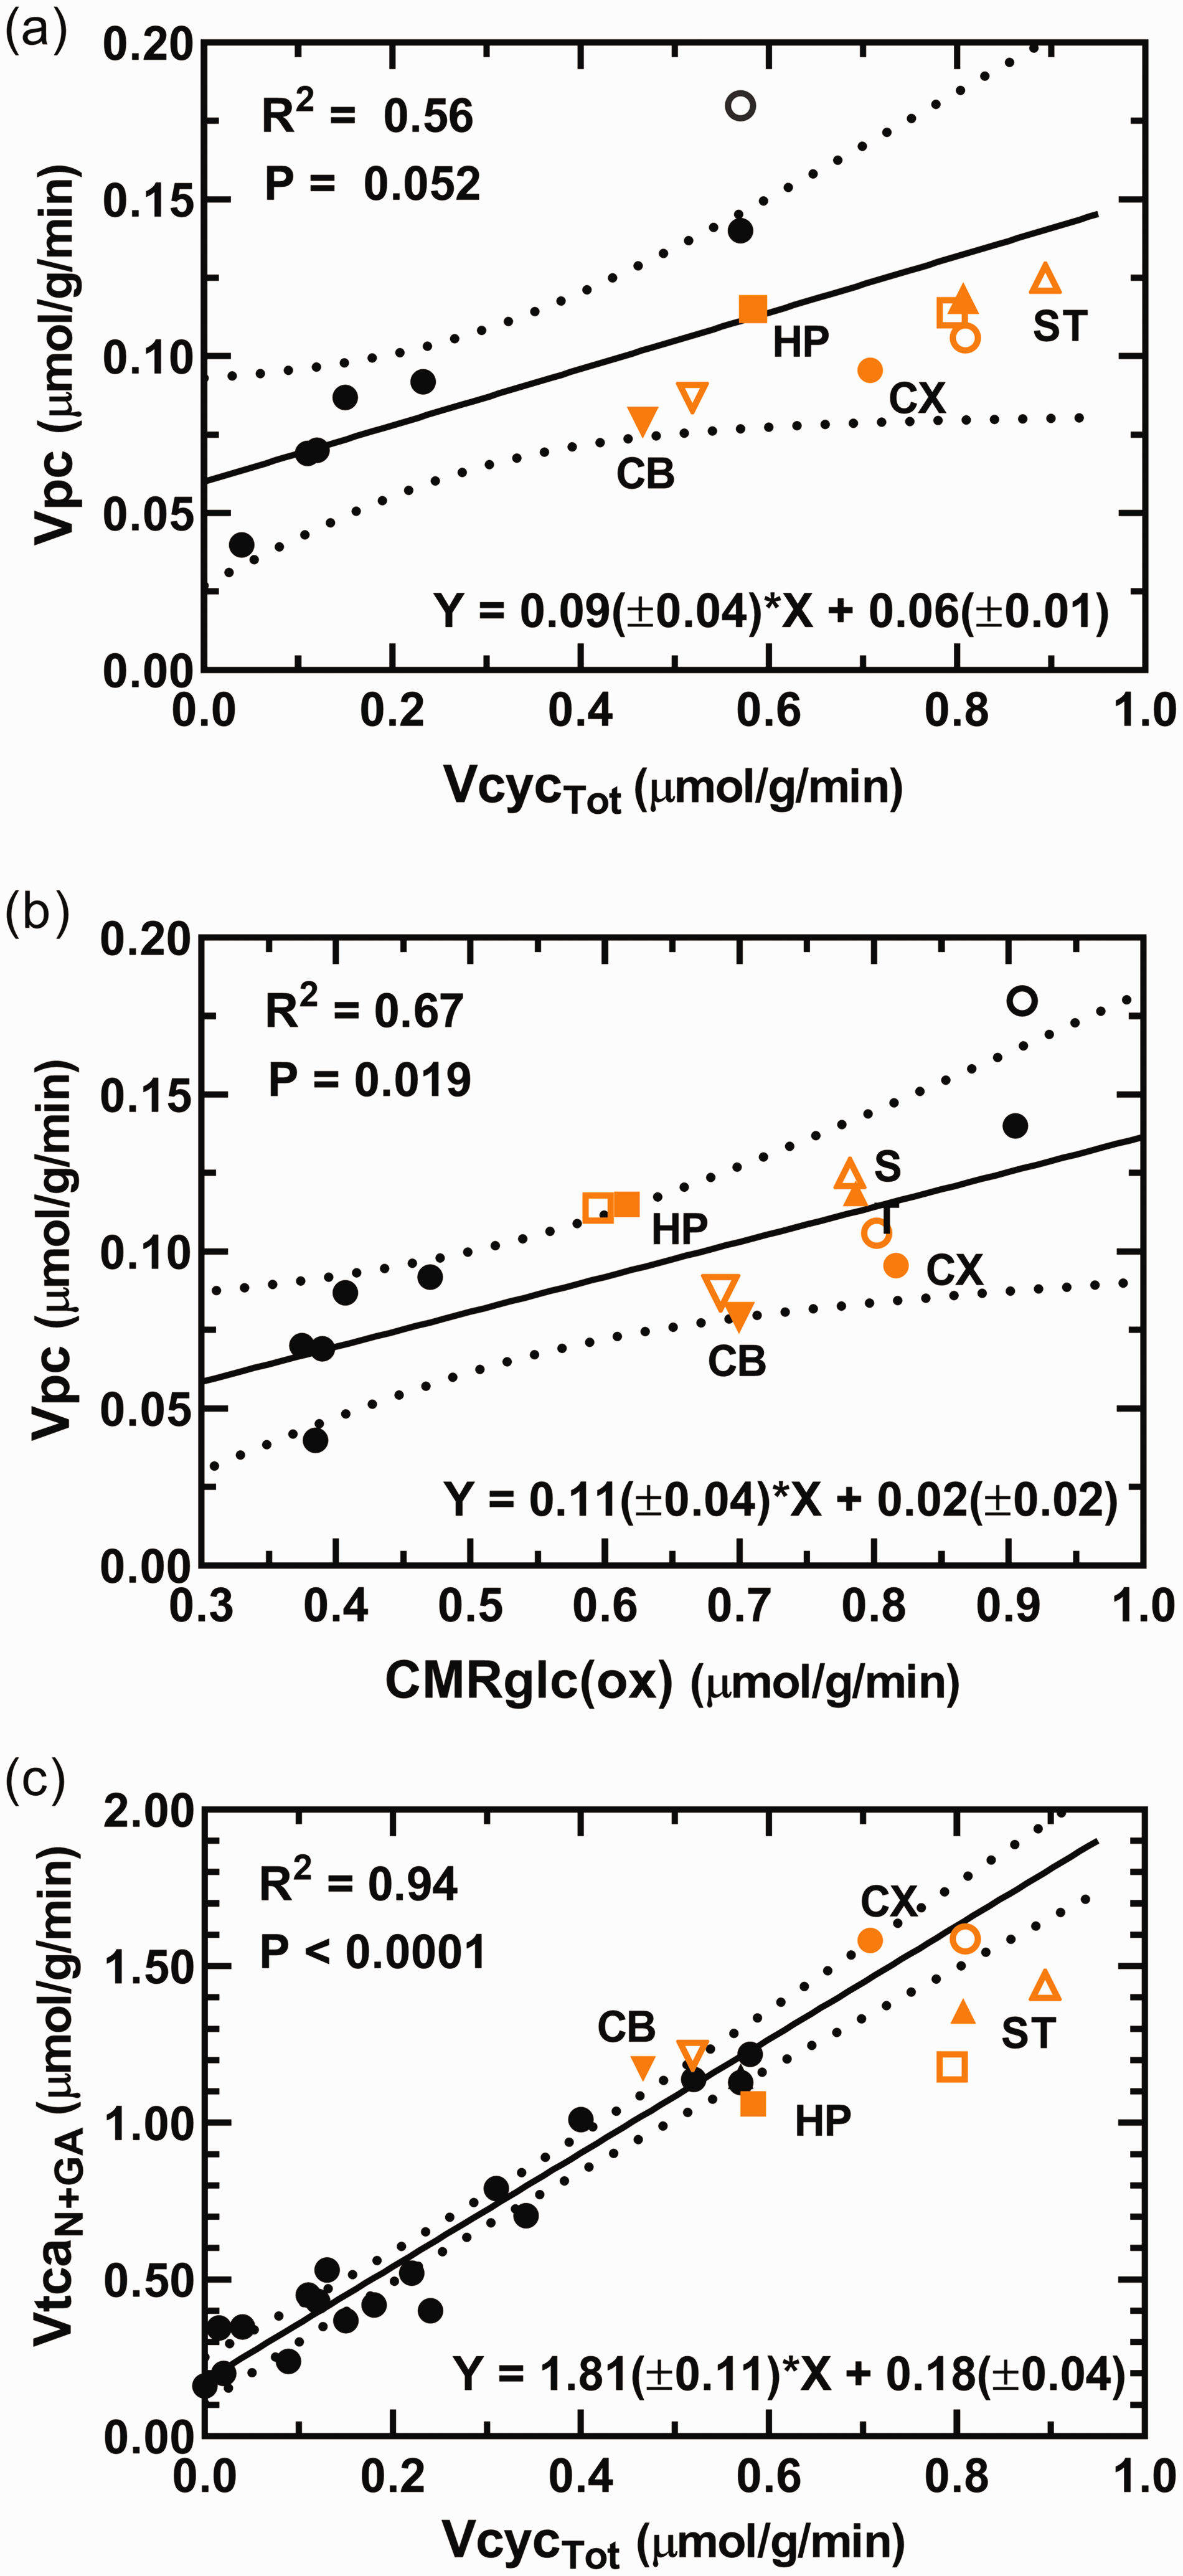
(a, b) Relationship between the rates of pyruvate carboxylation (Vpc) and total glutamate/GABA-glutamine cycling (VcycTot) and total glucose oxidation in neurons and astroglia (CMRglc(ox)). The regression analyses include cerebral cortex data from the current study (CX; orange filled circle) and literature values from studies of whole brain or cerebral cortex (black circles;19,20,30,50,51,84,85) of rats under awake and anesthetized conditions and where astroglial OAA-to-fumarate recycling was not allowed in the model, i.e., Vsc = 0 in the current study. Values for cerebellum (CB; inverted triangles), hippocampus (HP; squares) and striatum (ST; triangles) were superimposed on graphs for comparison but were not included in the regression analyses and parameters shown on the respective graphs. The unfilled symbols represent best-fit solutions allowing astroglial OAA-to-fumarate cycling for the corresponding brain region, which included the study by Öz et al (2004). 30 All brain regions fell within the 95% confidence interval of the best fit line. In a, including all brain regions in the least-squares best fit to the data yielded a line with slope of 0.08(±0.02) and y-intercept of 0.06(±0.01), R2 = 0.60 and P = 0.009 (slope significantly different from zero). In b, including all brain regions in the least-squares best fit to the data yielded a line with slope of 0.11(±0.03) and y-intercept of 0.03(±0.02), R2 = 0.60 andContinued.P = 0.008 (slope significantly different from zero). (c) Relationship between the total TCA cycling in neurons (VtcaN+GA = VtcaN + VtcaGA) and total glutamate and GABA neurotransmitter cycling (VcycTot = VcycGluGln + VcycGABAGln). The regression analysis includes CX data from the current study (orange circle) and literature values from studies of anesthetized and awake rats (black circles; e.g. awake or using α-chloralose, morphine, halothane, different doses of pentobarbital, or urethane;19,20,25,26,30,49,50,84–87). Values for CB, HP and ST data from the current study are superimposed for comparison but were not included for the regression analysis and the parameters shown on the respective graphs. In c, including all brain regions in the least-squares best fit to the data yielded a line with slope of 1.68(±0.10) and y-intercept of 0.20(±0.04), R2 = 0.93 and P < 0.0001 (slope significantly different from zero). (a–c) All literature values included in the analyses derive from studies performed on rats using 13C-labeled substrates and in vivo or ex vivo NMR. On all graphs a trend line and 95% confidence intervals are shown along with the parameters from the regression analysis: R2, Pearson product-moment correlation coefficient; P value, significance of the difference in the value of the slope from zero; equation with slope and y-intercept, ± SE.
Model validation
Besides the comparison with a two-compartment model described above, several other analysis were completed to validate the model. Results from these are provided, described and discussed in supplementary information. In particular, the local sensitivity of the metabolic model to certain parameters, which are either unknown or poorly determined and constrained as fixed values in the model, were tested one at a time for each of the four brain regions (Figure S10). These tests were supported by within-region correlation analyses of the Monte-Carlo evaluations across 35 of the rates (Figure S11). Furthermore, a detailed literature assessment was performed to justify the conclusion that the acute period of mild hypoglycemia of 8 min to 2 hours is not expected to affect the measured metabolic rates. Finally, the robustness of Vpc and certain other fluxes to the way in which astroglial glutamine dilution arose in the model was evaluated (Table S7).
Discussion
Anaplerosis is the primary metabolic pathway to replenish TCA cycle intermediates and neurotransmitter amino acids lost by diffusion or oxidation.1–4 In the brain, anaplerosis occurs predominately in astroglia and mainly through the ATP-dependent carboxylation of pyruvate by PC.5–10 While the evidence for the role of anaplerosis in ammonia detoxification is considerable, 3 the extent to which glutamate/GABA oxidation and other potential mechanisms contribute to the PC flux in vivo remain open and debated questions. Regardless of the detailed mechanisms contributing to anaplerosis, the maintenance of constant levels of neurotransmitter amino acids and TCA cycle intermediates requires that this flux, as given by Vpc, balances all losses due to oxidation and diffusion. Thus, Vpc can be viewed as an upper bound of the net rate of glutamate/GABA oxidation, a process which involves malic enzyme, producing NADPH for reductive synthesis in anabolic processes, 59 reactive oxygen species scavenging60,61 and as a substrate for ROS-producing NADPH oxidases in signal transduction. 62
Previous measurements of PC flux in brain have focused on whole brain or a single brain region (e.g., cerebral cortex) and mostly in rodents under anesthesia. In this study, we used a sensitive NMR approach employing [2-13C]glucose, which provides a PC-specific labeling of metabolites,33,36 along with separate [1-13C]glucose infusions, which predominantly provides information on neuronal metabolism. We used these tools to obtain a detailed assessment of metabolism in multiple brain regions of awake rats, i.e. CB, HP, ST and CX. In a novel implementation of the three-compartment metabolic model, the two data sets were fitted simultaneously, yielding quantitative estimates of astroglial and neuronal metabolic rates in the measured brain regions. We also compared the flux estimates to those derived by a simpler two-compartment model composed of neurons (glutamatergic) and astroglia, and evaluated different astroglial dilution pathways to assess the robustness of our findings and their interpretation.
The rate of anaplerosis varies across brain regions of the awake rat
The value of Vpc for CX of 0.106 µmol/min/g, which constituted 13% of CMRglc(ox), is slightly lower than previously reported for whole brain in awake rats (0.14–0.18 µmol/min/g) 30 but larger than for CX and whole brain of rats under anesthesia (0.04–0.09 µmol/g/min19,20,25,26,63). The variation across brain regions in CMRglc(ox) follows the same order as reported for glucose consumption measured by Sokoloff et al. 64 using [14C]deoxyglucose, i.e. HP<CB<ST<CX. The relational order in the magnitudes of Vpc and CMRglc(ox) among the different regions was not affected by the number of model compartments (three verses two: compare Table S4 and S5).
The value of Vpc varied by approximately 44% across the measured brain regions, being lowest in CB (0.087 ± 0.004 µmol/g/min) and highest in ST (0.125 ± 0.009) with intermediate values in CX (0.106 ± 0.005) and HP (0.114 ± 0.005). The range of Vpc values determined for the four brain regions in the current study (0.087–0.125 μmol/g/min) is lower than what has been reported for the whole brain of awake rats, 0.17–0.18 µmol/g/min.27,30 The lower value may reflect the methodology used with the two other studies using either 14CO2 or [1-13C]glucose as the label precursor as discussed previously. 33
The value of Vpc in CX showed linear relationships with rates of glucose oxidation (R2 = 0.67) and glutamate/glutamine cycling (R2 = 0.56) when plotted against literature values reported for a large range of metabolic activity (Figure 5(a) and (b)), consistent with the activity dependent relationship noted previously.19,30,36,65,66 Moreover, data from CB, HP and ST fell within the 95% CI’s of the cortical values. Neural activity as measured by electroencephalography (EEG) is correlated with CMRglc(ox) in human visual cortex. 67 Likewise, the relationship between changes in VcycTot and CMRglcN(ox) for rat cortex is well established and suggests a close to 1:1 relationship 63 (or 1:2 for VcycTot versus VtcaN+GA). Plotting the values of VcycTot against VtcaN+GA for the different regions shows that CX and CB fall near the best-fit line (and the 1:2 prediction) from the plot of the literature data, whereas HP and ST fell below this line (Figure 5(c)). This outcome was not affected by the number of model compartments (3 versus 2; compare Table S4 and S5). The lower VtcaN+GA/VcycTot ratio for HP and ST is unclear, although for ST a similar conclusion was reached previously. 68 In this case, there are too few points at the high end of the scatter plot to calculate an appropriate 95% CI. Lower energy consumption for processes not involved in signaling in these regions might explain the lower ratios, although such information is not presently available. There may also be differences in the activity dependence of Vpc, which is subtracted from the value of Vgln in order to calculate VcycTot (recalling the model equation Vgln = VcycGluGln + VcycGABAGln + Vpc and that VcycTot = VcycGABAGln+VcycGluGln; see Table S1). Future studies of the different brain regions performed at different levels of neural activity using the same 13C labeling methodology and animal model will be needed to resolve these issues.
Considering the relationship seen between Vpc and VcycTot in cerebral cortex is linear and that the regional data points also align in a linear manner in Figure 5(a), suggests that a component of PC activity is coupled at a near constant ratio to de novo synthesis of glutamate needed to sustain neurotransmitter cycling, rather than ammonia detoxification and replacement of TCA cycle intermediates lost for purposes other than GABA/glutamate oxidation. Vpc constituted 12-14% of glutamine synthesis (Vgln) across brain regions, despite the 68% difference in rates of glutamine synthesis (being lowest in CB, 0.606 ± 0.052 µmol/g/min, and highest in ST, 1.019 ± 0.100 µmol/g/min). Anaplerosis thus appears to contribute equally to glutamine synthesis across brain regions of the awake rat. This further supports the proposed functional relationship between VcycTot and Vpc.
Mechanisms contributing to anaplerotic flux
As noted above, anaplerosis balances the combined losses of neurotransmitter amino acids and precursor substrates through ammonia detoxification, diffusion and oxidation. Under normal physiological conditions and low blood ammonia level, oxidation is thought to be the dominate route of glutamate and GABA loss, and thus, this rate is maximally bounded by Vpc.44,59 An estimate of the non-signaling (housekeeping) component of Vpc that includes ammonia detoxification for cerebral cortex is given by the y-axis intercept (Vcyc = 0) of the least-squares fitted line in the plot of Vpc versus VcycTot (Figure 5(a)) of 0.06 µmol/g/min. This value is higher than values of brain glutamine efflux measured in anesthetized rats of ∼0 to 0.02 µmol/min/g69–71 using 13N and 15N labeled ammonia and artereo-venous difference methods (for a summary see 33 ) suggesting that much of the PC flux measured in awake animals under physiologically normal conditions is not driven by ammonia fixation and removal.
Whereas glutamate and GABA oxidation is readily measured in brain slices72–75 and cultured astroglia (and to some degree in cultured neurons and isolated synaptosomes),2,76–78 direct demonstration of their oxidation in vivo, as evidenced by 13C labeling patterns consistent with astrocyte pyruvate recycling, has not been found. In astroglia, the magnitude of glutamate oxidation is strongly determined by the extracellular glutamate concentration, rising significantly for levels >100 μM2, which is ∼100-fold higher than the ambient extracellular level measured by microdialysis in vivo.79,80 Complete oxidation of glutamate and GABA in the TCA cycle can be achieved via mitochondrial ME, which decarboxylates malate to pyruvate followed by its conversion to acetyl-CoA by PDH and oxidation in the TCA cycle. Pyruvate recycling through ME-PDH produces distinct labeling patterns in glutamate and glutamine depending on the labeled carbon position in glucose. For example, the subsequent action of ME on the 13C-labeled OAA-C2 and C3 (after recycling to malate-C2 and C3 via back flow to fumarate) produced from [2-13C]glucose-derived pyruvate-C2 via PC would produce both C2- and C3-labeled pyruvate, leading to Glu-C4 (and Gln-C4) labeling from [2-13C]glucose, which was observed in the present study. In addition to pyruvate recycling through ME-PDH, an alternate pathway that shunts the flow from malate to OAA through pyruvate (bypassing MDH) by coupling ME with PC has been described. 81 In pyruvate recycling through ME-PC, one molecule of NADPH is produced and one molecule of ATP hydrolyzed for each molecule of malate converted to OAA. Unfortunately, flux through ME-PDH and ME-PC will produce the same 13C labeling patterns from [2-13C]glucose, and thus cannot be differentiated in this manner. In addition, due to label scrambling between malate C3 and C2 (back flow through fumarase to fumarate; denoted by Vsc in the model), pyruvate recycling through ME-PC will tend to equalize labeling between pyruvate-C2 and C3, and thus also between OAA-C3 and C2 via PC (and glutamine C3 and C2). The large difference in 13C enrichment between glutamine C3 and C2 suggests that pyruvate recycling through ME-PC is not the major component of PC flux.
As noted above, Glu-C4 and Gln-C4 labeling from [2-13C]glucose was observed, consistent with pyruvate recycling. However, other pathways are known to contribute to this labeling, namely label scrambling in blood glucose by hepatic metabolism and the pentose phosphate pathway (PPP). In the present study, scrambling of the label in plasma glucose from C2 to C1 could explain approximately half of the ∼3% enrichment seen in Glu-C4, Gln-C4 and GABA-C2. In a previous study of anesthetized rats, 36 labeling in Glu-C4 after infusion of [2-13C]glucose was compared with that from [5-13C]glucose, which is not confounded by metabolism through the PPP, finding that ∼1% of the Glu-C4 labeling was derived from this pathway. As pointed out previously, 82 the anticipated fractional enrichment of 13C labeling due to pyruvate recycling in astroglia is low and may be below the ability to differentiate from blood contributions. Thus, our findings support previous in vivo and ex vivo studies where brain and blood enrichments were determined20,36,83 in finding no definitive evidence for pyruvate recycling (whether by ME-PDH or ME-PC), leaving unanswered questions about the quantitative significance of glutamate oxidation 59 and (or) NADPH production and ROS scavenging 81 in anaplerosis and the crucial need for further investigation.
Conclusions
Simultaneous fitting to a three-compartment metabolic model of 18 enrichment (%) time courses from metabolism of [1-13C] and [2-13C]glucose in four brain regions and blood plasma was successfully performed and 35 metabolic fluxes determined. The pyruvate carboxylase flux (Vpc) across the four brain regions of the awake rat varied from 0.087 to 0.125 µmol/min/g in the order CB<CX<HP<ST.
Vpc constituted 6-8% of total TCA cycle flux and accounted for 12-14% of glutamine synthesis. Furthermore, Vpc varied linearly with the rates of neurotransmitter cycling and total glucose oxidation, with the four brain regions mapping well within the 95% confidence interval. This suggests a functional role of Vpc, supporting different signaling and energetic demands of the different brain regions.
Supplemental Material
sj-xls-1-jcb-10.1177_0271678X221074211 - Supplemental material for Rates of pyruvate carboxylase, glutamate and GABA neurotransmitter cycling, and glucose oxidation in multiple brain regions of the awake rat using a combination of [2-13C]/[1-13C]glucose infusion and 1H-[13C]NMR ex vivo
Supplemental material, sj-xls-1-jcb-10.1177_0271678X221074211 for Rates of pyruvate carboxylase, glutamate and GABA neurotransmitter cycling, and glucose oxidation in multiple brain regions of the awake rat using a combination of [2-13C]/[1-13C]glucose infusion and 1H-[13C]NMR ex vivo by Laura M McNair, Graeme F Mason, Golam MI Chowdhury, Lihong Jiang, Xiaoxian Ma, Douglas L Rothman, Helle S Waagepetersen and Kevin L Behar in Journal of Cerebral Blood Flow & Metabolism
Supplemental Material
sj-pdf-2-jcb-10.1177_0271678X221074211 - Supplemental material for Rates of pyruvate carboxylase, glutamate and GABA neurotransmitter cycling, and glucose oxidation in multiple brain regions of the awake rat using a combination of [2-13C]/[1-13C]glucose infusion and 1H-[13C]NMR ex vivo
Supplemental material, sj-pdf-2-jcb-10.1177_0271678X221074211 for Rates of pyruvate carboxylase, glutamate and GABA neurotransmitter cycling, and glucose oxidation in multiple brain regions of the awake rat using a combination of [2-13C]/[1-13C]glucose infusion and 1H-[13C]NMR ex vivo by Laura M McNair, Graeme F Mason, Golam MI Chowdhury, Lihong Jiang, Xiaoxian Ma, Douglas L Rothman, Helle S Waagepetersen and Kevin L Behar in Journal of Cerebral Blood Flow & Metabolism
Footnotes
Funding
The author(s) disclosed receipt of the following financial support for the research, authorship, and/or publication of this article: LMM acknowledges the Department of Drug Design and Pharmacology (UCPH, Denmark) for granting of a PhD scholarship. This work was supported in part by NIH NIMH grants MH095104 and MH109159, NIH NIDDK grant R01 DK108283, NIH NIAAA grant R01 AA021984 and R21 AA028628, and a grant from Aase og Ejnar Danielsens Fond.
Acknowledgements
We thank Ms. Monique Thomas for her helpful guidance with regards to tissue extractions, Dr. Robin de Graaf for providing the 1H-[13C]-NMR sequence and Terry Nixon, Scott McIntyre and Peter Brown for engineering and maintenance support of the NMR spectrometer. Jens V Andersen is acknowledged for helpful assistance with the manuscript.
Declaration of conflicting interests
The author(s) declared no potential conflicts of interest with respect to the research, authorship, and/or publication of this article.
Authors’ contributions
LMM, KB, GFM, DLR and HSW conceptualized and designed the study. LMM conducted all experiments with support from XM, GMIC and LJ (live animal procedures, sample processing), LJ, KB and GFM (NMR acquisition, data processing and modeling of data). LMM drafted the manuscript in collaboration with HSW, KB, GFM and DLR. All co-authors revised the manuscript and approved the version to be published.
Supplemental material
Supplemental material for this article is available online.
References
Supplementary Material
Please find the following supplemental material available below.
For Open Access articles published under a Creative Commons License, all supplemental material carries the same license as the article it is associated with.
For non-Open Access articles published, all supplemental material carries a non-exclusive license, and permission requests for re-use of supplemental material or any part of supplemental material shall be sent directly to the copyright owner as specified in the copyright notice associated with the article.