
Abstract
Adolescence is a period of rapid development of the brain’s inherent functional and structural networks; however, little is known about the region-to-region organization of adolescent cerebral blood flow (CBF) or its relationship to neuroanatomy. Here, we investigate both the regional covariation of CBF MRI and the covariation of structural MRI, in adolescents with and without bipolar disorder. Bipolar disorder is a disease with increased onset during adolescence, putative vascular underpinnings, and evidence of anomalous CBF and brain structure. In both groups, through hierarchical clustering, we found CBF covariance was principally described by clusters of regions circumscribed to the left hemisphere, right hemisphere, and the inferior brain; these clusters were spatially reminiscent of cerebral vascular territories. CBF covariance was associated with structural covariance in both the healthy group (n = 56; r = 0.20, p < 0.0001) and in the bipolar disorder group (n = 68; r = 0.36, p < 0.0001), and this CBF-structure correspondence was higher in bipolar disorder (p = 0.0028). There was lower CBF covariance in bipolar disorder compared to controls between the left angular gyrus and pre- and post-central gyri. Altogether, CBF covariance revealed distinct brain organization, had modest correspondence to structural covariance, and revealed evidence of differences in bipolar disorder.
Introduction
Network-like relationships between brain regions are fundamental to brain organization. MRI allows the study of these networks through high-resolution imaging and various forms of image contrast. At the group level, covariation of images with functional or structural contrast can probe network-like associations in the brain. Commonly, this group-level covariance mapping is performed with T1-weighted (T1w) MRI of grey matter anatomy, in which regional coordination of grey matter structure is established through correlations across individuals. Known as structural covariance, these grey matter networks are genetically heritable, 1 and reveal changes due to disease progression, aging, and development. 2
Cerebral blood flow (CBF) is an essential aspect of brain health as it supports brain function and metabolism. 3 At the group level, CBF can be correlated between regions to yield network-like patterns, akin to structural covariance analysis. Prior studies have assessed CBF covariance in both healthy and clinical adult populations, using graph theoretic and seed-based methods. Melie-García et al. report that CBF covariance in healthy adults conveys information which aligns with that of functional and structural connectivity networks. 4 In psychiatry studies, Zhu et al. and Liu et al. report CBF covariance differences between schizophrenia and healthy controls.5,6 To date, however, there are no investigations on the relationship between CBF and structural covariance despite clear examples where multi-contrast imaging yields promising applications of neuroimaging in psychiatry. 7
The developing brain undergoes phases of rapid and nonlinear changes in CBF and grey matter anatomy.8,9 Structural covariance reflects these nonlinear developmental changes in grey matter, demonstrated by reports of an inverted U-shaped trajectory with age and coupling to synchronized maturation across brain regions.10–12 Conversely, CBF tends to decrease with age during adolescence. 8 Therefore, CBF covariance and structural covariance are potentially complementary network neuroimaging measures of adolescent neurodevelopment, and abnormalities therein. Indeed, CBF and brain structure are intimately coupled through the functional and structural inter-dependence of vessels and neural cells within the neurovascular unit. 13 Nevertheless, no prior studies have, to date, assessed CBF covariance in an adolescent cohort.
Adolescence is a time of increased onset of bipolar disorder, a psychiatric condition with putative vascular underpinnings.14–16 Bipolar disorder is characterized by recurrent manic/hypomanic and depressive mood episodes. 17 Studies of adults with bipolar disorder report widespread anomalies in both CBF and grey matter18,19; studies of adolescents with bipolar disorder report anomalous CBF and grey matter mostly in the frontal lobe and amygdala.14,20–22 The cerebrovascular aspects of bipolar disorder pathophysiology, including measures of CBF, deserve particular attention due to the significant elevation of cerebrovascular morbidity and mortality associated with bipolar disorder. 23
This study investigates CBF and structural covariance patterns in adolescents with and without bipolar disorder. Here, we define structural covariance through covariation of grey matter volume. The inter-individual variability characterized by covariance networks may provide insight into the complex interplay between function and structure during neurodevelopment and pediatric onset of bipolar disorder. We first perform a data-driven exploration to characterize the spatial organization of CBF covariance in our adolescent cohort. Next, we evaluate the association between CBF covariance and structural covariance. We hypothesize CBF and structural covariance is correlated across the adolescent brain. We then evaluate whether this association is altered by bipolar disorder. We hypothesize there will be group differences (bipolar disorder vs controls) in association between CBF and structural covariance networks. Finally, we test for group differences in region-by-region covariance for both CBF and structural data separately.
Materials and methods
Participants
One-hundred and twenty-four participants were recruited. Each participant and their guardian provided written informed consent. This study was approved by the Sunnybrook Research Ethics Board, in accordance with the Declaration of Helsinki. Participants were males and females between the ages of 13 and 20. Individuals with bipolar disorder (n = 68) were recruited through the Centre for Youth Bipolar Disorder at Sunnybrook Health Sciences Centre in Toronto, ON. The bipolar disorder group met diagnostic criteria for the subtypes BD-I, BD-II, or BD-NOS (not otherwise specified). Psychiatric diagnoses were determined by the Schedule for Affective Disorders and Schizophrenia for School Age Children, Present and Lifetime Version (K-SADS-PL). 24 The K-SADS Depression Rating Scale and the K-SADS Mania Rating Scale were used in place of the standard mood sections.25,26 Additional information was acquired using the Family History Screen interview and the Children’s Global Assessment Scale.27,28 BD-NOS was defined using criteria outlined by the Course and Outcome of Bipolar Illness in Youth study group. 29 Age- and sex-matched healthy controls (n = 56) were recruited through local advertising and had no lifetime history of mood or psychotic disorders, and no anxiety disorders or alcohol/drug dependence within three months of recruitment. Participants were excluded for: 1) inability to provide informed consent; 2) contraindication to MRI; 3) cardiac, autoimmune, or inflammatory illness; 4) neurological or cognitive impairment. The participants’ demographic and clinical characteristics are shown in Table 1.
Demographic and clinical characteristics of participants.
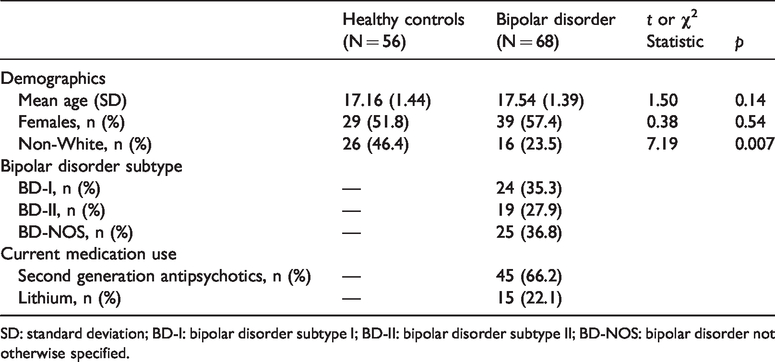
SD: standard deviation; BD-I: bipolar disorder subtype I; BD-II: bipolar disorder subtype II; BD-NOS: bipolar disorder not otherwise specified.
Magnetic resonance imaging
Images were acquired on a 3 T MRI system (Achieva, Philips) equipped with an eight-channel head coil receiver. Pseudo-continuous ASL MRI was performed with a single-shot two-dimensional echo planar imaging acquisition (TR/TE = 4000/9.6 ms, spatial resolution 3 × 3 × 5 mm, field of view 192 × 192 × 90 mm, scan duration 4:48 min:s), 1650 ms labelling duration, post-label delay for the most inferior slice was 1600 ms and incremented by 36 ms per slice, and 35 control-label pairs. A reference image was acquired to estimate the proton density signal, account for potential coil sensitivity bias, and scale the ASL images during calculation of absolute CBF (TR = 10 s, parameters otherwise identical to ASL acquisition parameters). Anatomical T1-weighted (T1w) imaging was performed with a fast field echo acquisition (TR/TE = 9.5/2.3 ms, spatial resolution 0.9 × 0.7 × 1.2 mm, field of view 240 × 191 × 168 mm, scan duration 8:56 min:s).
MRI processing
To obtain voxel-wise estimates of CBF, we used an in-house processing pipeline built on tools from the FMRIB Software Library (FSL). 30 Steps included motion correction, quantification of CBF, smoothing, and alignment with a standard image space. Motion correction was applied by registering ASL data to the 18th (i.e. middle) volume. CBF-weighted difference images were calculated using sinc subtraction of control-label images and spatially smoothed using an isotropic Gaussian kernel with a full-width-half-max of 5 mm. Difference images corrupted by head motion were discarded using the ENABLE automated quality control algorithm developed by Shirzadi et al.31,32 CBF-weighted images were converted to absolute units (mL/100 g/min) by scaling with the proton density image and calibrating with an established ASL MRI model using literature values for model parameters. 33 We aligned the CBF images to MNI (Montreal Neurological Institute) 152 standard space using a linear transformation to each individual’s T1w image followed by a non-linear transformation to standard space. Individual CBF images were intensity normalized by the global CBF mean to facilitate between-subject regional comparisons. Global CBF mean was estimated by taking the average CBF of all brain voxels identified by brain extraction of T1w anatomical images. As described in the seminal work by Horwitz et al., 34 intensity normalization was performed on a per-participant basis by dividing the CBF values of all brain voxels by the global CBF mean. Intensity normalization removes large between-individual variations in CBF (such as those from factors not accounted for after matching for age and sex), which could dominate the relatively smaller within-individual variations 35 and result in significant positive correlations between all pairs of regions.
To obtain voxel-wise estimates of grey matter volume from T1w images, we used selected steps from FSL’s voxel-based morphometry analysis pipeline. 36 First, structural images were brain-extracted and grey matter was identified by tissue-type segmentation. We then registered grey matter maps to the MNI 152 standard space using linear followed by non-linear registration. 37 Finally, we scaled the grey matter images to correct for local expansion (or contraction) due to the non-linear component of the spatial transformation; this scaling allows estimation of local grey matter volume independent of total intra-cranial volume. The scaled grey matter images were then smoothed by the same amount as the CBF data (full-width-half-max of 5 mm).
Estimation of covariance maps
Voxel-wise CBF and grey matter volume estimates were used to estimate CBF and structural covariance maps, respectively. The procedure described in the following paragraphs was applied to both CBF and grey matter volume images, and for healthy controls and bipolar disorder separately. Therefore, the output of this analysis was four covariance maps (two image contrasts × two participant groups). A schematic of this analysis is shown in Figure 1.
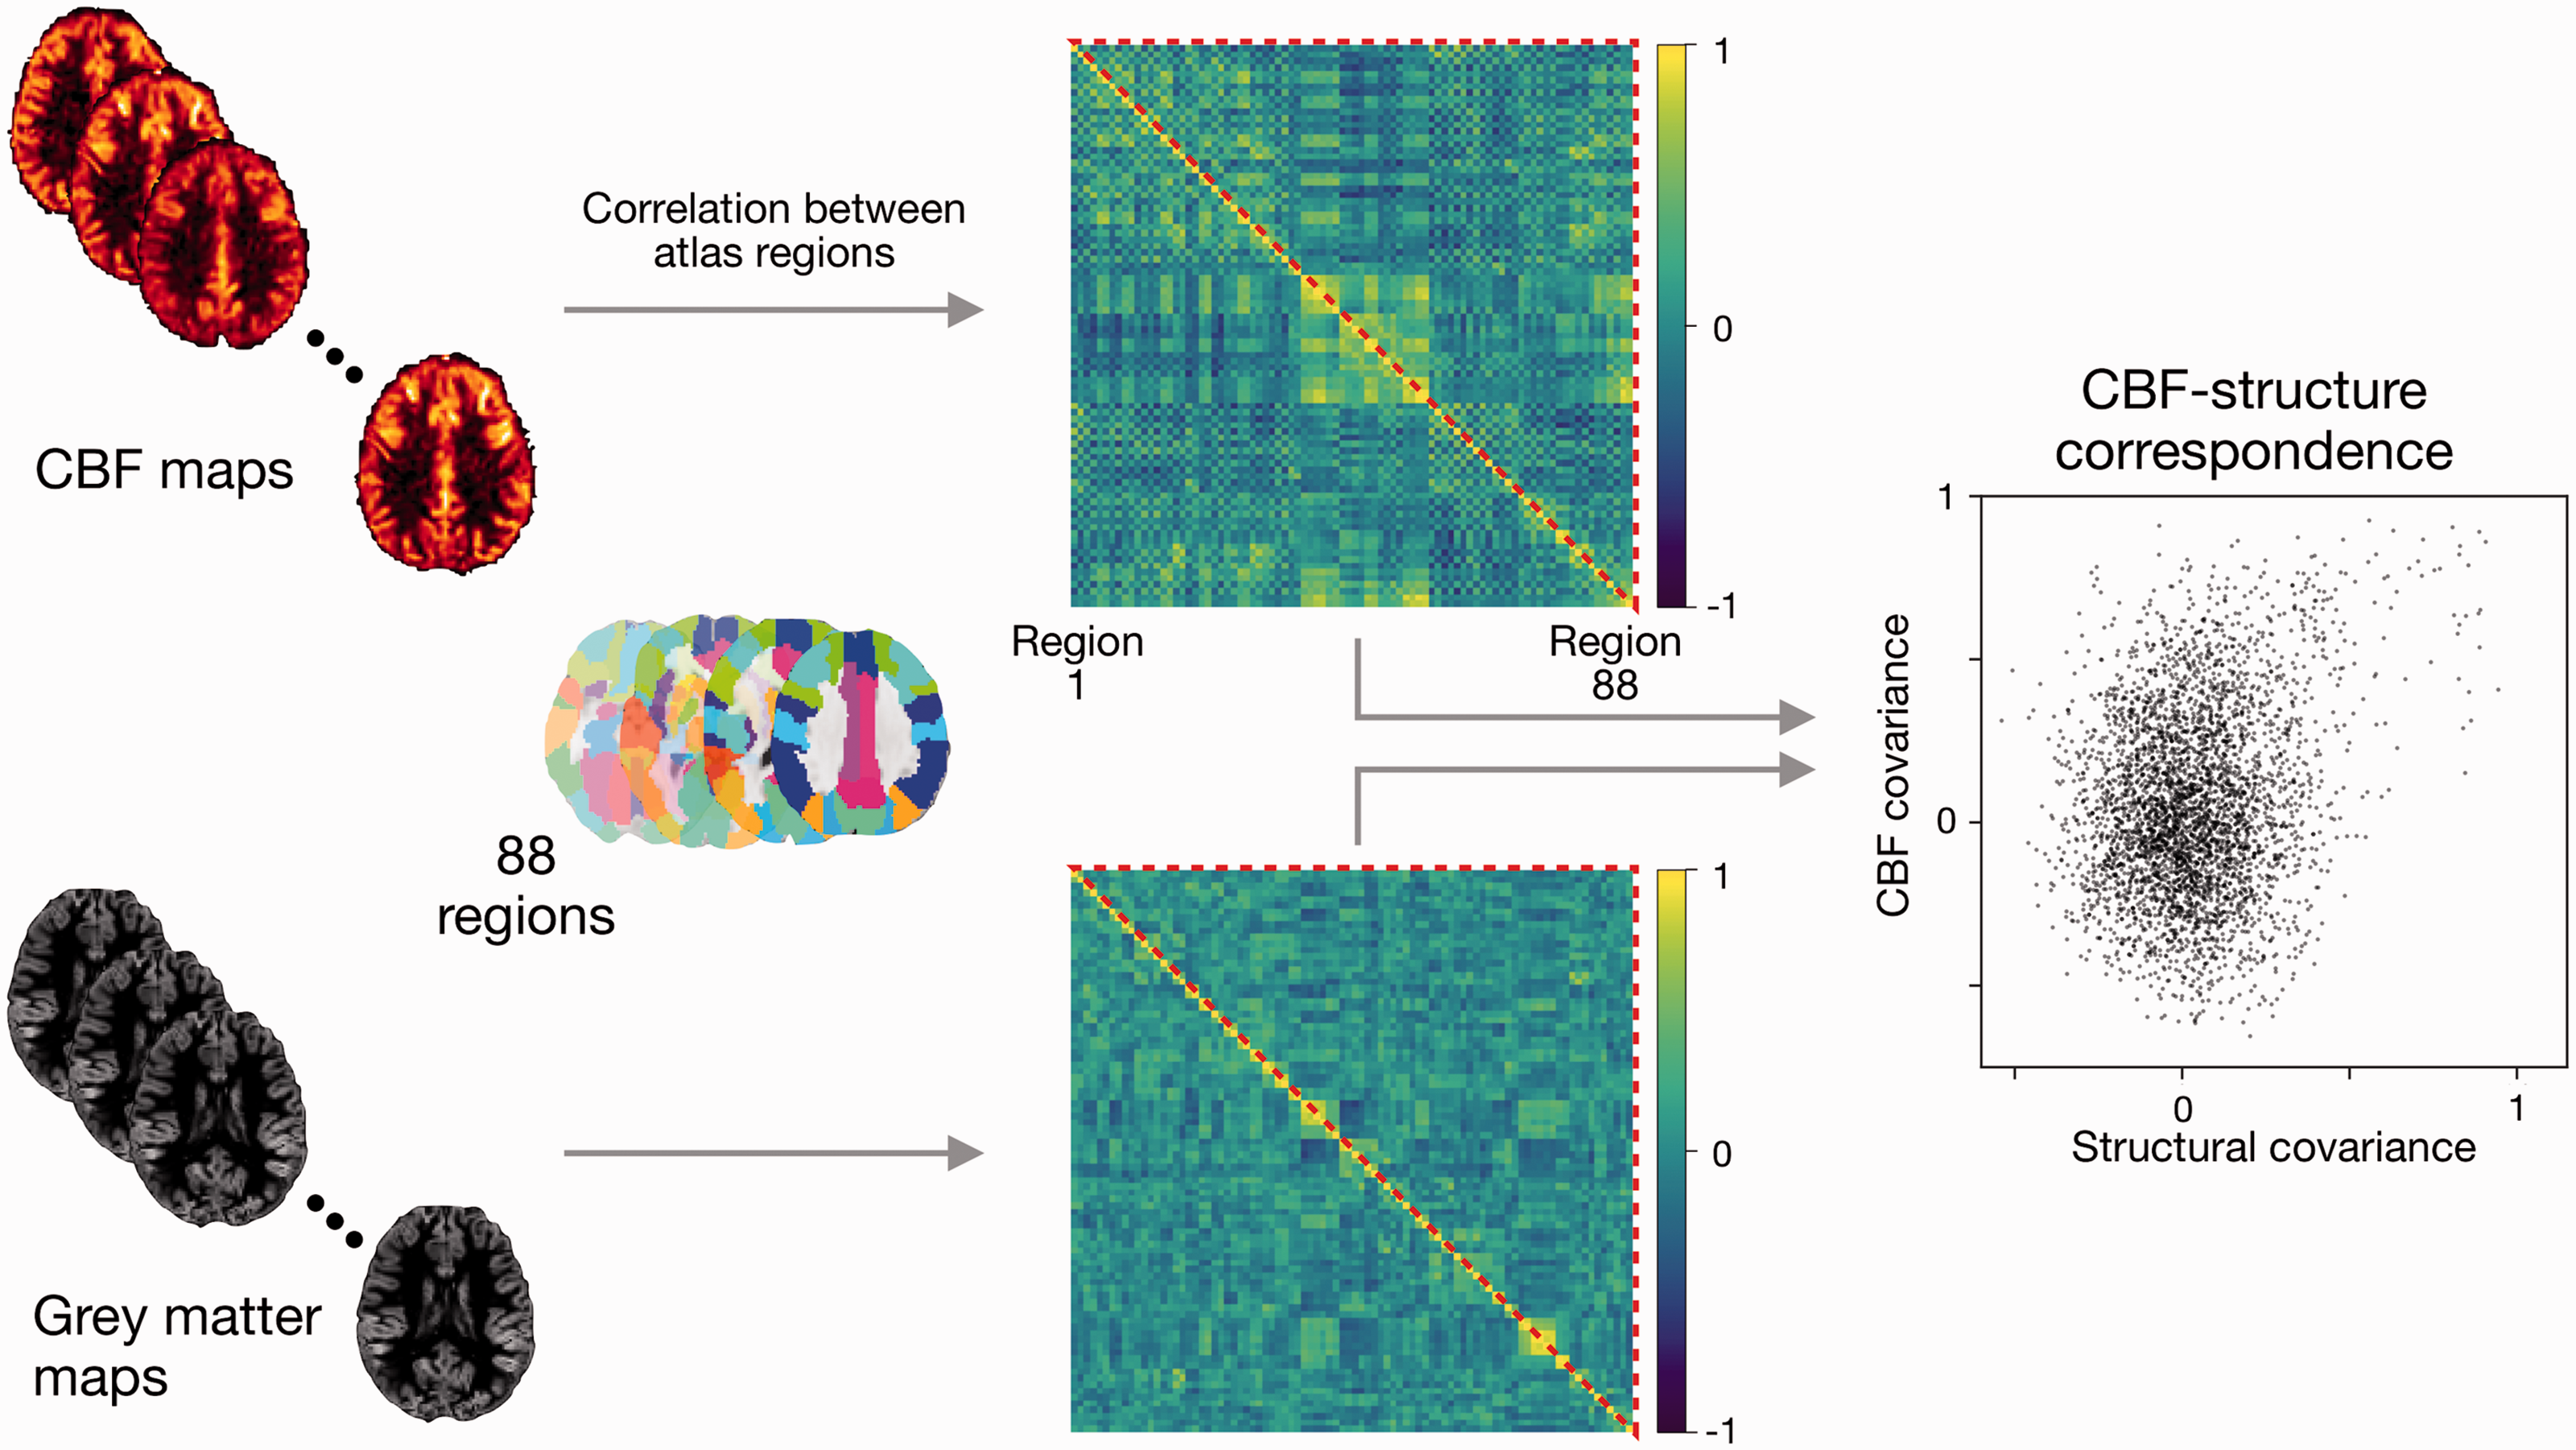
Schematic of covariance and CBF-structure correspondence estimation. Regional CBF and grey matter volume were calculated for 88 regions from the AAL atlas. Covariance maps were estimated by computing the correlation coefficient across individuals between all pairs of regions. CBF-structure correspondence was assessed through the correlation of all CBF covariance elements with all structural covariance elements (all elements
Regions of interest were chosen from the Automated Anatomical Labeling atlas (AAL). 38 From the list of AAL regions, 88 were selected based on the anatomical coverage of our ASL scans (i.e. cerebellum and two regions in the temporal pole were excluded). The intensity of the voxels within each region mask were averaged to obtain 88 regional estimates. We estimated the covariance map by computing Pearson’s correlation coefficient between regions and across individuals within the group. This was performed for each pair of regions, resulting in a matrix of shape 88 × 88.
We applied hierarchical clustering to interpret and visualize relationships described by the CBF covariance map. We used Ward’s clustering method to find clusters based on agreement in regions’ CBF covariance pattern; hence the number of clusters is determined from the data and not specified a priori.
39
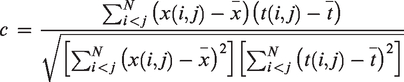
We used the cophenetic correlation coefficient to quantify how well the clustering represents the relationships described by CBF covariance (i.e. do regions with similar CBF covariance patterns belong to the same cluster?).
40
The cophenetic correlation is given by
Statistical analyses
Demographics
Difference in age between the two groups was assessed using a two-tailed t-test and α = 0.05. Normality of the age distribution of both groups was ensured using the Shapiro-Wilk test.
Differences in sex and race between the two groups was assessed using
Global CBF differences between groups
Difference in global CBF estimates between the two groups was assessed using a two-tailed t-test and α = 0.05. Normality of the CBF distribution of both groups was ensured using the Shapiro-Wilk test.
Comparison of CBF and structural covariance patterns
Atlas-wide correspondence between CBF covariance and structural covariance was quantified by the correlation coefficient across all elements of the covariance matrices. As above, we performed this calculation for healthy control and bipolar disorder groups separately. This approach results in a single coefficient describing the similarity between the CBF and structural covariance patterns of all atlas regions; we assessed the level of statistical significance of this correlation using the two-tailed Mantel permutation test with 10,000 permutations and α = 0.05. 41 We also tested for a group difference in this CBF-structure correspondence. We estimated the null distribution of group differences by permuting group membership, re-computing covariance maps, and calculating the group difference in CBF-structure correspondence (10,000 permutations), thus yielding a null distribution for statistical comparison. We carried out this comparison in a two-tailed fashion, using α = 0.05.
Lobe-specific correspondence between CBF covariance and structural covariance was also quantified. We stratified the 88 AAL regions by their membership in six lobar level groups: frontal lobe, parietal lobe, occipital lobe, temporal lobe, limbic lobe, and non-limbic sub-lobar regions. CBF-structure correspondence and the associated group differences were estimated for each of these lobes using the procedure described in the preceding paragraph and controlling the false discovery rate (FDR) at 0.05.
Group comparison of covariance patterns
We tested for group differences in each individual element of the covariance maps, for CBF and structural covariances separately. We first converted correlation coefficients to z-scores using the Fisher transformation: z = arctanh(r). Normality of z-scores was verified by estimating the distribution of each z-score through bootstrapped samples of CBF values; the Shapiro-Wilk test was employed to verify normality of the resultant distributions. A difference Z-statistic, Z-diff, was then calculated from the difference of bipolar disorder and healthy control z-scores. The two-tailed significance of each Z-diff was assessed after controlling the FDR at 0.05.
Evaluation of atlas choice
To qualitatively contrast the AAL atlas and reproduce results, we calculated CBF and structural covariances using an alternative parcellation, the Shen parcellation, based on functional data. 42 We included 193 regions that overlapped with the spatial coverage of our ASL scans. As before, we applied hierarchical clustering to the CBF covariance data, and evaluated atlas-wide CBF-structure correspondence.
Evaluation of partial volume effects
The voxel size of the CBF images is larger than the average thickness of cortical grey matter, which can contribute to partial volume effects that can bias regional CBF estimates. 43 To investigate partial volume effects, we re-calculated CBF using a regression algorithm that accounts for partial volume error, wherein the intensity of each voxel is modelled as the sum of the signal contribution from each tissue type. 43 The specific implementation of this algorithm was obtained from the ExploreASL software package. 44 The covariance analysis was executed anew using these adjusted CBF values, in which we applied hierarchical clustering, and evaluated atlas-wide CBF-structure correspondence, as above.
Data availability
Covariance maps estimated using the AAL atlas are available at https://github.com/nluciw/CBF-covariance_in_adolescence. Also available is the post-processing code used to produce the primary results supported by these maps.
Results
Global CBF in the healthy control and bipolar disorder groups
Whole-brain CBF in the HC group was CBFglobal = 62.3 ml/100g/min (partial-volume corrected: CBFglobal = 63.1 ml/100g/min) and in the BD group was CBFglobal = 66.7 ml/100g/(partial-volume corrected: CBFglobal = 67.7 ml/100g/min). For both pairs of global CBF estimates (without/with partial volume correction), a two-tailed independent t-test revealed significantly higher CBFglobal in the BD group relative to the HC group (p = 0.039; pPVC = 0.035).
Organization of CBF covariance in the healthy control group
The organization of CBF covariance in the healthy control group is shown Figure 2(a) (upper triangle). The ordering of rows and columns is based on hierarchical clustering. The dendrogram is a visualization of the clustering results, showing three main clusters that branch further to smaller sets of regions (Figure 2(b)). The three clusters delineate the left hemisphere, the right hemisphere, and inferior regions (Figure 2(c)). The hierarchical clustering effectively captured the underlying CBF covariance patterns, indicated by a high cophenetic correlation coefficient of c = 0.72. On average, the regions of the three clusters showed positive intra-cluster CBF covariance and negative inter-cluster CBF covariance (Supplementary Table 1).
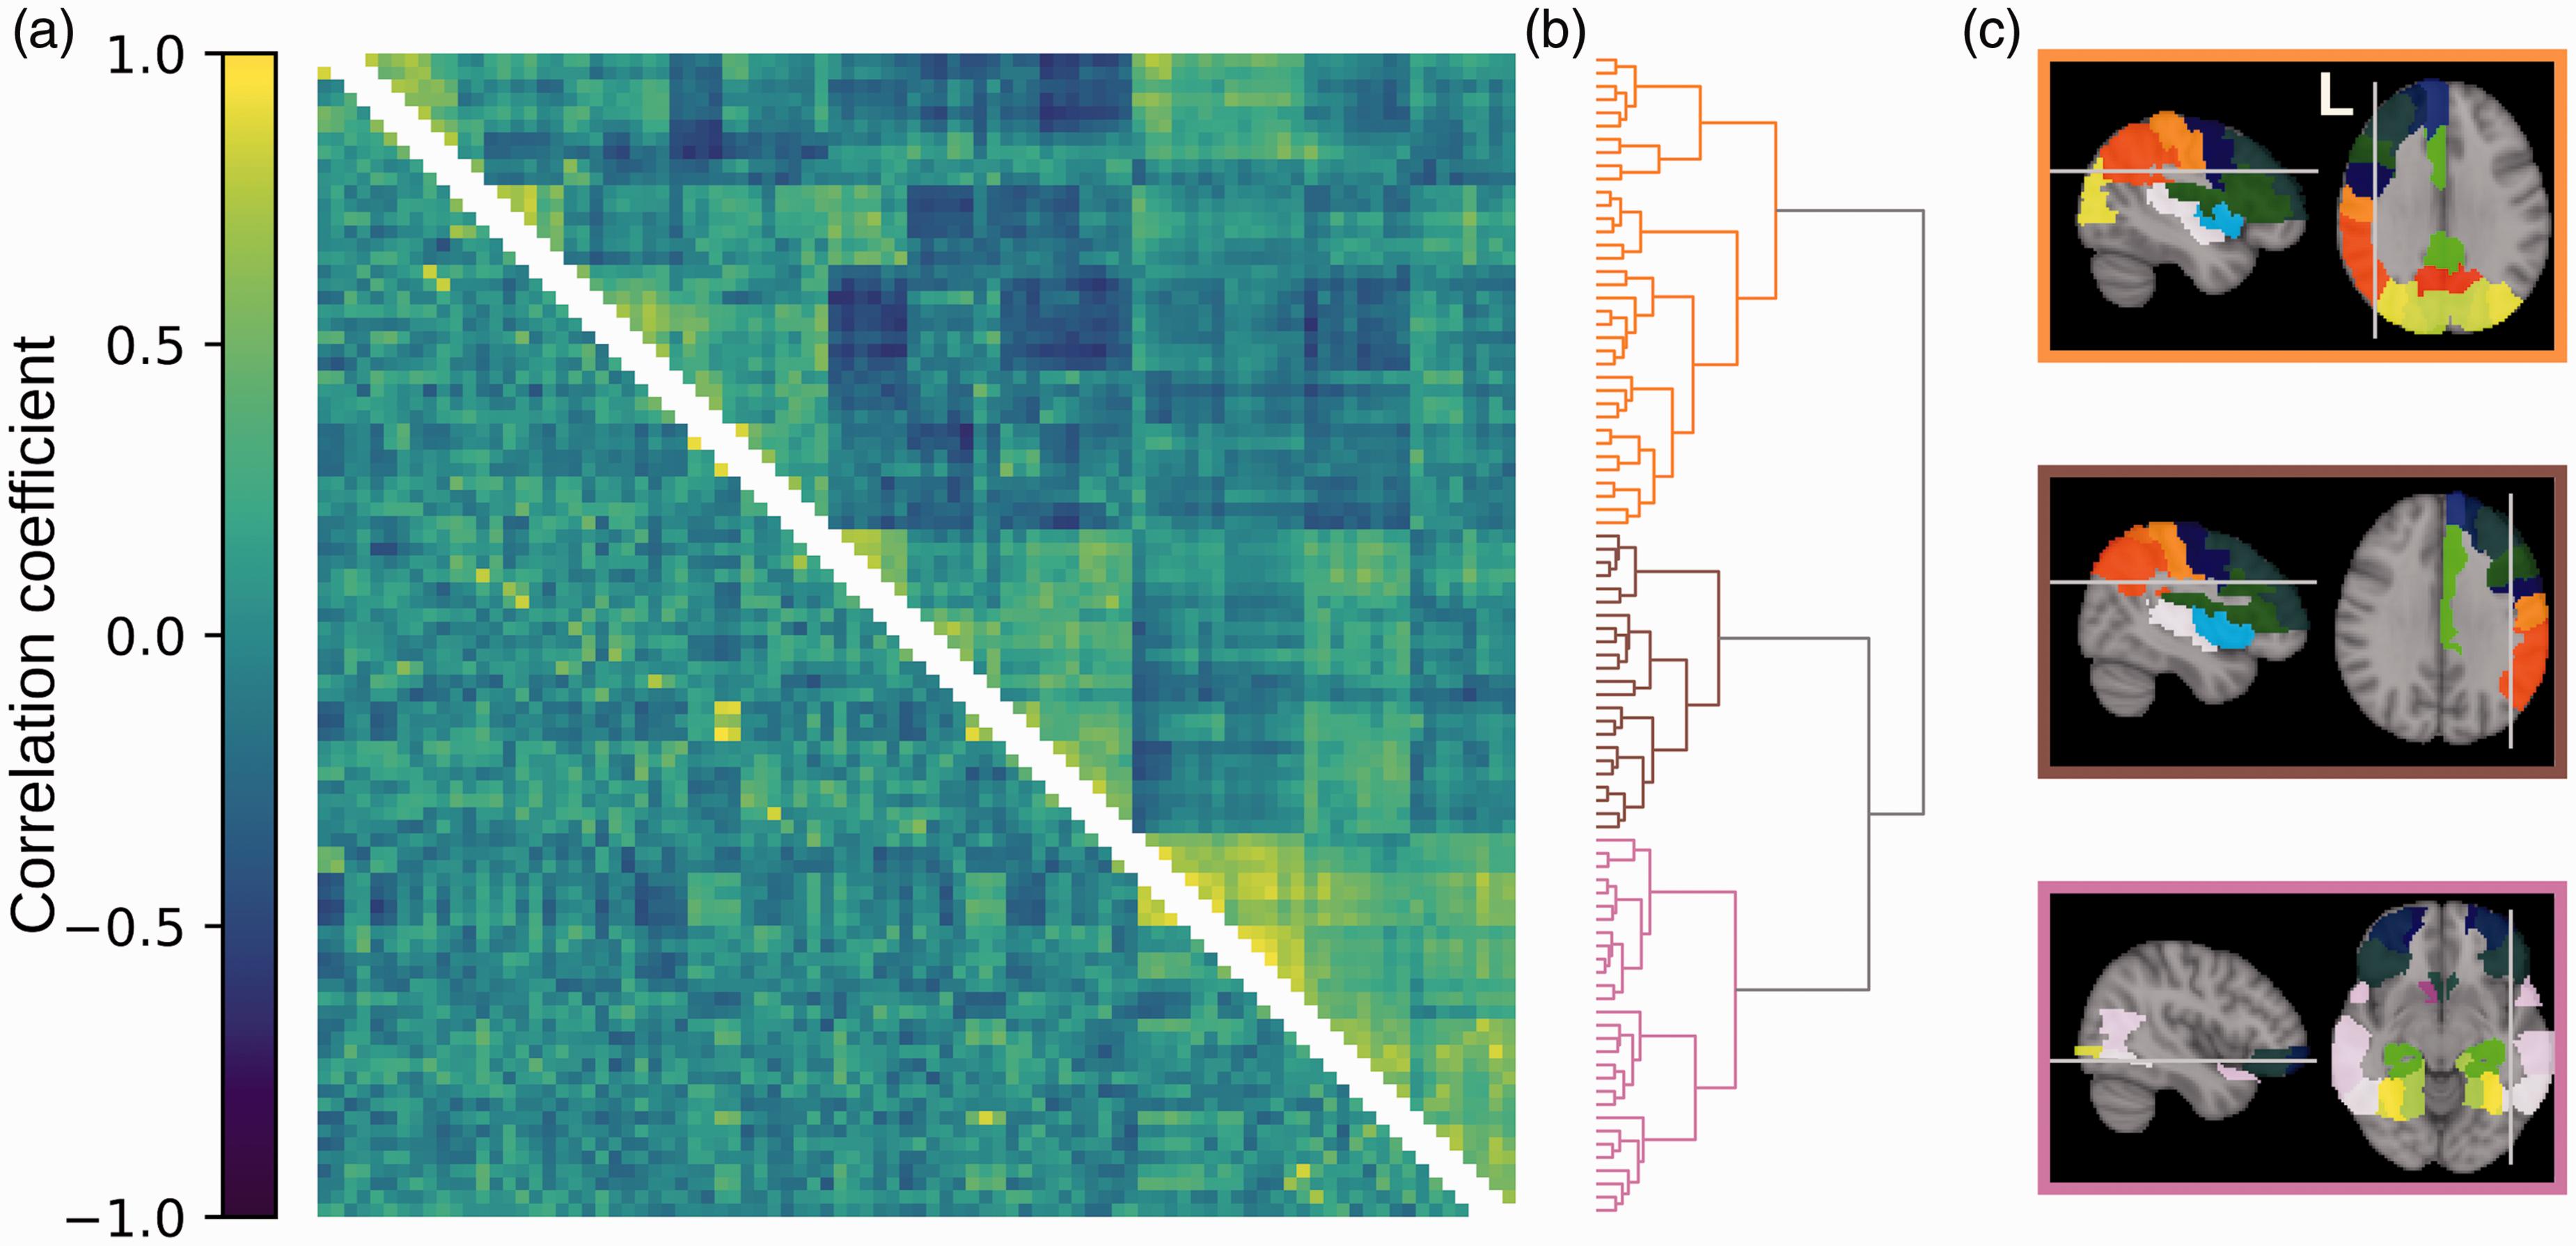
Organization of CBF and structural covariances in healthy adolescents. (a) CBF covariance (upper triangle) and structural covariance (lower triangle). Rows and columns represent regions in the AAL atlas and are ordered to align with the clustering dendrogram on the right. Colours represent Pearson’s correlation coefficient, shown in the colour bar on the left. (b) Dendrogram representing the clustering of CBF covariance. Each branch on the left represents a brain region. Proximity of branches represents similarity between regions. (c) Brain regions belonging to the three clusters defined by the tree. Colours of brain regions delineate atlas region borders and indicate homologous regions but are otherwise arbitrary. Colours of panel borders indicate the regions’ corresponding cluster in the dendrogram.
CBF-structure correspondence in the healthy control group
The structural covariance map from the healthy control group is shown in Figure 2(a) (lower triangle). There was a significant element-wise correlation between atlas-wide CBF and structural covariances, reflecting a small correspondence (r = 0.20, Mantel permutation test p < 0.0001; Figure 3(a)). Additionally, after stratifying CBF and structural covariances by lobe, we observed significant (FDR = 0.05) CBF-structure correspondence in the frontal lobe (p = 0.0001), the parietal lobe (p = 0.0011), the temporal lobe (p < 0.0001), the limbic lobe (p = 0.0026), and in sub-lobar regions (p = 0.0055); this result is shown in Figure 3(c) (blue line).
Correspondence between CBF and structural covariances. Correspondence is defined by r ≡ Pearson’s correlation coefficient between CBF and structural covariances. (a) Atlas-wide CBF-structure correspondence in healthy controls (r = 0.20). Axis values are unitless correlation coefficients. (b) Atlas-wide CBF-structure correspondence in bipolar disorder participants (r = 0.36). CBF-structure correspondence is significantly higher in bipolar disorder (permutation test p = 0.0028). (c) Lobe-specific CBF-structure correspondence for both healthy controls (blue) and bipolar disorder (orange). Correspondence is given by the radial distance from the centre. *Significant group difference after FDR control (p = 0.0003). †Significant group difference before FDR control (p = 0.0273).
Organization of CBF covariance in the bipolar disorder group
The organization of CBF covariance in the bipolar disorder group is shown in Supplementary Figure 1(a) (upper triangle). Hierarchical clustering revealed four clusters that delineate the left hemisphere, the right hemisphere, anterior inferior regions, and posterior inferior regions (Supplementary Figure 1(c)). This clustering was moderately effective at capturing the underlying CBF covariance patterns, indicated by a cophenetic correlation coefficient of c = 0.62.
CBF-structure correspondence in the bipolar disorder group
The structural covariance map from the bipolar disorder group is shown in Supplementary Figure 1(a) (lower triangle). There was a significant element-wise correlation between atlas-wide CBF and structural covariances, reflecting a moderate correspondence (r = 0.36, Mantel permutation test p < 0.0001; Figure 3(b)). This CBF-structure correspondence was significantly higher than in the healthy control group (permutation-based p = 0.0028).
Stratified by lobe, there was significant (FDR < 0.05) CBF-structure correspondence in the frontal lobe (p < 0.0001), the parietal lobe (p = 0.0001), the temporal lobe (p = 0.0001), the occipital lobe (p = 0.0001), the limbic lobe (p < 0.0001), and in sub-lobar regions (p = 0.0002); these results are shown in Figure 3(c) (orange line). CBF-structure correspondence was significantly higher than in the healthy control group in the occipital lobe (p = 0.0003; significant after FDR control) and in the frontal lobe (p = 0.0273; significant before FDR control).
Group by covariance interactions separately for CBF and structure
In the group comparison of CBF covariance between every pair of regions, the bipolar disorder group exhibited significantly lower CBF covariance between the left angular gyrus and the left pre-central gyrus (Z = −4.28, two-tailed p = 1.89 × 10⁻⁵), and between the left angular gyrus and the left post-central gyrus (Z = −4.93, two-tailed p = 8.27 × 10⁻⁷). Post-hoc evaluation of these results revealed, in both pairs of regions, positive CBF covariance in the healthy control group and a near-zero CBF covariance in the bipolar disorder group. These relationships are shown in Figure 4. Figure 4 also indicates which participants were positive for current second-generation antipsychotic use at the time of the study.
Significant differences in CBF covariance between healthy control (blue markers) and bipolar disorder (orange markers) groups. Between both pairs of regions, the bipolar disorder group exhibited lower CBF covariance compared to the healthy control group. All axes are in units of CBF relative to mean global CBF. Solid lines are linear regression model fits. Translucent bands are 95% confidence intervals. Insets show the location of the left angular gyrus (grey) and the left pre-/post-central gyrus (black) in the AAL atlas. (N.B. the choice of regions on the horizontal and vertical axes was arbitrary). Circles/triangles denote participants without/with current second-generation antipsychotic use. HC=healthy control. BD=bipolar disorder.
There were no between-group differences in structural covariance (after FDR control at 0.05).
Covariance patterns estimated using the Shen parcellation
CBF covariance based on the Shen parcellation is shown in Supplementary Figures 2 and 3 for healthy control and bipolar disorder groups, respectively. The Shen parcellation is based on functional connectivity and includes more, smaller regions relative to the AAL atlas. These graphs show a similar clustering pattern to the AAL-based analysis in both healthy control and bipolar disorder groups. The atlas-wide correspondence between CBF and structural covariances is shown in Supplementary Figure 4. Consistent with the AAL-based analysis, we observed higher correspondence in bipolar disorder (r = 0.25, Mantel permutation test p < 0.0001) compared to healthy adolescents (r = 0.14, Mantel permutation test p < 0.0001; permutation test for group difference p = 0.0014).
Covariance patterns estimated using partial-volume-corrected CBF
CBF covariance based on partial-volume-corrected CBF is shown for the healthy control group in Supplementary Figure 5. The clustering pattern was almost identical to the original shown in Figure 2, with three clusters delineating the left hemisphere, the right hemisphere, and inferior regions. The atlas-wide correspondence between partial-volume-corrected CBF and structural covariances is shown in Supplementary Figure 6. Consistent with the original analysis, we observed higher correspondence in bipolar disorder (r = 0.40, Mantel permutation test p < 0.0001) compared to healthy adolescents (r = 0.22, Mantel permutation test p < 0.0001; permutation test for group difference p = 0.0018).
Discussion
In this study, we first performed an atlas-wide analysis of region-to-region covariance, of both CBF and grey matter volume. Through hierarchical clustering, we discovered CBF covariance organization that was largely consistent between healthy control and bipolar disorder groups. Second, we evaluated the correspondence between CBF and structural covariances; CBF-structure agreement was evident in both groups but was of significantly greater magnitude in the bipolar disorder group. Finally, we observed lower CBF covariance in bipolar disorder relative to healthy controls in two pairs of regions: the left angular gyrus and the left pre-central gyrus, and the left angular gyrus and the left post-central gyrus. We observed no differences in structural covariance between healthy controls and bipolar disorder participants. We reported differences in whole-brain CBF between the two participant groups, consistent with a previous report of whole grey-matter CBF differences in a similar cohort. 45
The hierarchical clustering of CBF covariance in healthy adolescents yielded three main spatial clusters (left hemisphere, right hemisphere, and inferior brain regions). The three clusters are spatially reminiscent of the brain’s vascular territories, 46 with the caveat that the inferior CBF cluster included both posterior circulation regions, such as the occipital lobe, and anterior circulation regions, such as those in inferior frontal and temporal lobes. Zhu et al. also report an intra-hemispheric CBF (using ASL MRI) covariance pattern in 94 healthy adults. 5 In contrast, Melie-García et al. report higher inter-hemispheric CBF (albeit using single-photon emission computed tomography [SPECT]) covariance for homologous brain regions in 30 healthy adults. 4 This is evidence that CBF covariance in healthy adolescents is, at least in part, driven by shared variance based on vascular physiology and physical distance.
The clustering of CBF covariance in bipolar disorder revealed four clusters, also reminiscent of the brain’s vascular territories. Much like CBF covariance in the control group, the clusters delineate left hemisphere, right hemisphere, and inferior brain regions. Unlike in the control group, inferior brain regions were described by two clusters, anterior and posterior, possibly corresponding to the anterior and posterior cerebral circulation. This is evidence that CBF covariance in adolescent bipolar disorder is also, at least in part, driven by shared variance based on vascular physiology.
In the healthy control group, there was a significant but modest correspondence between atlas-wide CBF and structural covariances, indicated by a low correlation coefficient. A modest CBF-structure association is consistent with our speculation that CBF covariance partly reflects organization of vascular territories; structural covariance is distance-dependent and is thought to stem from coordinated maturational growth between regions,11,12 which does not necessarily align with flow territories of the brain. In contrast, we observed a statistically greater correspondence between atlas-wide CBF and structural covariances in participants with bipolar disorder. At the lobar level, this difference was punctuated by observations of bipolar disorder-related increases in occipital and frontal CBF-structure correspondence. Such increases may be reflective of coincident abnormal CBF and structure observed in later stages of bipolar disorder,18,19 although the occipital lobe is not prominent in bipolar disorder pathophysiology. Increased correspondence between functional and structural networks are also observed in other disorders such as schizophrenia and epilepsy.47,48
Lastly, we contrasted the CBF covariance patterns by group (i.e. effectively tested for interaction effects) and found two differences, both implicating the left angular gyrus and the sensorimotor cortex (i.e. left pre- and post-central gyri). The former is a part of the default mode network, while the latter regions are a part of the sensorimotor network. These networks are reported in the bipolar disorder literature; the relative activity between the two networks is thought to fluctuate with mood state, with the default mode network favoured during depression and the sensorimotor network favoured during mania. 49 Reduced integration between the two networks has also been observed in euthymic (i.e. not during a mood episode) individuals. 50 Mood state can also introduce variability in regional metabolism or CBF within a bipolar disorder sample, evidenced in imaging studies of adult bipolar disorder.19,51 Additionally, CBF levels in adolescent bipolar disorder are known to vary according to mood state. 52 Therefore, lower CBF covariance between the angular gyrus and the pre-/post-central gyri may reflect reduced functional connectivity between the pairs of regions, or inconsistent functional associations resulting from fluctuating CBF levels across the included depressive, euthymic, and hypomanic participants. The current study likely benefitted from the within-group between-participant variability; however, characterizing mood states as potential drivers of the covariation patterns is beyond the scope of the current work and more research is needed on this topic.
Overall, we find increased CBF-structure correspondence in bipolar disorder, and locally altered CBF covariance in bipolar disorder that is not reflected by neuroanatomy. Taken together, it may be altered CBF, rather than altered grey matter volume, that underlies this increased CBF-structure coupling. This speculation is supported by the preliminary evidence suggesting changes in CBF precede changes in grey matter structure during the course of bipolar disorder. 53 Therefore, reduced CBF covariance may indicate bipolar disorder leads to less dynamic brain function and subsequently inter-individual CBF variability that is more closely related to the underlying anatomy. Alternatively, we may have failed to observe group differences in structural covariance due to small effect sizes and correction for many statistical comparisons; the effect size of CBF covariance differences could simply be higher than structural covariance differences, and changes in both covariances contribute to increased coupling, despite structural covariance differences going statistically undetected. In this case, the increased coupling may be indicative of the anomalies in both cerebral structure and blood flow observed in bipolar disorder, which partly coincide in the frontal lobe.18,19
There are some limitations of this study. First, neuroimaging network analyses may be influenced by the parcellation procedure 54 ; we evaluated results between the AAL atlas and the Shen parcellation and found satisfactory agreement. Second, ASL MRI estimates of CBF can be biased by partial volume effects, which is especially pertinent when relating CBF and structural imaging. We observed similar results in the repeated analysis with partial-volume-corrected CBF estimates, suggesting partial volume effects do not drive our results. Third, we do not control for mood state or medication of our bipolar disorder participants in the case-control analyses. Visually, Figure 4 does not suggest use of second-generation antipsychotics is related to CBF covariance differences in bipolar disorder, however, future studies are warranted to evaluate mood-related and medication-related changes in the CBF and structural covariance phenotypes. Finally, we cannot disentangle the various sources influencing the CBF covariance patterns, which include neuronal, physiological, and imaging factors, among others. Focusing on the ASL pulse sequence parameters or controlling for physiological variations in arterial transit time are examples of future work that can further refine CBF covariance analysis and improve generalizability.
In conclusion, this study provides new insight into CBF covariance of both healthy adolescents and those with bipolar disorder, and into its relationship with structural covariance. We report intra-hemispheric CBF covariance patterns, potentially linked to arterial flow territories. Comparing CBF to structural covariance, we saw low, but significant, correspondence in healthy adolescents and significantly greater correspondence in adolescents with bipolar disorder. Finally, relative to healthy controls, we observe locally reduced CBF covariance in bipolar disorder. CBF imaging produces patterns of covariation that are distinct and complementary to structural covariance, despite the similar contrast of CBF and T1w images. These results point to CBF covariance as a valuable source of information on the organization of brain function. Future studies can benefit from combining regional and covariance analysis to interrogate multiple dimensions of brain physiology, in both health and disease.
Supplemental Material
sj-pdf-1-jcb-10.1177_0271678X21989246 - Supplemental material for Correspondence between patterns of cerebral blood flow and structure in adolescents with and without bipolar disorder
Supplemental material, sj-pdf-1-jcb-10.1177_0271678X21989246 for Correspondence between patterns of cerebral blood flow and structure in adolescents with and without bipolar disorder by Nicholas J Luciw, Simina Toma, Benjamin I Goldstein and Bradley J MacIntosh in Journal of Cerebral Blood Flow & Metabolism
Footnotes
Funding
The author(s) disclosed receipt of the following financial support for the research, authorship, and/or publication of this article: support from the Ontario Mental Health Foundation. Dr. MacIntosh is supported by a Brain and Behavior Foundation Independent Investigator award.
Declaration of conflicting interests
The author(s) declared no potential conflicts of interest with respect to the research, authorship, and/or publication of this article.
Authors’ contributions
Conception and design: NJL, BJM. Data collection: ST, BIG, BJM. Analysis and interpretation: NJL, BJM. Manuscript writing: NJL, BJM. Manuscript revision: NJL, ST, BIG, BJM. All authors approve the final version of this manuscript.
Acknowledgements
The authors wish to thank the individuals and their guardians for participating in this study. Additional thanks to the staff at the Centre for Youth Bipolar Disorder in Toronto, Canada. MRI was skillfully performed by Garry Detzler and Ruby Endre.
References
Supplementary Material
Please find the following supplemental material available below.
For Open Access articles published under a Creative Commons License, all supplemental material carries the same license as the article it is associated with.
For non-Open Access articles published, all supplemental material carries a non-exclusive license, and permission requests for re-use of supplemental material or any part of supplemental material shall be sent directly to the copyright owner as specified in the copyright notice associated with the article.