
Abstract
Prominence of cerebral veins using susceptibility weighted magnetic resonance imaging (SWI) has been used as a qualitative indicator of cerebral venous oxygenation (CvO2). Quantitative susceptibility mapping (QSM) adds more precision to the assessment of CvO2, but has not been applied to neonatal hypoxic ischemic injury (HII). We proposed to study QSM measures of venous susceptibility and their correlation with direct measures of brain oxygenation and cerebral blood flow (CBF) in the neonatal piglet. The association of QSM intravascular cerebral venous susceptibility, with brain tissue O2 tension, CBF, cortical tissue oxyhemoglobin saturation, and the partial pressure of oxygen in arterial blood measurement during various oxygenation states was determined by linear regression. Compared to normoxia, venous susceptibility in the straight sinus increased 56.8 ± 25.4% during hypoxia, while decreasing during hyperoxia (23.5 ± 32.9%) and hypercapnia (23.3 ± 73.1%), which was highly correlated to all other measures of oxygenation (p < 0.0001) but did not correlate to CBF (p = 0.82). These findings demonstrate a strong relationship between venous susceptibility and brain tissue O2 tension. Our results suggest that QSM-derived venous susceptibility is sensitive to cerebral oxygenation status across various oxygenation states.
Keywords
Introduction
HII is an important cause of perinatal mortality and long-term neurological disability. 1 At present, whole-body hypothermia therapy, the only approved therapy for neonatal HII, fails to prevent long term neurological deficits in one-third to one-half of infants treated.2,3 Thus, there is a continued need to identify additional prognostic biomarkers and therapeutic targets, and to leverage these findings to evaluate new treatment strategies.
While structural magnetic resonance imaging (MRI), diffusion weighted imaging (DWI), perfusion weighted imaging, and magnetic resonance spectroscopy (MRS) can identify injured brain tissue,4–14 these assessments do not reflect the state of cerebral oxygenation, which is a predictor of cell survival. 15 Susceptibility weighted imaging (SWI) is a high-resolution gradient echo T2* weighted imaging technique that is sensitive to the subtle differences in the paramagnetic properties of oxygenated versus deoxygenated hemoglobin and can indirectly visualize differences in the ratio of oxygenated versus deoxygenated blood within vessels.16–19
Under hypoxic conditions deoxyhemoglobin concentrations in the cerebral veins rise due to increased O2 extraction, resulting in decreased signal intensity and intense dark signal (blooming/susceptibility artifact) from the paramagnetic properties in the deoxygenated hemoglobin, which highlights the veins on SWI images. In neonates, an increase in the prominence of veins (POV) has been reported following HII,20–22 with the authors developing categorical grading scales to determine the relationship between the POV and severity of disease 22 or outcomes, 20 which showed neonates with increase in POV had poor neurological outcomes. 20 Although the relationship between T2* and arterial and venous O2 saturation has been validated,23,24 POV grading scores are qualitative and thus cannot be correlated precisely with venous O2 saturation. The recent development of quantitative susceptibility mapping (QSM) has addressed this limitation and can be used to quantify the underlying magnetic susceptibility of each voxel as a scalar value.
In the neonatal HII population, QSM has significant potential as an accurate, non-invasive measure of tissue oxygenation. However studies validating a change in vein prominence against a direct measure of brain tissue PO2 are limited. To better define a role for venous susceptibility measurements following clinical HII there is a need to characterize the correlation between QSM and brain tissue oxygenation in a translational model of neonatal HII. The aims of this study were 1) to demonstrate the effect of controlled changes in brain blood flow and tissue oxygenation on the appearance of cerebral veins on T2* imaging, and 2) evaluate the use of QSM as a sensitive indicator of brain tissue oxygenation. These aims were accomplished in a neonatal piglet model by measuring the relationships between venous susceptibility, brain tissue PO2, cerebral blood flow (CBF), cortical tissue oxyhemoglobin saturation (SctO2) in the frontal lobe measured by near infrared spectroscopy (NIRS), and partial pressure of oxygen in arterial blood (PaO2) during four experimental states: hyperoxia, normoxia, hypoxia, and hypercapnia.
Material and methods
Piglet study
All experimental protocols were approved by Loma Linda University’s Institutional Animal Care and Use Committee following the guidelines outlined in the Guide for the Care and Use of Laboratory Animals from the National Institutes of Health. The animal data reporting of the current study has followed the ARRIVE 2.0 guideline. 25
Male (n = 7) and female (n = 3) Domestic (Yorkshire/Landrace hybrid) neonatal piglets (6 ± 0.9 days old and average weight 3.1 ± 0.5 kg) were sedated with telazol (4 mg/kg IM) and buprenex (0.01 mg/kg IM) and anesthetized with isoflurane (3% induction, 1.5% maintenance). Piglets were orally intubated and ventilated mechanically. The right femoral vein and artery were catheterized for monitoring arterial blood pressure and measuring arterial blood gases, pH, lactate and glucose concentrations. Animals were instrumented with an MRI-compatible composite laser Doppler flowmetry (LDF) and PO2 probe (∼0.4 mm in diameter; PO2/flow bare-fiber sensor (NX-BF/OF/E) Oxford Optronix, Oxford UK) for measurement of CBF and brain tissue PO2. The instrumentation method has been described previously, and validated against microsphere measurements of changes in cerebral blood flow in response to hypoxia, demonstrating that although the LDF probe only measures microvascular perfusion in a small ∼2 mm2 diameter hemisphere of tissue, the changes are representative of more global changes in brain blood flow. 26 After exposing the skull via a midline incision of the scalp by cautery, a burr hole was drilled in the skull approximately 0.5 cm lateral to midline and 0.5 cm anterior to bregma. The LDF/brain tissue PO2 probe was then inserted to a depth of ∼0.5 to 1.0 cm below the surface of the skull, where it was fixed to the skull with dental cement. More precise determination of the depth of the probe in the tissue was not possible due to variations in skull thickness and unseen locations of sulci beneath the skull. However, previous validation of this LDF methodology with microspheres has determined that relative changes in CBF are similar regardless of the position of the probe tip within the cortex. Core body temperature was maintained at 36.7 to 37.8 °C using a forced-air warming blanket (Bair Hugger, 3 M™). ECG heart rate (HR), end-tidal CO2, respiration rate, and peripheral SpO2 were continuously monitored (Philips Expression IP5 patient monitor, Orlando USA) and the mean arterial blood pressure (MABP), CBF, and brain tissue PO2 were recorded continuously throughout the imaging experiment (LabChart, v7.0 for macOS, ADInstruments, Grand Junction, CO). Recorded HR was derived online using a peak-detection algorithm applied to the arterial pressure signal (LabChart, v7.0). Arterial blood gases and lactate were measured using an iSTAT CG4+ point of care device (Abbot Laboratories, Abbott Park, USA) at each oxygenation state.
Experimental protocol
The study design is illustrated in Supplemental Figure 1. After instrumentation, and with continued mechanical ventilation and isoflurane, piglets were transported to the MRI scanner where they were placed in a prone position. A gas-mixing manifold with O2 analyzer was used to blend N2 and O2 in the mechanical ventilator to achieve the desired inspired O2 levels. Hyperoxia was administered by providing 100% inspired O2, while normoxia was at 21% inspired O2. Hypoxia was achieved by decreasing inspired O2 to target an arterial PO2 of 30 to 35 mmHg. Hypercapnia was achieved by decreasing minute ventilation while elevating inspired O2 to prevent hypoxia. Each oxygenation stage lasted approximately 30 minutes. To account for the possibility that the hypercapnia response was altered by the preceding hypoxic period, an additional three “control” animals underwent hyperoxia, normoxia, and hypercapnia without hypoxia.
MRI
MRI images were acquired on a 3T whole-body imager (PRISMA, Siemens Medical Solutions, Erlangen, Germany) using a 15-channel receive-only knee coil. Imaging included an isotropic 3D sagittal T1-weighted inversion prepared fast spoiled gradient echo sequence (MPRAGE; TR/TE = 1420/2.3 ms, number of excitations (NEX) = 2, voxel size 0.9 × 0.9 × 0.9 mm3) and SWI (TR/TE = 28/20 ms, flip angle = 15°, NEX = 3, voxel size 0.4 × 0.4 × 0.4 mm3). SWI was acquired during each oxygenation stage after the cerebral oxygenation state stabilized as indicated by stable SctO2 and brain tissue PO2 values.
Near-infrared spectroscopy (NIRS)
NIRS regional cortical oxygenation (SctO2) measurements were acquired using a Foresight (Casmed Irvine, CA) monitor with a neonatal probe placed on the scalp over the frontal cortex for 5 minutes immediately prior to the SWI acquisition in 4 animals that underwent hypoxia and 3 control animals. Continuous acquisition of NIRS data during the MRI was not possible due to artifacts produced by the presence of the sensor in the coil.
Image analysis
QSM is a widely used technique and has been previously reviewed in the literature.16,27–31 The following section contains only those details relevant to the present study. QSM images were created using STAGE software (SPINTECH, USA).32–34 Briefly, phase images were unwrapped using a guided 3 D phase unwrapping algorithm (3DSRNCP) 35 to reduce aliasing and help improve unwanted background field effects in areas where there are rapid phase changes, ie. near air/tissue interfaces such as the sinuses. A brain extraction tool (BET) 36 was used to generate the brain mask separating the brain from surrounding tissue (skull, neck) after adjustment using the phase imagine quality map 37 to remove regions with rapid phase changes. Masked and unwrapped phase images were processed using Sophisticated Harmonic Artifact Reduction of Phase data (SHARP 38 ) to remove the background field and QSM images generated using a truncated k-space division algorithm. 34 To optimize venous contrast, QSM venograms were created using a maximum intensity projection (MIP) performed over 32 sections with an effective slice thickness of 12.8 mm. Venous susceptibility at each oxygenation state was quantified using histogram analysis of the straight sinus (STS), right and left thalamostriate vien (THSV) (Figure 2) using SPIN software (SPINTECH, USA). Quantification of the area of the venous structures as a percent of total slice area was performed on a slice of the QSM MIP images using a statistical thresholding algorithm (ImageJ) to segment venous structures based on their contrast with the background brain tissue. First, the total area of brain tissue was selected and measured using a color thresholding algorithm. Next, color thresholding was adjusted to select and measure only the venous structures, which were expressed as a fraction of the total slice area. Study personnel who performed the thresholding were blinded to the oxygenation state of the brain at the time the MRI image was captured.
Data and statistical analysis
Results are presented as mean ± standard deviation. Statistical analysis was performed using GraphPad Prism (version 8; San Diego, USA) with findings considered significant at p < 0.05. LDF, measured in arbitrary units, was normalized to normoxia measurements. Due to wide inter-animal variation in the baseline values, brain tissue PO2 was also normalized to normoxia. Differences between oxygenation states were compared using one-way ANOVA with Tukey post-hoc correction. The relationships between venous susceptibility, brain tissue PO2, SctO2, CBF, and PaO2 were determined using linear regression with multiple intra-subject measurements.
Results
Piglet baseline data and physiology
The physiological variables monitored during the MRI experiments are shown in Table 1. The HR and MABP were comparable between oxygenation stages. During hypercapnia, the arterial pH was significantly reduced compared to all other conditions (p < 0.001). PaO2 was significantly reduced during hypoxia (p < 0.001) compared to normoxia; but increased during both hyperoxia and hypercapnia (p < 0.001) when compared to both normoxic and hypoxic conditions. As expected, PaCO2 and end-tidal CO2 significantly increased during hypercapnia (p < 0.001) but remained stable during hyperoxia, normoxia, and hypoxia. Arterial glucose levels were elevated during both hypoxia and hypercapnia, becoming significantly higher than normoxia only during hypoxia (p < 0.01). Arterial lactate levels did not differ between oxygenation states.
Mean (± standard deviation) physiological variables, blood gases, pH, and plasma glucose and lactate levels.
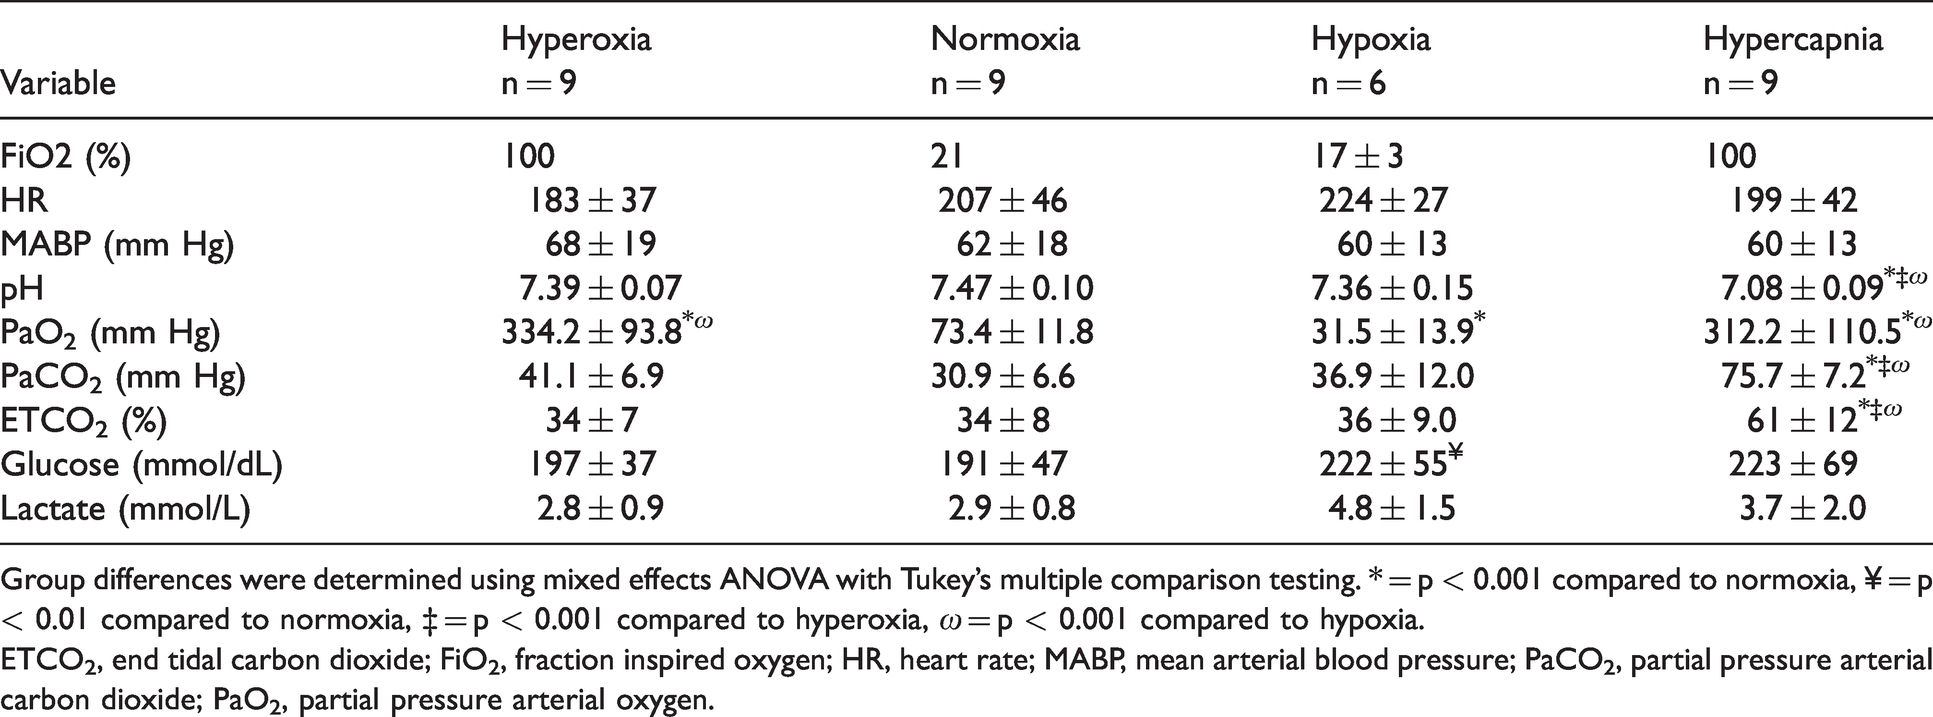
Group differences were determined using mixed effects ANOVA with Tukey’s multiple comparison testing. * = p < 0.001 compared to normoxia, ¥ = p < 0.01 compared to normoxia, ‡ = p < 0.001 compared to hyperoxia, ω = p < 0.001 compared to hypoxia.ETCO2, end tidal carbon dioxide; FiO2, fraction inspired oxygen; HR, heart rate; MABP, mean arterial blood pressure; PaCO2, partial pressure arterial carbon dioxide; PaO2, partial pressure arterial oxygen.
Piglet brain oxygenation, CBF, and peripheral O2 saturation
Relative to normoxia, CBF increased 49.5 ± 28.0% during hypoxia (p < 0.05) and 61.2 ± 31.0% during hypercapnia (p < 0.01), with no change during hyperoxia (Figure 1(a), Supplemental Figure 2). CBF was significantly higher during hypercapnia compared to hyperoxia (p < 0.01; Figure 1(a)). Brain tissue PO2 was decreased to 79 ± 15.4% of normoxic levels during hypoxia (p < 0.01). Brain tissue PO2 increased during hyperoxia (112 ± 64.8%; p < 0.01) and hypercapnia (346 ± 212%; p < 0.05) relative to normoxia (Figure 1(b); Supplemental Figure 2). Similarly, SctO2 and PaO2 were significantly reduced during hypoxia compared to all other oxygenation states (Figure 1(c) and (d)). Compared to normoxia, SctO2 increased during hypercapnia (p < 0.05; Figure 1(c)).
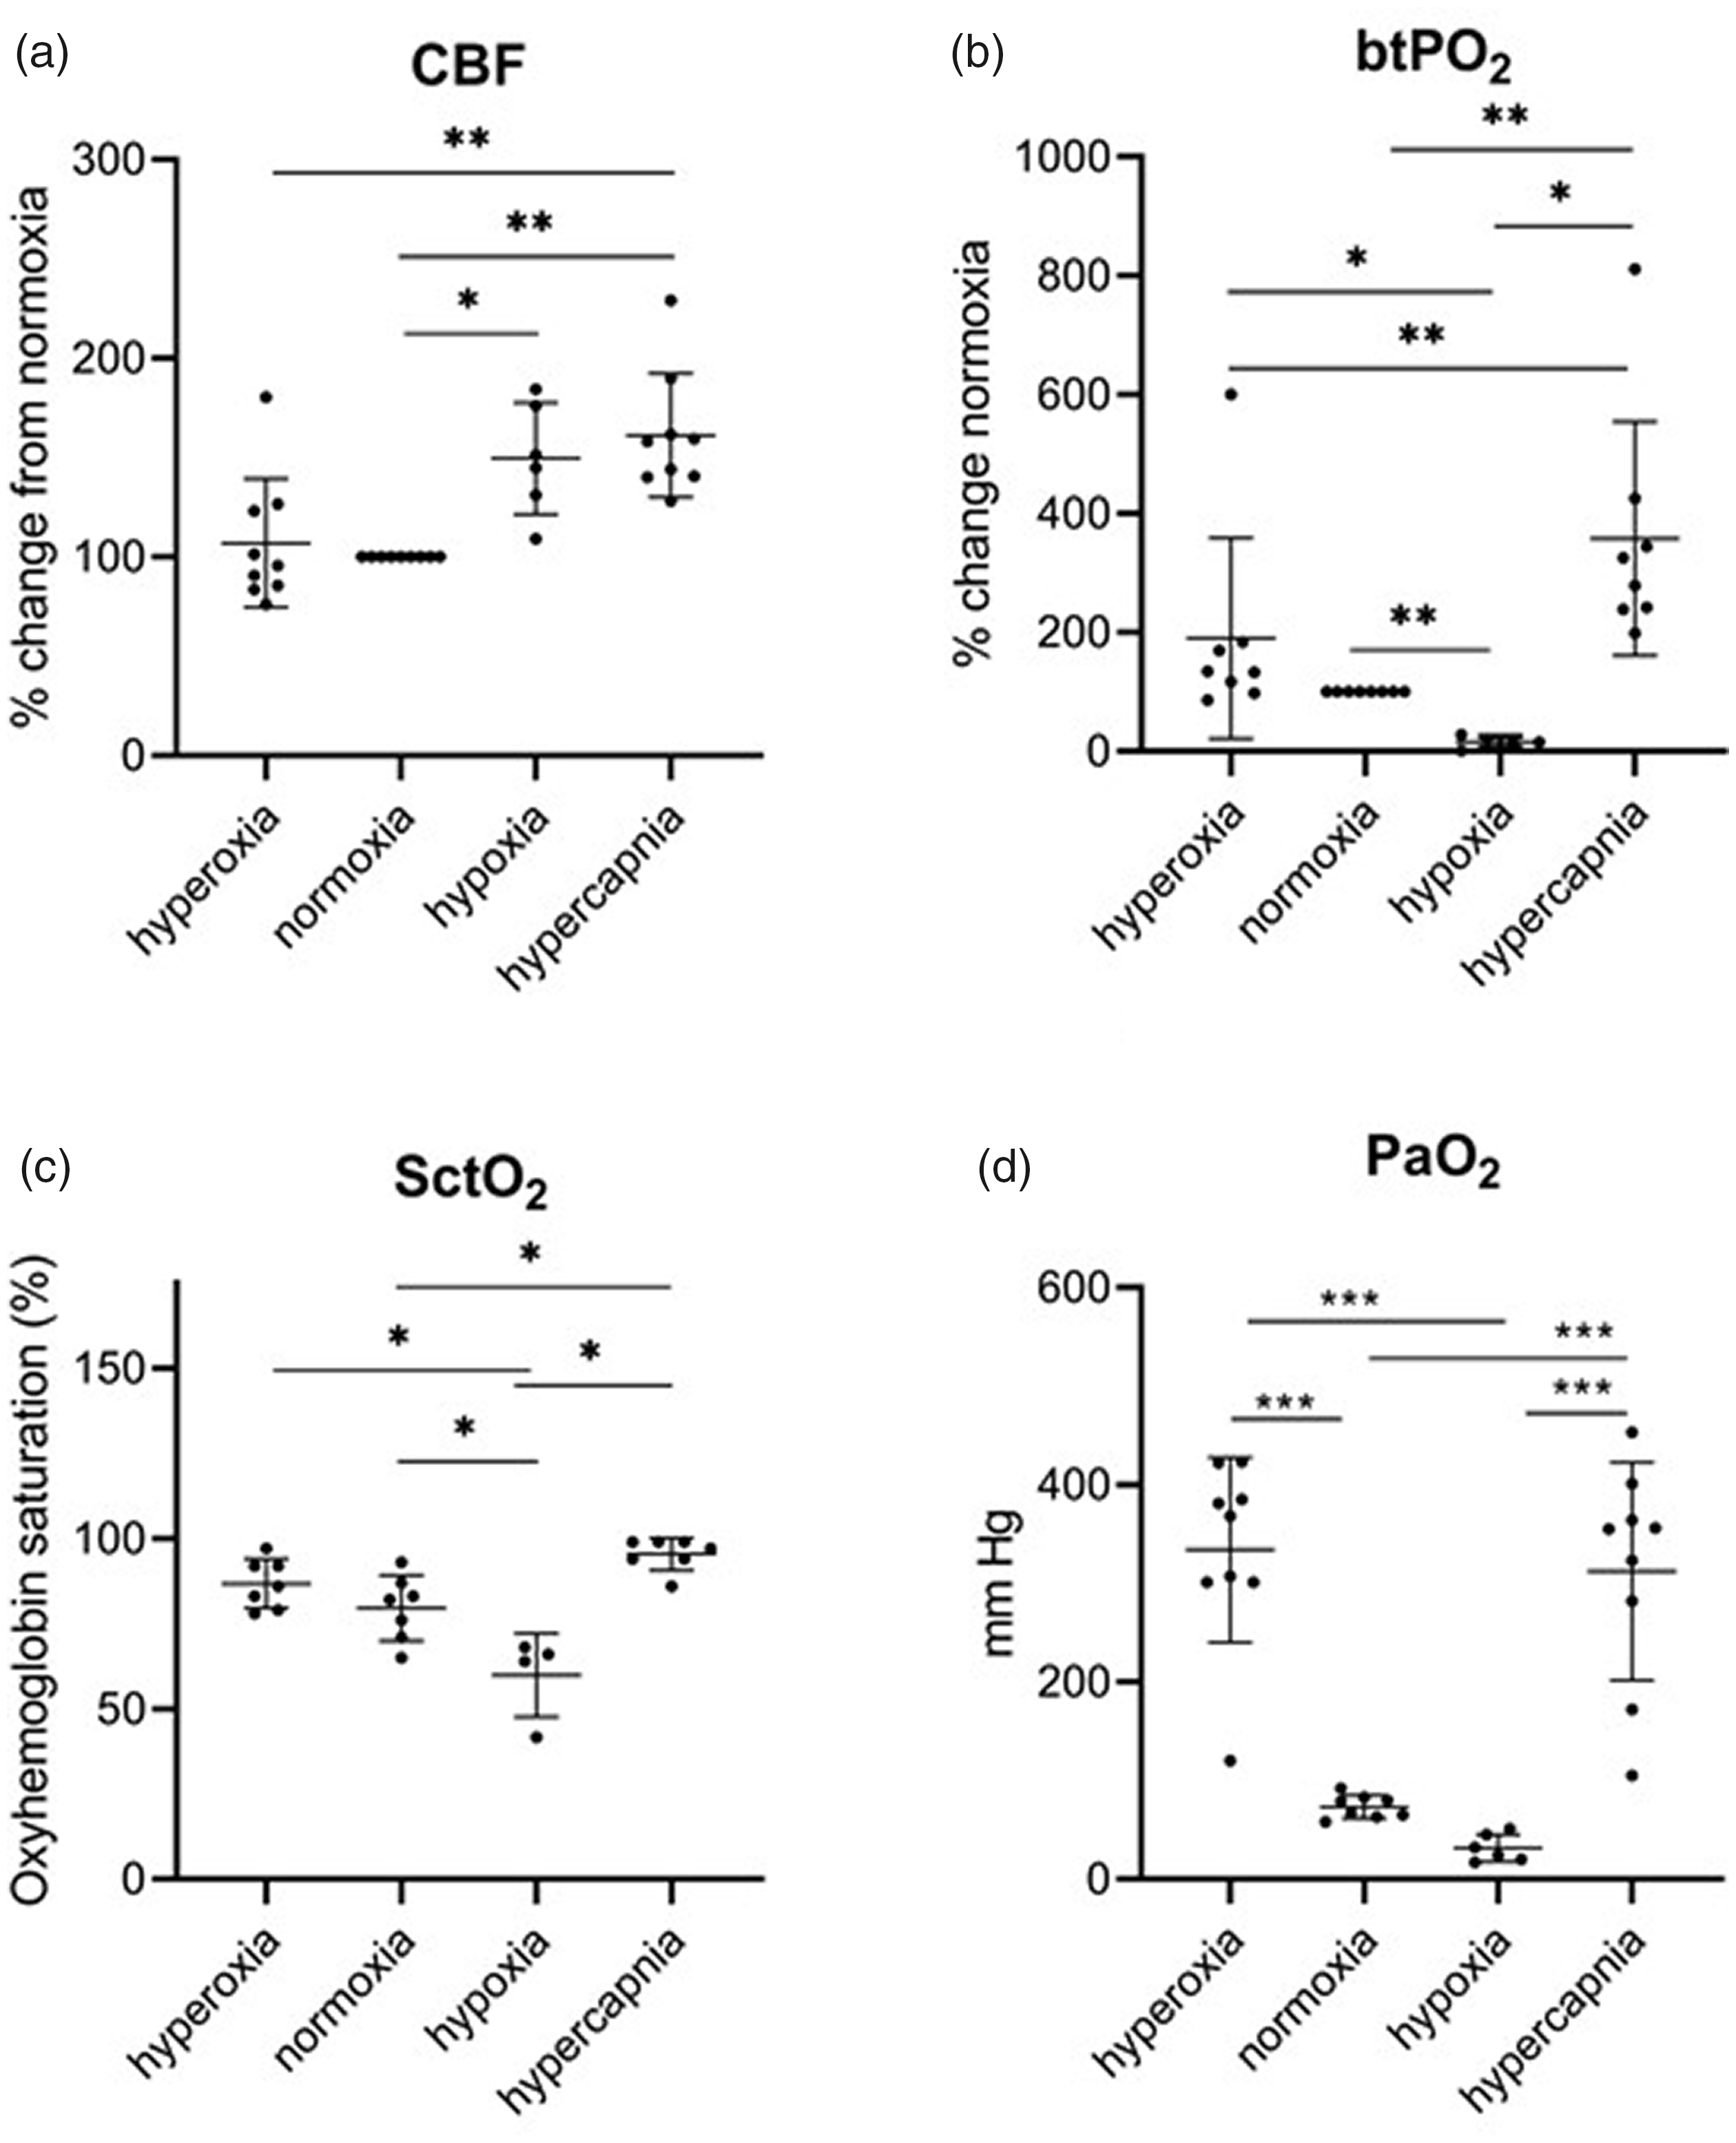
CBF, brain tissue PO2, SctO2, and SpO2 measurements during hyperoxia, normoxia, hypoxia, and hypercapnia. CBF increased during hypoxia and hypercapnia. CBF, cerebral blood flow; brain tissue PO2, brain tissue PO2; SctO, regional cortical oxygen saturation; PaO2, partial pressure of oxygen in arterial blood, * = p < 0.05; ** = p < 0.01; *** p < 0.001.
Piglet cortical vein prominence
Figure 2 shows a comparison of the magnitude SWI and QSM MIP images of a representative animal during hyperoxia, normoxia, hypoxia, and hypercapnia. Axial MIP images of a 12.8 mm slab reveal various cortical and deep cerebral veins including the bilateral THSV, STS, and transverse sinus (TRS; Figure 2(e) to (h)). During hypoxia the magnitude images showed high contrast between the veins and brain tissue (Figure 2(c)) that was less apparent during normoxia (Figure 2(b)). However, there was very little contrast between the cerebral vessels and gray matter during hyperoxia (Figure 2(a)) and hypercapnia (Figure 2(d)). Unlike the SWI images, veins were detectable in the QSM MIPS across all oxygenation states (Figure 2(e) and (h)), with prominent veins observed during hypoxia (g) that were less pronounced during normoxia (f), hyperoxia (e), and hypercapnia (h). During hypoxia there was a significant increase in the fraction of total brain area containing venous structures compared to all other oxygenation states (p < 0.05; Figure 3).
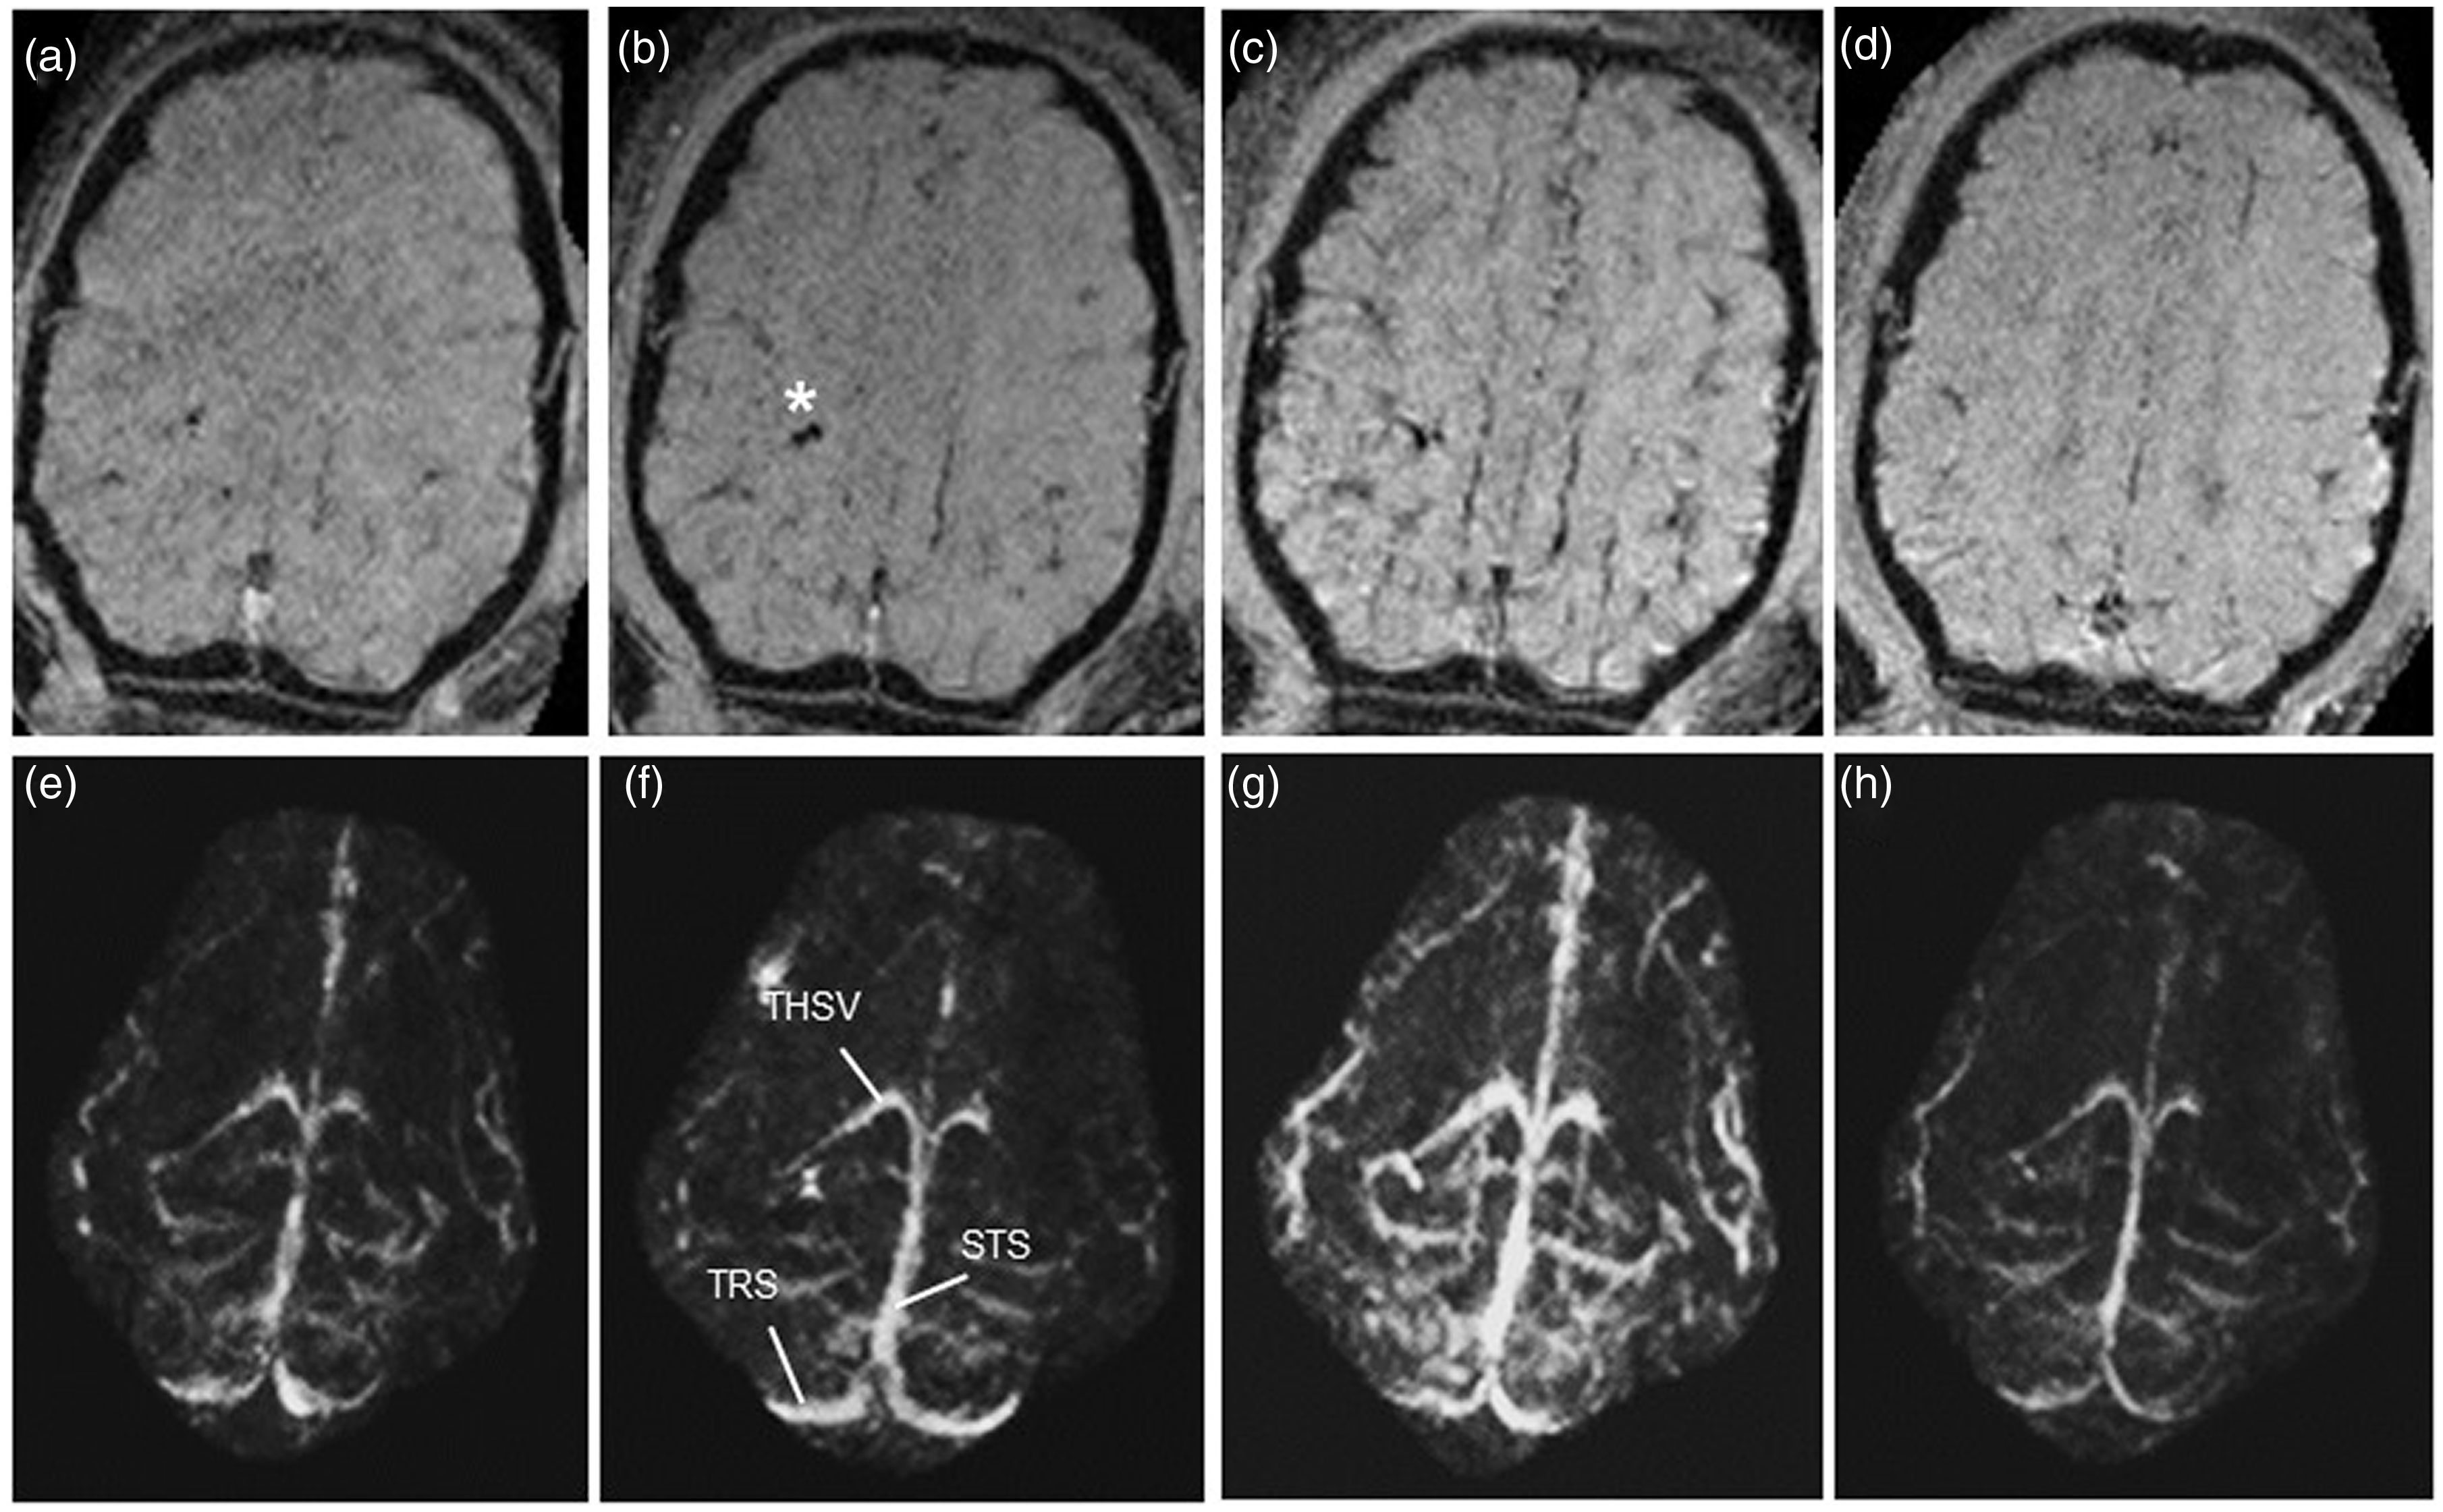
Susceptibility weighted images (SWI; a-d) and quantitative susceptibility map maximum intensity projection (QSM MIP; e-h) images during hyperoxia (a,e; CBF = 83.6%, brain tissue PO2 = 41.4 mmHg), normoxia (b,f; CBF = 100%, brain tissue PO2 = 7.2 mmHg), hypoxia (c,g; CBF = 187%, brain tissue PO2 = 1.3 mmHg), and hypercapnia (d,h; CBF = 208%, brain tissue PO2 = 28.4 mmHg). CBF values are calculated as a % of levels during normoxia. Asterisk indicates the position of the brain tissue PO2/laser Doppler probe (b). STS, straight sinus; THSV, thalamostriate vein; TRS, transverse sinus.
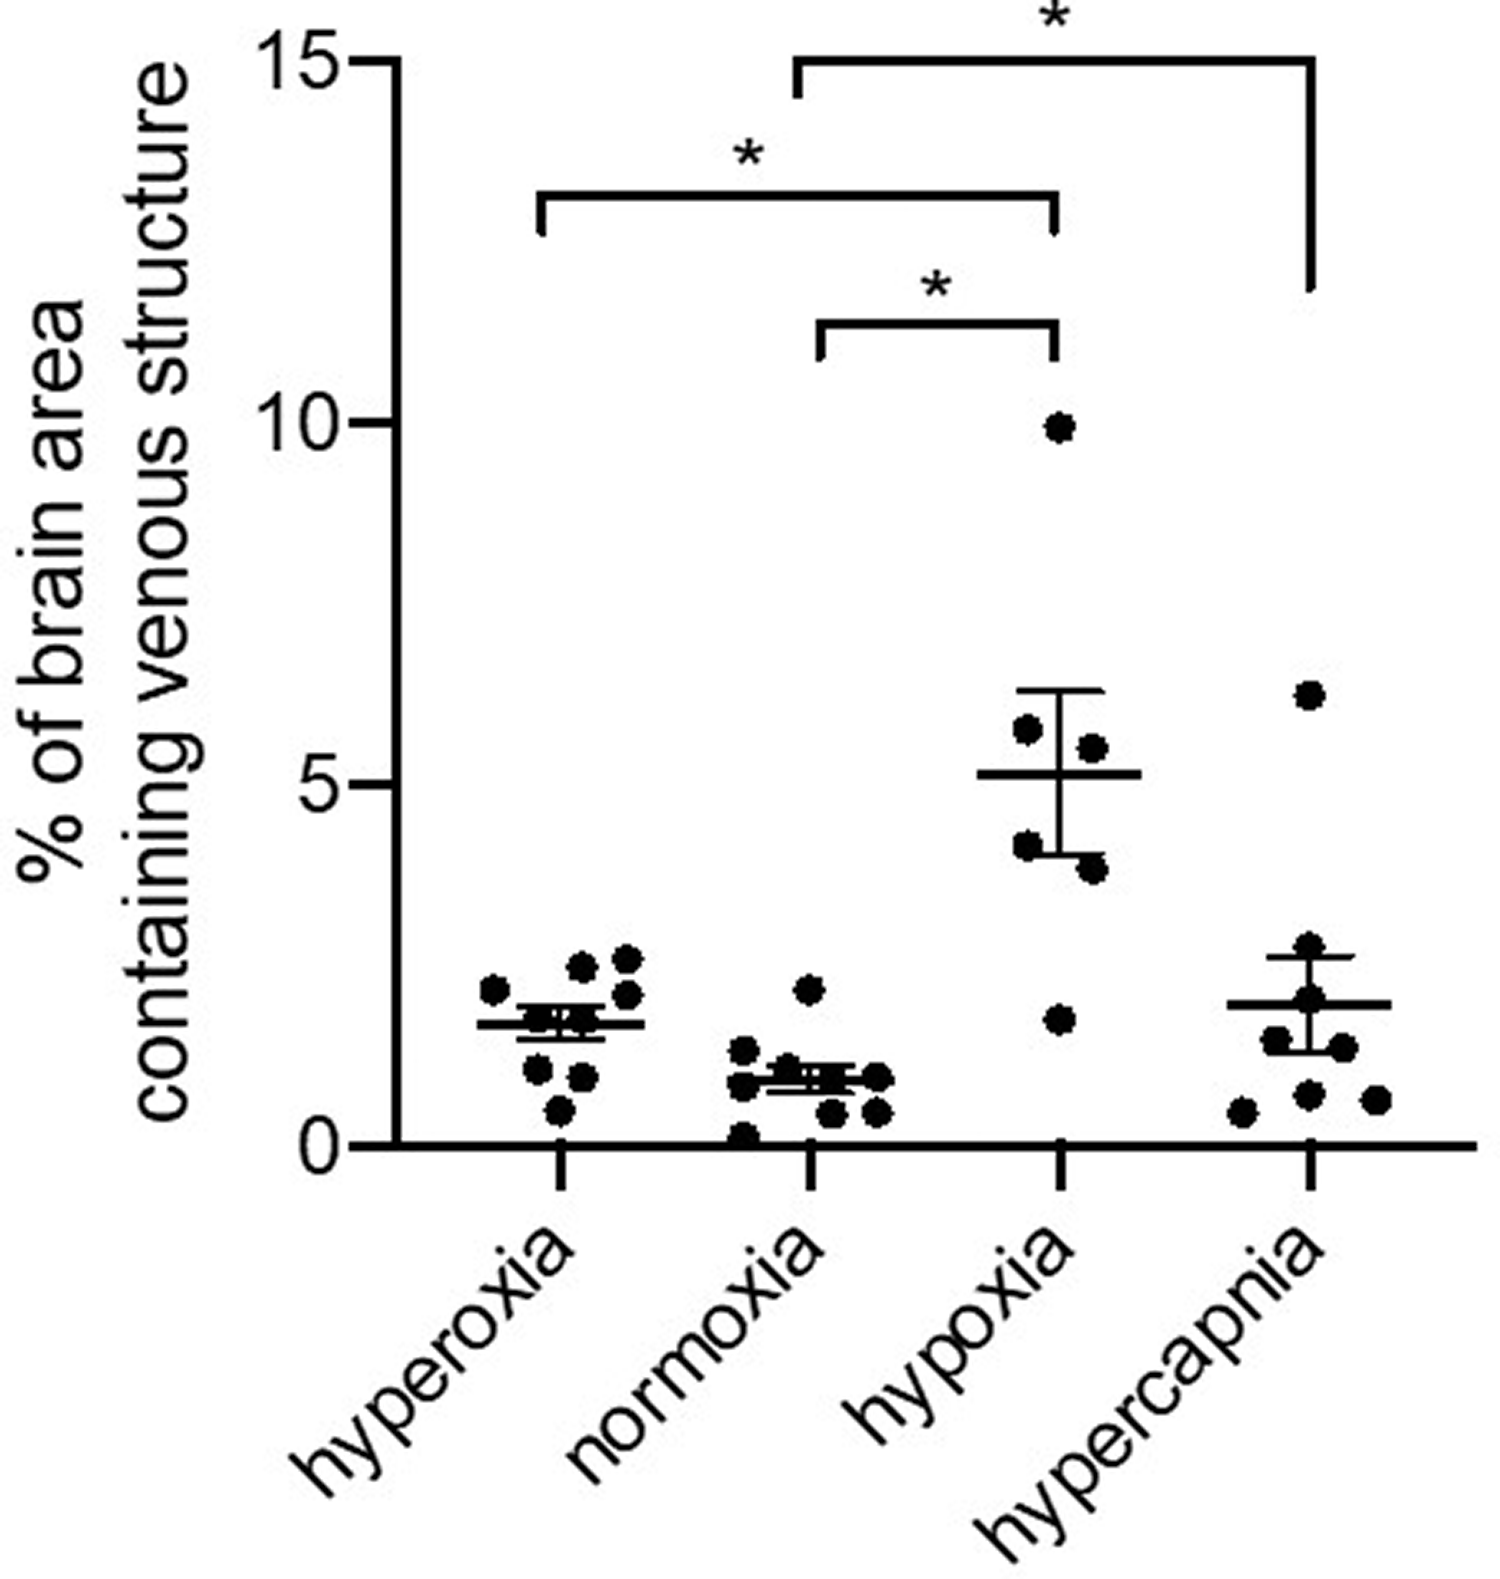
Quantification of venous structure as a percent of brain area from a 12.8 mm slice of the QSM MIP images taken from piglets during hyperoxia, normoxia, hypoxia, and hypercapnia periods. Veins were quantifiably more prominent during hypoxia than during the other periods. * = p < 0.05.
Piglet venous susceptibility measurements
Maximum venous susceptibility in the straight sinus and bilateral thalamostriate veins during the different oxygenation states is shown in Figure 4. During hypoxia there was a significant increase in susceptibility in the STS, left THSV (p < 0.01) and right THSV (p < 0.05) compared to normoxia, hyperoxia, and hypercapnic conditions. Compared to normoxia, venous susceptibility was reduced in the STS during hypercapnia and to a lesser extent, during hyperoxia (Figure 4(a) to (c)). In these animals hypercapnia was always preceded by hypoxia, which may have altered the vascular and O2 extraction response responses to hypercapnia. To address this, we studied three animals of similar age and weight without the hypoxic episode. In these animals, venous susceptibility during hypercapnia did not differ from piglets that received hypercapnia following hypoxia (Supplemental Figure 3), indicating that the responses to hypercapnia were not affected by the preceding period of hypoxia.
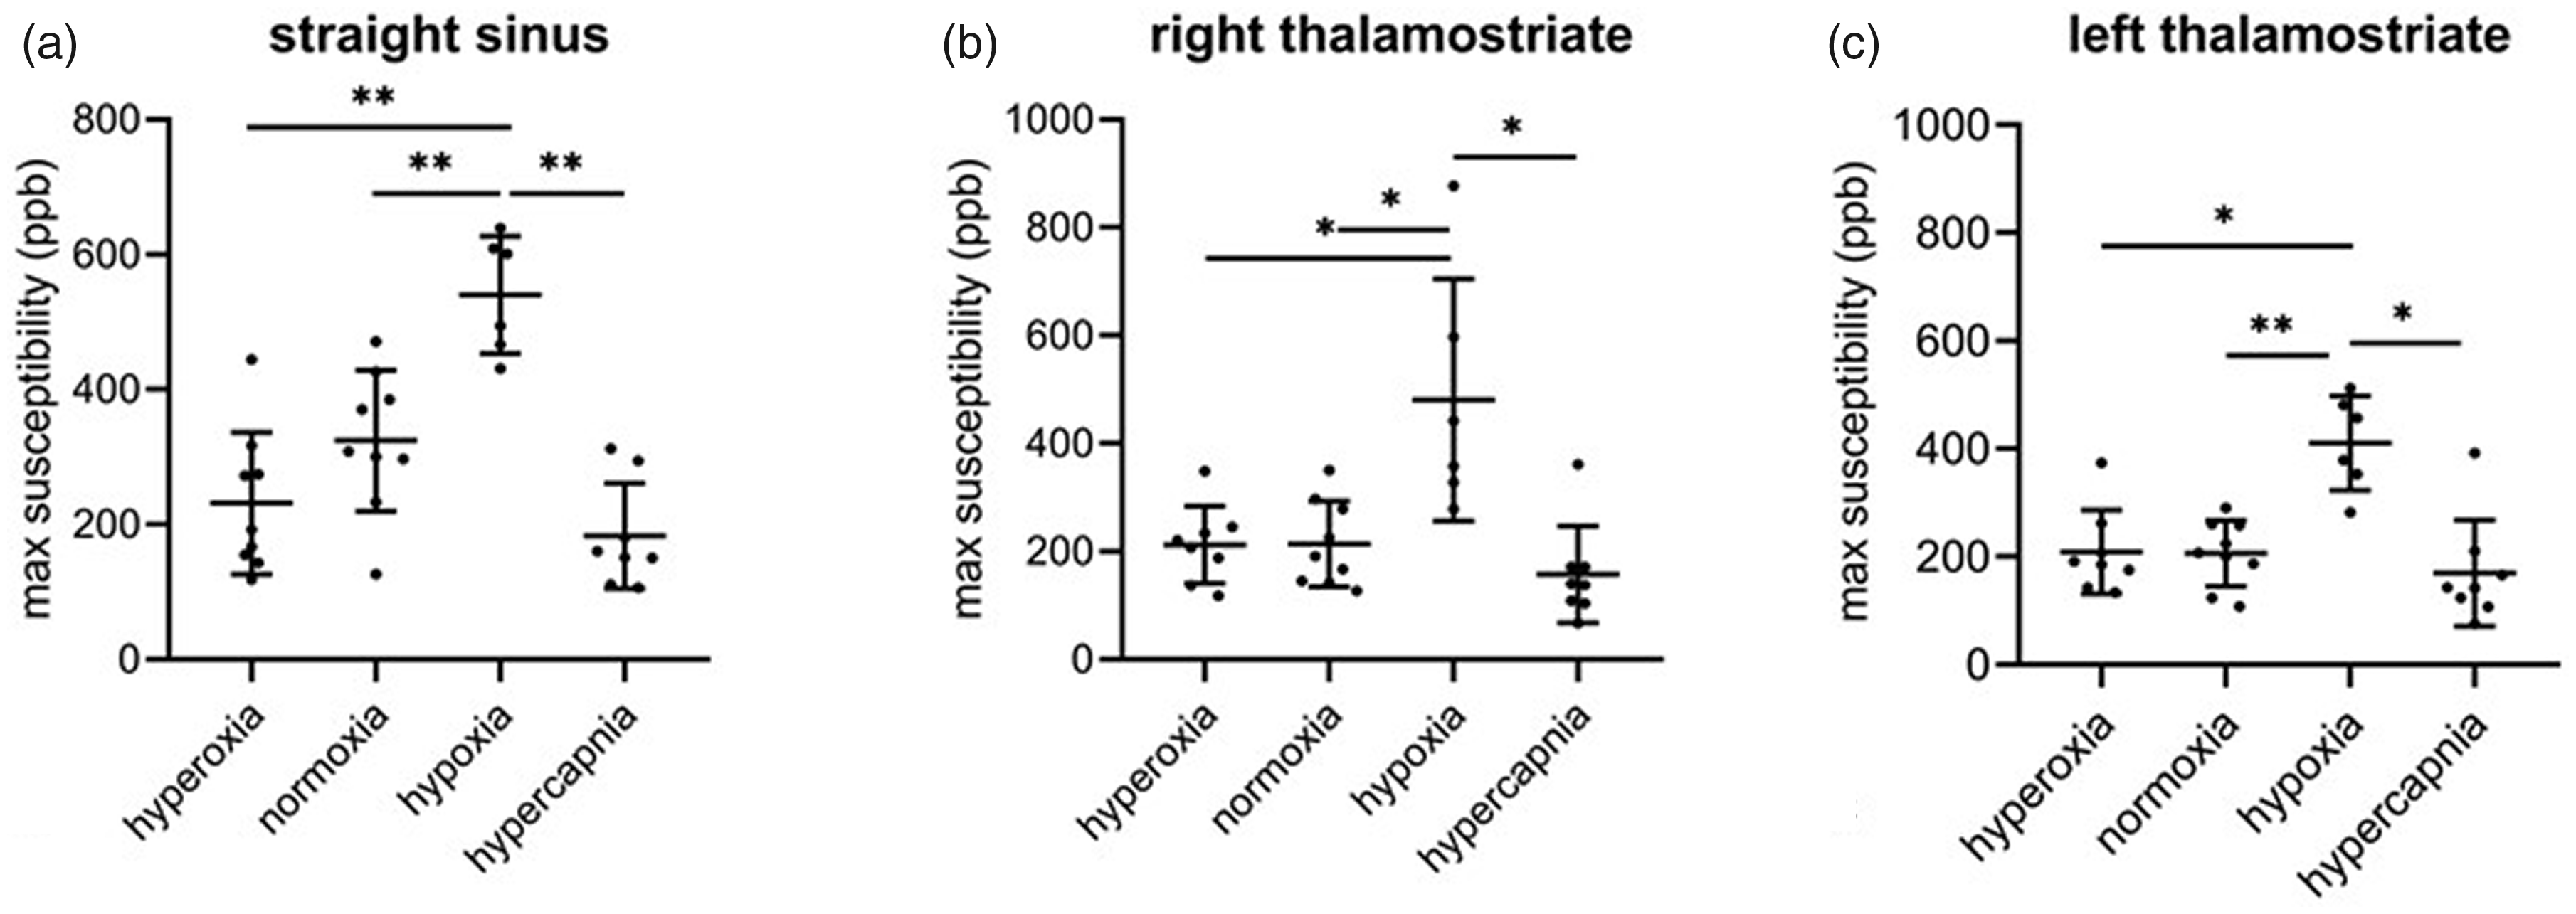
Maximum venous susceptibility in the straight sinus (a), right thalamostriate (b), and left thalamostriate (c) vein during hyperoxia, normoxia, hypoxia, and hypercapnia. * = p < 0.05; ** = p < 0.01; ***p < 0.001.
Piglet relationship between venous susceptibility, brain tissue PO2, and CBF
The detection of venous structures by SWI and QSM is related to venous deoxyhemoglobin content, which is regulated by tissue O2 extraction and CBF (Haacke et al. 2010). Here we examined the relationship between venous susceptibility, oxygenation, CBF, and PaO2 (Figure 5). As expected, there was a strong relationship between venous susceptibility measured by QSM in the STS and brain tissue PO2 (R2 = 0.633, p < 0.001; Figure 2(a)) as well as SctO2 and PaO2 (p < 0.001; Figure 5). In contrast, linear regression showed no relationship between venous susceptibility and CBF (Figure 5).
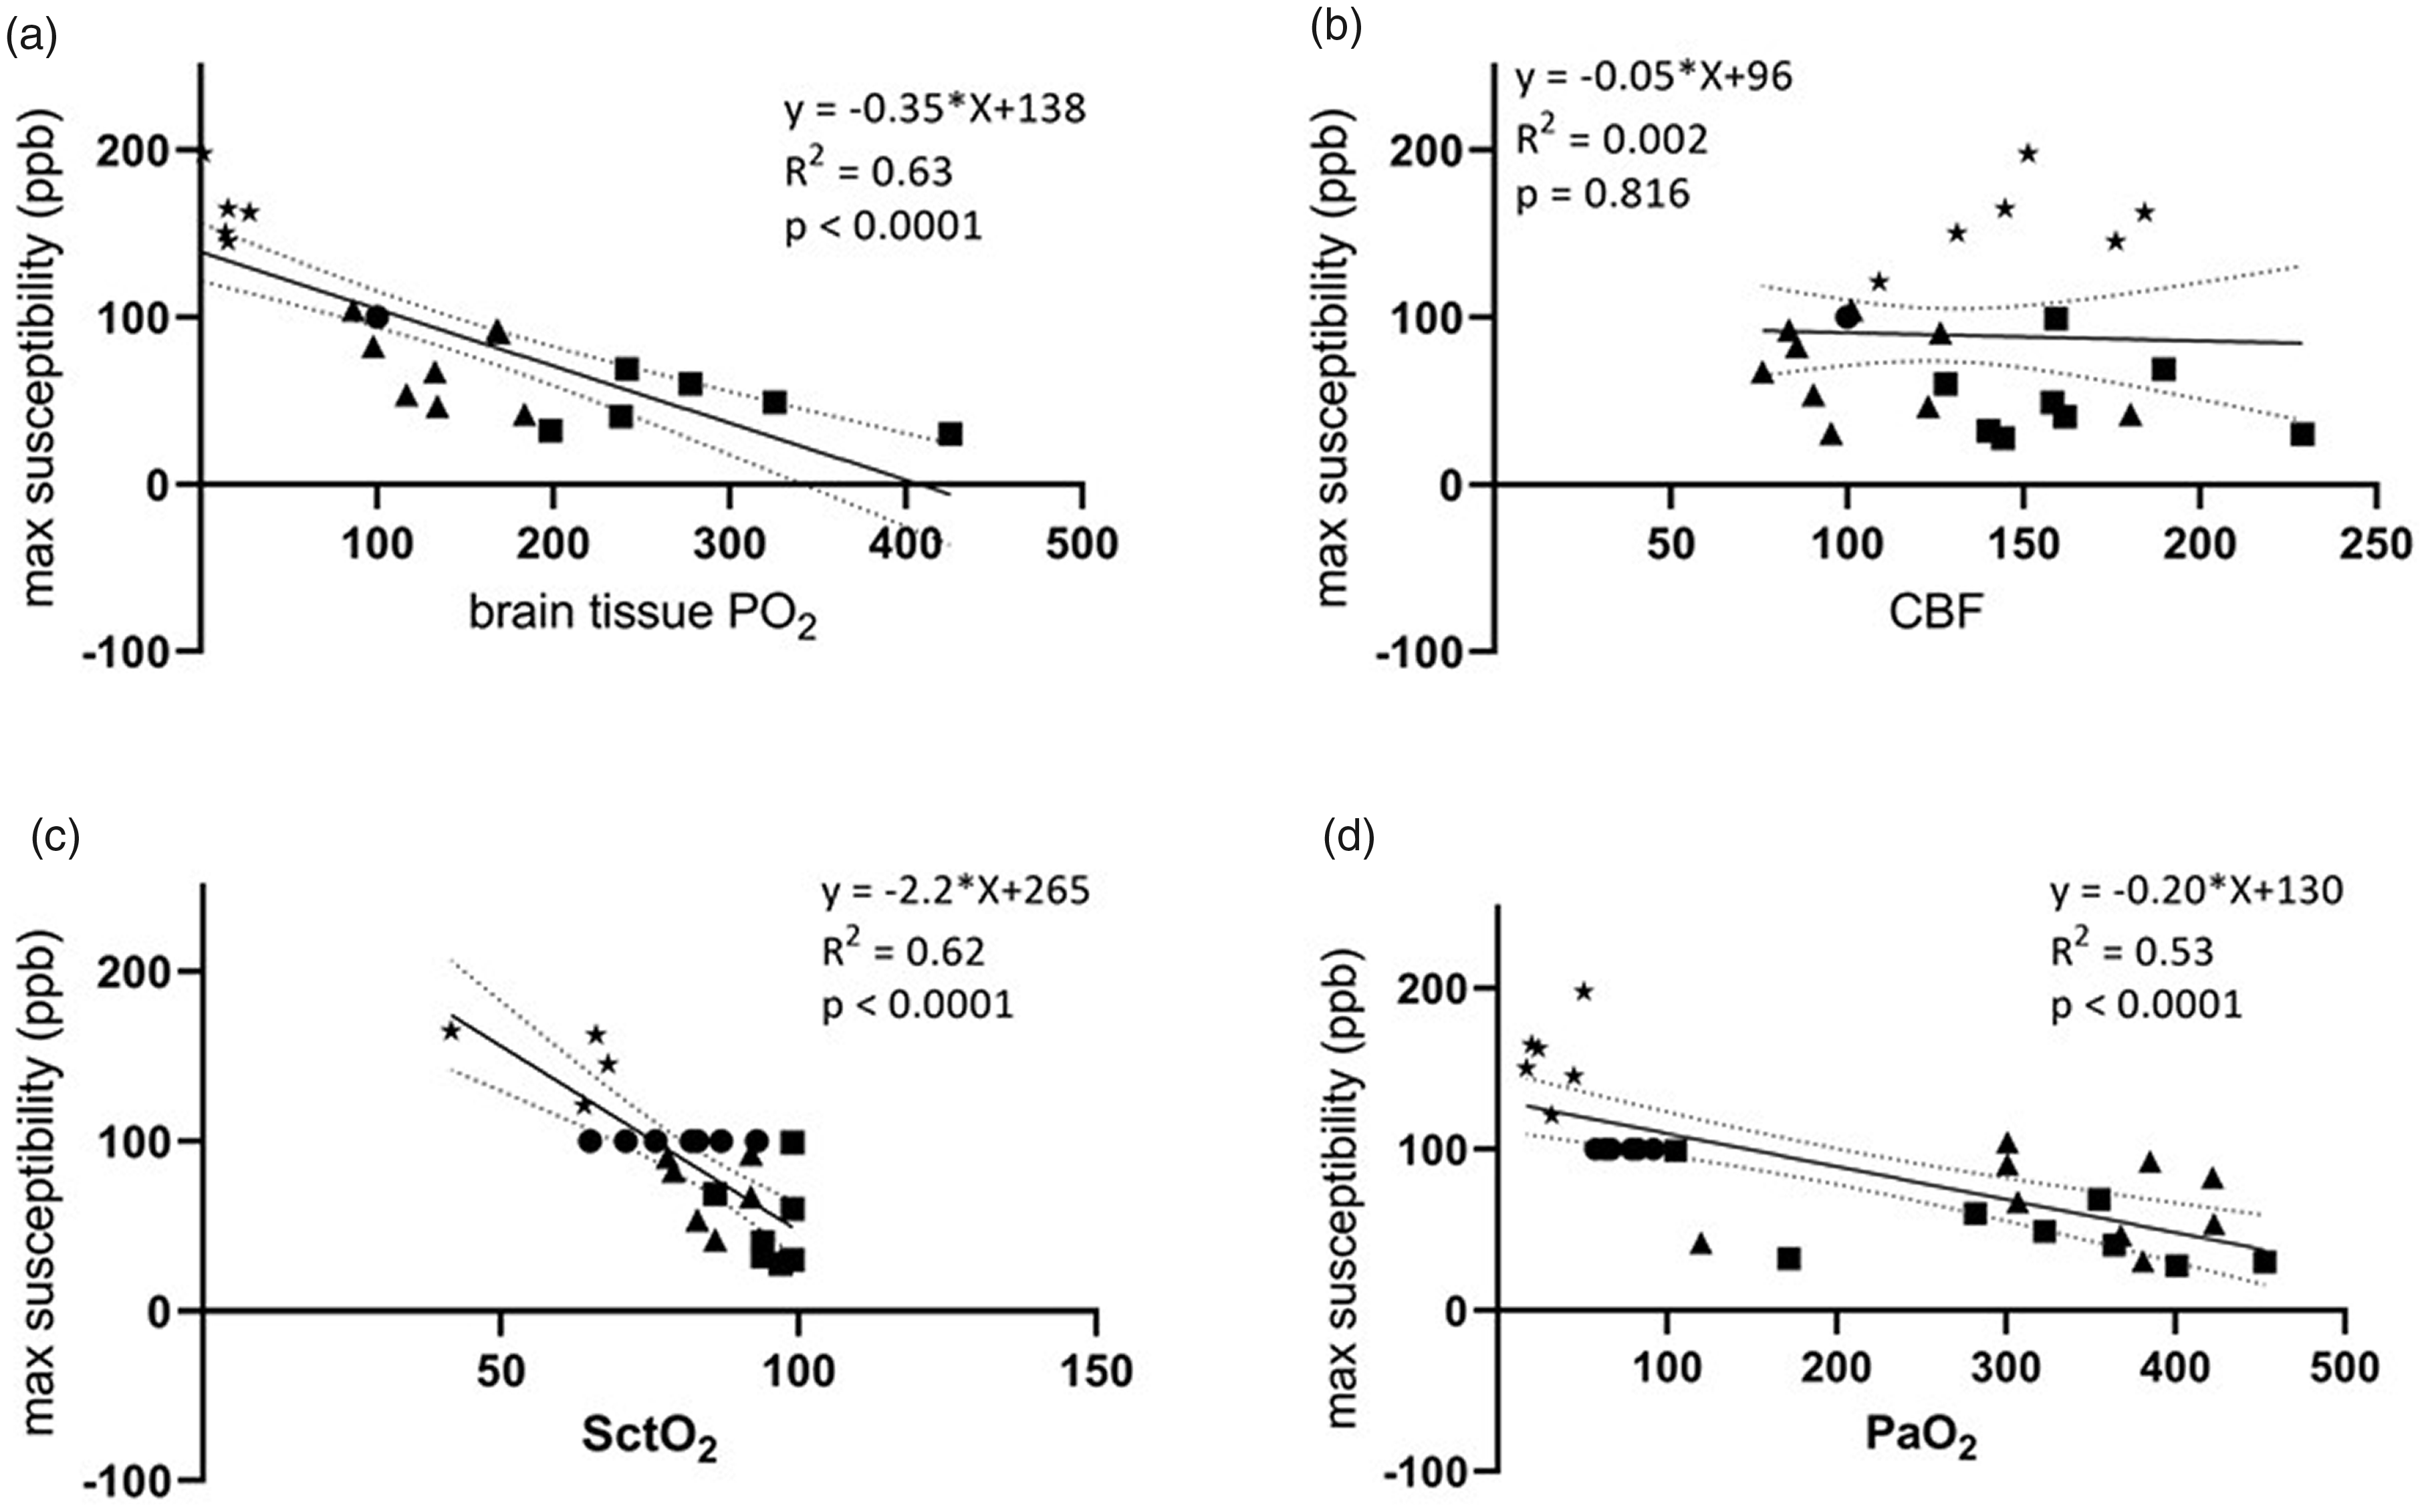
Scatter plots of max venous susceptibility and brain tissue PO2 (a), CBF (b), SctO2 (c) or SaO2 (d). Venous susceptibility was measured in the straight sinus of all piglets during hyperoxia (▲), normoxia (●), hypoxia (*), and hypercapnia (▪). Linear regression (solid line, with 95% confidence intervals denoted by dashed lines) identified a strong relationship between venous susceptibility and brain tissue PO2 (a), SctO2 (c) and PaO2 (d) but not CBF (b).
Discussion
The present study used a neonatal piglet model to compare QSM venous susceptibility across a broad range of oxygenation states. To our knowledge, this is the first study to establish the relationship between QSM and brain tissue PO2. Our findings show that QSM, by quantifying changes in venous susceptibility, is sensitive to changes in cerebral oxygenation across a broad range of oxygenation states. In addition, our findings show that venous susceptibility is strongly associated with measures of brain oxygenation, indicating that deoxyhemoglobin was the primary source of susceptibility contrast in the vessels.
Accurate measurements of brain tissue oxygenation are necessary to model the pathophysiology and optimize the treatment of neonatal HII. QSM is a promising imaging surrogate for traditional methods of OEF assessment (15O positron emission tomography or internal jugular catheterization) because it is noninvasive, safe, and easy to acquire. There is a growing body of work on the application of QSM in cerebral ischemia in both preclinical models and patients.39–44 In the present study we used QSM to measure changes in the magnetic susceptibility of venous blood across a range of oxygenation states. While the linear relation between the concentration of deoxyhemoglobin and venous susceptibility has been previously reported,16–19 ours is the first study to report a direct relationship between venous susceptibility and brain tissue PO2. It should be noted, however, that although we have used linear regression analyses to demonstrate the relationship between brain tissue PO2 and susceptibility, the true relationship between these two parameters is unlikely to be linear due to the sigmoidal relationship between PO2 and oxyhemoglobin saturation. A more precise characterization of this relationship in an in vivo model such as the current one would require larger numbers of animals and a more precise control and measurement of the factors that determine hemoglobin O2 affinity such as pH, temperature, PCO2, and the prevalence of fetal versus adult hemoglobin.
During hypoxia, SWI images of the brain showed strong contrast between the veins and tissue which is consistent with previous reports of prominent cerebral veins under clinical and experimental conditions involving inadequate cerebral oxygenation.20,44–51 The possible physiological mechanisms responsible for increased venous susceptibility include increased cerebral OEF resulting in an increased deoxyhemoglobin to oxyhemoglobin ratio or an increase in the overall amount of deoxyhemoglobin due to venous stasis or venodilation. Hypercapnia, an effective cerebral vasodilator leading to an increase in both CBF and cerebral blood volume. 52 In our study, hypercapnia induced by decreasing minute ventilation under hyperoxic conditions was associated with an increase in CBF and brain tissue PO2. Under these conditions we observed a trend towards reduced venous susceptibility, which is consistent with previous SWI and more recent QSM studies in healthy human subjects.53–55 The underlying mechanism for this decrease is likely as a result of increased PaO2 and increased cerebral O2 delivery resulting in decreased cerebral OEF and thus decreased venous deoxyhemoglobin concentrations. These findings suggest that the increased venous susceptibility observed during hypoxia is not merely due to increased blood flow. Furthermore, venous susceptibility was increased during hypoxia despite no change in arterial PaCO2, demonstrating that increased venous susceptibility is independent of hypercapnia.
We also observed a significant association between venous susceptibility and frontal cortical tissue SctO2. NIRS, which samples oxyhemoglobin saturations at a depth of up to 2 cm below the probe-skin interface, has been used previously in piglet models of HII, demonstrating the validity of this technique to measure cerebral oxygenation and OEF post-injury. 56 Our findings are in line with work by Cooper et al. which reported a negative linear relationship between rising deoxyhemoglobin concentrations and decreasing T2* signal during anoxia in a neonatal piglet model. 57 Although NIRS and venous susceptibility measurements did not come from the same area of the brain, the techniques are complementary and could be used to monitor brain health across a wide range of FiO2. QSM however, offers a significant advantage over NIRS in that brain oxygenation can be evaluated globally in the brain with high spatial resolution, which could prove useful in determining regional sensitivities (cortical versus deep grey matter) and their relationship to clinical outcome.
A study designed to assess CBF and O2 delivery, extraction, and consumption during MRI acquisition would be valuable in assessing the utility of QSM at monitoring these parameters. The current study would have been strengthened by measurements of cerebral O2 extraction based on the arterial and NIRS oxyhemoglobin saturation data at the time of MRI acquisition. This information may have provided additional validation of the susceptibility measurements, and insight into how it may be influenced by cerebral O2 utilization. However, arterial sampling was too infrequent and pulse oximetry too unreliable during hypoxic periods, and the NIRS probe had to be removed during MRI acquisition in order to avoid image artifact, and thus this analysis was not possible.
There is increasing interest in the use of QSM as a susceptibility based oximetry technique to non-invasively quantify cerebral venous oxygen saturation, where the susceptibility difference between venous blood and surrounding tissue is calculated as the susceptibility difference per unit hematocrit between fully deoxygenated and fully oxygenated blood.16,18,54 We did not measure hematocrit levels in the current study, which would have allowed us to control for differences in hematocrit in the various oxygenation states and measure cerebral venous oxygen saturation. However, under the study conditions, hematocrit was not needed to demonstrate the strong linear relationship between venous susceptibility and brain tissue PO2, which was our goal.
Conclusion and future directions
QSM was able to provide information about venous oxygenation across a broad range of oxygenation states in a neonatal model. While the hypoxic insult and timeline used in this piglet study may not accurately reflect typical clinical scenarios, we anticipate that future studies using a hypoxic-ischemic model will support a role for QSM in measuring cerebral oxygenation following clinical neonatal HII.
Supplemental Material
sj-pdf-1-jcb-10.1177_0271678X211065199 - Supplemental material for Quantitative susceptibility mapping as a measure of cerebral oxygenation in neonatal piglets
Supplemental material, sj-pdf-1-jcb-10.1177_0271678X211065199 for Quantitative susceptibility mapping as a measure of cerebral oxygenation in neonatal piglets by Brenda L Bartnik-Olson, Arlin B Blood, Michael H Terry, Shawn FL Hanson, Christopher Day, Daniel Kido and Paggie Kim in Journal of Cerebral Blood Flow & Metabolism
Footnotes
Funding
The author(s) disclosed receipt of the following financial support for the research, authorship, and/or publication of this article: This study was funded by the Loma Linda University Medical Center Department of Radiology.
Acknowledgements
We gratefully acknowledge the assistance of Shannon L. Bragg during the surgical procedures.
Declaration of conflicting interests
The author(s) declared no potential conflicts of interest with respect to the research, authorship, and/or publication of this article.
Authors’ contributions
B.B., A.B., and P.K. conceived and planned the experiments. D.K supervised the study. B.B, A.B, M.T, S.H, and P.K carried out the experiments. B.B., A.B., C.D., and P.K. contributed to the interpretation of the results. B.B. took the lead in writing the manuscript. All authors provided critical feedback and helped shape the research, analysis and manuscript.
Supplemental material
Supplemental material for this article is available online.
References
Supplementary Material
Please find the following supplemental material available below.
For Open Access articles published under a Creative Commons License, all supplemental material carries the same license as the article it is associated with.
For non-Open Access articles published, all supplemental material carries a non-exclusive license, and permission requests for re-use of supplemental material or any part of supplemental material shall be sent directly to the copyright owner as specified in the copyright notice associated with the article.