
Abstract
The spatial heterogeneity in the temporal occurrence of pseudo-normalization of MR apparent diffusion coefficient values for ischemic lesions may be related to morphological and functional vascular remodeling. As the area of accelerated pseudo-normalization tends to expand faster and more extensively into the chronic stage, detailed vascular characterization of such areas is necessary. During the subacute stage of transient middle cerebral artery occlusion rat models, the morphological size of the macrovasculature, microvascular vessel size index (VSI), and microvessel density (MVD) were quantified along with functional perfusion measurements of the relative cerebral blood flow (rCBF) and mean transit time (rMTT) of the corresponding areas (33 cases for each parameter). When compared with typical pseudo-normalization lesions, early pseudo-normalization lesions exhibited larger VSI and rCBF (p < 0.001) at reperfusion days 4 and 7, along with reduced MVD and elongated rMTT (p < 0.001) at reperfusion days 1, 4, and 7. The group median VSI and rCBF exhibited a strong positive correlation (r = 0.92), and the corresponding MVD and rMTT showed a negative correlation (r = −0.48). Light sheet fluorescence microscopy images were used to quantitatively validate the corresponding MRI-derived microvascular size, density, and cerebral blood volume.
Keywords
Introduction
Following an ischemic stroke, multiple neurologic complications, including cerebral edema, inflammation, and vascular alteration, develop dynamically during the subacute stage (1 to 7 days). As the status of the subacute stage affects the progression of the chronic stage, a detailed investigation of the subacute stage of ischemic stroke is crucial. For example, pseudo-normalization of the magnetic resonance (MR) apparent diffusion coefficient (ADC) values is typically observed around one week after ischemic stroke.1–5 This is most likely due to a combination of cytotoxic edema (lowering ADC, swelling of cells) and the development of vasogenic edema (increasing ADC, swelling of the extracellular space).6–10 On the other hand, the temporal occurrence of such pseudo-normalization of the ADC may be spatially heterogeneous in ischemic brains. 11 , 12 If vasogenic edema occurs faster in certain ischemic areas, an accelerated pseudo-normalization of the ADC develops, and these lesions more quickly and widely expand into the chronic stage. As a result, detailed spatial characterization and diagnosis of early and typical ADC pseudo-normalization lesions and subsequent treatment decisions may be important. 7 ,13–15 However, since these early pseudo-normalization lesions have a higher ADC (closer to ADC of normal tissue) than typical pseudo-normalization lesions in the early subacute stage (1 to 4 days), distinguishing these lesions by ADC alone can be problematic, especially in the subacute stage.
Ischemic stroke is induced by cerebrovascular dysfunction and results in vascular remodeling. The visualization and quantification of the macro- and microvascular status may help characterize and differentiate early and typical pseudo-normalization lesions. Previous MR imaging (MRI) investigations of vascular remodeling have revealed a correlation between adequate vascular remodeling, recovery, and clinical outcomes after ischemic strokes.16–19 However, differential MRI characterizations of both vascular morphology and function between early and typical pseudo-normalization lesions are rare in the subacute stage. Consequently, simultaneous longitudinal visualization and quantification of morphological (size/density) and functional (perfusion) vascular status in both lesions can provide further insights and prognostic information in addition to general measurements of lesion tissue status via the ADC or T2. For example, the segmentation of ischemic lesions may elucidate the origins of hyperperfusion and delayed transit time observed in the subacute stage by cross-monitoring vascular morphology and function.
As an investigation of vascular alterations after ischemic stroke, MR angiography (MRA) has shown morphological macrovascular remodeling at the brain surface region after ischemic stroke.20–22 Microvascular remodeling in the inner brain region can be visualized by morphological mapping of the vessel size index (VSI) and microvessel density (MVD and Q), overcoming the spatial resolution limitation of MRA.23–28 Dynamic susceptibility contrast MRI (DSC-MRI) can be used to estimate functional microvascular status, such as the cerebral blood volume (CBV), cerebral blood flow (CBF), and mean transit time (MTT) in lesions.29–31
In this study, longitudinal morphological and functional vascular remodeling were investigated differentially between early and typical pseudo-normalization lesions to assess contrasting vascular conditions in a transient middle cerebral artery occlusion (tMCAO) rat model using dual contrast superparamagnetic iron oxide nanoparticles (SPION). 28 Early and typical pseudo-normalization lesions were selected and segmented using longitudinally acquired ADC maps. Corresponding VSI and MVD maps were generated to evaluate the morphological vascular status. For evaluation of functional vascular status, relative CBV (rCBV), CBF (rCBF), and MTT (rMTT) maps from DSC-MRI acquisitions were simultaneously analyzed. Ultra-short echo time MRAs (UTE-MRAs) were acquired to compare morphological macrovascular remodeling occurring at the brain surface region. For the direct validation of VSI, MVD, and rCBV values between two lesions, light sheet fluorescence microscopy (LSFM) images of tMCAO rat models were acquired and quantitatively compared at reperfusion day 7.
Material and methods
Animal preparation
Animal experiments were performed in accordance with the Animal Protection Act of Korea under a protocol approved by the Institutional Animal Care and Use Committee of the Ulsan National Institute of Science and Technology. All experiments were reported in compliance with the ARRIVE guidelines (Animal Research: Reporting In Vivo Experiments).
32
Male Wistar rats (bodyweight 280-320 g, n = 13) were subjected to focal brain ischemia by transient occlusion of the middle cerebral artery (MCA). Initially, rats were anesthetized by inhalation of 3% isoflurane in a mixture of 70% nitrous oxide and 30% oxygen. Anesthesia was maintained by changing the range of isoflurane to 1-1.5%. Body temperature was kept constant (37
MRI acquisition
MRI acquisitions were conducted using a 7-T MR scanner (Bruker, Ettlingen, Germany). The tMCAO rat models were anesthetized using the same method of focal brain ischemia surgery. A single contrast agent, SPION, was synthesized in-house according to previously described methods.
34
The core size distribution of the iron oxide measured by transmission electron microscopy was 5–10 nm, and the mean hydrodynamic diameter of the iron oxide nanoparticles measured by differential light scattering was 20
The ADC map was acquired using a diffusion-weighted echo planar imaging (EPI) pulse sequence with the following parameters: TR/TE = 3500/26.6 ms, number of averages (NA) = 8, number of segments = 3, b-values = 100, 200, 400, 600, 800, and 1000 s/mm2, flip angle (FA) = 90
The DSC-MRI perfusion maps were acquired using a gradient-echo EPI pulse sequence with the following parameters: TR/TE = 420/17 ms, NA = 1, number of segments = 1, number of repetitions = 400, FA = 30
The
The
The UTE-MRA was acquired using the UTE pulse sequence with the following parameters: TR/TE = 22/0.012 ms, NA = 1, FA = 40
Fluorescence image acquisition
To label cerebral blood vessels, fluorescein isothiocyanate (FITC)-dextran solution was heart perfused in two representative tMCAO rat models, which showed early pseudo-normalization and typical pseudo-normalization in the cortex lesions at reperfusion day 7 according to the previously described methods.
35
One hundred milliliters of saline solution was administered into the left ventricle to extract cerebrovascular blood through the right atrium. Subsequently, FITC-dextran was mixed with 5% gelatin solution at a concentration of 0.075% and administered into the left ventricle. After 30 min of refrigeration, the rat brain was dissected and fixed in 4% paraformaldehyde (PFA) for two days. Then, 2 mm of the brain, including the edema lesion, was dissected. Tissue clearing was then performed to acquire 3-dimensional structural images using a Binaree tissue clearing™ kit (Cat. HRTC-001; Binaree, Korea). In brief, the tissue was immersed in the Binaree tissue clearing solution, which was changed every two to three days until the sample was visibly clear. The brains were transferred to Binaree Mounting and Storage™ Solution (Cat. SHMS-060, Binaree) for refractive index matching. Subsequently, using LSFM (Zeiss Lightsheet Z.1), 3-dimensional fluorescence images of tissue-cleared tMCAO rat brains were acquired with a resolution of 1.2
Data processing and analysis
MATLAB (MathWorks, Natick, MA) and ImageJ (US National Institutes of Health, Bethesda, MD) software were used for the data processing and analysis. Voxel-wise ADC values were estimated by fitting the equation S = S0
The


Acquired UTE-MRAs were denoised and visualized using 3 D Slicer software (www.slicer.org) to investigate macrovascular remodeling in the tMCAO rat models. 28 The caudal rhinal veins (cRHVs), populated in the contralateral and ipsilateral regions for each representative tMCAO rat model, were selected and segmented for macrovascular remodeling. Vessel diameters of the segmented cRHVs were calculated using BoneJ software integrated with ImageJ. 39 In addition, the SD of each cRHV was derived.
Due to the DSC-MRI-derived rCBV maps’ low spatial resolution, rCBV maps were replaced with high spatial resolution
Results
Early pseudo-normalization and typical pseudo-normalization lesions
Even though the pathogenesis of cerebral edema after ischemic stroke is complex, the underlying ADC dependence of early pseudo-normalization and typical pseudo-normalization lesions with associated vascular remodeling are conceptualized in Figure 1. To address the heterogeneity in the pseudo-normalization of ADC in ischemic lesions, two different edema progressions, marked by gold and green solid lines, are shown in Figure 1(a). The gold line shows the pseudo-normalization of ADC before reperfusion day 7 as marked by the gold arrow (early pseudo-normalization), while the green line shows the pseudo-normalization of ADC at reperfusion day 7 as marked by the green arrow (typical pseudo-normalization). The gold line shows a much higher ADC than the green line at reperfusion day 7. In Figure 1(b), the exemplar MRI-derived morphological VSI map and functional rCBF map are both visualized along with volume-rendered LSFM images, which were quantitatively analyzed and compared between the lesions of early and typical pseudo-normalization of ADC in the current study.
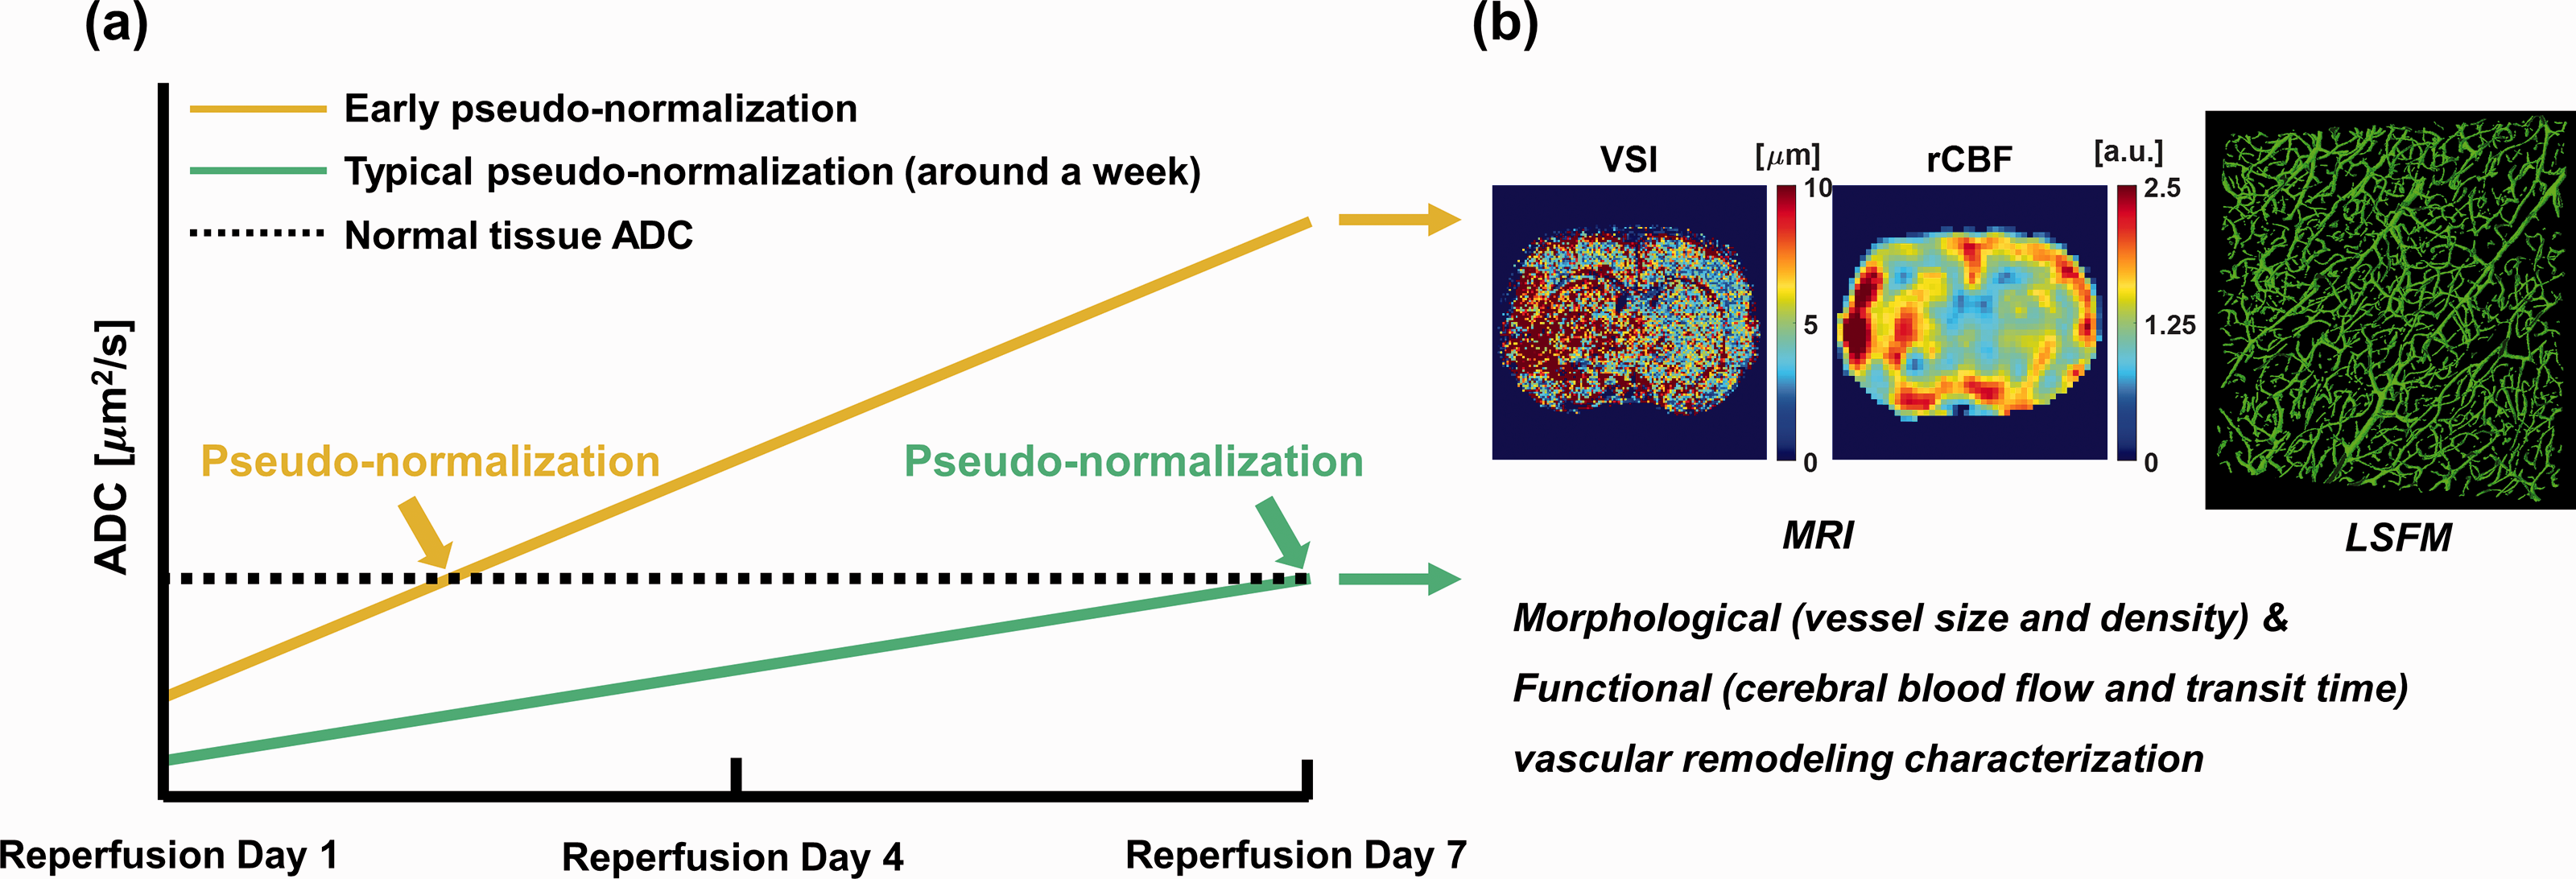
Conceptual illustration of edema progression in typical pseudo-normalization and early pseudo-normalization lesions. (a) ADC alterations in typical pseudo-normalization (green solid line) and early pseudo-normalization (gold solid line) lesions as reperfusion continued from day 1 to 7. The black dashed line indicates the ADC value of normal tissue. Two different time points of ADC pseudo-normalization in early and typical pseudo-normalization lesions are marked by gold and green arrows, respectively. (b) Exemplar MRI-derived morphological vascular remodeling related VSI map, functional vascular remodeling related rCBF map, and volume-rendered LSFM images to characterize vascular remodeling in typical pseudo-normalization and early pseudo-normalization lesions.
Morphological and functional microvascular remodeling mapping
Overall, Figure 2 shows longitudinally (reperfusion days 1, 4, and 7) acquired edema status surrogate (T2 and ADC) maps with morphological (VSI and MVD) and functional (CBV, rCBF, and rMTT) microvascular maps of a representative tMCAO rat model. At reperfusion day 1, the area of increased T2 with decreased ADC indicates the edema lesion, as marked by yellow arrows is shown in Figure 2(a) and (b), respectively. Correspondingly, morphological (increased VSI and decreased MVD) and functional (reduced rCBF and elongated rMTT) microvascular variations are spatially matched with the corresponding edema lesion as shown in Figure 2(c), (d), (f), and (g), respectively. At reperfusion day 4, a slight decrease in T2 and an increase in ADC values with respect to those values at reperfusion day 1 were observed, as shown in Figure 2(h) and (i), respectively. Along with such edema progression, spatially heterogeneous morphological and functional microvascular alterations are apparent (Figure 2(j) to (n)). Specifically, there are conspicuous lesions marked by red arrows in Figure 2(h) and (i), which exhibit significantly increased T2 and ADC. Such areas represent so-called early pseudo-normalization lesions. Even at reperfusion day 7, early pseudo-normalization lesions (ADC > 1500
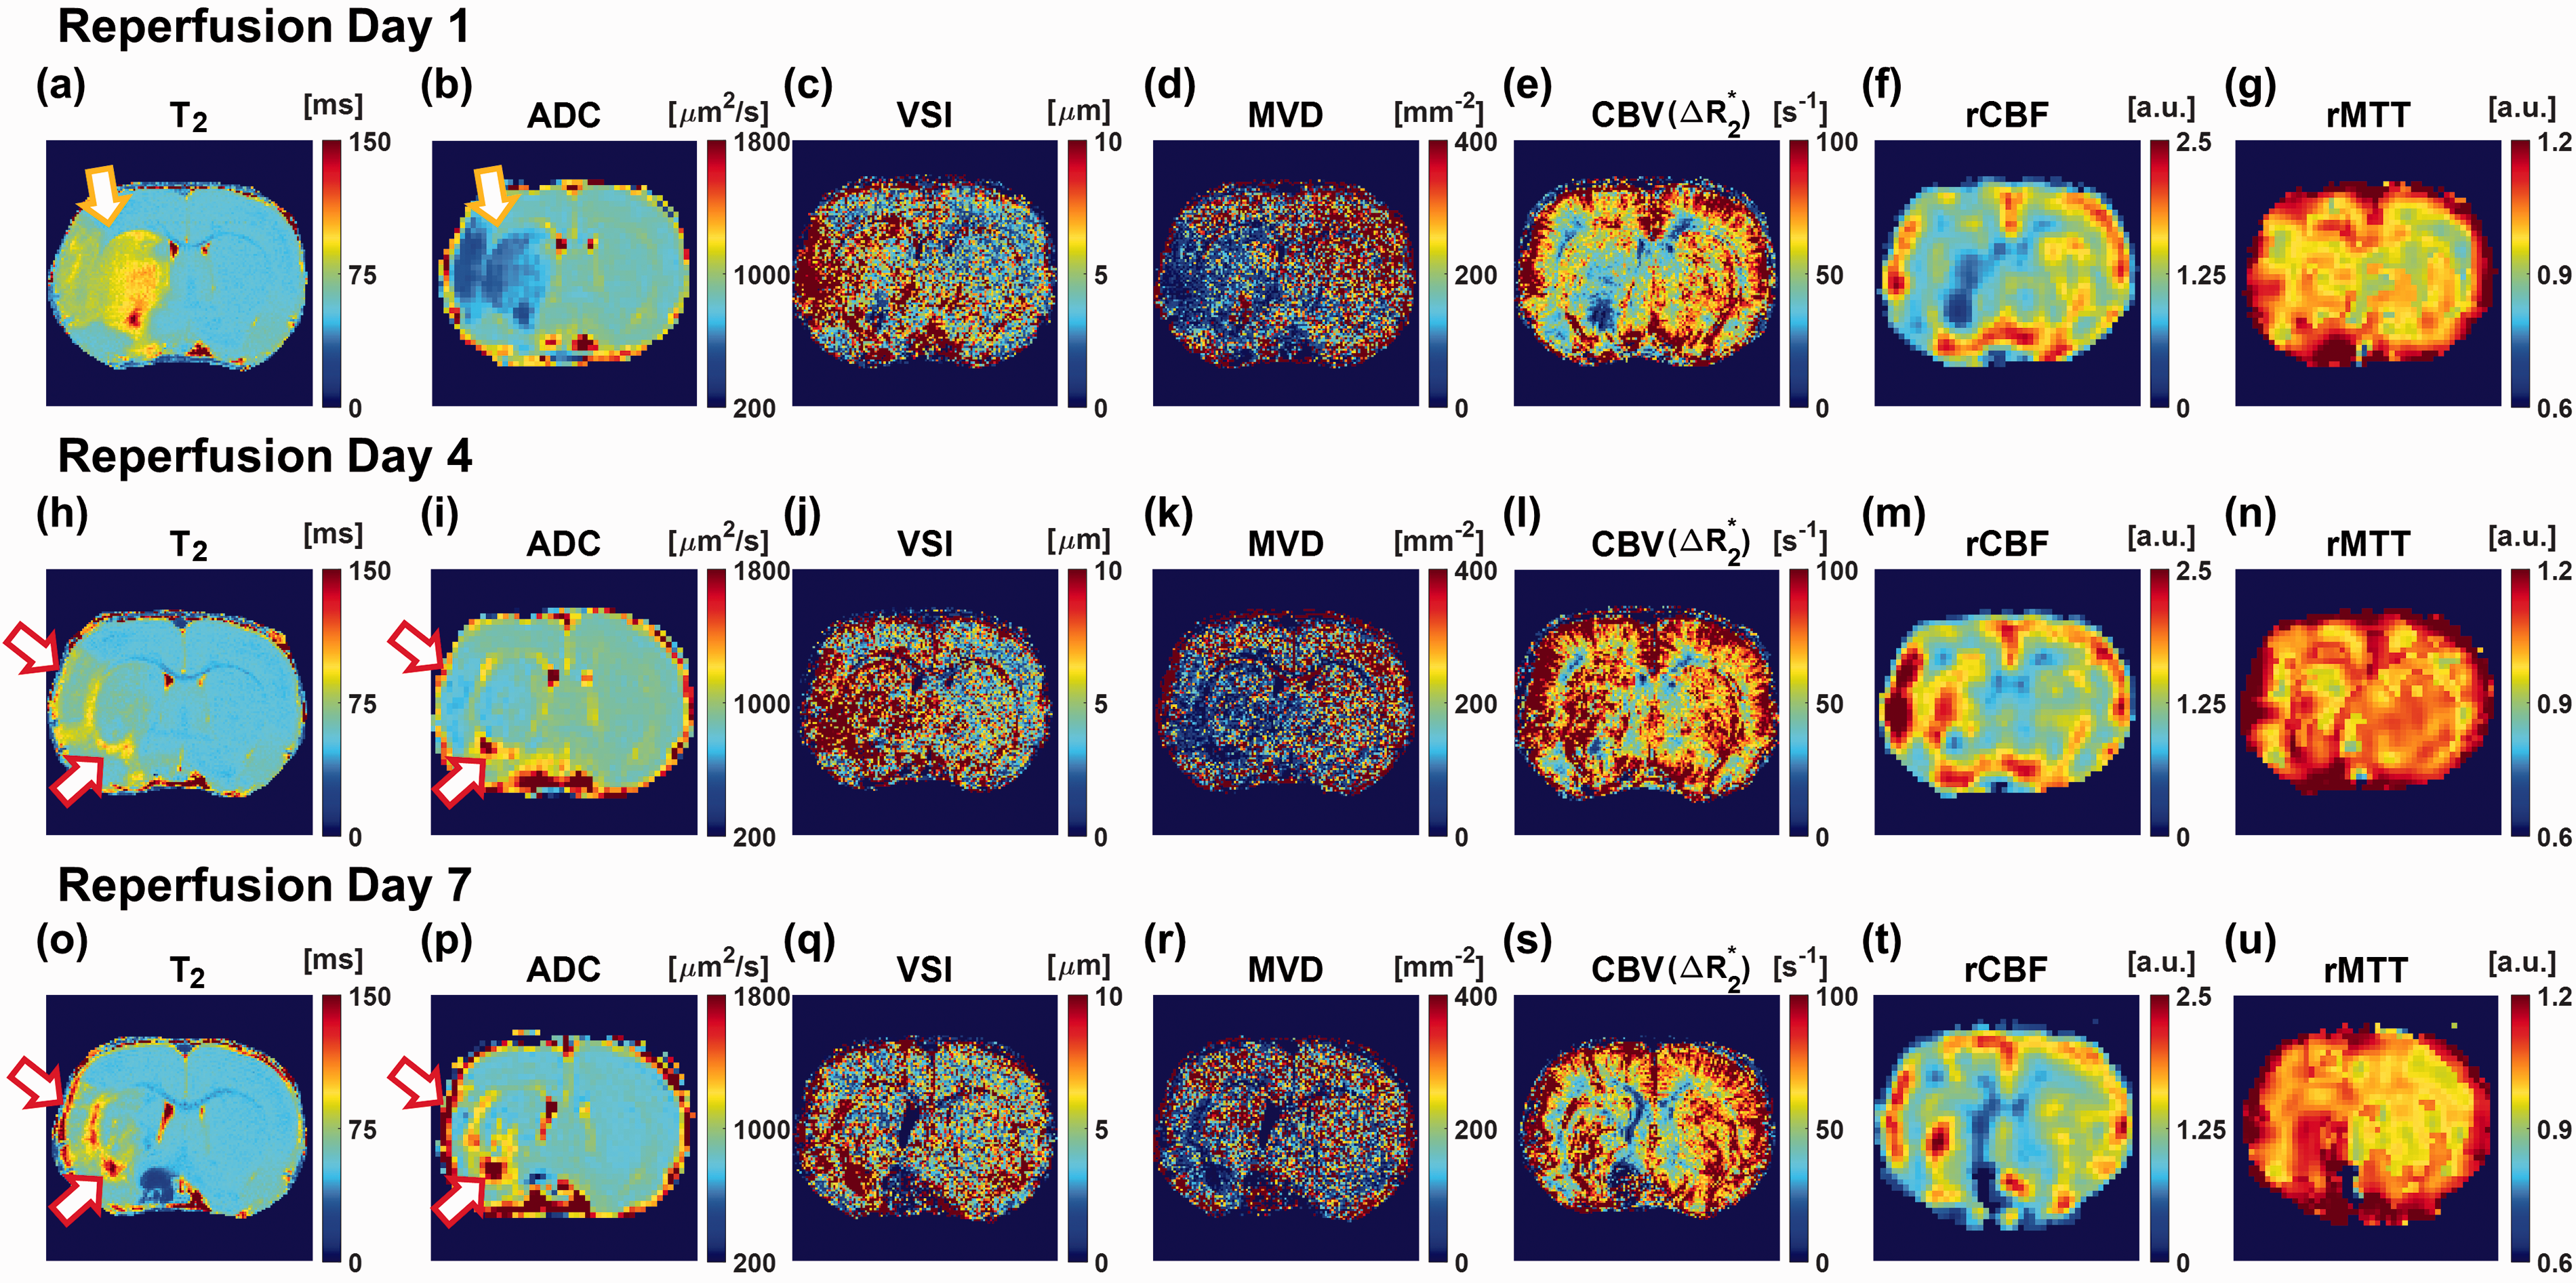
The representative lesion tissue status, as well as morphological and functional microvascular remodeling maps of one tMCAO rat model. (a–u) Longitudinally (at reperfusion days 1, 4, and 7) acquired lesion tissue status related T2 and ADC maps, morphological microvascular remodeling related VSI and MVD maps, and functional microvascular remodeling related CBV, rCBF, and rMTT maps of one tMCAO rat model. The yellow arrows indicate edema lesion and red arrows indicate early pseudo-normalization lesions.
ROI selection for early and typical pseudo-normalization lesions and the contralateral region
According to the ADC maps, typical pseudo-normalization, early pseudo-normalization lesions, and the contralateral region were selected and segmented, as shown in Figure 3. To cover whole-brain cerebral edema, three or four slices of each ADC map were used. At reperfusion day 1, ADC values under 650
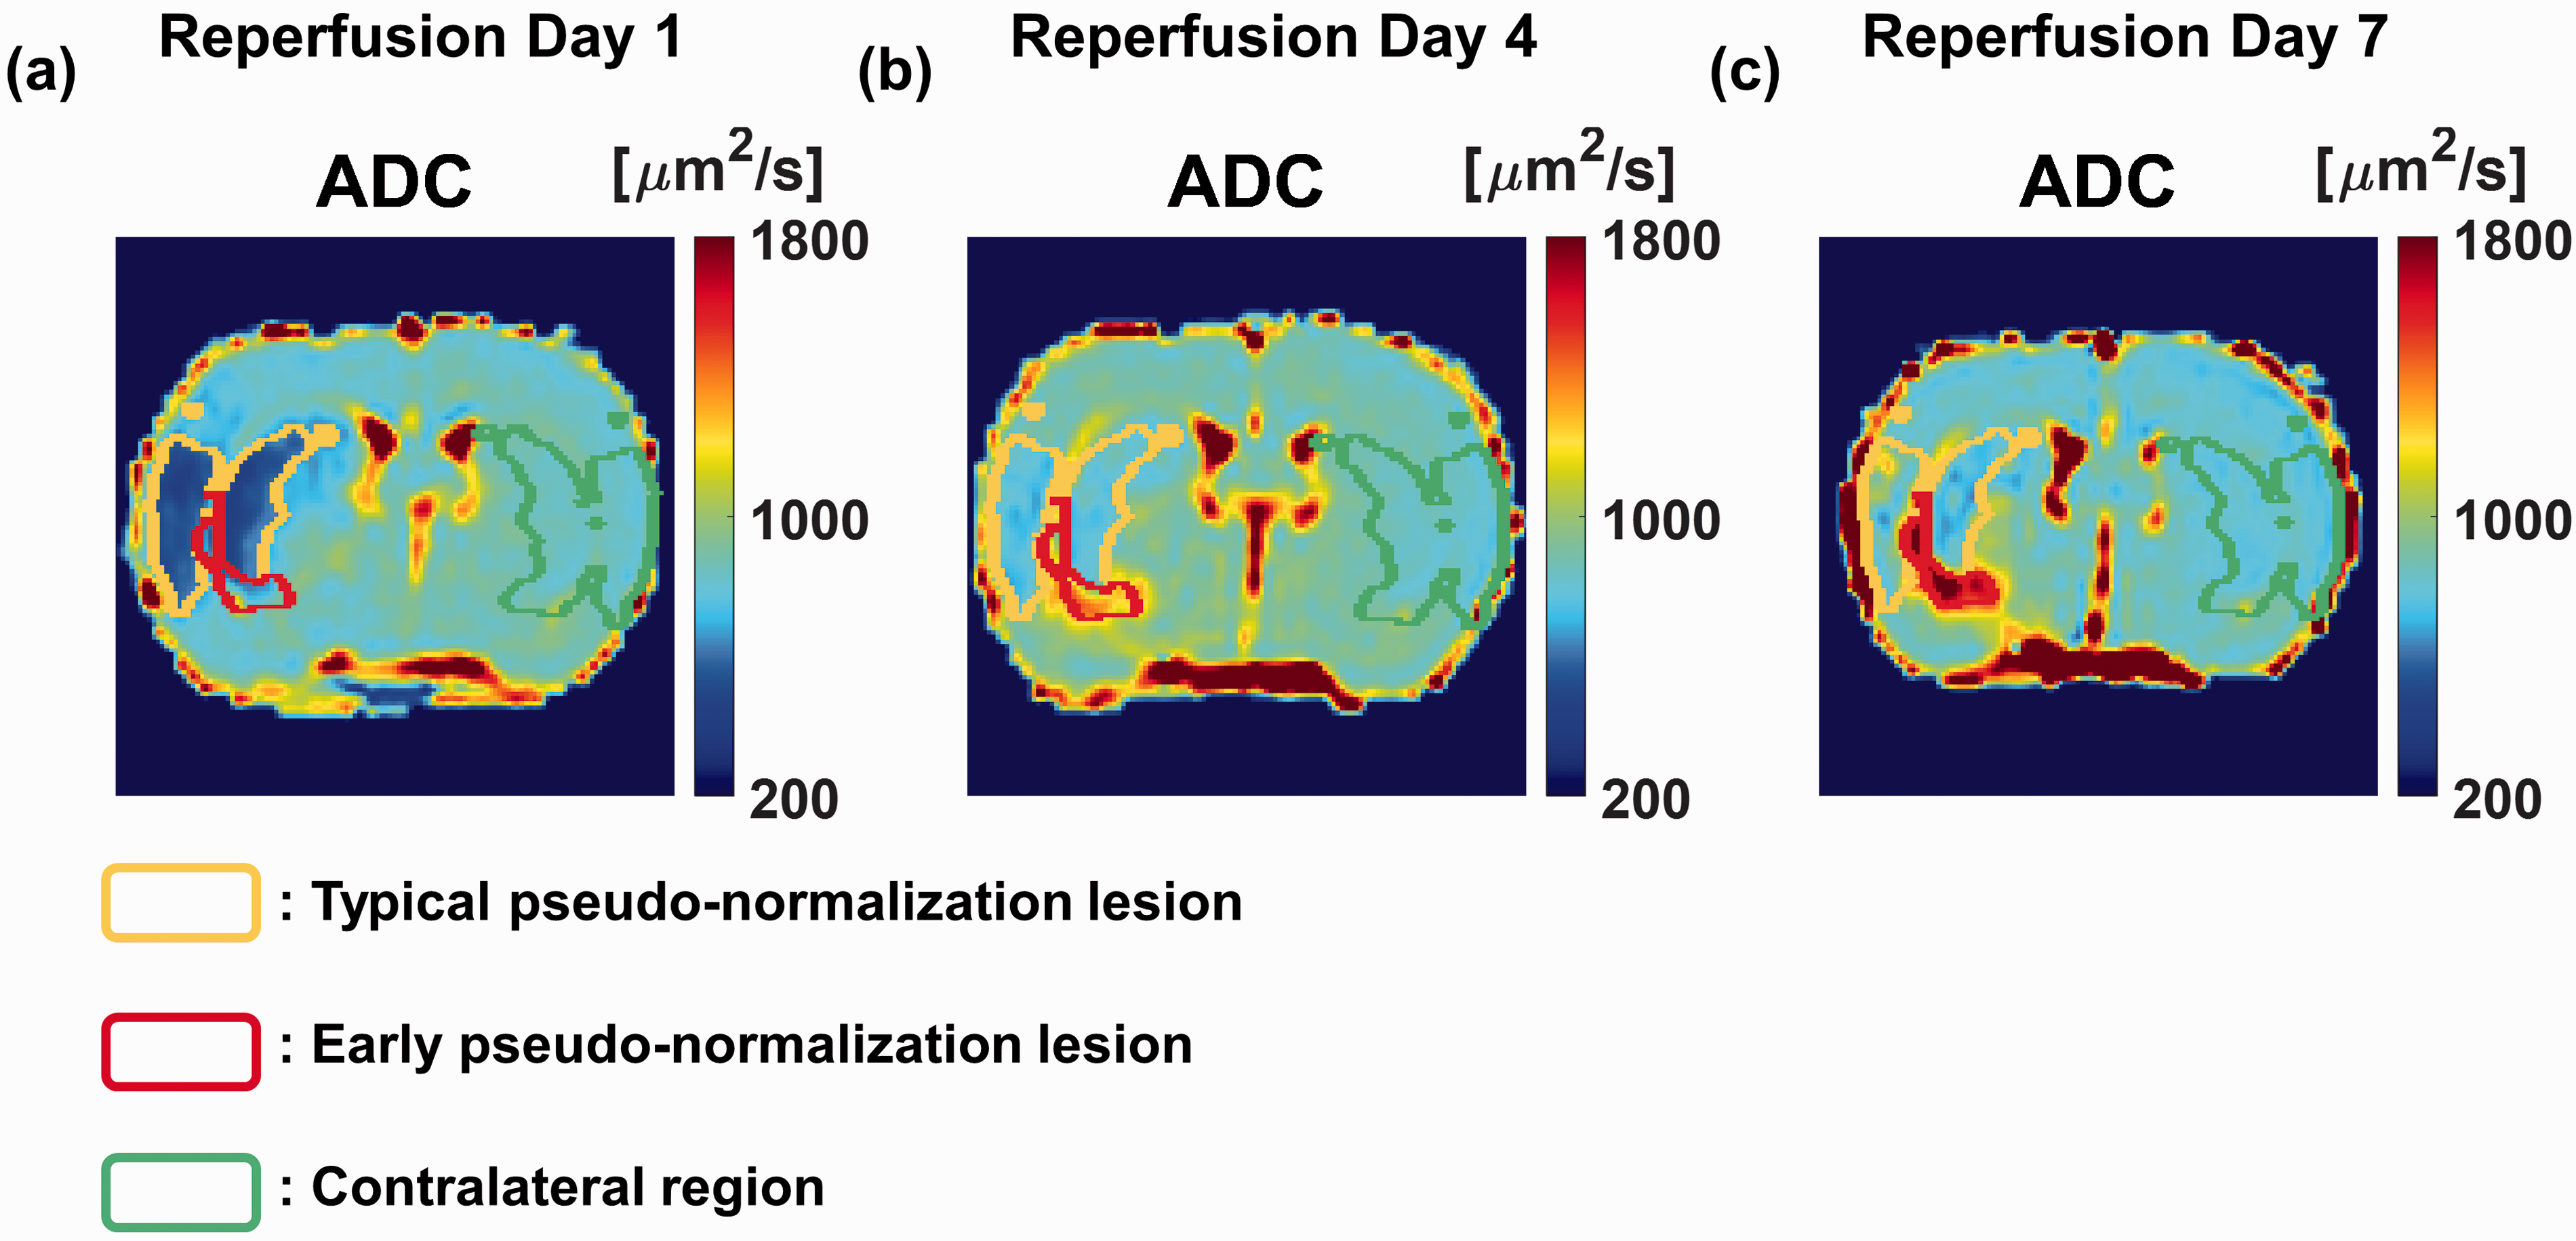
Respective ROIs for a typical pseudo-normalization lesion, early pseudo-normalization lesion, and contralateral region. (a–c) Selected ROIs for the typical pseudo-normalization lesion (yellow boundary lines, ADC < 650
Comparisons of the morphological and functional microvascular remodeling
Next, a total of 33 cases of each of the ADC, T2, and morphological and functional microvascular parameters were longitudinally (reperfusion day 1, 4, and 7) mapped for the 11 tMCAO rat models. Their median values were compared among the three ROIs, that is, typical and early pseudo-normalization lesions and the contralateral region. Figure 4 shows violin plots (distributions, median values, and interquartile ranges) of the edema status (ADC and T2), as well as the morphological (VSI and MVD) and functional (CBV, rCBF, and rMTT) microvascular alterations of typical (blue) and early (red) pseudo-normalization lesions according to reperfusion days 1, 4, and 7. The median values are connected with dashed lines to evaluate the trend of vascular remodeling. In addition, the median values of the contralateral regions are connected with solid lines (orange) as reference values. In ADC, early pseudo-normalization lesions exhibited a median ADC value comparable to that of the contralateral region around reperfusion day 2, while typical pseudo-normalization lesions displayed it around reperfusion day 7 (Figure 4(a)). Elevated median T2 values in typical and early pseudo-normalization lesions decreased over time (Figure 4(b)), except that early pseudo-normalization lesions showed increasing median T2 values as reperfusion continued from day 4 to 7. For morphological microvascular alterations, early pseudo-normalization lesions showed higher median VSI values than typical pseudo-normalization lesions at reperfusion days 4 and 7, while similar values were observed at reperfusion day 1 (Figure 4(c)). In addition, early pseudo-normalization lesion showed increased macrovascular diameter in UTE-MRAs compared to typical pseudo-normalization lesion as shown in Supplementary Figure 1. In Supplementary Figure 1(q) and (r), the estimated cRHV diameters are shown as bar graphs. Both of the tMCAO rat models showed no significant alteration of cRHVs in the contralateral regions (orange) as reperfusion continued until day 7. In typical pseudo-normalization lesion, enlarged cRHV at reperfusion day 4 decreased at reperfusion day 7, indicating normalization of the macrovasculature (blue). However, in early pseudo-normalization lesion, enlarged cRHV at reperfusion day 4 did not significantly decrease at reperfusion day 7 compared to typical pseudo-normalization lesions (red). Early pseudo-normalization lesions showed lower median MVD values than typical pseudo-normalization lesions at all reperfusion days (Figure 4(d)). However, typical pseudo-normalization lesions showed increased median MVD values as reperfusion continued from day 4 to 7, while early pseudo-normalization lesions showed persistently lowered median MVD values. For functional microvascular alterations, early pseudo-normalization lesions showed higher median CBV and rCBF values than typical pseudo-normalization lesions at reperfusion days 4 and 7 (Figure 4(e) and (f), respectively). Early pseudo-normalization lesions showed higher median rMTT values than typical pseudo-normalization lesions at all reperfusion days (Figure 4(g)). As reperfusion continued from day 4 to 7, the median values of rMTT in early pseudo-normalization lesions became further elongated. For detailed distribution comparisons between typical pseudo-normalization lesions and contralateral regions, violin plots are shown in Supplementary Figure 2. After Anderson-Darling tests for normal distribution decision, all Mann-Whitney U tests showed significant differences between typical pseudo-normalization and early pseudo-normalization lesions (p < 0.01) except for T2 and VSI at reperfusion day 1 (p = 0.371 and p = 0.947, respectively).
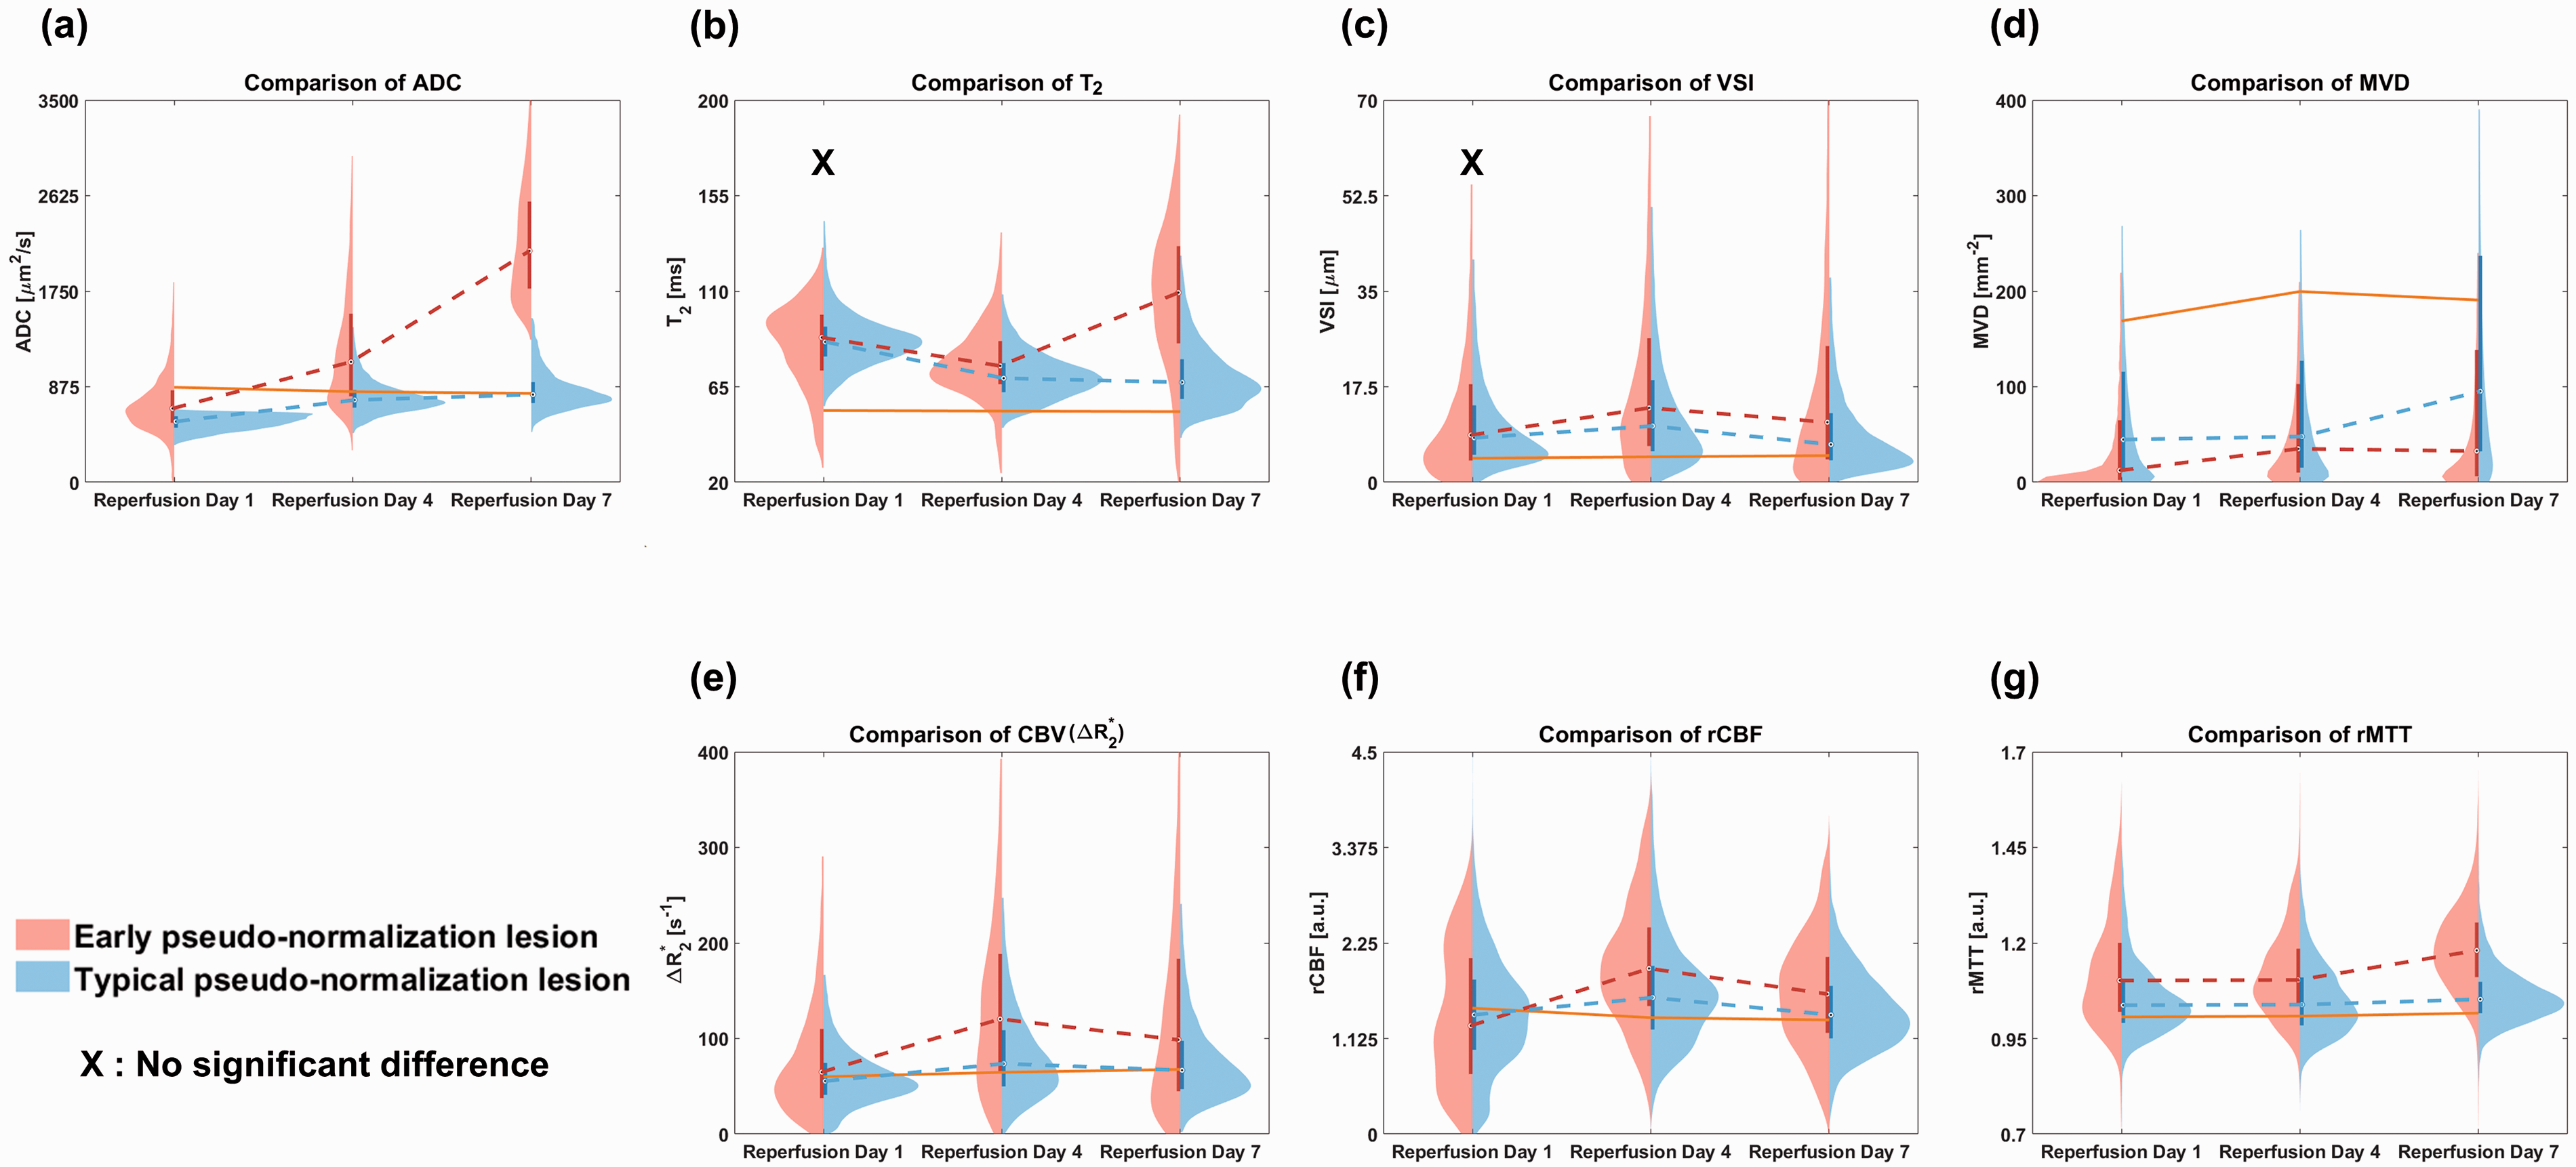
Violin plots of the lesion tissue status as well as morphological and functional microvascular remodeling. (a–g) Violin plots (distributions, median values, and interquartile ranges) of the lesion tissue status related ADC and T2, morphological microvascular remodeling related VSI and MVD, and functional microvascular remodeling related CBV, rCBF, and rMTT in typical pseudo-normalization (blue) and early pseudo-normalization (red) lesions at reperfusion days 1, 4 and 7. The solid orange lines indicate the connected median values of the contralateral regions. The median values of each typical pseudo-normalization and early pseudo-normalization lesion were connected with dashed lines as reperfusion continued from days 1 to 7. The X marks indicate that no significant difference between typical and early pseudo-normalization lesions was found in the statistical analysis (T2 and VSI at reperfusion day 1, p = 0.371 and p = 0.947 from the Mann-Whitney U tests, respectively).
Correlations between the VSI versus rCBF and the MVD versus rMTT
Scatter plots of the VSI versus rCBF for hyperperfused and the MVD versus rMTT for transit-delay regions are shown in Figure 5 to investigate the relationships between morphological and functional microvascular parameters. The results especially link hyperperfusion versus vessel size and delayed transit time versus vessel density. Individual median VSI, rCBF, MVD, and rMTT values were acquired from three ROIs (typical pseudo-normalization, early pseudo-normalization lesions, and the contralateral region) of each tMCAO rat model for each reperfusion day and are shown in a scatterplot in Figure 5(a) and (b) (cases with hyperperfusion (a) and delayed transit time (b) were considered). Subsequently, the group median VSI, rCBF, MVD, and rMTT values of all tMCAO rat models were scatter-plotted, as shown in Figure 5(c) and (d). The group median values of typical pseudo-normalization (triangle) and early pseudo-normalization (star) lesions were separately included in scatterplots. After Anderson-Darling tests for normal distribution decision, an individual comparison of the VSI and rCBF showed a positive correlation (r = 0.454, p < 0.001 from paired student’s t-test) (Figure 5(a)), while the group comparison showed a strong positive correlation (r = 0.92, p < 0.001 from paired student’s t-test) (Figure 5(c)). Increased vessel size appears to be related to observed hyperperfusion in subacute ischemic lesions. On the contrary, an individual comparison of the MVD and rMTT showed a negative correlation (r = −0.415, p < 0.001 from Wilcoxon signed-rank test) (Figure 5(b)), and the group comparison also showed a negative correlation (r = −0.477, p = 0.012 from paired student’s t-test) (Figure 5(d)). Individual comparison of the MVD and rMTT (blue circles) showed a much higher correlation at reperfusion day 7 than that at reperfusion days 1 (red circles) and 4 (green circles) with r = -0.604 and p < 0.001 from Wilcoxon signed-rank test (inset figure of Figure 5(b)). This was presumably due to the distinct differences in the MVD and rMTT between early and typical pseudo-normalization lesions at reperfusion day 7. In addition, from the group median comparison, increasing rMTT values were pair-wisely observed for early pseudo-normalization lesions with decreasing MVD values compared to those of typical pseudo-normalization lesions for each reperfusion day.
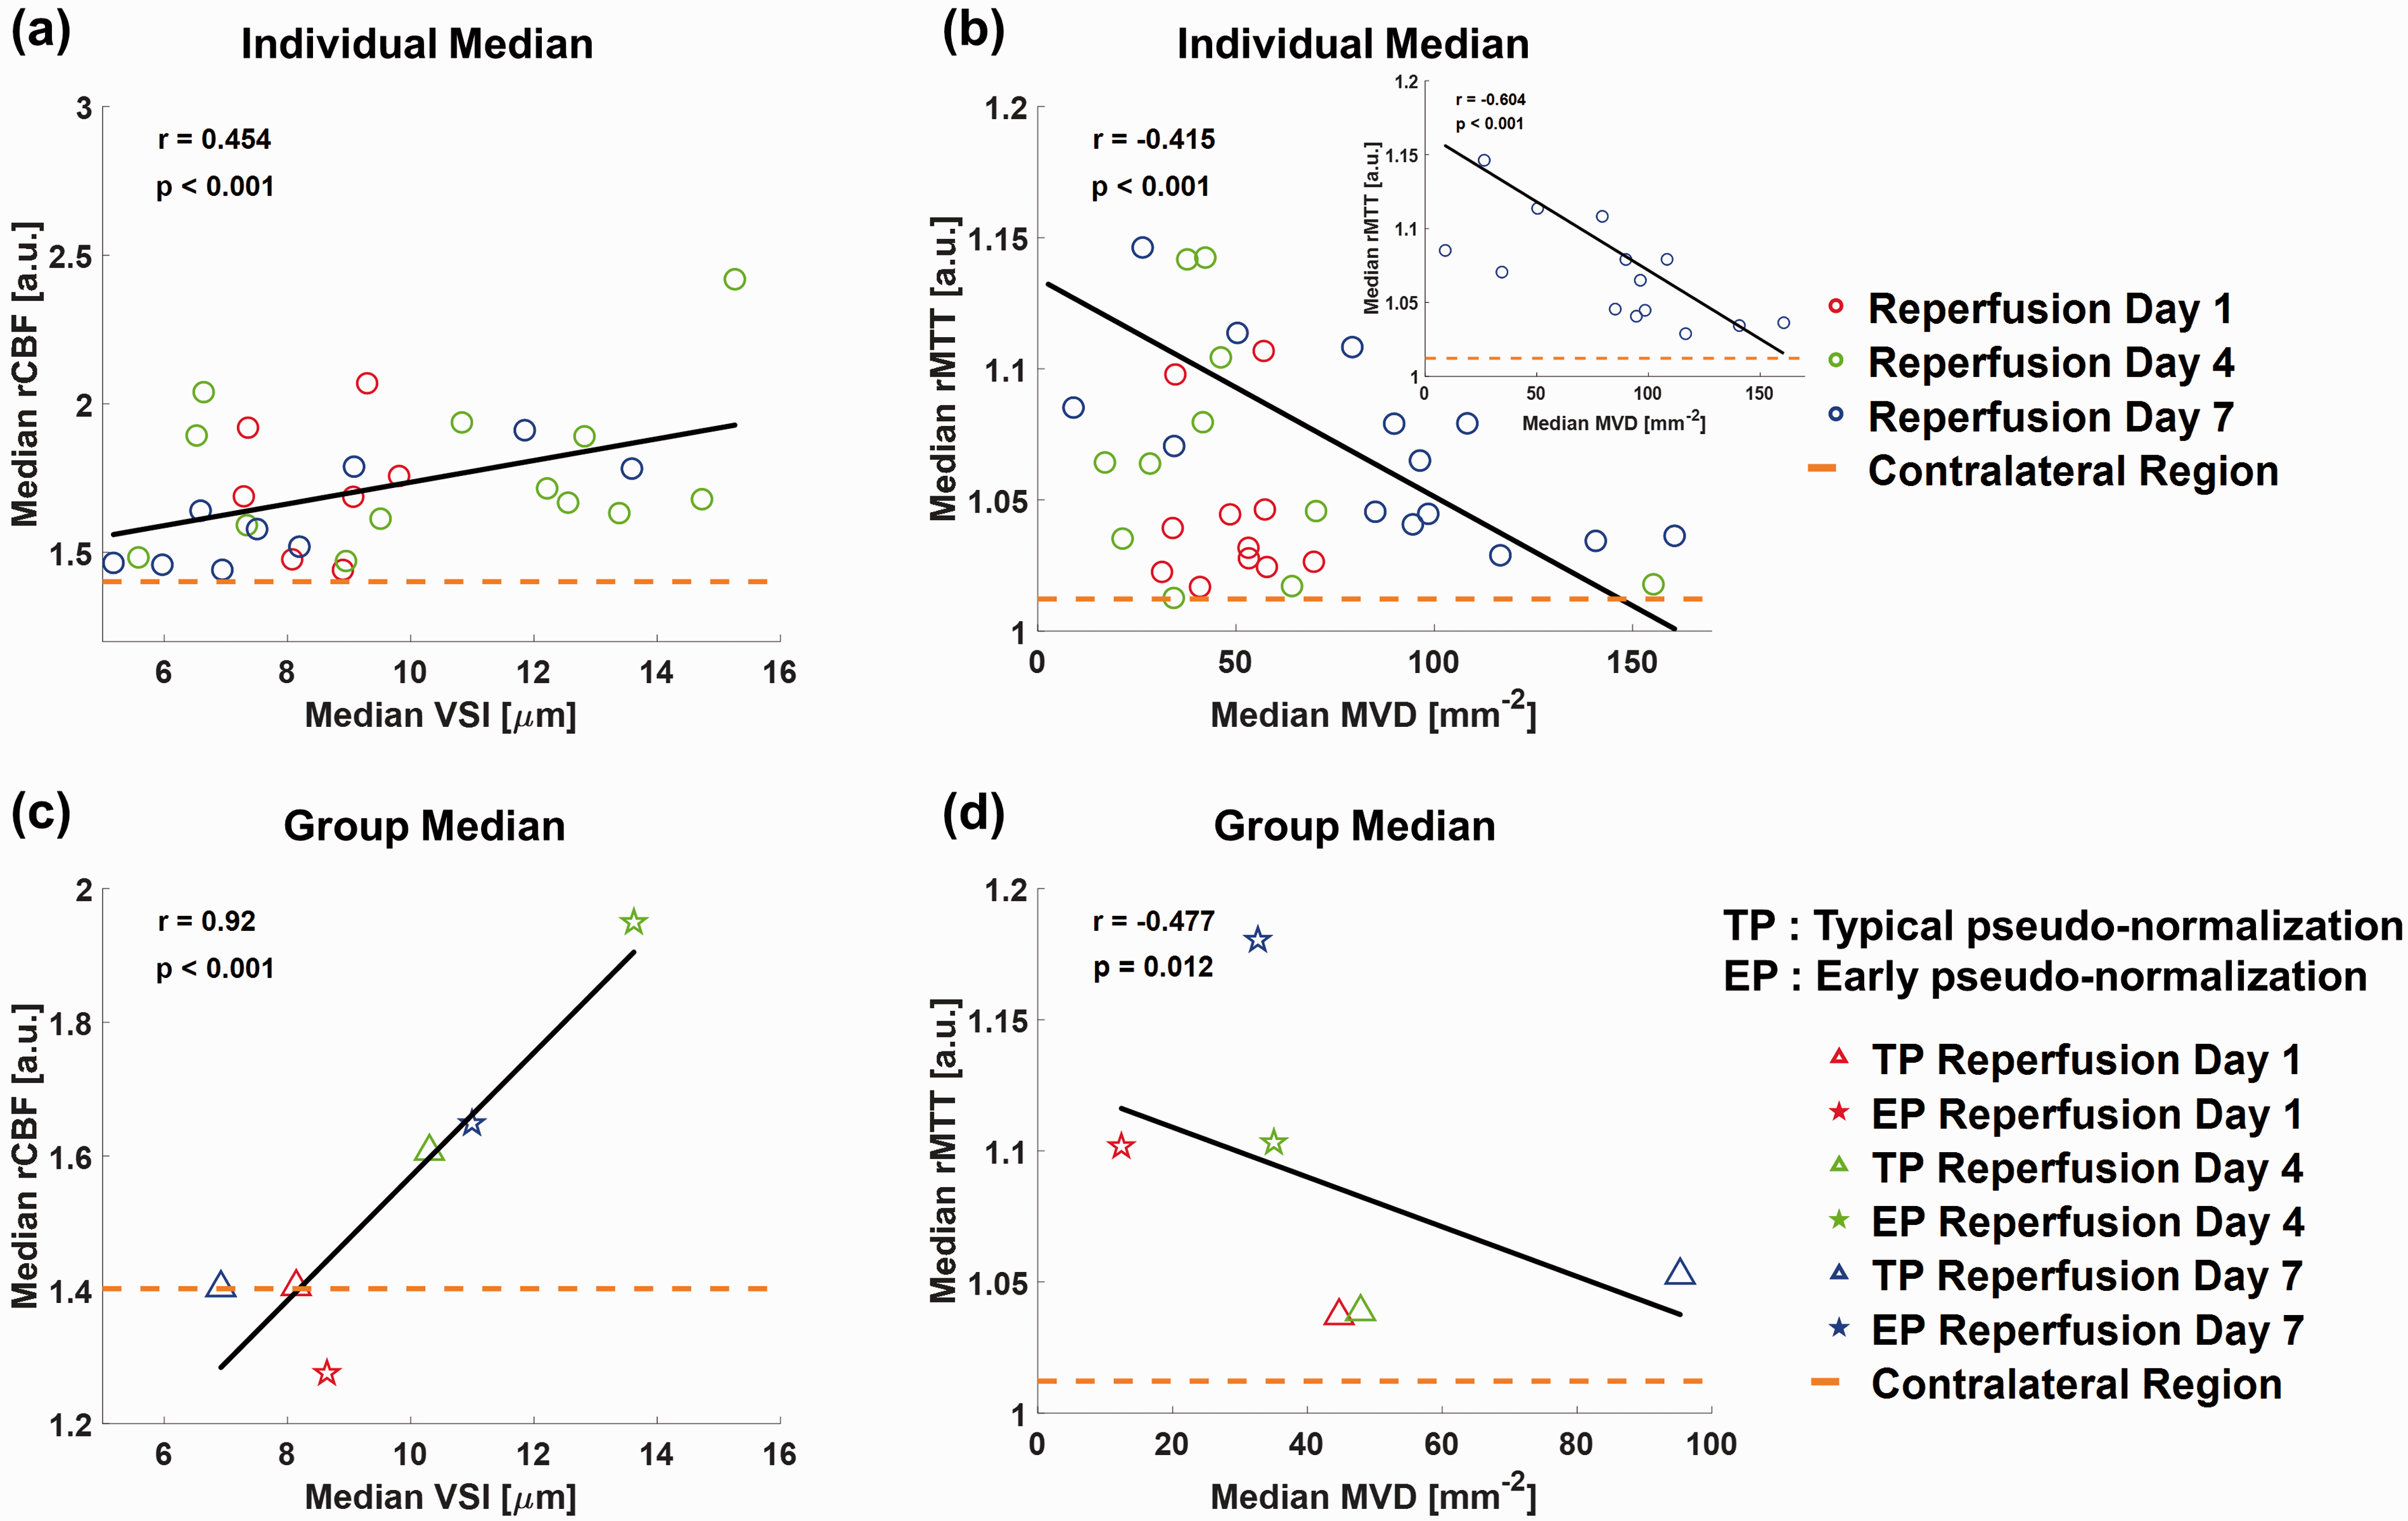
Correlations between the VSI versus rCBF and the MVD versus rMTT. (a, b) Scatter plots of the median rCBF and rMTT values over the averaged median rCBF and rMTT values in the contralateral regions of each tMCAO rat model with the corresponding median VSI and MVD values according to reperfusion day 1 (red circles), 4 (green circles), and 7 (blue circles). (inset figure of (b)) Scatter plot of MVD and rMTT at reperfusion day 7. Correlation coefficient r = 0.454, r = −0.415, and r = −0.604 and p-values < 0.001 from the paired student’s t-test and Wilcoxon signed-rank tests, respectively. (c, d) Scatter plots of the median VSI versus rCBF and the MVD versus rMTT values of typical pseudo-normalization (triangle) and early pseudo-normalization lesions (star) from all tMCAO rat models according to reperfusion day 1 (red), 4 (green), and 7 (blue). Correlation coefficient r = 0.92 and r = −0.477 and p < 0.001 and p = 0.012 from the paired student’s t-tests, respectively. The black solid lines indicate the fitted lines. The orange dashed lines indicate the average median rCBF and rMTT values of the contralateral regions.
Comparisons of the MRI- and LSFM-derived microvascular parameters
To validate the microvascular parameters of the VSI, MVD, and CBV (
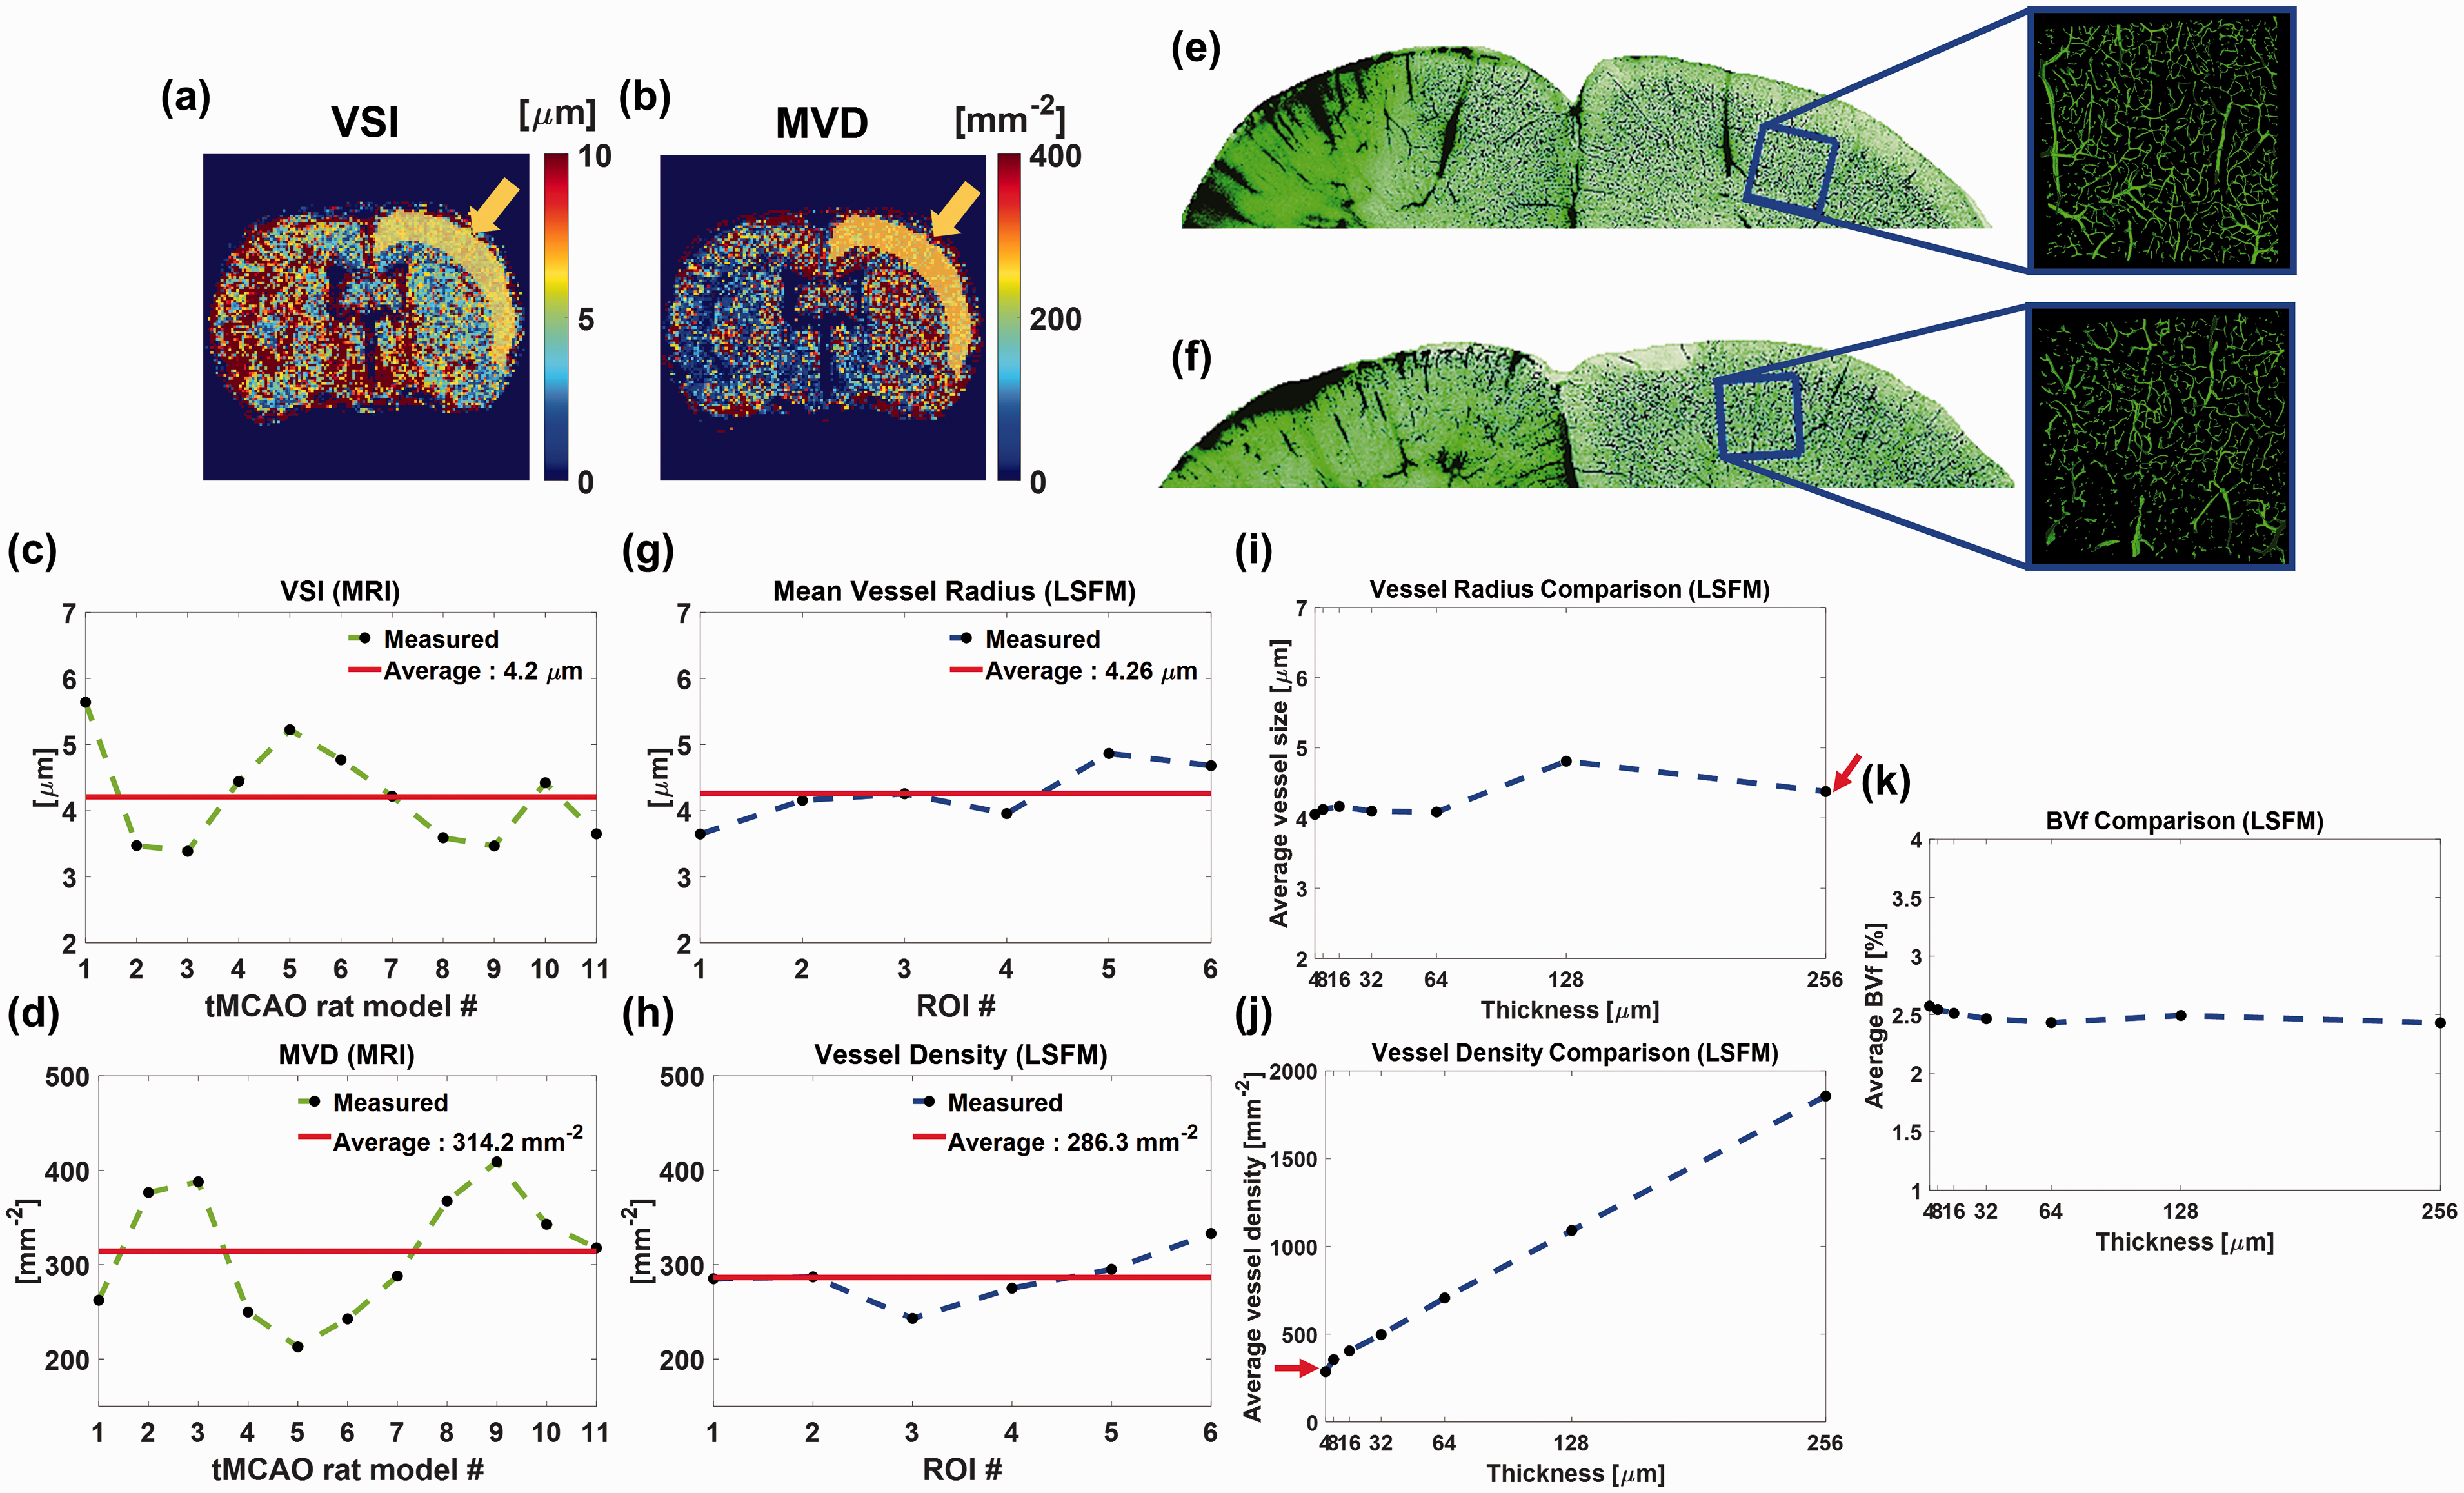
Quantitative comparisons of the MRI- and LSFM-derived vessel size and vessel density in the contralateral cortex regions. (a, b) Exemplar VSI and MVD maps at reperfusion day 7. The yellow arrows and overlapped yellow regions in each map indicate the segmented ROI in the contralateral cortex region for comparison. (c, d) Plots of the MRI-derived median VSI and MVD values in the contralateral cortex region for each tMCAO rat model. (e, f) MIP images of 64
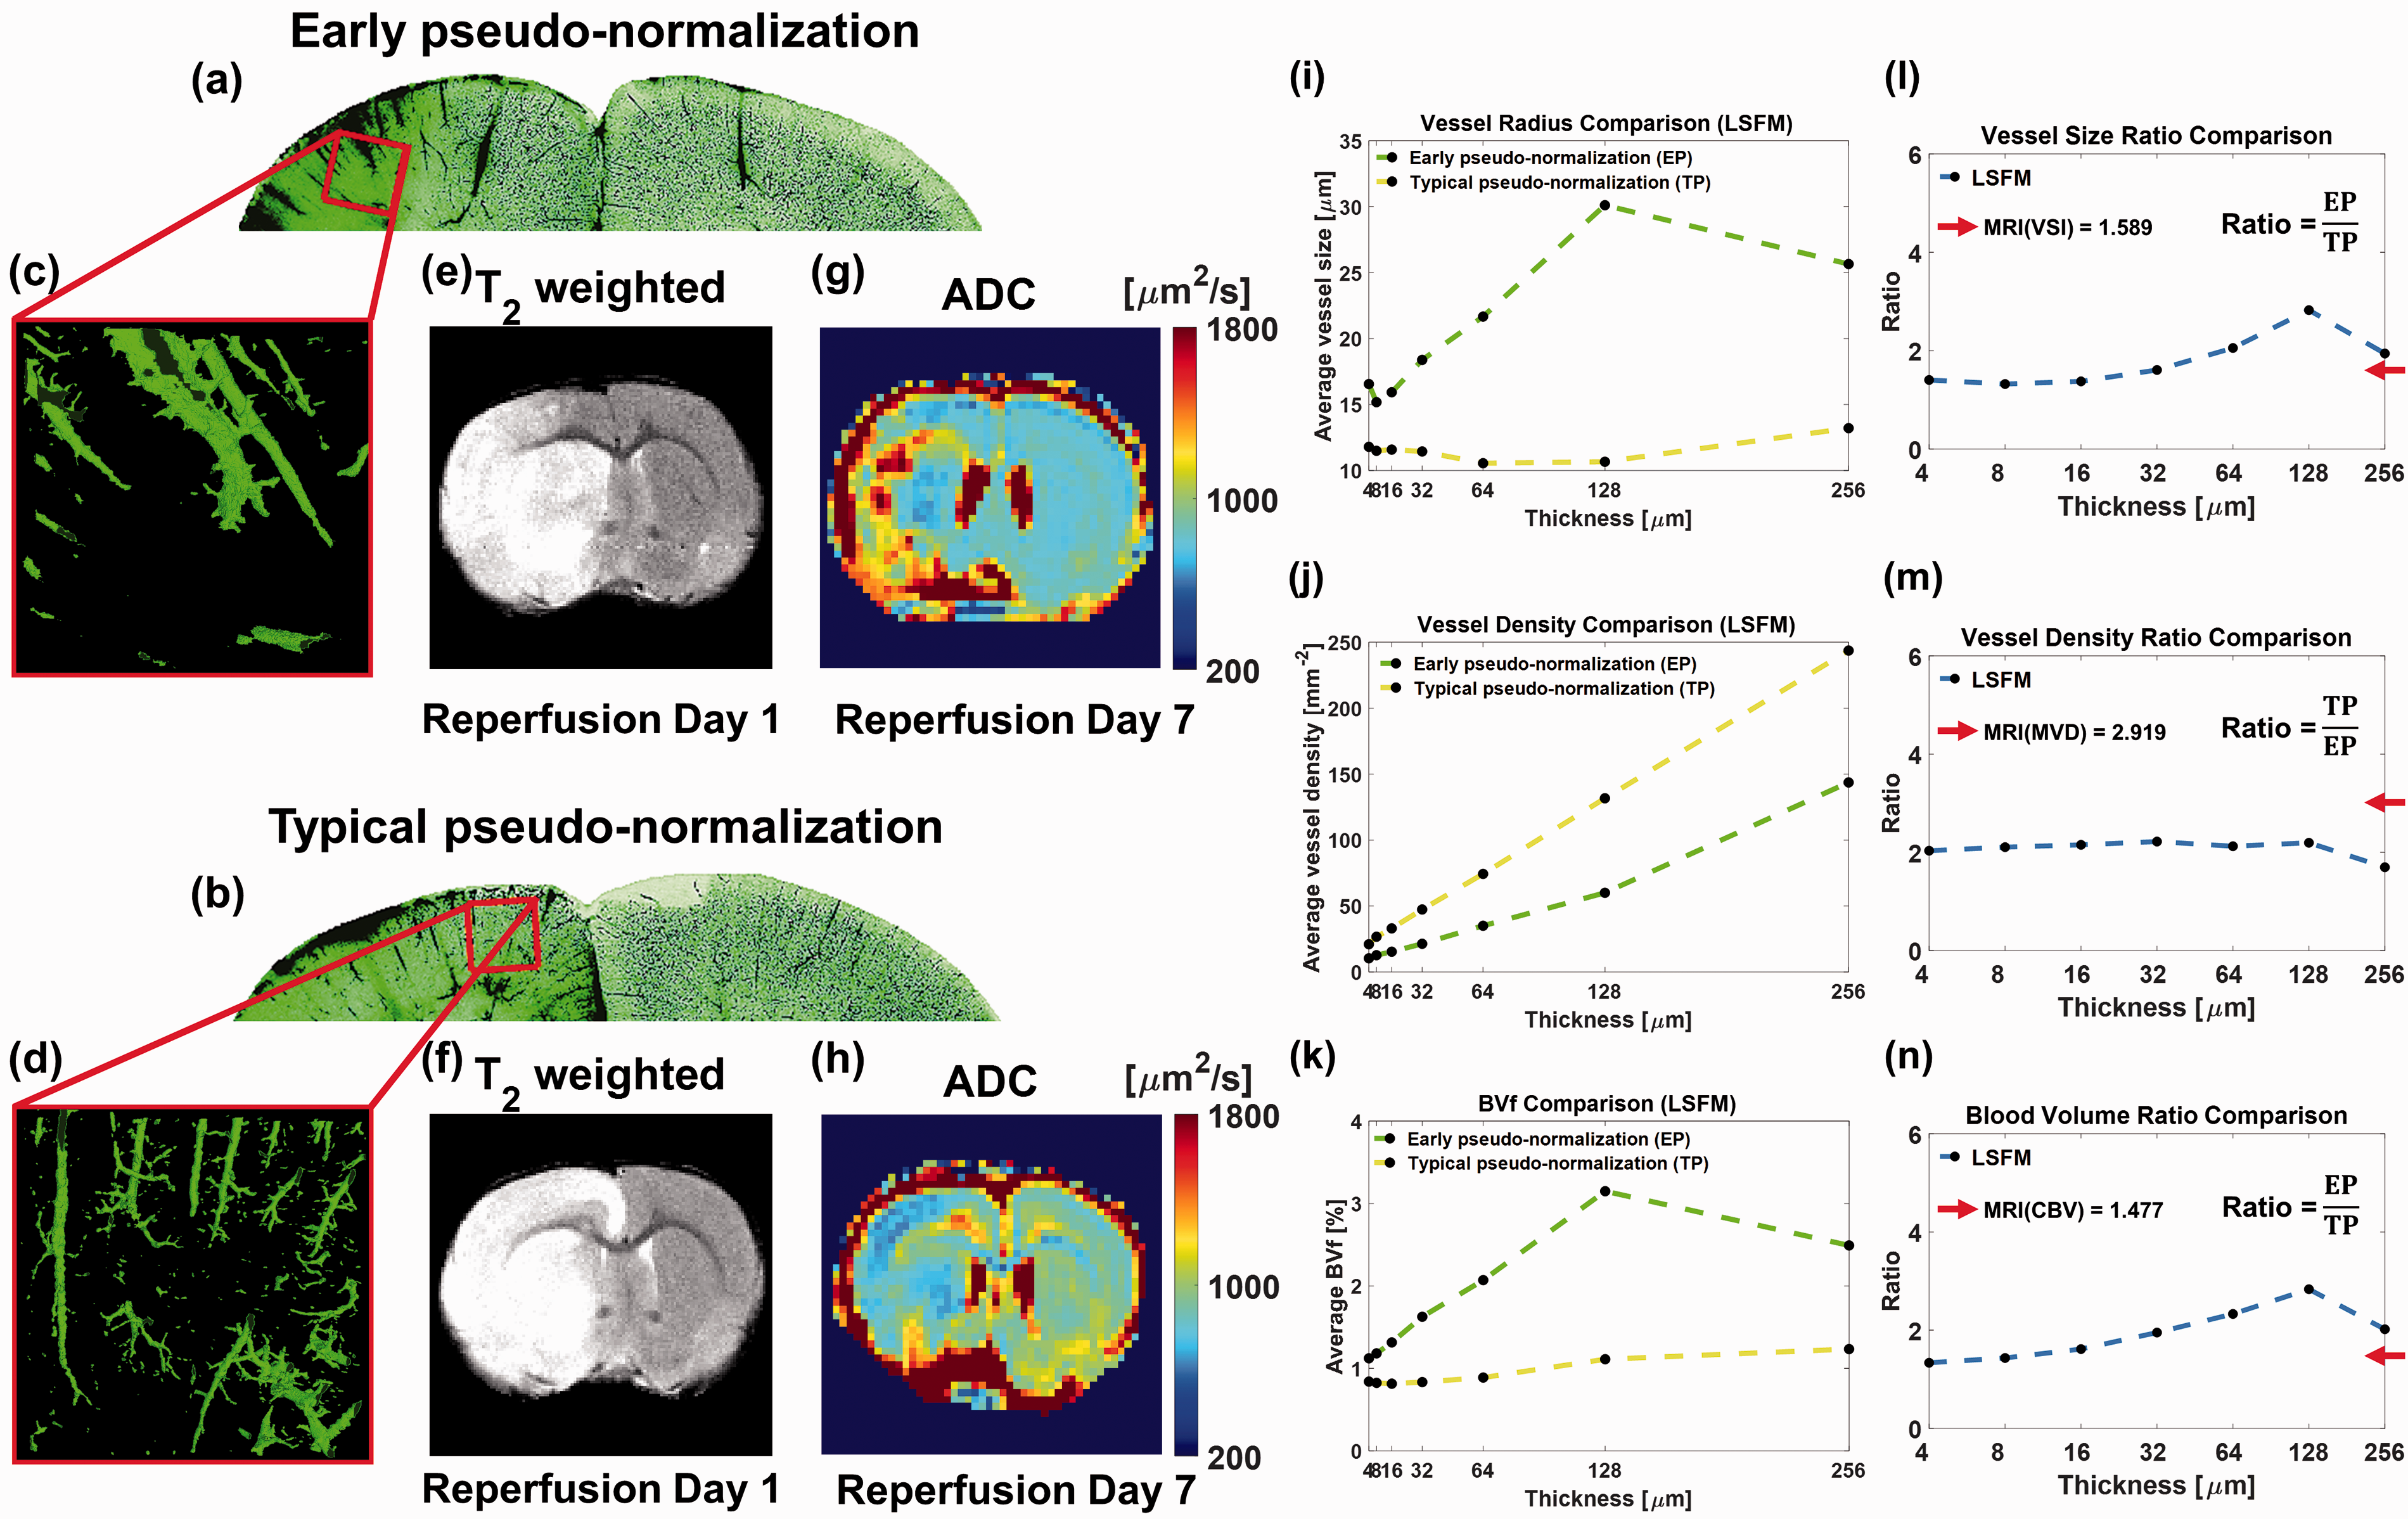
Quantitative comparisons of the MRI- and LSFM-derived vessel size, vessel density, and blood volume in the ipsilateral cortex lesions. (a, b) MIP images of 64
MRI-derived morphological microvascular parameters of the VSI and MVD values in the contralateral cortex regions were acquired through six slices at reperfusion day 7 for each tMCAO rat model, and an exemplar ROI is shown as a yellow region overlapped on the VSI and MVD maps, as shown in Figure 6(a) and (b), respectively. The median values of the VSI and MVD of each tMCAO rat model are shown as green dashed lines in Figure 6(c) and (d), respectively, for 11 cases. The red lines show the averaged VSI and MVD values of 11 tMCAO rat models, which are 4.2
Next, the ipsilateral cortex lesions of two representative cases were compared, as shown in Figure 7. MIP images of 64
Fluorescence images acquired using a fluorescence stereo zoom microscope (without tissue clearing) also verified morphological microvascular remodeling differences between early and typical pseudo-normalization lesions, as shown in Supplementary Figure 5. Supplementary Figure 5(g), (i), (h), and (j) show zoomed-in images of ROIs in typical pseudo-normalization lesion (blue box), early pseudo-normalization lesion (red box), and contralateral regions (orange boxes), respectively. The zoomed-in images show increased vessel size and decreased vessel density in early pseudo-normalization lesion compared to typical pseudo-normalization lesion.
Discussion
After a week of reperfusion, tMCAO rat models showed typical pseudo-normalization lesions in the ADC maps. However, there were spatiotemporally different lesions showing early pseudo-normalization of the ADC before then. Accordingly, typical pseudo-normalization and early pseudo-normalization lesions were separately investigated using the edema status (ADC and T2), and morphological (VSI and MVD), and functional (rCBF and rMTT) vascular remodeling longitudinally. It should be noticed that focal brain ischemia was systematically induced without monitoring of sequential ADC or CBF, which may result in potential bias to acquired data because of inconsistently occluded MCA. At reperfusion day 1, the tMCAO rat model showing no edema lesion in T2-weighted image and/or ADC map was excluded from this study. Although heterogeneous morphological and functional microvascular remodeling were observed, correlative responses between them during the progression of ischemic stroke have not been well established. In a clinical study, hyperperfusion was observed after recanalization, and there is controversy regarding its effectiveness in hyperperfusion. Some cerebral hemodynamic studies have reported that hyperperfusion is a sign of successful recanalization with better clinical outcomes,40–43 while others have reported that hyperperfusion is correlated with hemorrhagic transformation. 40 , 44 , 45 It should be considered that in this study, early pseudo-normalization lesions showed higher rCBF values compared to typical pseudo-normalization lesions. As early pseudo-normalization lesions have a dominance of vasogenic edema, such lesions are more likely to accompany the damaged blood-brain barrier. Thus, hyperperfusion observed in the subacute stage requires cautionary interpretation. The relationship between vascular size and blood volume (flow) in the subacute stage is also informative. The morphological vascular alteration was observed to regulate the CBF, 46 , 47 and this study highlights that hyperperfusion in the subacute stage is driven by enlarged vessel size, even with reduced vessel density and delayed transit time. Besides hyperperfusion, delayed transit time was also observed in lesions. A previous study reported that the net extraction of oxygen negatively correlates with the capillary transit time and is limited mainly by capillary density. 48 The observed delayed transit time and low microvessel density may implicate delayed metabolism due to delayed oxygen and nutrient supply to the lesion. In addition, the association of delayed transit time with respect to low microvessel density provides insight into the role of capillaries in regulating (limiting) the CBF. Although confounding correlations may exist between morphological and functional microvascular remodeling, this result emphasizes the importance of monitoring morphological and functional vascular remodeling after ischemic stroke. Further investigation of vascular remodeling and lesion tissue status is required to estimate the recovery or progression of ischemic stroke in the acute stage.
It is important to emphasize that early pseudo-normalization lesions showed faster and more extensive expansion in the chronic stage. For example, in Supplementary Figure 6, two tMCAO rat models showed different vasogenic edema dominancy in lesions at reperfusion day 7 (Supplementary Figure 6(e) and (f)). A tMCAO rat model showing extensive vasogenic edema dominant and early pseudo-normalization lesion at reperfusion day 7 displayed much faster expansion of early pseudo-normalization lesions at the chronic stage (reperfusion days 16 and 25), as shown in Supplementary Figure 6(g) to (j). In connection with the aggravation of early pseudo-normalization lesion, unnormalized morphological and functional vascular remodeling were observed compared to those of typical pseudo-normalization lesion. This emphasizes the necessity to characterize the lesions of early pseudo-normalization in the early subacute stages. This study observed that reduced MVD and elongated rMTT values were more discriminative factors of early pseudo-normalizations lesions at reperfusion day 1 than conventional ADC and T2 values, as shown in Figure 4 at reperfusion day 1. Interquartile ranges of MVD and rMTT in early pseudo-normalization lesion showed the most conspicuous difference compared to those of typical pseudo-normalization lesion except for the ADC whose interquartile range of early pseudo-normalization lesion is close to the median value of the contralateral region. Therefore, it can be difficult to distinguish early pseudo-normalization lesion from normal tissue at reperfusion day 1 with ADC values alone. However, in the early pseudo-normalization lesion, CBV and rCBF showed more conspicuous alterations compared to rMTT in Figure 4, which required further investigation regarding their association with edema progression. Also, further investigation of CBV and rCBF as discriminative factors for differentiating early pseudo-normalization lesions from typical pseudo-normalization lesions may be useful. As the two lesions showed different tendencies for vascular remodeling and edema progressions, assessing morphological and functional vascular remodeling in both edema lesions up to the chronic stage could provide more accurate diagnostic and therapeutic information of ischemic stroke.
To validate MRI-derived microvascular remodeling related to the VSI, MVD, and CBV, 3-dimensional LSFM images were acquired and analyzed. In the contralateral cortex regions, the MRI- and LSFM-derived vessel size (4.2
It is also noteworthy that the acquisition of LSFM images may be affected by the status of tissue clearing. Although the contralateral region showed complete tissue clearing status, ipsilateral lesions in both tMCAO rat models may not be perfectly cleared due to different tissue conditions than that of the contralateral region, which can induce bias for the absolute quantification of the vessel radius, vessel density, and blood volume. However, the ratio of vascular parameters appears to maintain close resemblance with respect to MRI measurements, which minimizes the clearing issues. In addition, the UTE-MRAs and fluorescence stereo zoom microscope image of two tMCAO rat models (without tissue clearing) showed an enlarged vessel size and reduced vessel density for early pseudo-normalization lesions, which is consistent with tissue-cleared LSFM findings, as shown in Supplementary Figures 1 and 5. Establishing an optimization method for perfectly clearing ipsilateral ischemic lesions is necessary for the absolute quantification of microvascular alterations.
In this study, along with the tissue status, morphological and functional vascular remodeling were simultaneously visualized and quantitatively analyzed as reperfusion continued from day 1 to 7 (in the subacute stage). This enabled verification of contrasting vascular remodeling tendencies between early pseudo-normalization and typical pseudo-normalization lesions. Evaluation of both morphological and functional vascular remodeling in two spatiotemporally different lesions may help better inform clinical decision making on the prognosis and treatment of ischemic stroke in the subacute stage.
Supplemental Material
sj-pdf-1-jcb-10.1177_0271678X211029197 - Supplemental material for MRI investigation of vascular remodeling for heterogeneous edema lesions in subacute ischemic stroke rat models: Correspondence between cerebral vessel structure and function
Supplemental material, sj-pdf-1-jcb-10.1177_0271678X211029197 for MRI investigation of vascular remodeling for heterogeneous edema lesions in subacute ischemic stroke rat models: Correspondence between cerebral vessel structure and function by MungSoo Kang, Seokha Jin and HyungJoon Cho in Journal of Cerebral Blood Flow & Metabolism
Footnotes
Funding
The author(s) disclosed receipt of the following financial support for the research, authorship, and/or publication of this article: This work was supported by grants from the National Research Foundation of Korea from the Korean government (grant Nos. 2018R1A6A1A03025810, 2018M3C7A1056887), the 2021 Joint Research Project of the Institutes of Science and Technology, the Basic Science Research Program through the National Research Foundation of Korea (NRF), funded by the Ministry of Education (grant No. 2020R1A6A3A13076670), and the Korea Healthcare Technology R&D Project through the Korea Health Industry Development Institute (KHIDI), funded by the Ministry of Health & Welfare, Republic of Korea (grant No. HI14C1135).
Declaration of conflicting interests
The author(s) declared no potential conflicts of interest with respect to the research, authorship, and/or publication of this article.
Authors’ contributions
MSK and HJC designed the study. MSK collected the data. MSK and HJC analyzed the data. MSK and HJC wrote the manuscript. SHJ contributed to data interpretation and critical revisions of the manuscript.
Supplemental material
Supplemental material for this article is available online.
References
Supplementary Material
Please find the following supplemental material available below.
For Open Access articles published under a Creative Commons License, all supplemental material carries the same license as the article it is associated with.
For non-Open Access articles published, all supplemental material carries a non-exclusive license, and permission requests for re-use of supplemental material or any part of supplemental material shall be sent directly to the copyright owner as specified in the copyright notice associated with the article.