
Abstract
Quantitative [15O]H2O positron emission tomography (PET) is the accepted reference method for regional cerebral blood flow (rCBF) quantification. To perform reliable quantitative [15O]H2O-PET studies in PET/MRI scanners, MRI-based attenuation-correction (MRAC) is required. Our aim was to compare two MRAC methods (RESOLUTE and DeepUTE) based on ultrashort echo-time with computed tomography-based reference standard AC (CTAC) in dynamic and static [15O]H2O-PET. We compared rCBF from quantitative perfusion maps and activity concentration distribution from static images between AC methods in 25 resting [15O]H2O-PET scans from 14 healthy men at whole-brain, regions of interest and voxel-wise levels. Average whole-brain CBF was 39.9 ± 6.0, 39.0 ± 5.8 and 40.0 ± 5.6 ml/100 g/min for CTAC, RESOLUTE and DeepUTE corrected studies respectively. RESOLUTE underestimated whole-brain CBF by 2.1 ± 1.50% and rCBF in all regions of interest (range −2.4%– −1%) compared to CTAC. DeepUTE showed significant rCBF overestimation only in the occipital lobe (0.6 ± 1.1%). Both MRAC methods showed excellent correlation on rCBF and activity concentration with CTAC, with slopes of linear regression lines between 0.97 and 1.01 and R2 over 0.99. In conclusion, RESOLUTE and DeepUTE provide AC information comparable to CTAC in dynamic [15O]H2O-PET but RESOLUTE is associated with a small but systematic underestimation.
Introduction
Positron emission tomography (PET) using [15O]H2O has long been considered the accepted reference method to quantify regional cerebral blood flow (rCBF) for brain physiology 1 studies and in various neurological conditions. 2 Accurate absolute quantification of rCBF provides important information in the management of brain diseases, in particular when assessing cerebrovascular reserve capacity in patients with steno-occlusive cerebrovascular disease. 3 Absolute quantification of regional brain perfusion, i.e. absolute rCBF in ml/100 g/min, measured by [15O]H2O PET relies on accurate measurement of both arterial input function (AIF) and brain tissue activity. 4 A key element for correct quantification of tissue activity concentrations is accurate correction for attenuation of emitted PET photons. 5 Usually [15O]H2O PET scans are performed in hybrid PET/CT scanners that provide a reliable method to correct the attenuation of photons based on computer tomography (CTAC). 6
The introduction of hybrid PET/MRI scanners enabled simultaneous acquisition of PET and MRI data. This allows a “one-stop-shop” approach to economize time and resources, but also the direct comparison of simultaneously acquired PET and MRI studies. 7 The introduction of MRI-compatible devices to measure AIF in MRI scanner rooms allows the performance of fully quantitative [15O]H2O PET in PET/MRI scanners. One of the major initial drawbacks of PET/MRI scanners, however, was the lack of reliable AC methods. At first, Dixon-Water–Fat segmentation (DWFS) and ultra-short echo time (UTE) MRI sequences were used to generate attenuation correction maps (µ-maps). Due to DWFS’s inability to identify bone, 8 and the poor performance of UTE on segmenting and assigning density to different tissues, 9 the generated µ-maps from DWFS and UTE were inaccurate, which lead to suboptimal AC. Similarly, most dynamic and quantitative PET studies performed in PET/MRI scanners were reconstructed using DWFS, 10 but the effect of neglecting bone during AC was not taken into account and it has never been studied. Novel MRAC approaches are able to improve DWFS and UTE as shown in a recent multicenter study comparing static PET scans with different radiotracers. 11 One of the best performing methods, RESOLUTE, a method based on the segmentation of UTE images, has long been used in our institution with excellent results in static acquisitions, but is yet to be validated in dynamic PET studies. Another of the best performing methods in the multicentric study, a multi-atlas approach developed by Merida et al., 12 is one of only a few methods to have been validated in dynamic PET studies. In two different studies, the authors evaluated the performance of the single- and multi-atlas AC approaches using two different PET radiotracers. While both approaches showed acceptable results in the evaluation of static PET examinations, both studies showed a temporal variation of the performance during the dynamic PET scan that was attributed to the interaction of the spatial tracer-distribution heterogeneity variation over time and the degree of accuracy of the attenuation maps.13,14 Similarly, Mansur et al. described a temporal bias variation of a single-atlas method in dynamic [11C]Cimbi-36 PET/MRI brain studies. 15 Fixed and known biases of the AC method lead to inaccurate, though potentially precise, measurements that can be corrected for, while temporal variation of the performance of an AC method in dynamic PET scans leads to unpredictable effects in studies using dynamic kinetic modelling.
Deep learning systems consisting of convolutional neural networks are able to capture complex relations from different and apparently unrelated sources. The information gathered is later used to generate new data from incomplete sources. Such systems have been recently used in the field of medical imaging,16,17 including attenuation correction of PET studies.18,19 In our center, a deep-learning method to generate pseudo-CT attenuation correction maps based on UTE (DeepUTE) has been developed and studied, yielding results that improve those of RESOLUTE in both adult and pediatric cohorts.20,21
The aim of this study was to investigate the usefulness of a deep learning method based on UTE images to generate MRAC images for attenuation correction of dynamic [15O]H2O PET studies. We evaluated it by comparing parametric perfusion maps and tracer distribution images from dynamic and static [15O]H2O PET studies from healthy young males corrected with DeepUTE and RESOLUTE, to the reference corrected with CTAC.
Material and methods
Fourteen healthy young males (mean age 24 ± 2 years, range 21–28 years) were enrolled in this study. Inclusion criteria were: healthy males between 18 and 35 years old. Exclusion criteria were: contraindications to MRI or arterial cannulation, a medical history of prior or current neurological or psychiatric disease, or severe head trauma.
The study was approved by the Danish National Committee of Health Research Ethics (H-16023156) and was conducted according to the Declaration of Helsinki II. Written informed consent was obtained from all participants.
Experimental setup
Details of the experimental setup have been published previously along with results of comparative CBF measurements by MRI and [15O]H2O PET.7,22 For this project, only the first two resting state [15O]H2O PET scans from each subject acquired sequentially, without repositioning and with a pause of approx. 10 min between to allow for tracer decay were used.
All PET and MRI imaging were obtained on a 3T Siemens Biograph mMR hybrid PET/MRI system (Siemens Healthcare, Erlangen, Germany) with the software version VB20P.
An arterial catheter was placed in the radial artery of the non-dominant hand and was used to obtain continuous arterial blood sampling (AIF). A venous catheter was placed in the median cubital vein of the contralateral forearm and was used to inject the radiotracer.
Magnetic resonance imaging
A 16-channel mMR head and neck coil designed by the vendor to minimize attenuation of the PET signal was used for all MRI measurements.
At the beginning of the experiment a T1 magnetization-prepared rapid gradient-echo (T1-MPRAGE) was acquired with the following parameters: repetition time (TR) 1900 ms, echo time (TE) 2.44 ms, flip angle 9 degrees, matrix 256 x 256, voxel size 1.0 x 1.0 x 1.0 mm3, GRAPPA acceleration factor 2. A ultra-short echo time (UTE) sequence provided by the vendor was acquired prior to the first CBF measurement with the following parameters: TR 11.94 ms, TE1 0.07 ms, TE2 2.46 ms, flip angle 10°, axial orientation, voxel size of 1.6 mm×1.6 mm×1.6 mm, with a total scan duration of 100 s. A two-point DIXON-VIBE AC sequence, also provided by the vendor, with the following parameters: TR 2.3 s, TE1 1.23 ms, TE2 2.46 ms, flip angle 10°, coronal orientation, voxel size of 2.6 mm×2.6 mm×3.12 mm, with a total scan duration of 19 s was performed at the beginning of each [15O]H2O PET scan.
Positron emission tomography
For each PET scan, approximately 500 MBq of [15O]H2O were manually injected as a bolus in the median cubital vein. Emission scans were initiated at the time of the radiotracer injection and recorded in list mode for 4 minutes.
The first 195 seconds of the PET images were reconstructed into 9×5 s, 3×10 s, 4×30 s frames using 3D-ordered subset expectation maximum (3D OSEM), 4 iterations 21 subsets, 128×128 matrix with voxel dimension 2×2×2 mm3 and 2 mm Gaussian filter.
A 90 s static image (from 10 s to 100 s after the beginning of the PET acquisition) was also generated with the same reconstruction parameters as the dynamic study. An early static image is often used as a distribution image when arterial cannulation (and consequently absolute quantification), fails or is not available as the distribution images resemble that of the calculated perfusion maps. 23
Activity in the arterial blood was sampled at 1 Hz during the scans using an automatic blood sampling system (Swisstrace, Zürich, Switzerland) set to draw 8 ml/min. The sampling system clock was synchronized to the scanner acquisition clock for decay correction of the data and both the scanner and the blood sampling system were cross-calibrated. Blood sampling was started approximately 90 seconds prior to the radiotracer injection, and it was stopped 4 minutes after injection.
Parametric perfusion images were generated with the software PMOD 3.304 (PMOD Technologies, Zürich, Switzerland) using a 1 tissue compartment model with correction for arterial blood volume.24,25 The 190 seconds following tracer injection of the arterial input curves were fitted into the model correcting for delay and dispersion with an exponential kernel. 26 The arterial input curves were initially corrected for dead-time and decay. CBF is reported as the unidirectional clearance of tracer from the blood to the tissue (K1) assuming full extraction of water.
CT
A low-dose CT scan was obtained after the PET/MRI experiment in a whole-body PET/CT scanner (Siemens Biograph, Siemens, Erlangen, Germany). The acquisition parameters were: 120 kV, 30 mAs, 74 slices, 0.6×0.6×3 mm3 voxels covering from the top of the head to approximately the mandible.
Attenuation correction methods
In order to compare the effect of different AC methods, we evaluated RESOLUTE and DeepUTE against the reference CTAC by reconstructing each [15O]H2O PET examination with the three different AC methods. The UTE and CT images used to create the µ-maps were initially coregistered to the DWFS images acquired at the beginning of each PET study.
The patient bed and head-holder were initially stripped manually from each subject’s CT images, and the CT was then co-registered to each DWFS in-phase scan (one for each PET scan) using a 6-parameter rigid alignment method. The CT images were then transformed to generate µ-maps using a bi-linear scaling approach as implemented in the Siemens PET/CT scanners.
RESOLUTE and DeepUTE µ-maps were created based on the UTE scans with the methods described by Ladefoged et al.21,27 We refer to the original publications for a detailed explanation, but in short, RESOLUTE is a segmentation-based method that is able to extract patient specific bone, and represent the density using measured continuous values. DeepUTE is a deep learning method based on a 3D encoder-decoder convolutional neural network that is developed using UTE-CTAC pairs from more than 1000 adult subjects.
Since the coverage of the CT scans was usually smaller than the PET and MRI, DWFS µ-map was added in the lower face and neck areas outside the CT coverage. This was also done in the DeepUTE and RESOLUTE µ-maps to allow for a fair comparison.
The three different µ-maps were resampled and inserted into the DWFS file and were used during the PET reconstructions performed in an offline system (E7tools, Siemens Medical Solutions, Knoxville, TN, United States). The CT µ-maps and the PET scans corrected with the CTAC were considered the ground truth for this study.
Image analysis
Each subject’s DWFS scans were coregistered one to the other to account for motion between the scans and coregistered to the T1-MPRAGE. The same transformation was then applied to the [15O]H2O PET studies (rCBF maps and 90s static image) performed simultaneously with DWFS. The T1w MPRAGE was used to spatially normalize the subjects to a standard MNI space, and the transformation transferred to registered DWFS and PET scans. No additional filtering was performed. A brain atlas in standard MNI space (ICBM 2009a T1-weighted average structural template image) was back transformed into subject’s space and applied to the PET studies to obtain the average perfusion and activity concentration from the perfusion parametric maps and the 90s static images, respectively, and from each region: whole brain, frontal lobe, temporal lobe, parietal lobe, occipital lobe, cerebellum, putamen and thalamus (Supplementary Material S1). The same brain atlas was back transformed into the dynamic [15O]H2O PET studies to obtain the activity and the RESOLUTE and DeepUTE relative bias vs. CTAC for every PET frame from every [15O]H2O PET scan.
In standard MNI space, absolute pixel-wise rCBF differences between RESOLUTE and DeepUTE and CTAC corrected rCBF maps were generated.
Statistics
The average of all subjects’ rCBF and static activity concentration maps, and the average absolute differences between RESOLUTE and DeepUTE vs CTAC were calculated for each region using the first scan from each subject (n=14). Differences of average CBF and activity concentration between AC methods were assessed using a paired Student’s t test.
The intrasubject variability was calculated as the average value from the individual coefficient of variation for all of the duplicates (11 subjects, 22 measurements).
Results
Out of 28 scans originally planned PET scans, two were excluded due to arterial line clotting and, a third scan due to corruption of the data leaving a total of 25 [15O]H2O PET scans from 14 subjects acquired and reconstructed using the three different AC methods (CTAC, RESOLUTE and DeepUTE).
An example of the three different µ-maps and parametric perfusion maps is shown in Supplementary Material S2.
The average relative bias between the measured whole-brain activity concentration in each frame of the dynamic [15O]H2O PET studies reconstructed using RESOLUTE and DeepUTE relative to CTAC is shown in Figure 1. For all frames, the average ± standard deviation relative bias was -1.27 ± 0.96% and 0.55 ± 0.87% for RESOLUTE and DeepUTE respectively. The relative bias variability was slightly larger in the initial and shorter frames, especially for RESOLUTE, compared to the latter. RESOLUTE relative bias increased during the first 30 seconds (from −0.15% to approximately −2%) and later remained stable whereas for DeepUTE it was stable at approximately 0.5% during the whole examination. Supplementary Material S3 shows the relative bias of RESOLUTE and DeepUTE for every frame of each PET scan. In all brain regions, the RESOLUTE and DeepUTE average relative biases in the different frames resembled that of the average whole-brain curve (Supplementary Material S4). Average fitted delay and dispersion from the kinetic modelling using the RESOLUTE and DeepUTE corrected dynamic [15O]H2O PET were not significantly different (p > 0.05) than for CTAC as shown in Supplementary Material S5.
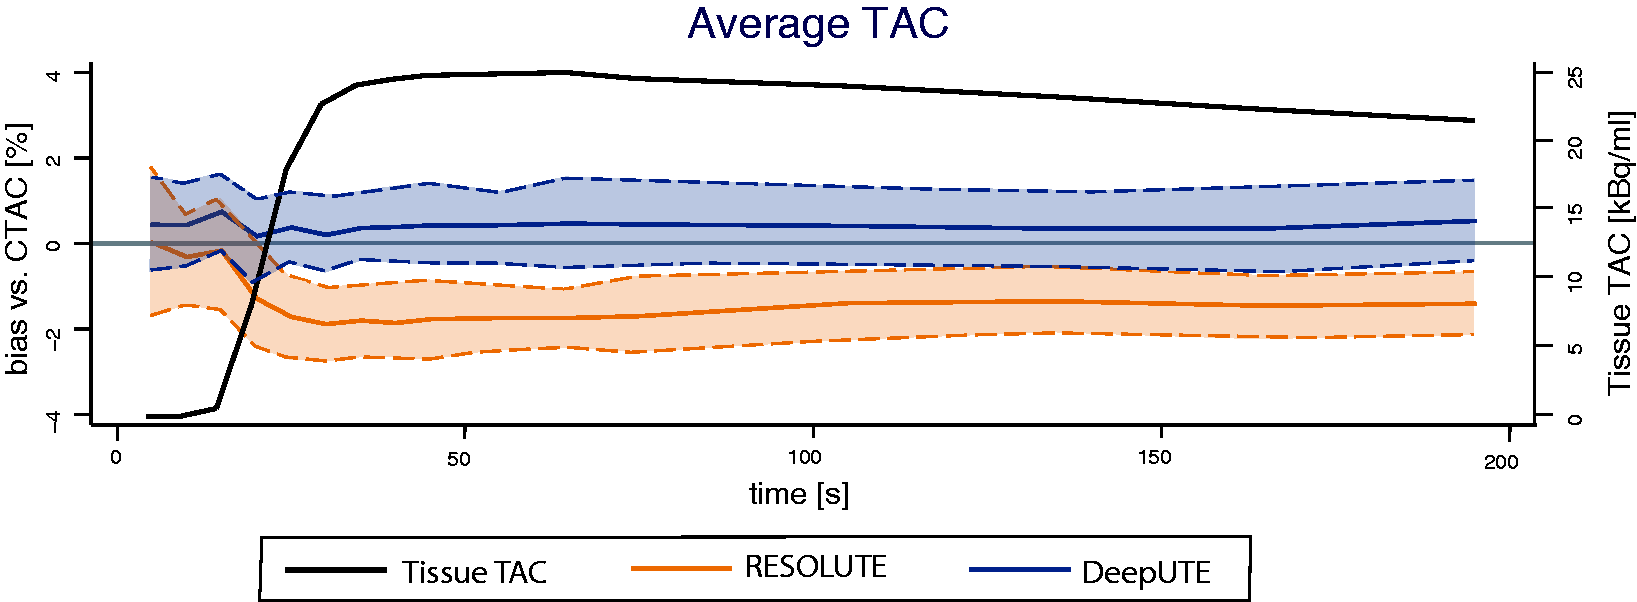
Whole brain average ± 1 standard deviations RESOLUTE (orange) and DeepUTE (blue) bias from CTAC (1c) and average time-activity curve (TAC, black) of the CTAC [15O]H2O PET. 9 x 5 s, 3 x 10 s, 4 x 30 s frames.
On average, whole brain CBF using CTAC was 39.9 ± 6.0 ml/100 g/min and it was 39.0 ± 5.8 and 40.0 ± 5.6 ml/100 g/min for RESOLUTE and DeepUTE respectively (Table 1). The intrasubject variability of the perfusion estimates based on duplicate measurement from 11 subject was 4.85%, 4.93% and 4.89% for CTAC, DeepUTE and RESOLUTE respectively. The average bias in whole brain CBF between RESOLUTE and CTAC was −2.1 ± 1.5% (p < 0.05), and between DeepUTE and CTAC, 0.5 ± 1.1% (p > 0.05). RESOLUTE underestimated rCBF in all brain regions while with DeepUTE the overestimation was of a smaller magnitude and only significantly different from CTAC in the occipital lobe. Average rCBF and tracer activity concentration (from the 90 s static images) and the respective relative differences between the two MRAC and CTAC in different regions are shown in Table 1 and Figure 2. Overall, the relative bias for parametric CBF maps were slightly larger compared to the equivalent static studies (Figure 2).
Cerebral blood flow and tracer activity concentration using CTAC, RESOLUTE and DeepUTE on [15O]H2O PET studies.
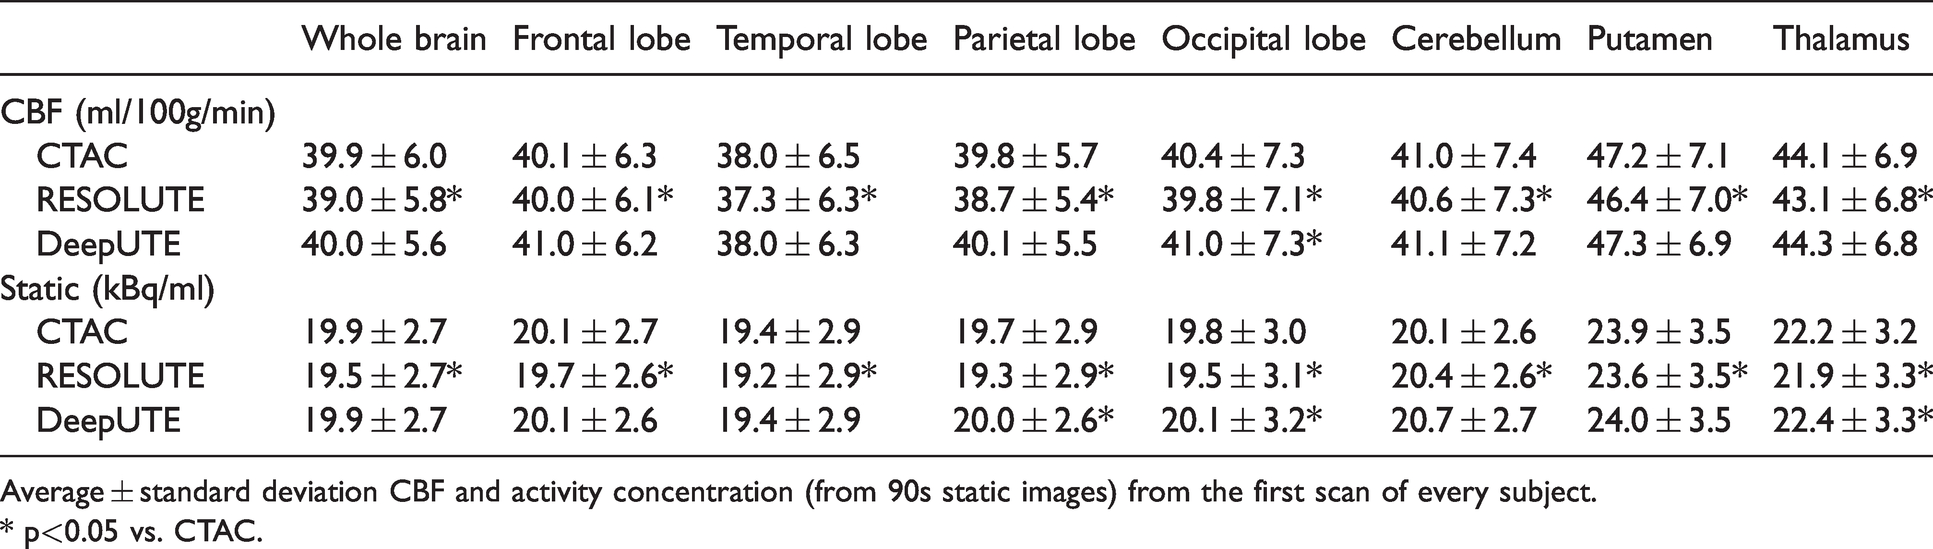
Average ± standard deviation CBF and activity concentration (from 90s static images) from the first scan of every subject.
* p<0.05 vs. CTAC.
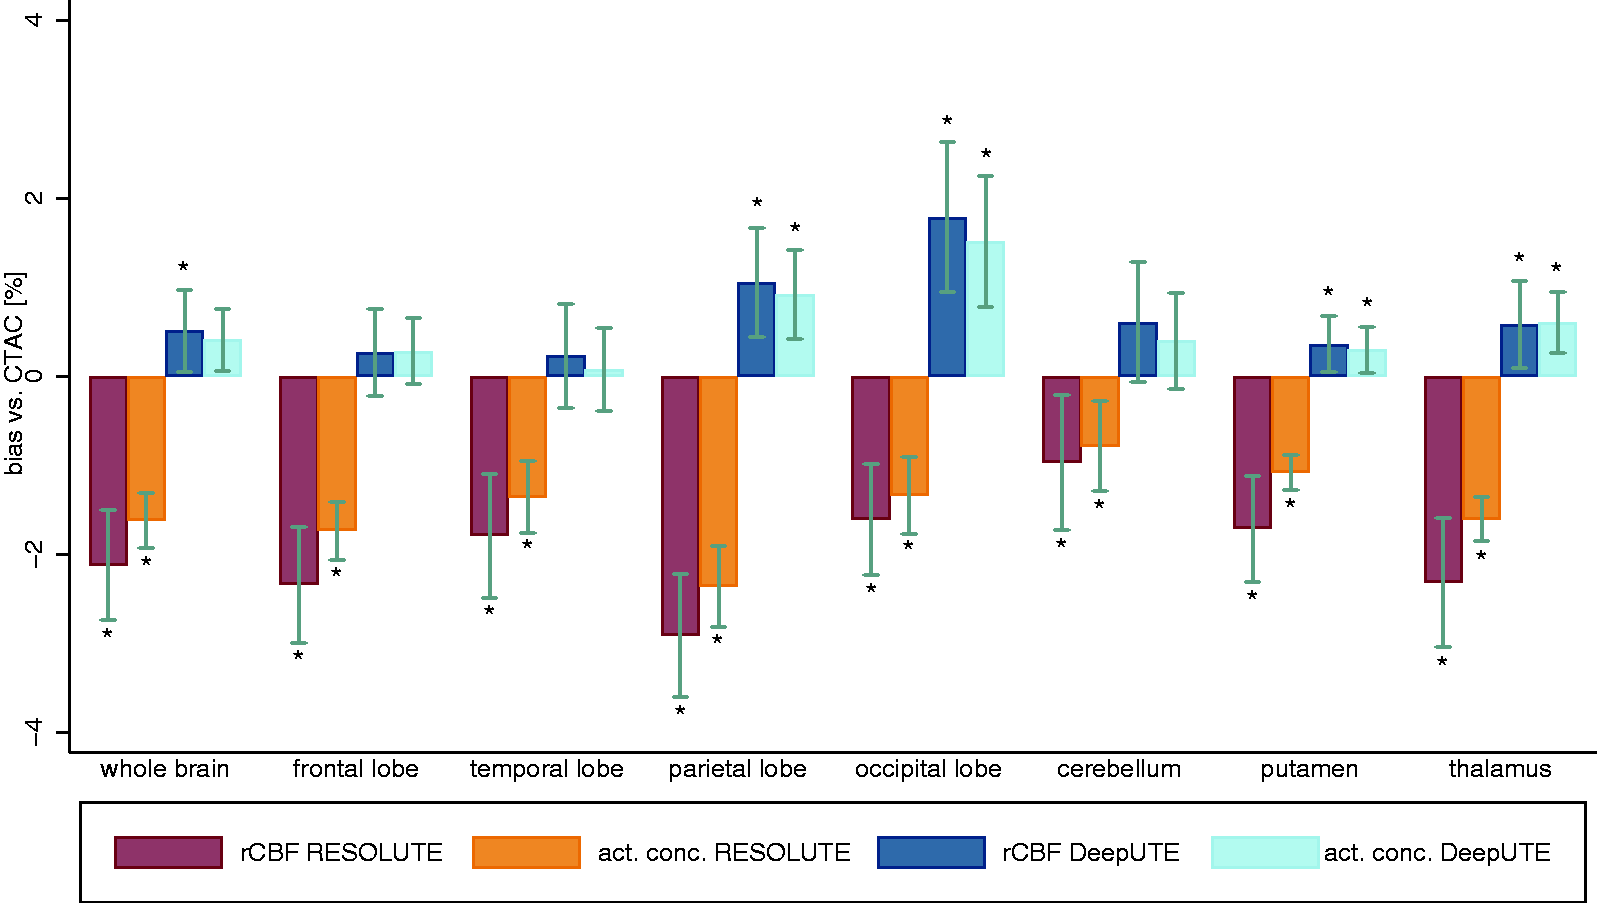
Average (± 95% confidence interval) RESOLUTE and DeepUTE relative bias from CT from the parametric perfusion maps (rCBF) and static (activity concentration) [15O]H2O PET images. act. conc.= activity concentration. *for significant difference vs. CT (p<0.05).
The average pixel-wise rCBF absolute difference maps for RESOLUTE and DeepUTE, and CTAC are shown in Figure 3. RESOLUTE showed an overall underestimation of the rCBF across all brain regions compared to CTAC of approximately −1.25 ml/100 g/min. DeepUTE presented an overall rCBF overestimation of approximately 0.5 ml/100 g/min, concordant to the findings in Figure 2.
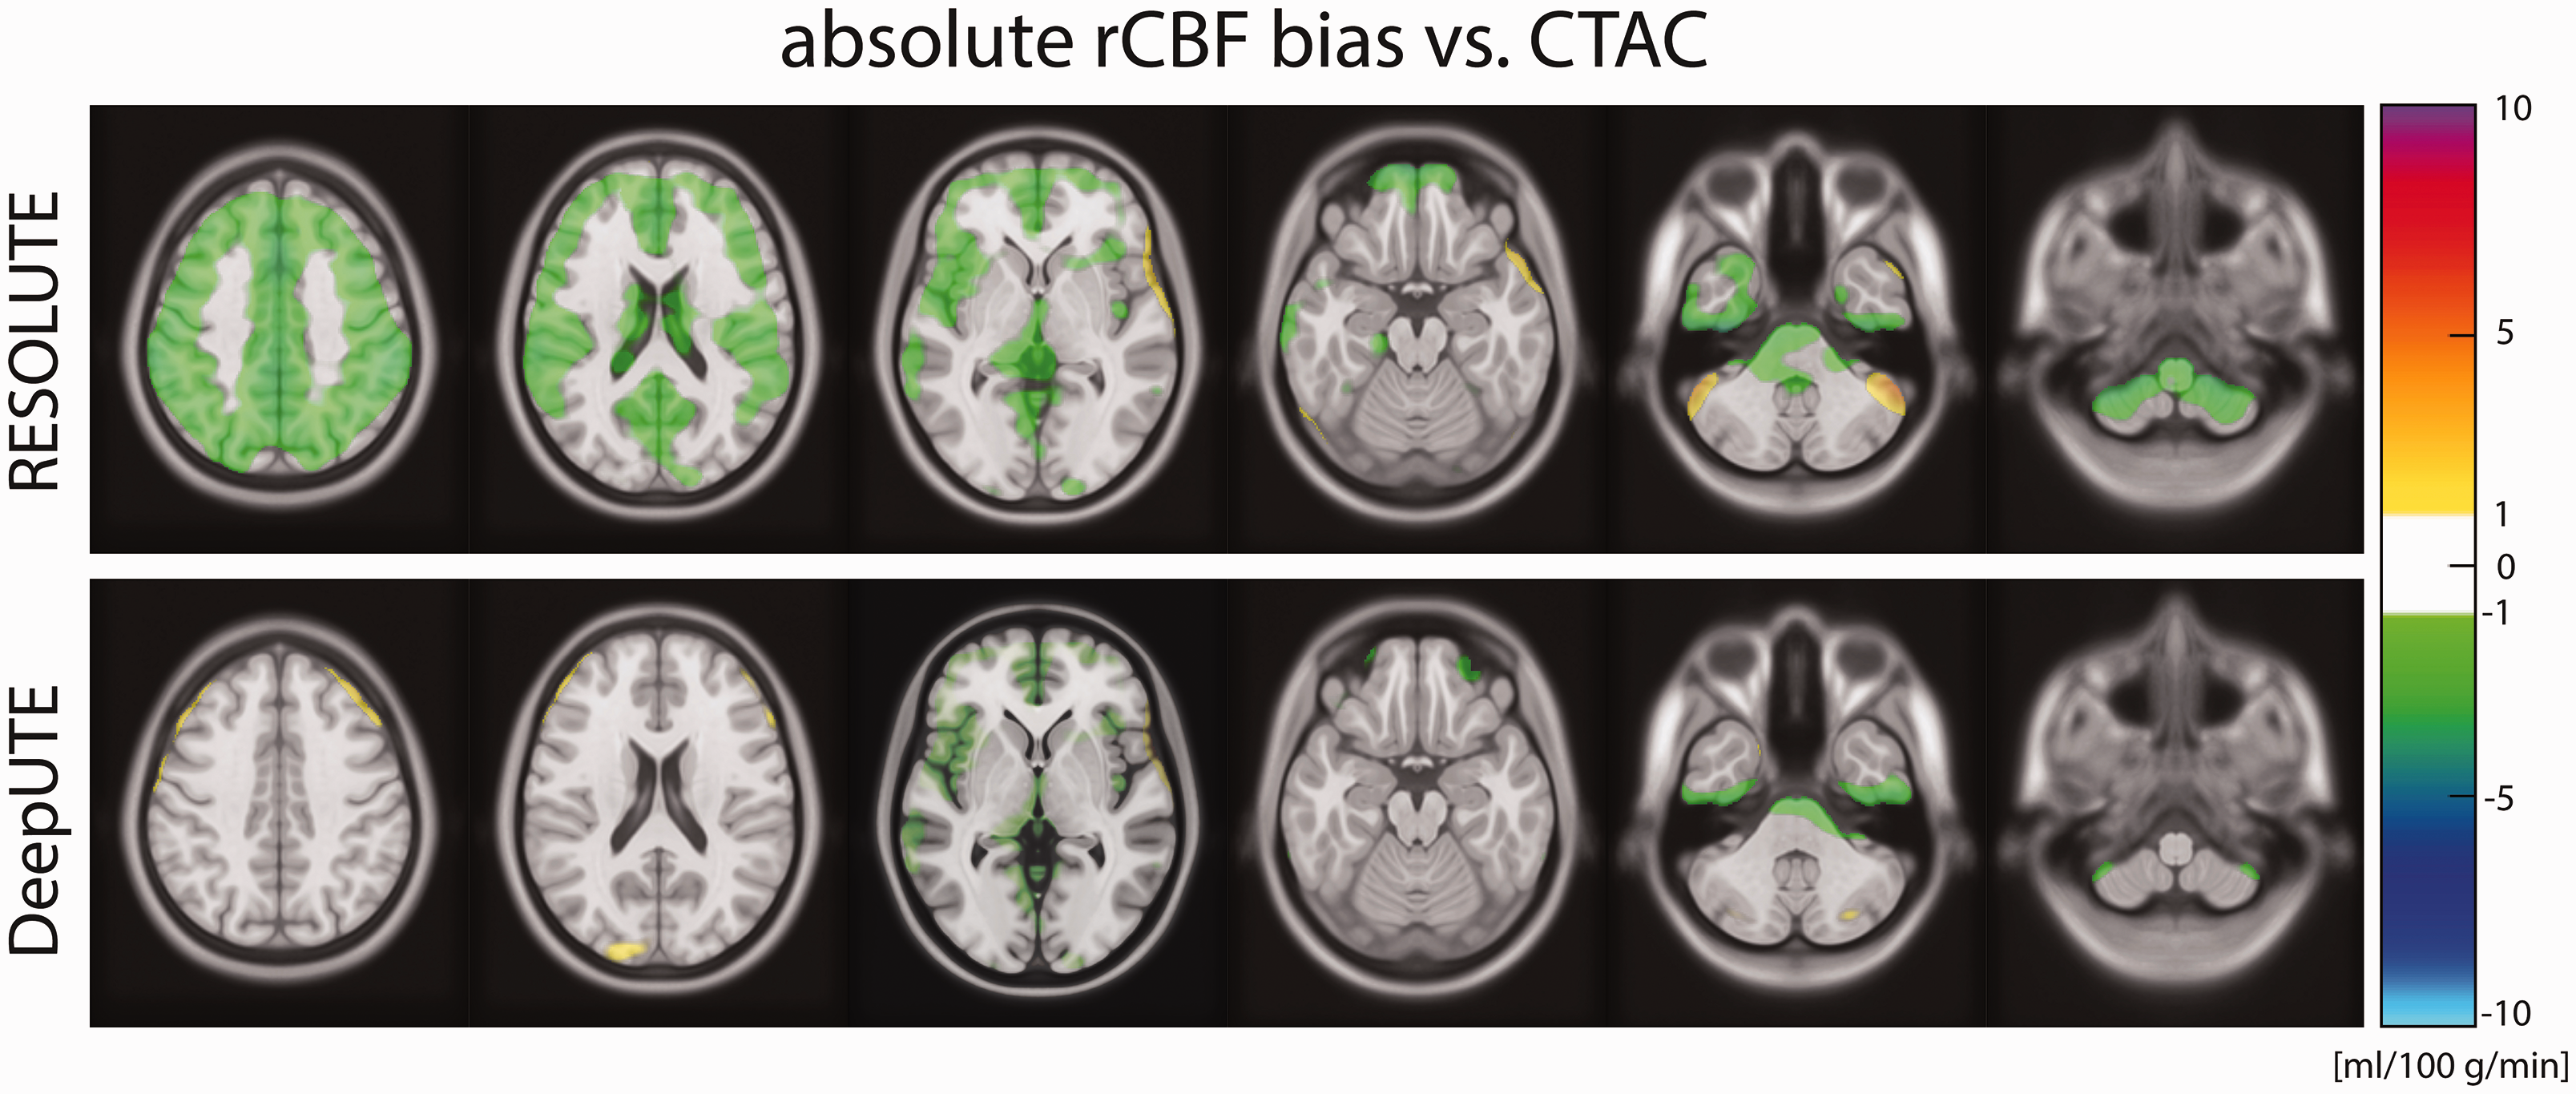
Pixel-wise average absolute RESOLUTE and DeepUTE bias compared to CTAC. Color scale starts at ± 1 ml/100 g/min.
Measurements of rCBF and activity concentration across all brain regions using RESOLUTE and DeepUTE showed a strong correlation with CTAC as shown in Figure 4. For CBF measurements the correlation between RESOLUTE and CTAC had a slope of 0.97 and between DeepUTE and CTAC, the slope was 0.99. In both cases the R2 was 0.99.
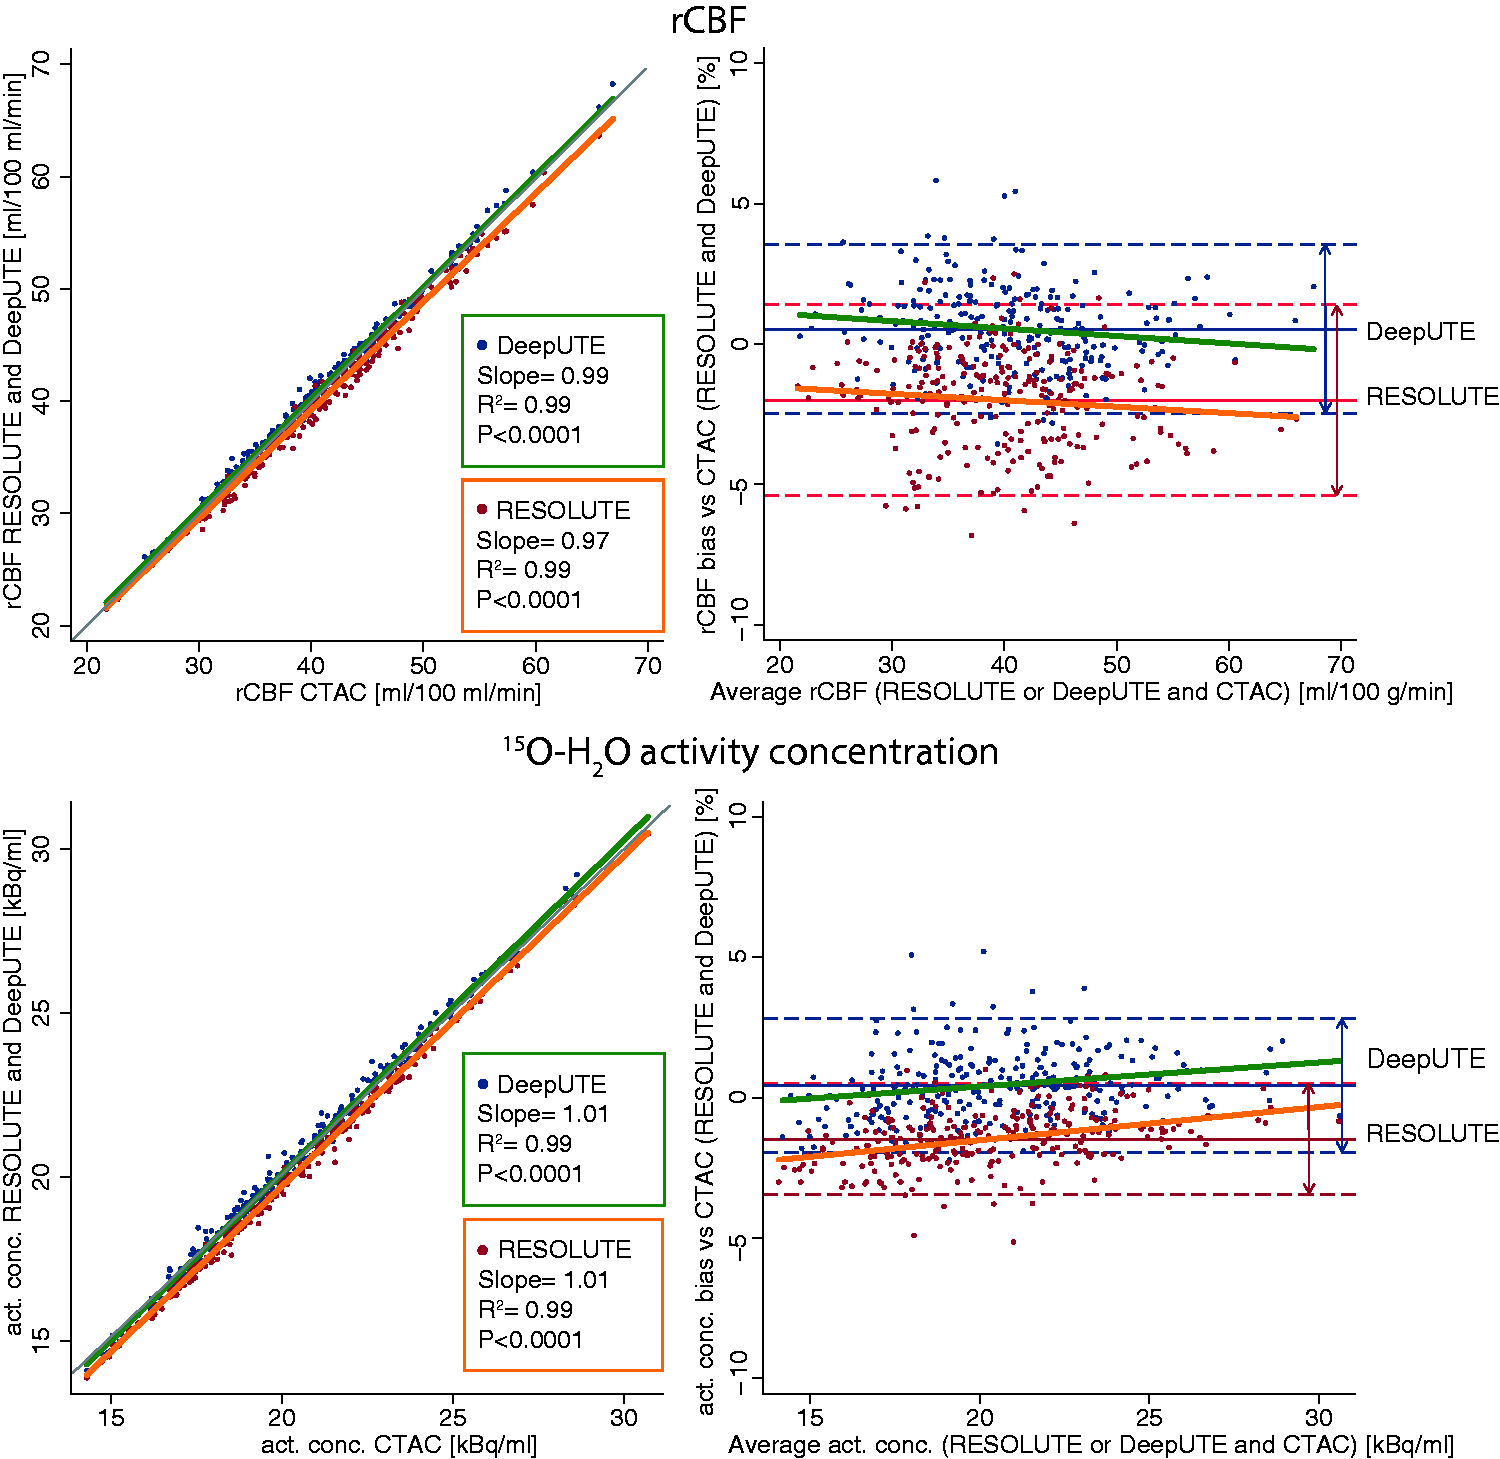
Scatter plot (left column) and Bland-Altman plot (right column) showing the agreement of rCBF (top row) and activity concentration (bottom row) between RESOLUTE, DeepUTE and CTAC. Each point represents one brain region. Grey line in scatter plot shows the line of identity. The slopes of the Bland-Altman plots regression were not different from 0 (p>0.05).
Discussion
The present study compares two MRAC methods: RESOLUTE and DeepUTE, in dynamic and static [15O]H2O PET studies and modelled rCBF maps. One of the added challenges for AC methods in dynamic PET studies is to provide a stable performance during the PET examination, especially when tracer distribution and overall activity varies temporally during the examination, 13 as in the fast radiotracer arrival to the tissue in brain [15O]H2O PET studies. 28
The data from this study extends to the findings of clinical applicability of RESOLUTE and DeepUTE reported previously.20,21,27,29 The results of RESOLUTE from this study both in dynamic and static images are in line with previously published data, showing a whole brain average bias of approximately -2% and a similar bias across different brain regions. 27 DeepUTE has previously been evaluated in a study performed in static [18F]FET PET examinations in a paediatric population with brain tumors. 20 In that study, however, results of direct activity concentration measurements were not provided, only relative uptake measures were shown and the results cannot be compared directly to the findings of the present study.
Only few studies evaluating different MRAC methods in dynamic PET examinations have been published.
Mansur et al. compared a multi-atlas method with the reference method, CT, in [11C]Cimbi-36 brain PET scans. They found an excellent correlation between the multi-atlas method and CTAC on different kinetic modelling parameters, an average bias around 4% across different brain regions and a time-dependant shift of the bias in the cerebellum, hippocampus and amygdala. 15 Merida et al. studied two atlas-based AC methods in PET/MRI studies using the specific serotonin 5-HT1A antagonist [18F]MPPF, and found a performance of the multi-atlas method similar to CTAC, but also a temporal shift of the bias due to an interaction of the spatial tracer-distribution heterogeneity variation over time with the degree of accuracy of the attenuation maps using the single-atlas method. More recently, two independent PET studies on the GE SIGNA platform comparing atlas based methods and zero-echo-time (ZTE) AC using either dynamic [11C]PE2I14 or [18F]FE-PE2I 30 with either CTAC or 68Ge-transmission AC as reference, respectively. Both studies agree on the inferiority of atlas-based methods and a low average ZTE AC bias of striatal binding potential (BPND) < 2% using cerebellum as reference. However, they diverge regarding the absolute bias, which in one study is 10% in the striatum. 14 This bias can be partially explained by the use of 68Ge-transmission AC instead of CTAC but remains as a point of concern primarily in the combination of quantitative data derived from different PET system, as any absolute biases will impact quantification directly when using an external reference, such as an AIF. 31
Compared to the findings in previous studies, both RESOLUTE and DeepUTE seem to provide an overall lower bias when using CTAC as the reference standard for PET attenuation, and we did not find the aforementioned temporal variation of the bias in any of the studied regions during the [15O]H2O PET studies. 13 It is worth mentioning, however, an important difference between previous studies examining the performance of AC methods in dynamic PET scans and ours. The radiotracers employed in previous studies, and hence their dynamics, are different than [15O]H2O, used in our study. For [15O]H2O PET studies the tracer distribution remains relatively uniform during acquisition which could increase robustness to temporal bias as compared to the 60 minutes PET acquisition by Merida et al. Further, the fast radiotracer arrival to the tissue underscores the sensitivity to initial events and accurate AIF delay and dispersion modelling in rCBF quantification.
Okazawa et al. compared an atlas-based method ZTE AC and found no significant differences between the two. 32 It should be noted that the accepted reference method for PET AC, the CTAC, was not included in the study, and that rCBF was quantified using an image derived input function, which challenges the comparison of their results with ours. Similarly, Cabello et al. compared the performance of UTE-R2, a segmentation-based method that uses UTE images, along with UTE and DWFS, to an atlas-based method on dynamic [18F]FDOPA PET scans, focusing on the slope of the Patlak analysis. 33 The best performing MRAC method in their study was UTE-R2 but, as in the Okazawa et al. study, in the absence of CTAC their results are difficult to compare to ours.
Overall, the tissue activity concentrations of the distribution images from both RESOLUTE and DeepUTE showed a smaller, yet not significant, bias compared to the respective rCBF images (Figure 2).
Different operation-related aspects of the three different AC methods should be emphasised. RESOLUTE and DeepUTE require the acquisition of a UTE scan, which lasts 100 seconds, and can be performed while the PET study is acquired. CTAC on the other hand, requires an additional examination performed in a different scanner, which adds time, exposure to ionising radiation, cost and complexity to the overall examination. Additionally, the correct registration of the CT images to the PET/MRI studies should be individually inspected.
It should be mentioned that the reported mean whole brain CBF is lower than the generally accepted 50 ml/100 mg/min. 34 The average CBF values from this study are, however, in good agreement with those reported previously by other authors using [15O]H2O PET, 35 indicating that the differences more likely reflect well known general methodological biases rather than the current implementation of the method or data processing as discussed in detail by Vestergaard et al. 36
The major limitation of this study is that it is based on a cohort of healthy male subjects. This is of little importance if these methods are to be applied in physiology studies from healthy subjects, but it needs to be reproduced in a patient population, with potential age- or pathology-related anatomical changes, if they are to be applied in clinical practice. Both methods, however, are proven to provide acceptable results when applied to static studies from a patient population, including children. 20 We do not believe sex or age related variability to be of concern as the specific DeepUTE method used in this study was trained, validated and tested on a large multi-site cohort of both men and women, predominantly from an older population. A minor limitation of both RESOLUTE and DeepUTE is their dependence on an MR image, which can be modified dependent on software and hardware versions. Similar to most MR-based attenuation correction methods, it might be necessary to adapt the methods to such changes, e.g. using transfer learning in the case of deep learning methods. 22 In addition, the use of the UTE sequence limits the external use of the methods, since the sequence is currently not available on GE’s Signa PET/MRI scanner. Alternatively, the methods could be based on more standardized sequences, such as the Dixon VIBE or T1-MPRAGE, without loss of performance as previously demonstrated. 21 We believe that dynamic [15O]H2O PET studies provide one of the most challenging scenarios to evaluate the behaviour of an AC method on a dynamic PET data as it combines a rapid arrival time of the tracer to the tissue associated with a radiotracer with a very short half-live and areas with high radiotracer contrast close to bone structures. Keeping that in mind, and considering that previously reported increase of bias during a dynamic PET examination was only found when using poorer MRAC methods, 13 it is safe to assume that similarly performing MRAC methods previously validated in static studies can, in principle, be used in dynamic PET studies providing similar results.
In conclusion, the present study demonstrates that DeepUTE, and in a lesser degree RESOLUTE, provide reliable and accurate attenuation correction to dynamic and static [15O]H2O PET studies performed in a hybrid PET/MRI scanner, comparable to CTAC. The behaviour of DeepUTE and RESOLUTE in the modelled rCBF studies is comparable to static images.
Supplemental Material
sj-pdf-1-jcb-10.1177_0271678X211029178 - Supplemental material for Deep-learning-based attenuation correction in dynamic [15O]H2O studies using PET/MRI in healthy volunteers
Supplemental material, sj-pdf-1-jcb-10.1177_0271678X211029178 for Deep-learning-based attenuation correction in dynamic [15O]H2O studies using PET/MRI in healthy volunteers by Oriol Puig, Otto M Henriksen, Flemming L Andersen, Ulrich Lindberg, Liselotte Højgaard, Ian Law and Claes N Ladefoged in Journal of Cerebral Blood Flow & Metabolism
Footnotes
Funding
The author(s) disclosed receipt of the following financial support for the research, authorship, and/or publication of this article: Oriol Puig was supported by a training grant from the Fundación Alfonso Martín Escudero and Claes N. Ladefoged was supported by a post-doc grant from the Danish Council for Independent Research (reference number: 6110-00692A).
Acknowledgments
The authors would like to thank the hard work and dedication of the nuclear medicine technologists and radiographers Nadia Azizi, Marianne Federspiel, Jakup Poulsen and Karin Stahr; the staff of the Cyclotron and Radiochemistry Unit and Annette Ulrich, from the cardiothoracic anesthesiology department for the arterial cannulations. We would like to thank David E. Nyrnberg for his help on generating the CT-based µ-maps. We would also like to thank The John and Birthe Meyer Foundation, who generously donated the PET/MRI scanner and the cyclotron to Rigshospitalet, University of Copenhagen.
Declaration of conflicting interests
The author(s) declared no potential conflicts of interest with respect to the research, authorship, and/or publication of this article.
Authors’ contributions
OP, OH, UL, CNL and IL contributed to the design of the study, acquisition, analysis and interpretation of the data, and the drafting of the article. FLA and LH contributed to the analysis and interpretation of the data and the drafting of the article. All authors revised critically the draft and approved the version to be published.
Supplementary material
Supplemental material for this article is available online.
References
Supplementary Material
Please find the following supplemental material available below.
For Open Access articles published under a Creative Commons License, all supplemental material carries the same license as the article it is associated with.
For non-Open Access articles published, all supplemental material carries a non-exclusive license, and permission requests for re-use of supplemental material or any part of supplemental material shall be sent directly to the copyright owner as specified in the copyright notice associated with the article.