
Abstract
Increased plasma glucose levels are known to reduce fluorine-18-labeled fluorodeoxyglucose (18F-FDG) uptake in Alzheimer's disease (AD)-related regions, resulting in the appearance of an AD-like pattern. However, the relationships of its appearance with cerebral blood flow and insulin levels are uncertain. We performed 18F-FDG and oxygen-15-labeled water (15O-H2O) positron emission tomography in the fasting and glucose-loading conditions on nine young healthy volunteers with no cognitive impairments. Measurement of plasma glucose and insulin levels confirmed that all subjects were free of insulin resistance, and that glucose loading significantly increased plasma glucose and insulin levels. Fluorine-18-labeled fluorodeoxyglucose and 15O-H2O images were compared between the two conditions, focusing on AD-related regions: precuneus/posterior cingulate (PP), lateral parietal cortex (LPC), and frontal cortex (FC). Volume-of-interest analyses showed significantly lower uptake of both 18F-FDG and 15O-H2O in PP, LPC, and FC after glucose loading (P < 0.05). Whole-brain voxel-wise analyses also revealed the PP, LPC, and FC areas where uptake of both 18F-FDG and 15O-H2O decreased (P < 0.05, familywise error rate-corrected). We concluded that increased plasma glucose and insulin levels can cause the appearance of the AD-like pattern in both 18F-FDG and 15O-H2O images, and this phenomenon can occur even in subjects without insulin resistance.
INTRODUCTION
The positron emission tomography (PET) radioligand, fluorine-18-labeled fluorodeoxyglucose ( 18 F-FDG), is used to estimate regional cerebral metabolic rates of glucose utilization (rCMRglc), which reflect the regional brain activities that are associated with physiologic or pathophysiologic conditions. 1 Because the absolute measurements of rCMRglc require arterial blood sampling, which is an invasive procedure and which leads to high intersubject and intrasubject variability in the rCMRglc values, 2 the measurement of 18 F-FDG uptake without arterial blood sampling, which has smaller intersubject and intrasubject variability, has been widely used in neuroimaging studies as well as in clinical practice for the differential diagnosis of patients with dementia.3,4 However, cerebral 18 F-FDG uptake is affected by plasma glucose levels because of the competition with glucose for the transporters and hexokinase. 5 Thus, instead of providing a quantitative assessment of rCMRglc, this method quantitatively assesses the changes in the distribution pattern of 18 F-FDG, which is possibly associated with physical or pathologic conditions.
Patients with Alzheimer's disease (AD) show prominent reduction in 18 F-FDG uptake in the precuneus/posterior cingulate (PP), parietotemporal, and frontal regions.6,7 This characteristic distribution pattern of 18 F-FDG is described as an AD pattern, and is useful for the diagnosis of AD. Interestingly, recent studies showed that increased plasma glucose levels, even in cognitively normal subjects, can alter the cerebral distribution pattern of 18 F-FDG and reduce 18 F-FDG uptake in AD-related regions,8,9 resulting in the appearance of the AD-like pattern. In addition, a more recent study showed that the AD-like pattern observed during a hyperglycemic state can be reversible and independent of amyloid-β deposition or apolipoprotein E ∊4 genotype. 10 Another study showed that the AD-like pattern can appear even at fasting plasma glucose levels of 100 to 110 mg/dL. 11
Oxygen-15-labeled water ( 15 O-H2O) is another radioligand used in PET to estimate regional cerebral blood flow (rCBF), which is related to regional brain activity. Patients with AD also show the AD pattern in CBF images as observed in 18 F-FDG images. 12 However, it is uncertain whether the AD-like pattern during a hyperglycemic state also appears in CBF images. Additionally, measurements of plasma insulin levels are lacking in the previous studies of 18 F-FDG. Because insulin affects brain function 13 and may modify the AD-related pathology, 14 its measurement may provide essential information for understanding the AD-like pattern. The goal of this study was to address these issues. We measured the plasma glucose and insulin levels before and after glucose loading and examined the changes in the distribution pattern of 18 F-FDG and 15 O-H2O, testing the hypothesis that glucose loading reduces the uptake of both radioligands in AD-related regions leading to the appearance of the AD-like pattern. Additionally, we discuss the link between glucose, insulin, insulin resistance, and the AD-like pattern.
MATERIALS AND METHODS
Research Participants
The study was conducted in accordance with Helsinki Protocol, and approved by the Ethics Committee of the Tokyo Metropolitan Institute of Gerontology. After a detailed explanation of the study, each participant provided written informed consent. The sample was composed of nine volunteers (6 men and 3 women; mean age = 21.7 years, s.d.= 1.5, range = 20 to 25). None of the subjects had a history of diabetes, and all were defined as healthy based on a medical interview with a neurologist, physical, and neurologic examination results, and findings from magnetic resonance imaging (MRI).
Study Protocol
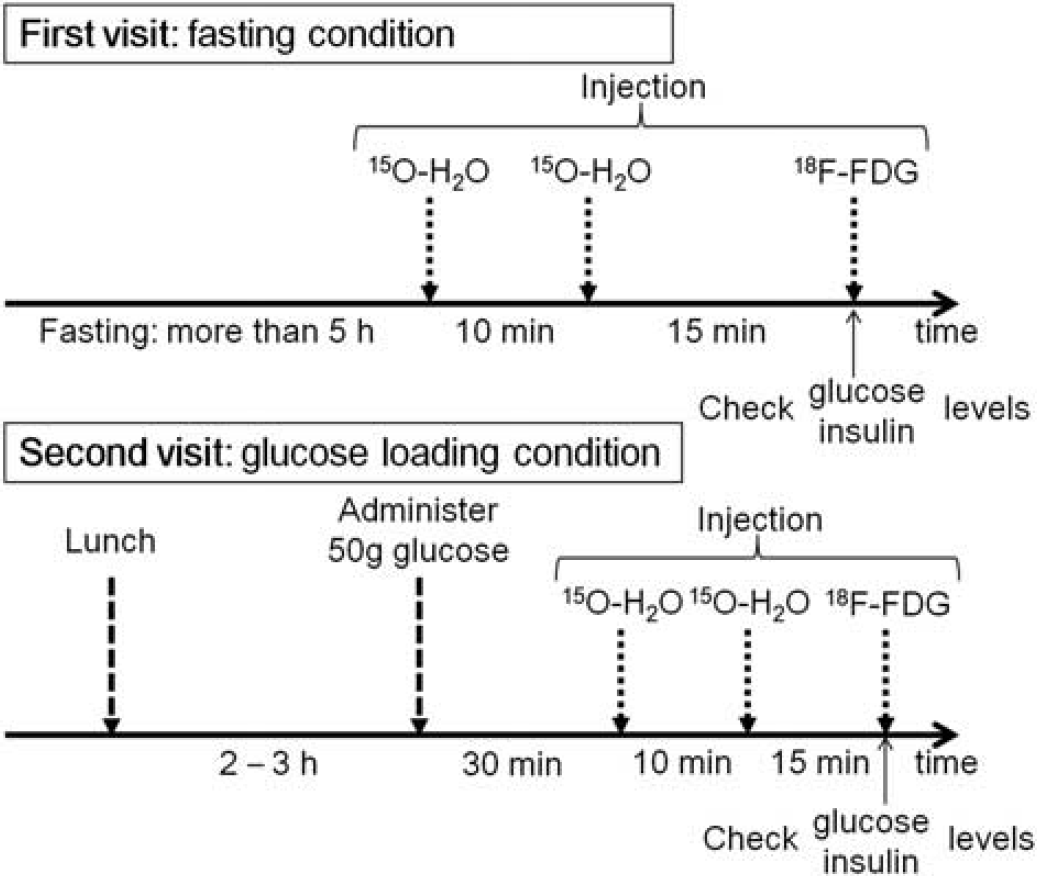
The study protocol is summarized in Figure 1. Each subject visited our institute twice to undergo 18 F-FDG and 15 O-H2O PET scans in two different conditions: the fasting condition (first visit) and the glucose-loading condition (second visit). The time interval between the two visits was 2 or 3 weeks. On the day of the first visit, participants fasted for more than 5 hours before the injection of the first dose of 15 O-H2O, which was followed by the second dose of 15 O-H2O, and then 18 F-FDG. On the day of the second visit, 2 to 3 hours after lunch, each subject was administered 50 g glucose orally (TRELAN-G50, 150 mL; AY Pharma, Tokyo, Japan) 30 minutes before the injection of the first dose of 15 O-H2O, which was followed by the second dose of 15 O-H2O, and then 18 F-FDG. The time intervals between the first and second injections of 15 O-H2O, and between the second injection of 15 O-H2O and the injection of 18 F-FDG, were 10 minutes and 15 minutes, respectively.
The plasma glucose level was measured twice at the time of the 18 F-FDG injection with a medical device (FDC100G; Fujifilm, Tokyo, Japan), and the two values were averaged. The measurement system was based on the glucose oxidase-peroxidase method. The plasma insulin level was measured once at the time of the injection with the enzyme immunoassay method (SRL, Inc., Tokyo, Japan). An index of insulin resistance, Homeostasis model assessment of Insulin Resistance (HOMA-IR), was calculated by the following formula: HOMA-IR = (fasting glucose (mg/dL) × fasting insulin (μU/mL))/405.
Positron Emission Tomography Scanning
The radioligands, 18 F-FDG and 15 O-H2O, were synthesized with a PET tracer automatic production system (Sumitomo Heavy Industries, Ltd., Tokyo, Japan). The radiochemical purity of 18 F-FDG and 15 O-H2O was more than 95% and 100%, respectively. The PET scanning was performed using a SET-2400 W scanner (Shimadzu, Kyoto, Japan) in three-dimensional mode at the Tokyo Metropolitan Institute of Gerontology. Images with 63 slices were obtained with a 2.054 × 2.054 × 3.125 mm3 voxel size and a 128 × 128 matrix size. The transmission data were acquired with a rotating 68Ga/68Ge rod source for measured attenuation correction. The injected dose was 150 MBq for both 18 F-FDG and 15 O-H2O Static emission data for 18 F-FDG were acquired for 45 to 51 minutes after intravenous bolus injection. Meanwhile, to measure the uptake of 15 O-H2O with less noise, two 15 O-H2O scans were conducted with a 10-minute interscanning interval to allow for decay (Figure 1). Each 15 O-H2O scan was started upon the appearance of radioactivity in the brain after an intravenous bolus injection of 15 O-H2O. Static 15 O-H2O emission data were then acquired for 60 seconds in one frame.15,16 Data were reconstructed after correction for decay, attenuation, and scatter.
Positron Emission Tomography Image Processing and Volumes-of-Interest
All participants underwent MRI scanning in three-dimensional mode (3DSPGR; repetition time 9.2 ms; echo time 2.0 ms; matrix size 256 × 256 × 124; voxel size 0.94 × 0.94 × 1.3 mm3). The images were processed using the FMRIB Software Library version 5.0.4 (FSL; Oxford University, Oxford, UK), and were used for the subsequent PET image processing. Each subject had one 18 F-FDG and two 15 O-H2O images for each condition (Figure 1). The two 15 O-H2O images were realigned and averaged to reduce noise. The 18 F-FDG and 15 O-H2O images were then coregistered to the corresponding structural MRI (FSL FLIRT), and transformed into the Montreal Neurological Institute (MNI) space from native space using MRI-guided spatial normalization (FSL FNIRT). The warped 18 F-FDG and 15 O-H2O images in MNI space were smoothed with a 4-mm sigma Gaussian kernel. Cortical and subcortical regions were masked using the MNI structural atlas (included in FSL), and proportionally scaled to a global mean value (mean value = 100) that was computed on the masked voxels. The normalized image representing the uptake of 18 F-FDG or 15 O-H2O was finally completed, and used for the subsequent volume-of-interest (VOI)-based and voxel-wise analyses.
Volumes-of-interest were carefully defined on PP, lateral parietal cortex (LPC), and frontal cortex (FC) as representative AD-related regions in MNI space (Figure 2). To create these VOIs, we used 18 F-FDG PET data from 15 patients with AD and 31 age-matched healthy controls that belong to a database at the Tokyo Metropolitan Institute of Gerontology. The study using the data has been published elsewhere. 11 Briefly, the first step was the detection of clusters representing glucose hypometabolic regions in AD by using voxel-wise analyses between the 15 AD patients and 31 controls. Next, each cluster was extracted at the appropriate level of statistical threshold depending on its location to include a large enough number of voxels. Then, its shape was modified to be symmetrical. Volumes-of-interest for PP, LPC, and FC were finally completed in MNI space (Figure 2). The VOI volumes were 1,263, 1,640, and 988 voxels for PP, LPC, and FC, respectively.
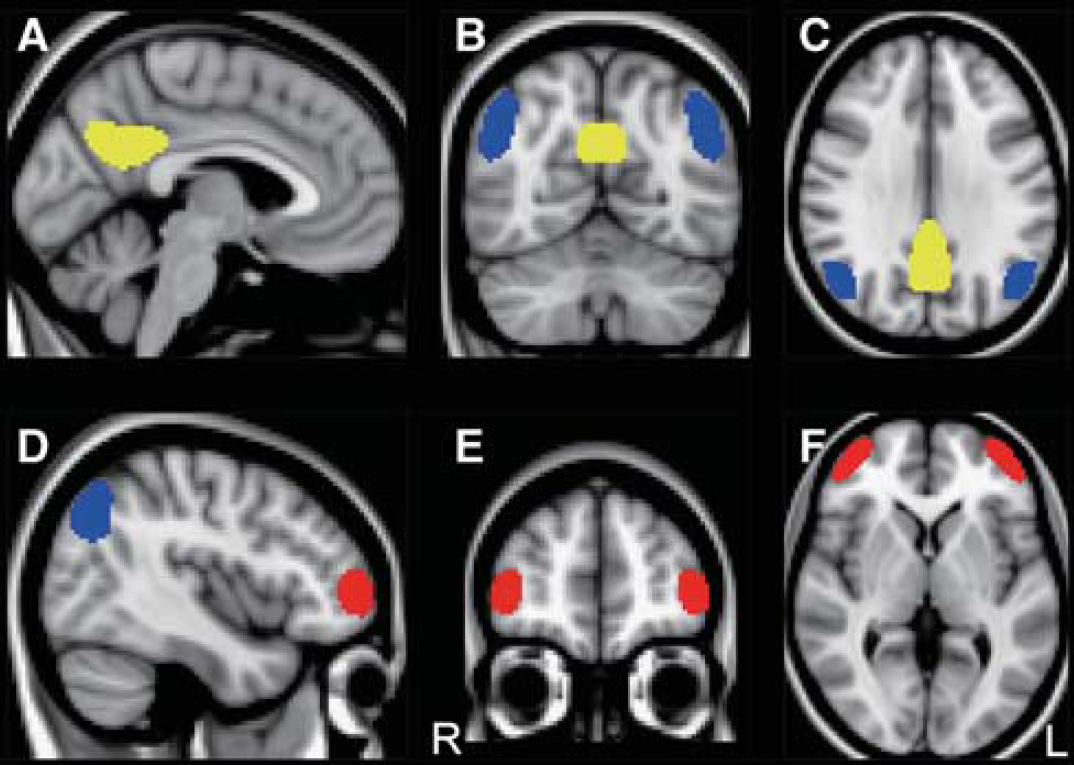
Volumes-of-interest (VOIs) in MNI space. VOIs placed on the precuneus/posterior cingulate (yellow), lateral parietal cortex (blue), and frontal cortex (red) are displayed on a MNI standard brain in sagittal (
Data Analysis and Statistical Analysis
The VOI-based analyses were performed to assess the effect of glucose loading on the uptake of 18 F-FDG and 15 O-H2O in AD-related regions. The VOIs for PP, LPC, and FC were moved on the normalized 18 F-FDG and 15 O-H2O images in MNI space, and the uptake values on the VOIs were extracted. We tested the differences in the uptake of 18 F-FDG or 15 O-H2O in each AD-related region between the fasting and glucose-loading conditions using a one-tailed paired t-test. The null hypothesis was that the uptake of 18 F-FDG or 15 O-H2O in each AD-related region did not decrease from the fasting to glucose-loading conditions. Statistical significance was set at P < 0.05.
Exploratory whole-brain voxel-wise analyses were then performed to corroborate the results of VOI-based analyses and to find every region where glucose loading altered the distribution pattern of both 18 F-FDG and 15 O-H2O and decreased the uptake of both radioligands, using Statistical Parametric Mapping, version 12 (SPM12; Wellcome Trust Center for Neuroscience, London, UK) implemented in MATLAB, version R2014a (The MathWorks, Natick, MA, USA). We specified a full factorial design, consisting of a 2 × 2 design with repeated measures (2 radioligands × 2 conditions). Statistical t map of 18 F-FDG (fasting): 1, 18 F-FDG (glucose loading): −1, 15 O-H2O (fasting): 1 and 15 O-H2O (glucose loading): −1′ contrast was calculated using a height threshold of P < 0.05, familywise error rate (FWE)-corrected, excluding clusters smaller than 50 voxels. The SPM t map was transformed to the P map.
RESULTS
The plasma glucose and insulin levels in the fasting and glucose-loading conditions, as well as the HOMA-IR values for the nine subjects are summarized in Table 1. These data confirmed that all subjects were free of insulin resistance and diabetes. After glucose loading, there was a significant increase in the levels of plasma glucose (P = 0.002, T = 3.92) and insulin (P < 0.001, T = 8.06) using a one-tailed paired t-test.
Plasma glucose and insulin levels in nine young volunteers
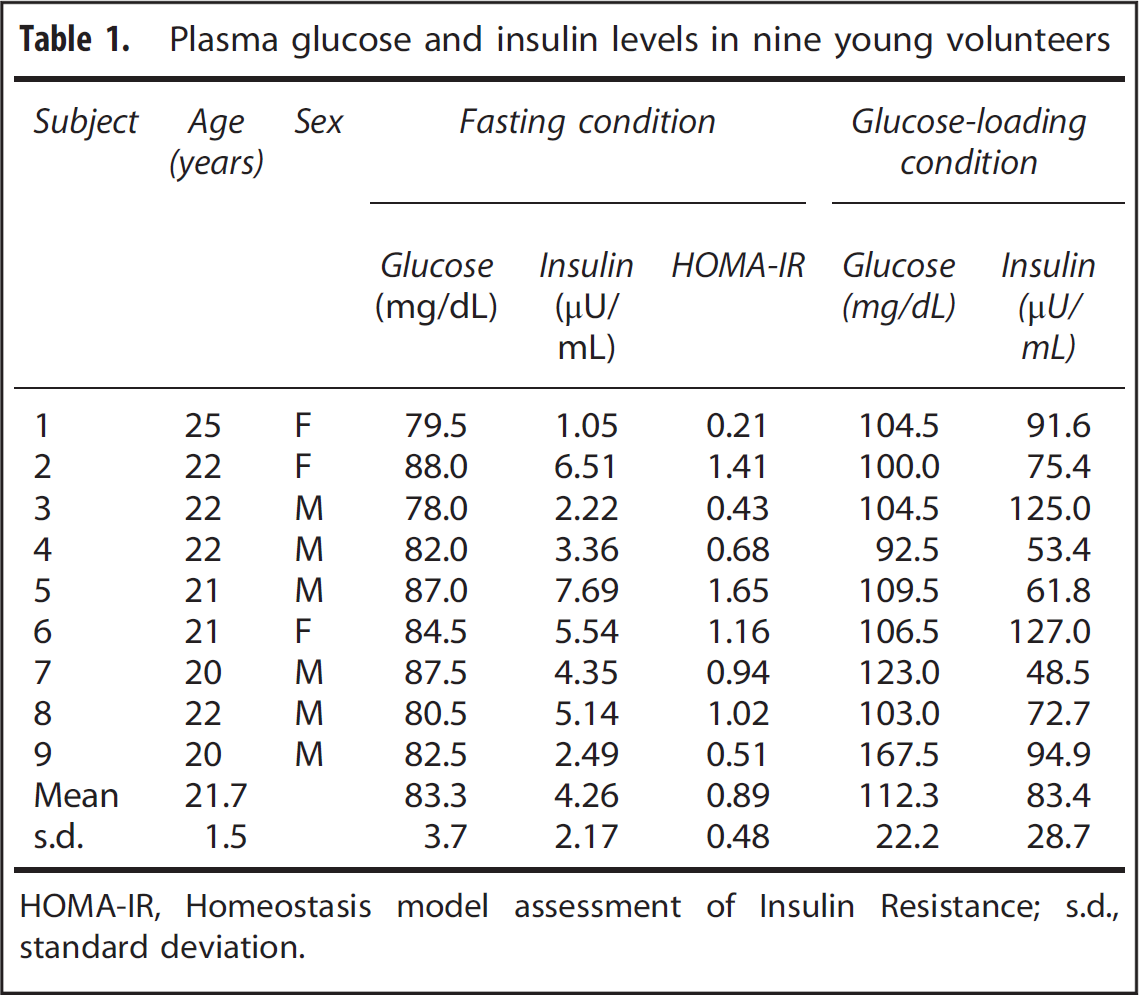
HOMA-IR, Homeostasis model assessment of Insulin Resistance; s.d., standard deviation.
The results from VOI-based analyses are shown in Table 2. After glucose loading, there was significantly lower uptake of 18 F-FDG in PP (P < 0.001, T = 4.75), LPC (P < 0.001, T = 5.28), and FC (P < 0.001, T = 4.80), and that of 15 O-H2O in PP (P = 0.004, T = 3.49), LPC (P = 0.032, T = 2.15), and FC (P = 0.025, T = 2.32). The decreasing uptakes of 18 F-FDG were 5.7%, 4.5%, and 3.7%, and those of 15 O-H2O were 2.1%, 1.4%, and 1.7% in PP, LPC, and FC, respectively. A representative case is displayed in Figure 3 (subject 3 in Table 2), where both 18 F-FDG and 15 O-H2O uptake decreased especially in the PP after glucose loading.
Uptake values of 18F-FDG and 15O-H2O in the fasting and glucose-loading conditions
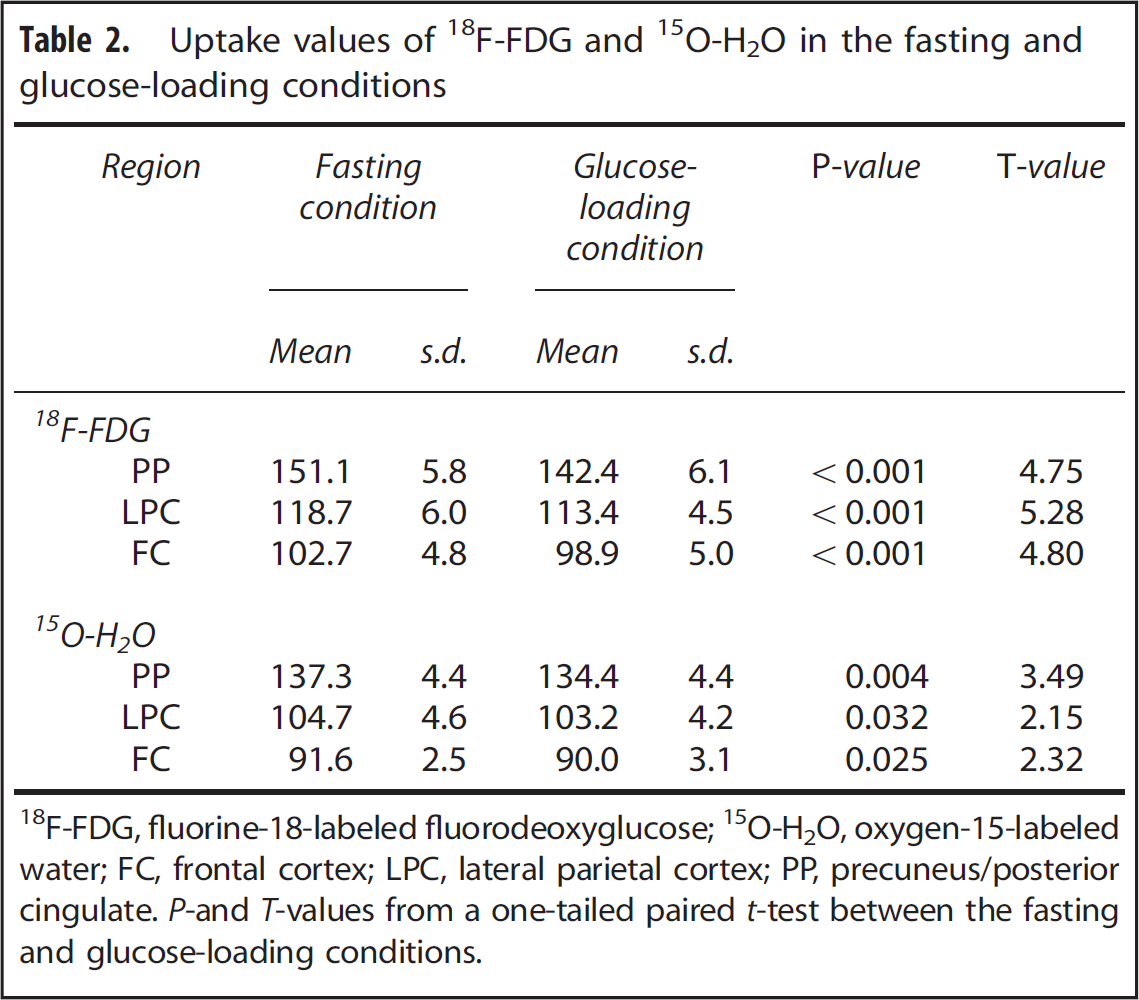
F-FDG, fluorine-18-labeled fluorodeoxyglucose; 15O-H2O, oxygen-15-labeled water; FC, frontal cortex; LPC, lateral parietal cortex; PP, precuneus/posterior cingulate. P-and T-values from a one-tailed paired t-test between the fasting and glucose-loading conditions.
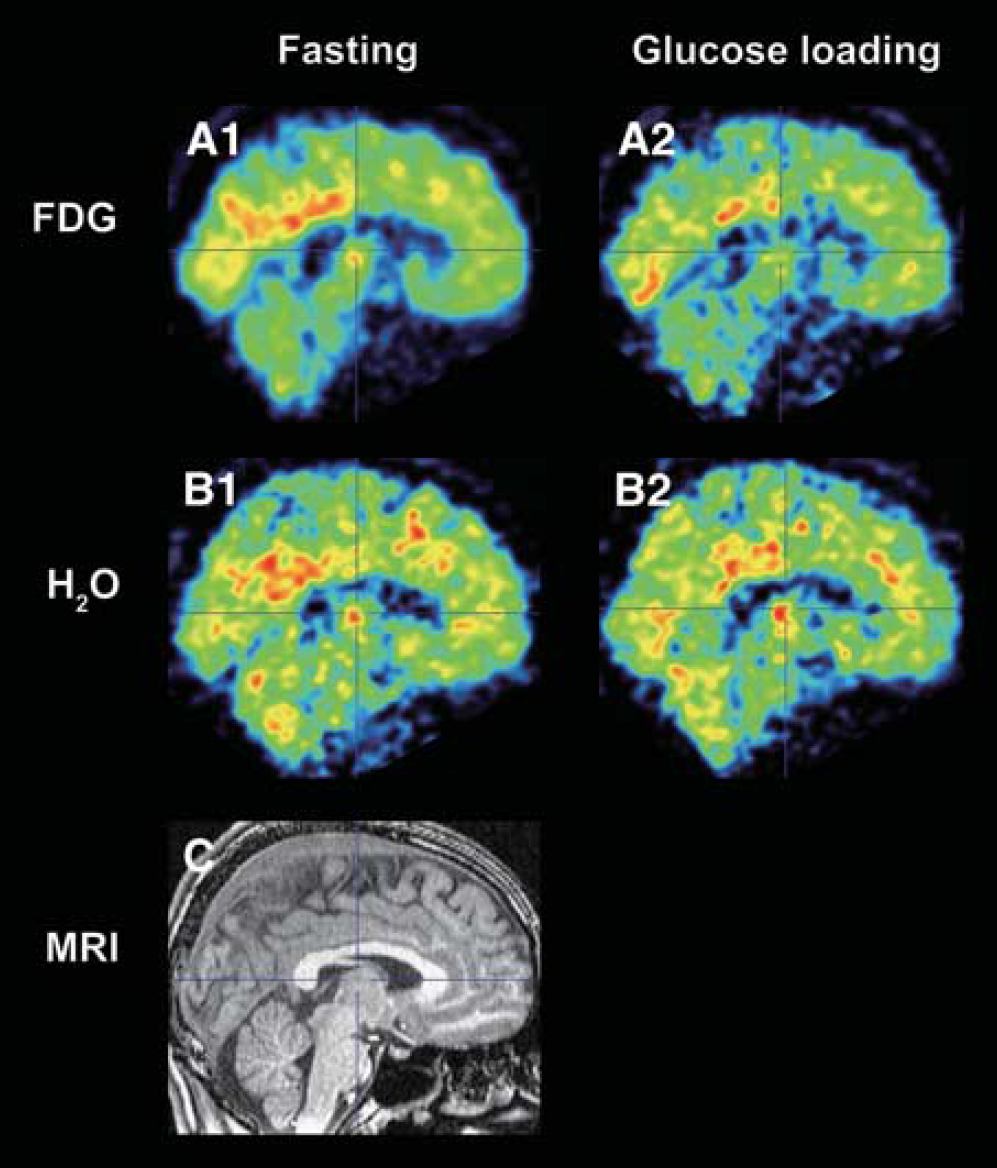
A representative case of fluorine-18-labeled fluorodeoxyglucose (
18
F-FDG) and oxygen-15-labeled water (
15
O-H2O) images. The
18
F-FDG (
Exploratory whole-brain SPM analyses revealed three clusters at P < 0.05 (T > 5.05), FWE-corrected, located in the PP, LPC, and FC areas (Figure 4). The MNI coordinates of each peak-level voxel in the three clusters were included in the PP, LPC, and FC VOIs that we specified as AD-related regions.
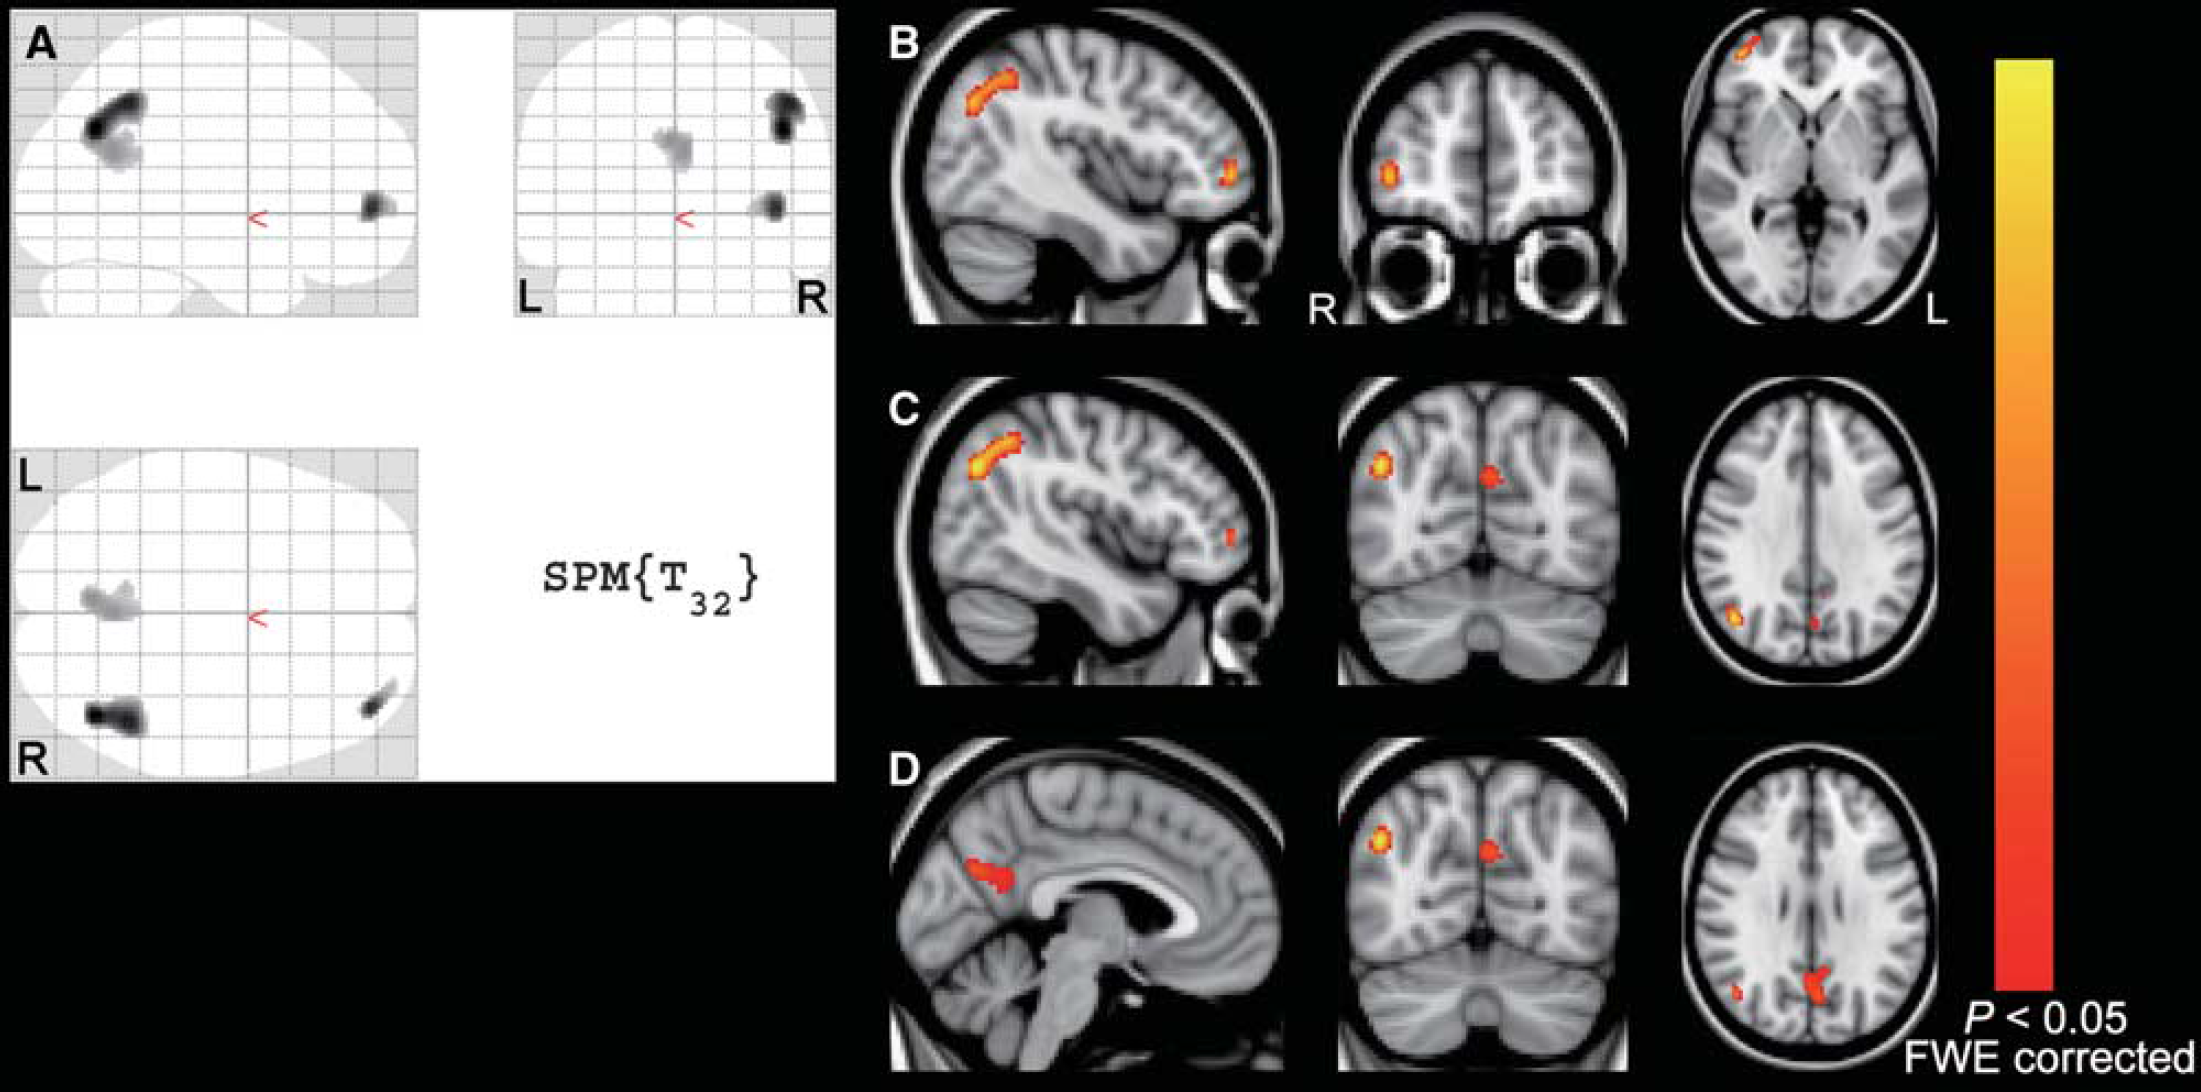
Results of whole-brain voxel-wise analyses. Three significant clusters at P < 0.05, FWE-corrected (T value > 5.05) are displayed on SPM glass brain (
DISCUSSION
Increased plasma glucose levels can alter the cerebral distribution pattern of 18 F-FDG from normal to AD-like in cognitively normal subjects8,9,11 In an 18 F-FDG PET study of nine healthy older subjects, glucose loading yielded the appearance of the AD-like pattern. 8 The AD-like pattern after glucose loading can be reversible, and independent of amyloid-β deposition and the apolipoprotein E ∊4 genotype. 10 In a cross-sectional study of 124 cognitively normal older subjects, higher fasting plasma glucose levels were significantly correlated with the magnitude of reduced uptake of 18 F-FDG in AD-related regions. 9 The AD-like pattern in the fasting condition can appear even in an individual with mildly higher levels of fasting plasma glucose, from 100 to 110 mg/dL. 11 The VOI-based and voxel-wise analyses in this study provided additional findings that glucose loading alters the distribution pattern of 18 F-FDG as well as 15 O-H2O and reduces the uptake of both radioligands in AD-related regions leading to the appearance of the AD-like pattern, and that the 18 F-FDG images may have relatively higher sensitivity for the detection of the AD-like pattern than 15 O-H2O images.
The present study showed that the decreasing uptakes of 18 F-FDG and 15 O-H2O were 3.7% to 5.7% and 1.4% to 2.1%, respectively, in the AD-related regions. According to the recent diagnostic guidelines for AD, 17 the clinical stages of AD are classified into the preclinical, mild cognitive impairment, and dementia stages. The 18 F-FDG uptake, which is a marker for synaptic dysfunction, may start to decrease in the preclinical AD stage, and its uptake in AD-related regions continues to decrease along with disease progression. 17 Actually, the magnitude of the reductions in 18 F-FDG uptake and CBF in AD-related regions is greater in the dementia stage than in the mild cognitive impairment stage. 7,18 When the 18 F-FDG data were collected from 15 patients with AD whose Mini-Mental State Examination scores were around 20 and who belonged to a database at the Tokyo Metropolitan Institute of Gerontology, 18 F-FDG uptake in the PP area was decreased by roughly 25% compared with controls. 11 The magnitude of the reductions can depend on how the 18 F-FDG uptake values are normalized. However, based on previous reports,7,11,17 the amounts of the decreased uptake of 18 F-FDG and 15 O-H2O that were observed in this study were definitely small compared with those in patients with typical AD but may be comparable to some patients in the mild cognitive impairment or early dementia stage. Therefore, we suggest that it is essential to pay attention to at least plasma glucose levels when diagnosing AD with 18 F-FDG or CBF images to avoid image misinterpretation.
Increased plasma glucose levels are known to cause changes in glucose transport and enzyme hexokinase activity to preserve glucose consumption leading to changes in the kinetic constants (K1, k2, and k3). 19 Since 18 F-FDG uses the same transporters and the same enzyme hexokinase, the kinetic constants of 18 F-FDG change in the same way. Additionally, 18 F-FDG competes with glucose for the transporters and hexokinase. 5 Thus, hyperglycemia reduces the cerebral uptake of 18 F-FDG,20–23 although global CMRglc in a whole brain may be unchanged.19,24–26 The effects of hyperglycemia on the cerebral uptake of 15 O-H2O have not been investigated to our knowledge, although global CBF in a whole brain have been reported to be unchanged 26 or decreased.27–29 However, experimental studies with rats showed that induction of hyperglycemia affected both rCMRglc and rCBF, and that the magnitude of changes in rCMRglc and rCBF during a hyperglycemic state was different between brain regions in cortical and subcortical gray matter and white matter,19,27 indicating that induction of hyperglycemia can alter the distribution pattern of both rCMRglc and rCBF in a whole brain. The mechanisms underlying the reductions in rCBF during hyperglycemia may be a result of increased cerebrovascular resistance from plasma hyperosmolality, increased blood viscosity, and decreased rCMRglc. 27 In this study, we assessed the changes in the distribution pattern of 18 F-FDG and 15 O-H2O, using relative values from a global normalization method. Our observations may suggest that the PP, LPC, and FC areas are vulnerable to hyperglycemia in human brain.
Increased insulin levels are usually observed with increased plasma glucose levels,30,31 and their increase in the fasting condition is associated with greater insulin resistance. 32 Since insulin affects glucose utilization in the central nervous system,33,34 it has an important role in modulating regional brain activity. Baker et al 35 recently reported that in 23 cognitively normal patients with prediabetes or early type-2 diabetes, greater insulin resistance was associated with reduced uptake of 18 F-FDG in AD-related regions. 35 In their study, mean levels of fasting blood glucose and insulin in the patient group were 107.1 mg/dL (mildly increased) and 17.1 μU/mL (moderately increased), respectively, leading to an increase in the index of insulin resistance, HOMA-IR. Meanwhile, the young volunteers in this study were free of insulin resistance in the fasting condition; however, reductions in 18 F-FDG and 15 O-H2O uptake were observed in AD-related regions with increased levels of plasma glucose and insulin after glucose loading. Our current observations are fundamentally consistent with those of Baker et al, but additionally provided initial evidence that the appearance of the AD-like pattern can occur with increased levels of plasma glucose and insulin, independent of whether an individual has insulin resistance or not. To understand the relationships of the AD-like pattern with the two factors of glucose and insulin, further studies that investigate which factor is more likely to explain the appearance of the AD-like pattern are needed.
The PP, LPC, and FC areas overlap with the functional anatomy of the default mode network (DMN). 36 The DMN is characterized by high activity when the mind is not engaged in specific behavioral tasks and low activity during focused attention on the external environment, and has an important role in regulating complex cognition and behavior.37–39 Its functional connectivity is impaired in patients with AD and asymptomatic older individuals with amyloid-β accumulation, 40 and its impairment is associated with current and future cognitive decline. 41 Interestingly, the functional connectivity in the DMN also decreases in cognitively normal patients with diabetes. 42 This shared vulnerability of the DMN between diabetes and AD may be a vital component of the link between increased plasma glucose and insulin levels and the appearance of the AD-like pattern in 18 F-FDG and 15 O-H2O images.
There are some limitations in this study. First, the sample size was relatively small. Since the 15 O-H2O images were created by only 1 minute of scanning, they included a certain amount of noise that might reduce statistical power in VOI-based analyses from 15 O-H2O images compared with those from 18 F-FDG images. Second, no randomization was used in the setup of the study. Therefore, systemic bias effects may have been present. Another limitation was that we used relative values to quantitatively assess the changes in the distribution patterns of 18 F-FDG and 15 O-H2O uptake because the method has smaller intersubject and intrasubject variability than the absolute values of rCMRglc, this substantially increases the statistical power. 2 However, it is essential to quantitatively assess rCMRglc to understand the phenomena observed in the study. Our results need to be replicated in future studies with a larger sample size, randomization, arterial blood sampling, and kinetic analysis for quantitative assessment of rCMRglc and rCBF.
CONCLUSION
This study showed that glucose loading altered the distribution pattern of both 18 F-FDG and 15 O-H2O and reduced the uptake of both radioligands in AD-related brain regions, suggesting that increased plasma and insulin levels induce the appearance of an AD-like pattern in both 18 F-FDG and 15 O-H2O images. This study also provides initial evidence that the phenomenon can occur even in subjects without insulin resistance.
AUTHOR CONTRIBUTIONS
KK and K Ishii designed research and performed research; K Ishibashi and K Ishii analyzed data; K Ishibashi, KK, K Ishiwata, and K Ishii wrote the paper.
DISCLOSURE/CONFLICT OF INTEREST
The authors declare no conflict of interest.
Footnotes
ACKNOWLEDGMENTS
The authors thank Ms. Hiroko Tsukinari and Mr. Kunpei Hayashi for their technical assistance.