
Abstract
The cerebrovascular sequelae of diabetes render victims more susceptible to ischemic stroke, vascular cognitive impairment, and Alzheimer's disease. However, limited knowledge exists on the progressive changes in cerebrovascular structure and functional remodeling in type 2 diabetes. To ascertain the impact of diabetes on whole-brain cerebrovascular perfusion, leptin-receptor-deficient mice were transcardially injected with tomato-lectin before sacrifice. The whole brain was clarified by the Fast free-of-acrylamide clearing tissue technique. Functional vascular anatomy of the cerebrum was visualized by light-sheet microscopy, followed by analysis in Imaris software. We observed enhanced neovascularization in adult db/db mice, characterized by increased branch level and loop structures. Microvascular hypoperfusion was initially detected in juvenile db/db mice, suggesting early onset of insufficient microcirculation. Furthermore, gliovascular unit remodeling was verified by loss of pericytes and overactivation of microglia and astrocytes in adult diabetic mice. However, the integrity of the blood-brain barrier (BBB) was fundamentally preserved, as shown by a lack of extravasation of IgG into the brain parenchyma. In summary, we, for the first time, reveal that functional cerebrovascular remodeling occurs as early as four weeks in db/db mice and the deficit in gliovascular coupling may play a role in cerebral hypoperfusion before BBB breakdown in 16-week-old db/db mice.
Introduction
Diabetes mellitus (DM) is a chronic metabolic disease characterized by progressive insulin resistance and hyperglycemia, with accompanying vascular complications as the disease progresses.1–3 Morphologically, excessive neovascularization is a critical pathological characteristic in diabetic retinopathy, nephropathy, and atherosclerotic plaque. 4 In the central nervous system (CNS), DM can increase the risk of developing neurological disorders, including ischemic stroke, vascular dementia, and Alzheimer's disease.5–8 However, progressive cerebral vascular dysfunction has not been fully illustrated in type 2 diabetes mellitus (T2DM) patients, but it has been more intensely studied in animal models of T2DM.
T2DM animal models have been instrumental in unraveling the pathological mechanisms underlying diabetes. In Goto-Kakizaki (GK) type 2 diabetes rats, increased cerebral angiogenesis and arteriogenesis accompanied by reduced cerebral blood flow have been observed.9,10 On the other hand, hyperglycemia has been shown to improve the vascular volume and surface area in the brain parenchyma in diabetic animals compared to control groups. 11 Among various obesity-induced T2DM animal models, the leptin-receptor-deficient mouse (db/db) is one of the most widely used diabetic models to investigate related disorders, including neurological diseases.12,13 However, cerebral vascular dysfunction has yet to be thoroughly investigated in db/db mice. Due to technological limitations, cerebrovascular complications have only been investigated in brain slices and none of the previous studies showed any aberrations in the whole-brain vascular networks in any diabetic animal models.
Neurological disorders like stroke and cognitive deficits frequently co-occur in T2DM,1,3 and these disorders may share various underlying mechanisms. One shared mechanism might be the dysfunction of the gliovascular unit. As crucial components of this structure, pericytes and astrocytes are essential to the blood-brain barrier (BBB) formation and maintenance, as well as angiogenesis, capillary stabilization, and cerebral blood flow (CBF) perfusion.14–17 Hyperglycemia causes the downstream platelet-derived growth factor receptor beta (PDGFRβ) signaling transduction cascade to induce pericyte apoptosis in the streptozotocin (STZ)-induced diabetic model. 18 In PDGF-B retention motif knockout mice (Pdgfbret/ret), pericyte loss led to increased BBB permeability to water and even large proteins. 14 In diabetic animal models, although some experimental evidence has demonstrated that BBB integrity is compromised,19–21 a recent study reported that no significant difference was observed in Evans blue and 10 kDa dextran tracer leakage in adult db/db mice. 22 Thus, the permeability of the BBB under diabetic conditions deserves further investigation.
In this study, functional vessels were labeled by transcardially injecting lectin into juvenile and adult db/db mice. We used the Fast free-of-Acrylamide Clearing Tissue (FACT) technique to clarify the whole brain and then visualized lectin labeled-vessels by light-sheet microscope to reveal comprehensive and detailed morphological and functional remodeling of cerebral vessels from an early age in leptin receptor-deficient mice. We also examined whether there was any reconfiguration of the gliovascular unit in these mice.
Materials and methods
Animals
Male diabetic (db/db, BKS-Leprem2Cd479) and wide-type mice (WT, C57BLKS/J) were purchased from the Nanjing Biomedical Research Institute of Nanjing University. Animals were housed in a pathogen-free animal facility with regulated temperature and humidity and a 12-hour light/dark cycle. A standard rodent diet and water were available ad libitum. All animal procedures were approved by the Animal Care and Use Committee of Fudan University and performed according to the National Institutes of Health Guide for the Care and Use of Laboratory Animals. All efforts were made to minimize animal suffering and the number of animals used. All animal experiments complied with the ARRIVE guidelines. 23
Perfused vessel labeling
Mice were anesthetized with 1.5% isoflurane in a 30% O2/70% N2 gas mixture. Fluorescein-conjugated L. esculentum (tomato) lectin (Vector Labs, Burlingame, CA) at a dose of 1.25 mg/kg body weight was transcardially injected and circulated for at least 10 minutes. Then, animals were slowly perfused with 0.9% NaCl followed by 4% paraformaldehyde (PFA) in phosphate buffered saline (PBS). Brain tissue was collected and stored in 4% PFA.
Whole-brain clearing and imaging
The FACT process was performed as previously described to clear the whole brain tissue. 24 Briefly, brain tissue was postfixed in 4% PFA for four days and cleared with 12 mL 8% sodium dodecyl sulfate (SDS, Sigma-Aldrich, USA) in 0.1 M PBS (pH 7.5). The clearing process was conducted at 37°C for about 20 days with gentle shaking (100 rpm). The clearing solution was replaced every day for the first three days and then once every six days. After clearing, brain tissue was further washed with 0.01% PBS with tween 20 (PBST) for 24 hours at 37°C with gentle shaking. Cleared brain tissue was treated with Focus Clear (CelExplorer Labs, Taiwan, China) for 2 hours before imaging. Raw fluorescence images of perfused vessels in the brain were captured by light-sheet fluorescence microscopy (Light-sheet Z.1, Zeiss, Oberkochen, Germany) equipped with a Zeiss Light-sheet Z.1 detection module and ZEN imaging software (Zeiss, Oberkochen, Germany). For imaging, Z-stack and Multiview tools were set with a 15% overlap in the software. The images were scanned at 1800 × 1800 pixels in the x–y direction, and 5-μm step-size optical sections along the z-axis using a 5× objective lens. The raw data of the CZI format were processed by Arivis software (Arivis AG, Rostock, Germany). Images were stitched into a series of whole-brain transverse images and exported in TIFF format in Arivis software.
3D Reconstruction and quantification by imaris
The Imaris software (V.8.0, Bitplane, Zurich, Switzerland) was used to reconstruct three-dimensional images of tomato-lectin immunofluorescence. Briefly, TIFF images were imported into Imaris. Immunosignal was remodeled to 3 D images by the filament tool with four default steps in Imaris, including algorithm, preprocessing, segmentation, and graph compilation. The loops algorithm and absolute intensity of source channel were used for reconstruction. The Source channel was selected, and Appr. Filament Diameter was set at 25 μm. A threshold was set manually to differentiate the target signal from the background. Minimal Ratio of Branch Length to Trunk Radius was defined as 5 in graph compilation to remove non-specific signals. Then the 3 D‐rendered images were constructed. All the images were processed with the same parameters. To analyze perfused vessel branches in diabetic mice and WT mice, the Filter function in the filament tool was used to filter reconstructed vessels with branch level between level 1 to level 5 prior to the analysis. The proportion of perfused vessels with different diameters was also calculated using the filament tool to filter reconstructed vessel branches within the indicated diameters. All analyses were conducted in the statistics function of the filament tool.
To reconstruct stained images, the surface tool was used with four default steps in Imaris, including algorithm, Source channel, Threshold, and Classify Surfaces steps. The default algorithm was set. A threshold was set manually to differentiate the target signal from the background. Filter was used in the Classify Surfaces mode to remove non-specific signals. Then the 3 D‐rendered images were constructed. All the images were processed with the same parameters.
Immunohistochemistry and image analysis
Mice were deeply anesthetized and transcardially perfused with 0.9% NaCl, followed by 4% (wt/vol) PFA in PBS. Brains were harvested and cryoprotected in 30% sucrose in PBS, and frozen serial coronal brain sections (25-μm thick) were prepared on a cryostat (CM1900; Leica Wetzlar, Germany). Sections were blocked with 10% donkey serum in PBS for 1 hour, followed by overnight incubation (4°C) with the following primary antibodies: mouse anti-PDGFRβ (1:100; Abcam), rabbit anti-glial fibrillary acidic protein (GFAP) (1:500; WAKO), and anti-ionized calcium binding adapter molecule 1 (Iba1) (Abcam, 1:500). After washing, sections were incubated for 1 hour at room temperature with donkey secondary antibodies conjugated with DyLight 405, Cy3, or 647 (1:1,000; Jackson ImmunoResearch Laboratories, Inc. West Grove, PA). M.O.M. kit (Vector, Burlingame, CA, USA) was applied when using mouse primary antibody on brain slices from mice. Cerebral blood vessels were stained using Fluorescein-conjugated L. esculentum (tomato) lectin (1:2,000; Vector Labs, Burlingame, CA). IgG was marked by biotinylated anti-mouse IgG Reagent (1:500; Vector, Burlingame, CA, USA) and then followed by streptavidin-conjugated Cy3. Brain sections were mounted and coverslipped with Fluoromount-G containing DAPI (Southern Biotech, Birmingham, AL). Z-stack fluorescence images were taken with an Olympus Fluoview FV1000 confocal microscope (Olympus America, Center Valley, PA) by an investigator blinded to experimental group assignment. Three ROIs were randomly selected from each brain slice. A total of 7 consecutive images with an interspace of 1.5 μm and a total volume of 1.04 × 10⁻³ mm3 were captured for each microscopic field in the selected ROI. Analysis of the gliovascular unit and IgG was conducted by ImageJ software by an observer blinded to group assignment. Analysis of vascular morphology and interaction between microglia and vessels was accessed using the filament tool in Imaris software by an observer blinded to group assignment.
Statistical analysis
Shapiro-Wilk test was used to determine the normality of the data. Normally distributed data are reported as mean ± SD, while non-normal variables are presented as median (interquartile range [IQR]). Statistical analysis was performed using GraphPad Prism 8 (GraphPad Software, San Diego, CA). Multiple group analyses were performed by one- or two-way ANOVA followed by Bonferroni post hoc test for normal distribution datasets. Non-normal distribution datasets were compared using Kruskal-Wallis ANOVA followed by Dunn's post hoc test. The difference in means between two groups was assessed by the two-tailed Student's t test (normal distribution) or Mann-Whitney U test (non-normal distribution). The Bartlett test analyzed the constancy of variances, and a Welch correction was used if not satisfied. All n and p values and statistical tests are indicated in figure legends. A p value less than 0.05 was deemed statistically significant. All statistics are summarized in S Table 1.
Results
3D visualization of whole-brain functional cerebral blood vessels in db/db mice
T2DM is a chronic disease characterized by persistent high blood glucose levels with insulin resistance. Among genetically manipulated spontaneous diabetic models, the db/db mouse model has been widely used to investigate diabetes-induced neurological disorders. 13 To determine the effect of hyperglycemia on cerebrovascular architecture development, juvenile (4-week-old) and adult (16-week-old) db/db and WT mice were used in this study (Figure 1(a)). Body weight and blood glucose levels were significantly higher in diabetic mice compared to similarly aged WT mice. Despite an increase in body weight, blood glucose levels in 16-week-old WT mice were no different than 4-week-old WT mice. In db/db mice, the blood glucose level was remarkably upregulated as early as four weeks after birth and was even higher in the db/db adult mice (Figure 1(b) and (c)).
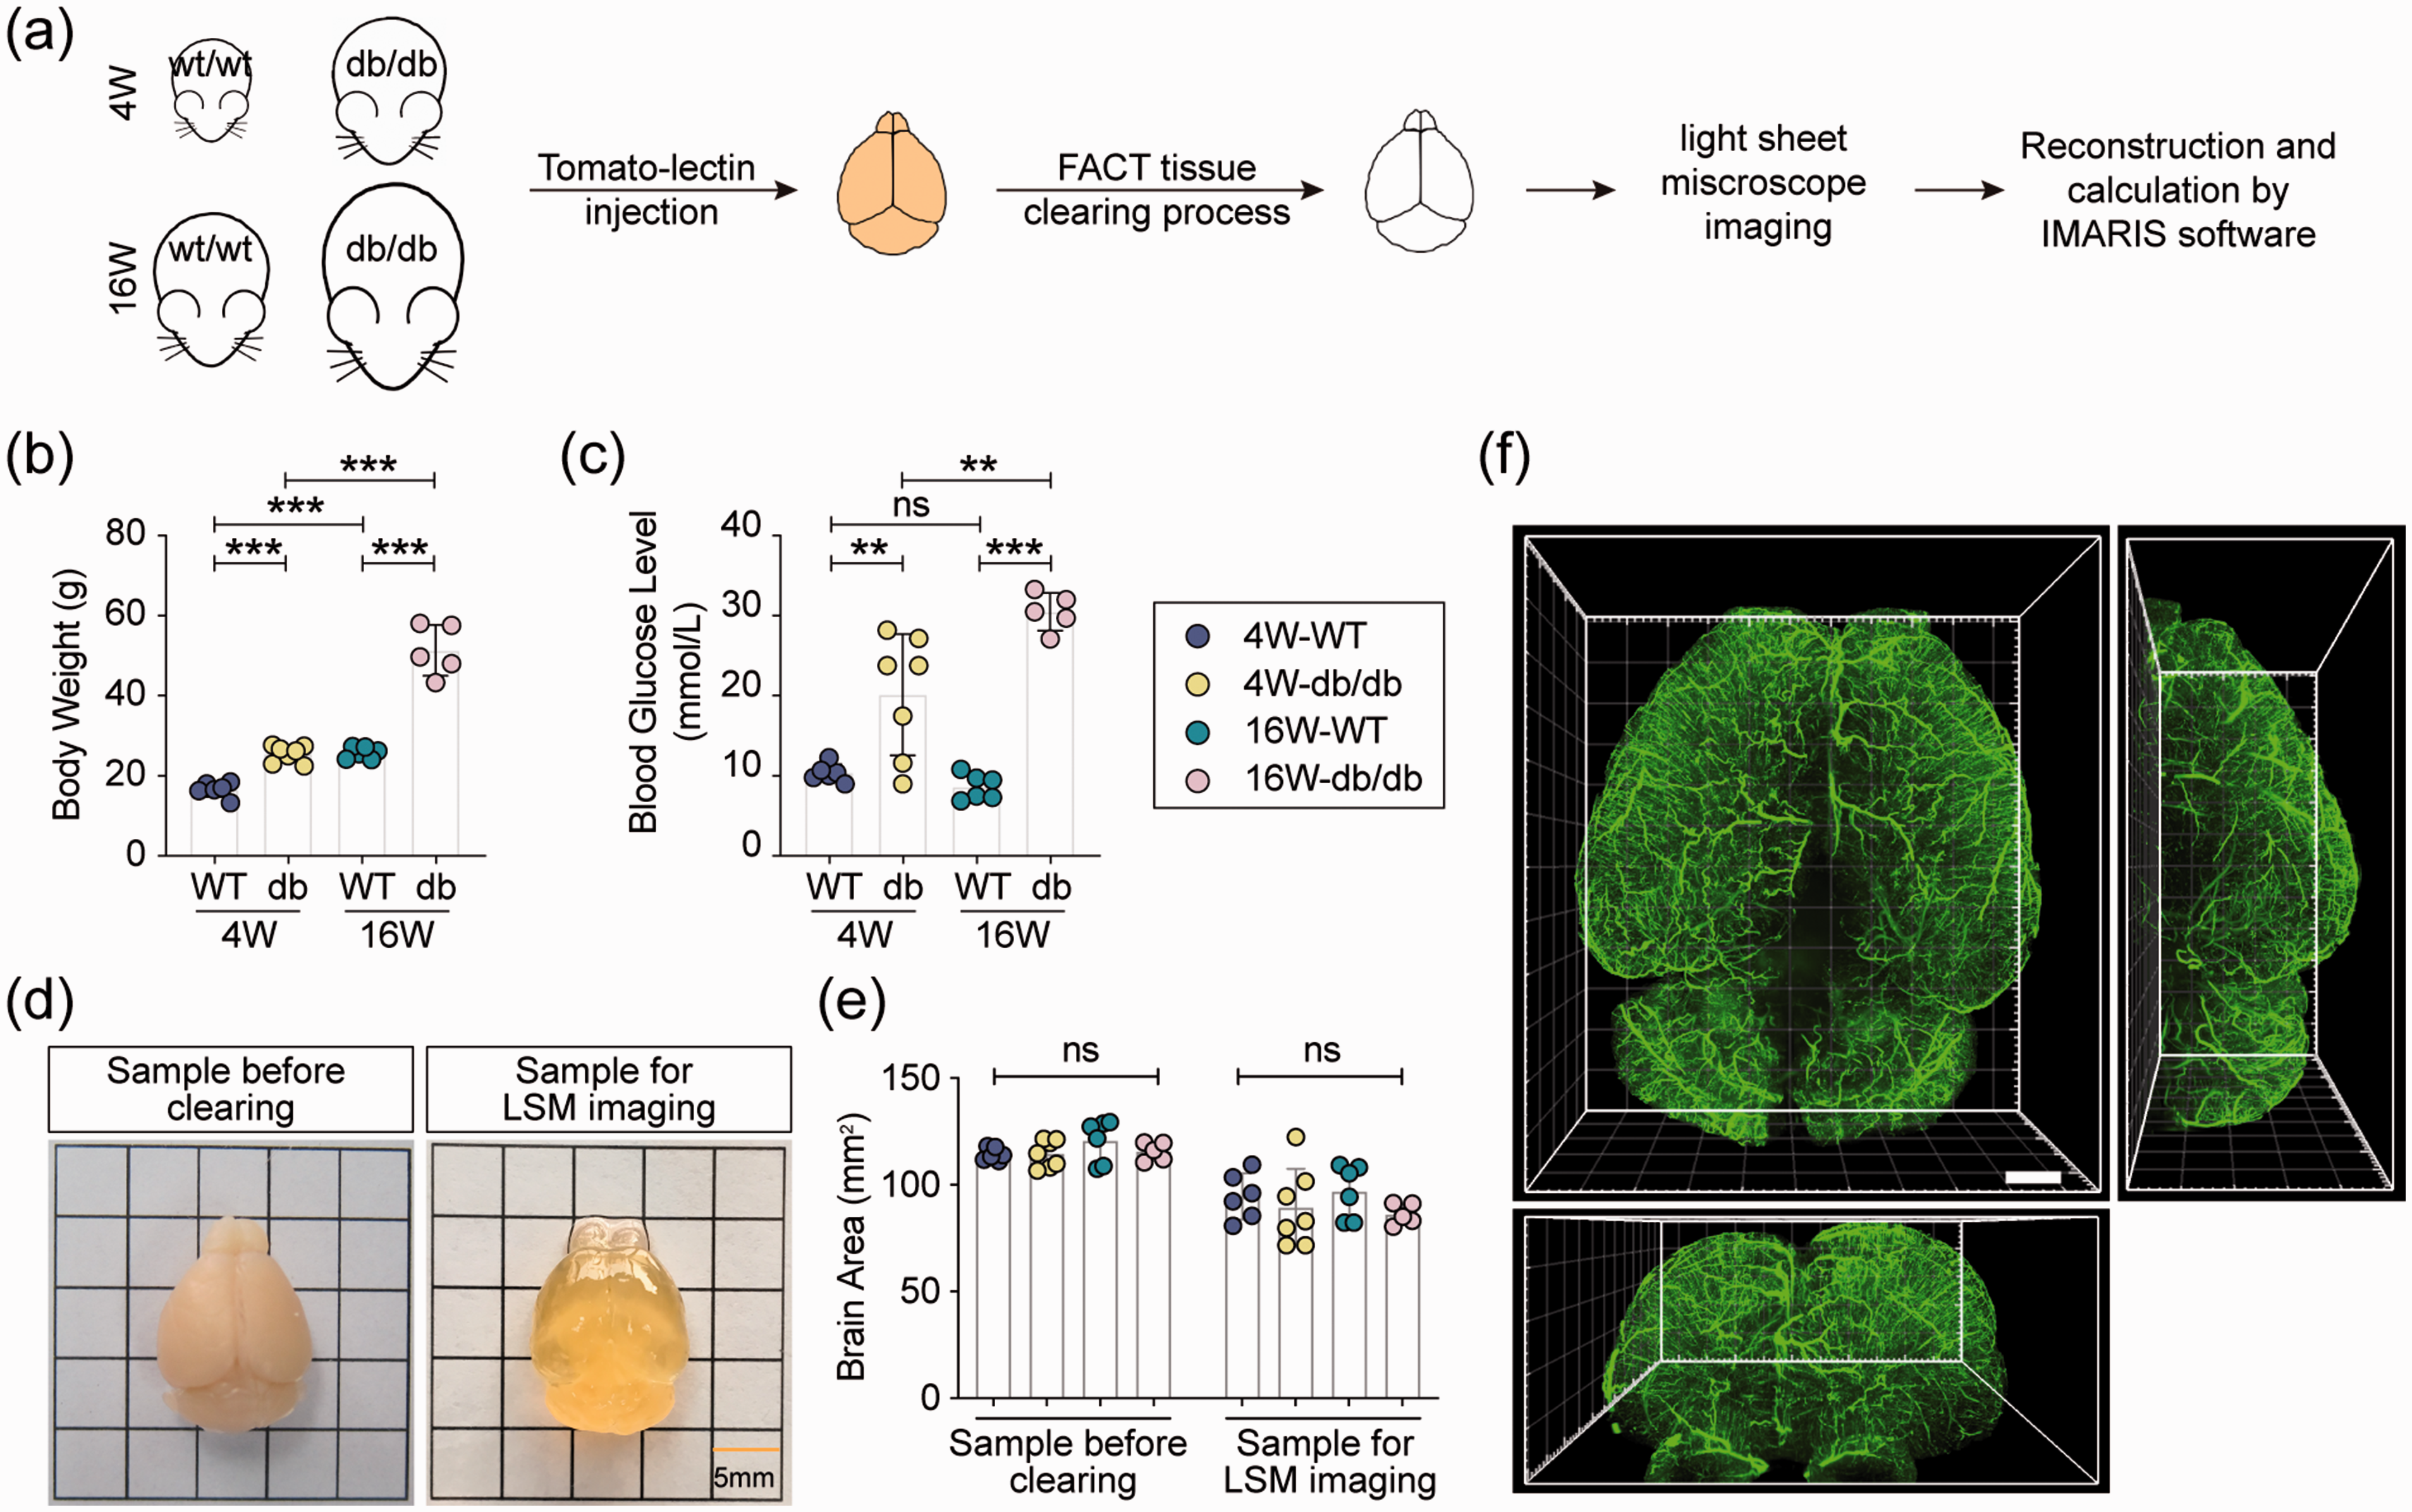
3D reconstruction and visualization of whole-brain cerebral blood vessels. (a) Experimental outline. Functional vessels were labeled by fluorescein-conjugated tomato-lectin in WT and db/db mice at 4 and 16 weeks of age. After clearing, blood vessels in the mouse brain were visualized by light-sheet microscopy (LSM) and then reconstructed in Imaris software. (b) Body weight and (c) blood glucose concentration of WT and db/db mice. (d) Representative image of the whole brain before and after clearing for light-sheet microscope imaging. (e) Quantification of brain area before clearing and LSM imaging, respectively. No significant difference was detected between the four groups. (f) Representative image of whole-brain perfused blood vessels labeled by tomato-lectin. Scale bar = 1000 μm. n = 5–7 mice per group, ns = no significant difference, **p < 0.01, ***p < 0.001 vs. indicated group using two-way ANOVA followed by Bonferroni post hoc test.
To visualize all of the perfused cerebral vasculatures, FACT was performed to clarify the whole mouse brain labeled with tomato-lectin (Figure 1(d) and Supplementary Video 1). No significant difference was detected in the brain area before or after clearing and imaging (Figure 1(e)). The functional cerebral blood vessels were captured by light-sheet microscopy, and 3 D reconstruction of lectin-labeled vessels was conducted in Imaris software (Figure 1(f)).
Enhanced neovascularization in adult db/db mice
The cerebrovascular branch point was automatically identified by Imaris (Figure 2(a), green sphere). A marked increase in the number of loop structure was detected in the whole-brain vasculature, characterized by more vessel branch points and fewer terminal points in 16-week-old db/db mice (Figure 2(a) and (b)). Cerebral vessels were straighter in adult db/db mice than in WT mice. However, no significant difference was detected in the mean orientation angle of perfused vessels among the four groups (Figure 2(c) and (d)). Vasculature growth via branching morphogenesis is characterized by outgrowth of smaller branches during the development process. To further confirm cerebrovascular branching dysfunction in the diabetic brain, branch level as defined based on the branch points in Imaris software was calculated. As shown in Figure 2(d), the start of larger vessels was automatically recognized as level 1, and then the level number was increased with branching. No significant difference existed in the mean branch level between juvenile and adult WT mice. However, it was robustly augmented in adult db/db mice compared to similarly aged WT mice, suggesting that chronic hyperglycemia enhanced neovascularization (Figure 2(e) and (f)). The higher branch depth, with branch depth defined as the total number of branch points in the shortest path from the beginning to the end of vessel segments, supported the enhanced neovascularization in adult db/db mice (Figure 2(g)).
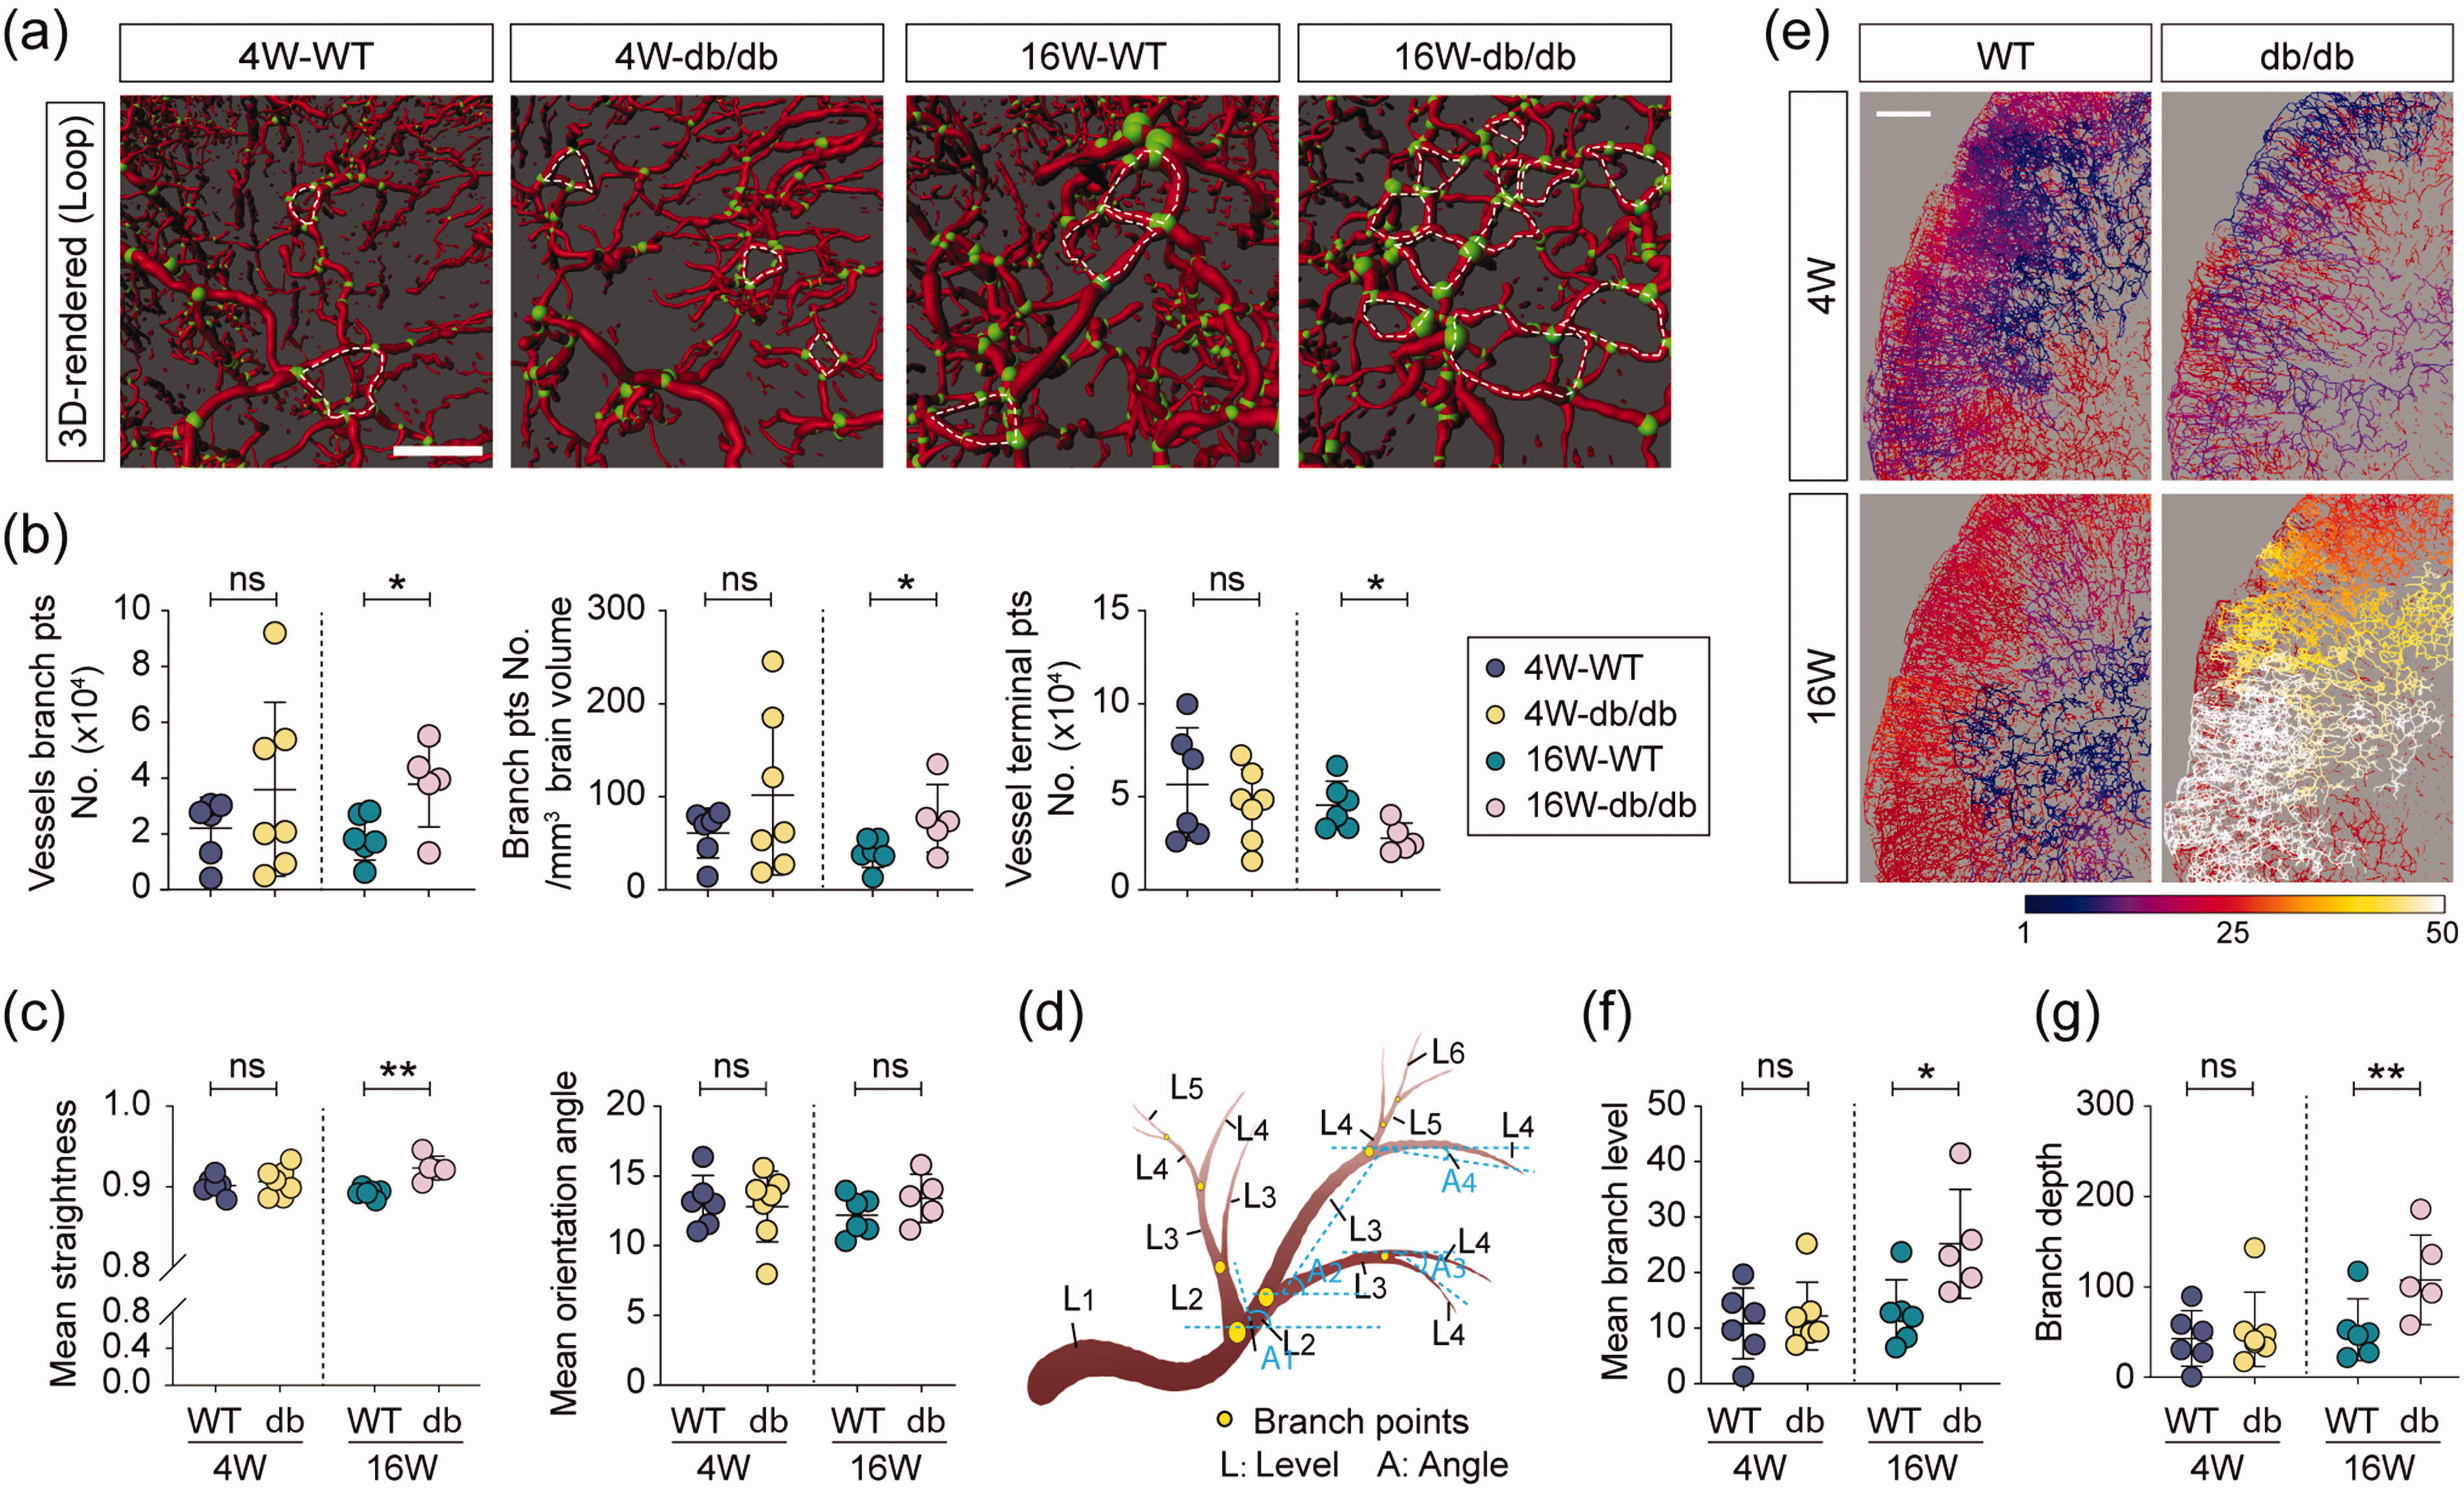
Cerebral neovascularization in adult db/db mice. (a) Vascular loop illustrated in 3D-rendered structure of perfused blood vessels, Red: vessels, scale: 0.4, green: branch points, white circles: loop structures, scale bar = 400 μm. (b) Quantification of the vessel branch points number, branch points number per mm3 brain volume, and vessel terminal points number in whole-brain perfusion vascular network structure. (c) Quantification of the mean straightness and orientation angle of lectin+ vessels. (d) Illustration of branch levels and vessel branch orientation angles. Branch level is a numerical structure that starts from the filament beginning toward the terminal points, assigning branch level to vascular segments at each branching point. The branch level number is assessed according to the diameter calculations of the individual vascular segments. The initial branch level at the beginning point is level 1. At each branching point, the vascular segment with a smaller mean diameter sequentially increases branch level (as shown L1 to L6). The vessel branch orientation angles are the angle formed between extended lines connecting distal vertices of the vascular segment and X-axis of the image within the XY plane. (e) 3D-rendered whole-brain perfusion vessels in line mode and color scaled by branch level. Scale bar = 800 μm. (f-g) Quantification of the whole brain mean branch level (f) and branch depth (g, the total number of branch points in the shortest path from the beginning to the end of vessel segments). n = 5–7 per group, ns = no significant difference, *p < 0.05, **p < 0.01 vs. WT using two-tailed Student’s t test for equal variances, and Welch’s t test for unequal variances.
Remodeling of functional cerebrovascular architecture begins as early as four weeks after birth
To investigate the effect of DM on cerebral blood perfusion, we initially calculated the total number of vessels, and the length, inner surface area, and volume of perfused vessels. No significant difference was detected between WT and db/db mice at either age (Supplementary Figure 1). Surprisingly, a significant increase in vascular mean diameter, inner surface area, and volume was initially detected in 4-week-old db/db mice (Figure 3(b) to (d)). This effect was sustained into adulthood. There was a trend towards the vascular mean length being slightly upregulated in juvenile diabetic mice (p = 0.0727), while a significant increase was detected in the adult brain (Figure 3(b) bottom). The elevated cerebrovascular diameter and length led to a tremendous decrease in mean perfusion resistance (PR) of all vessels in the diabetic brain (Figure 1(e)). However, no significant difference was observed in the mean coverage volume of perfused vessels among the four groups (Figure 1(f)).
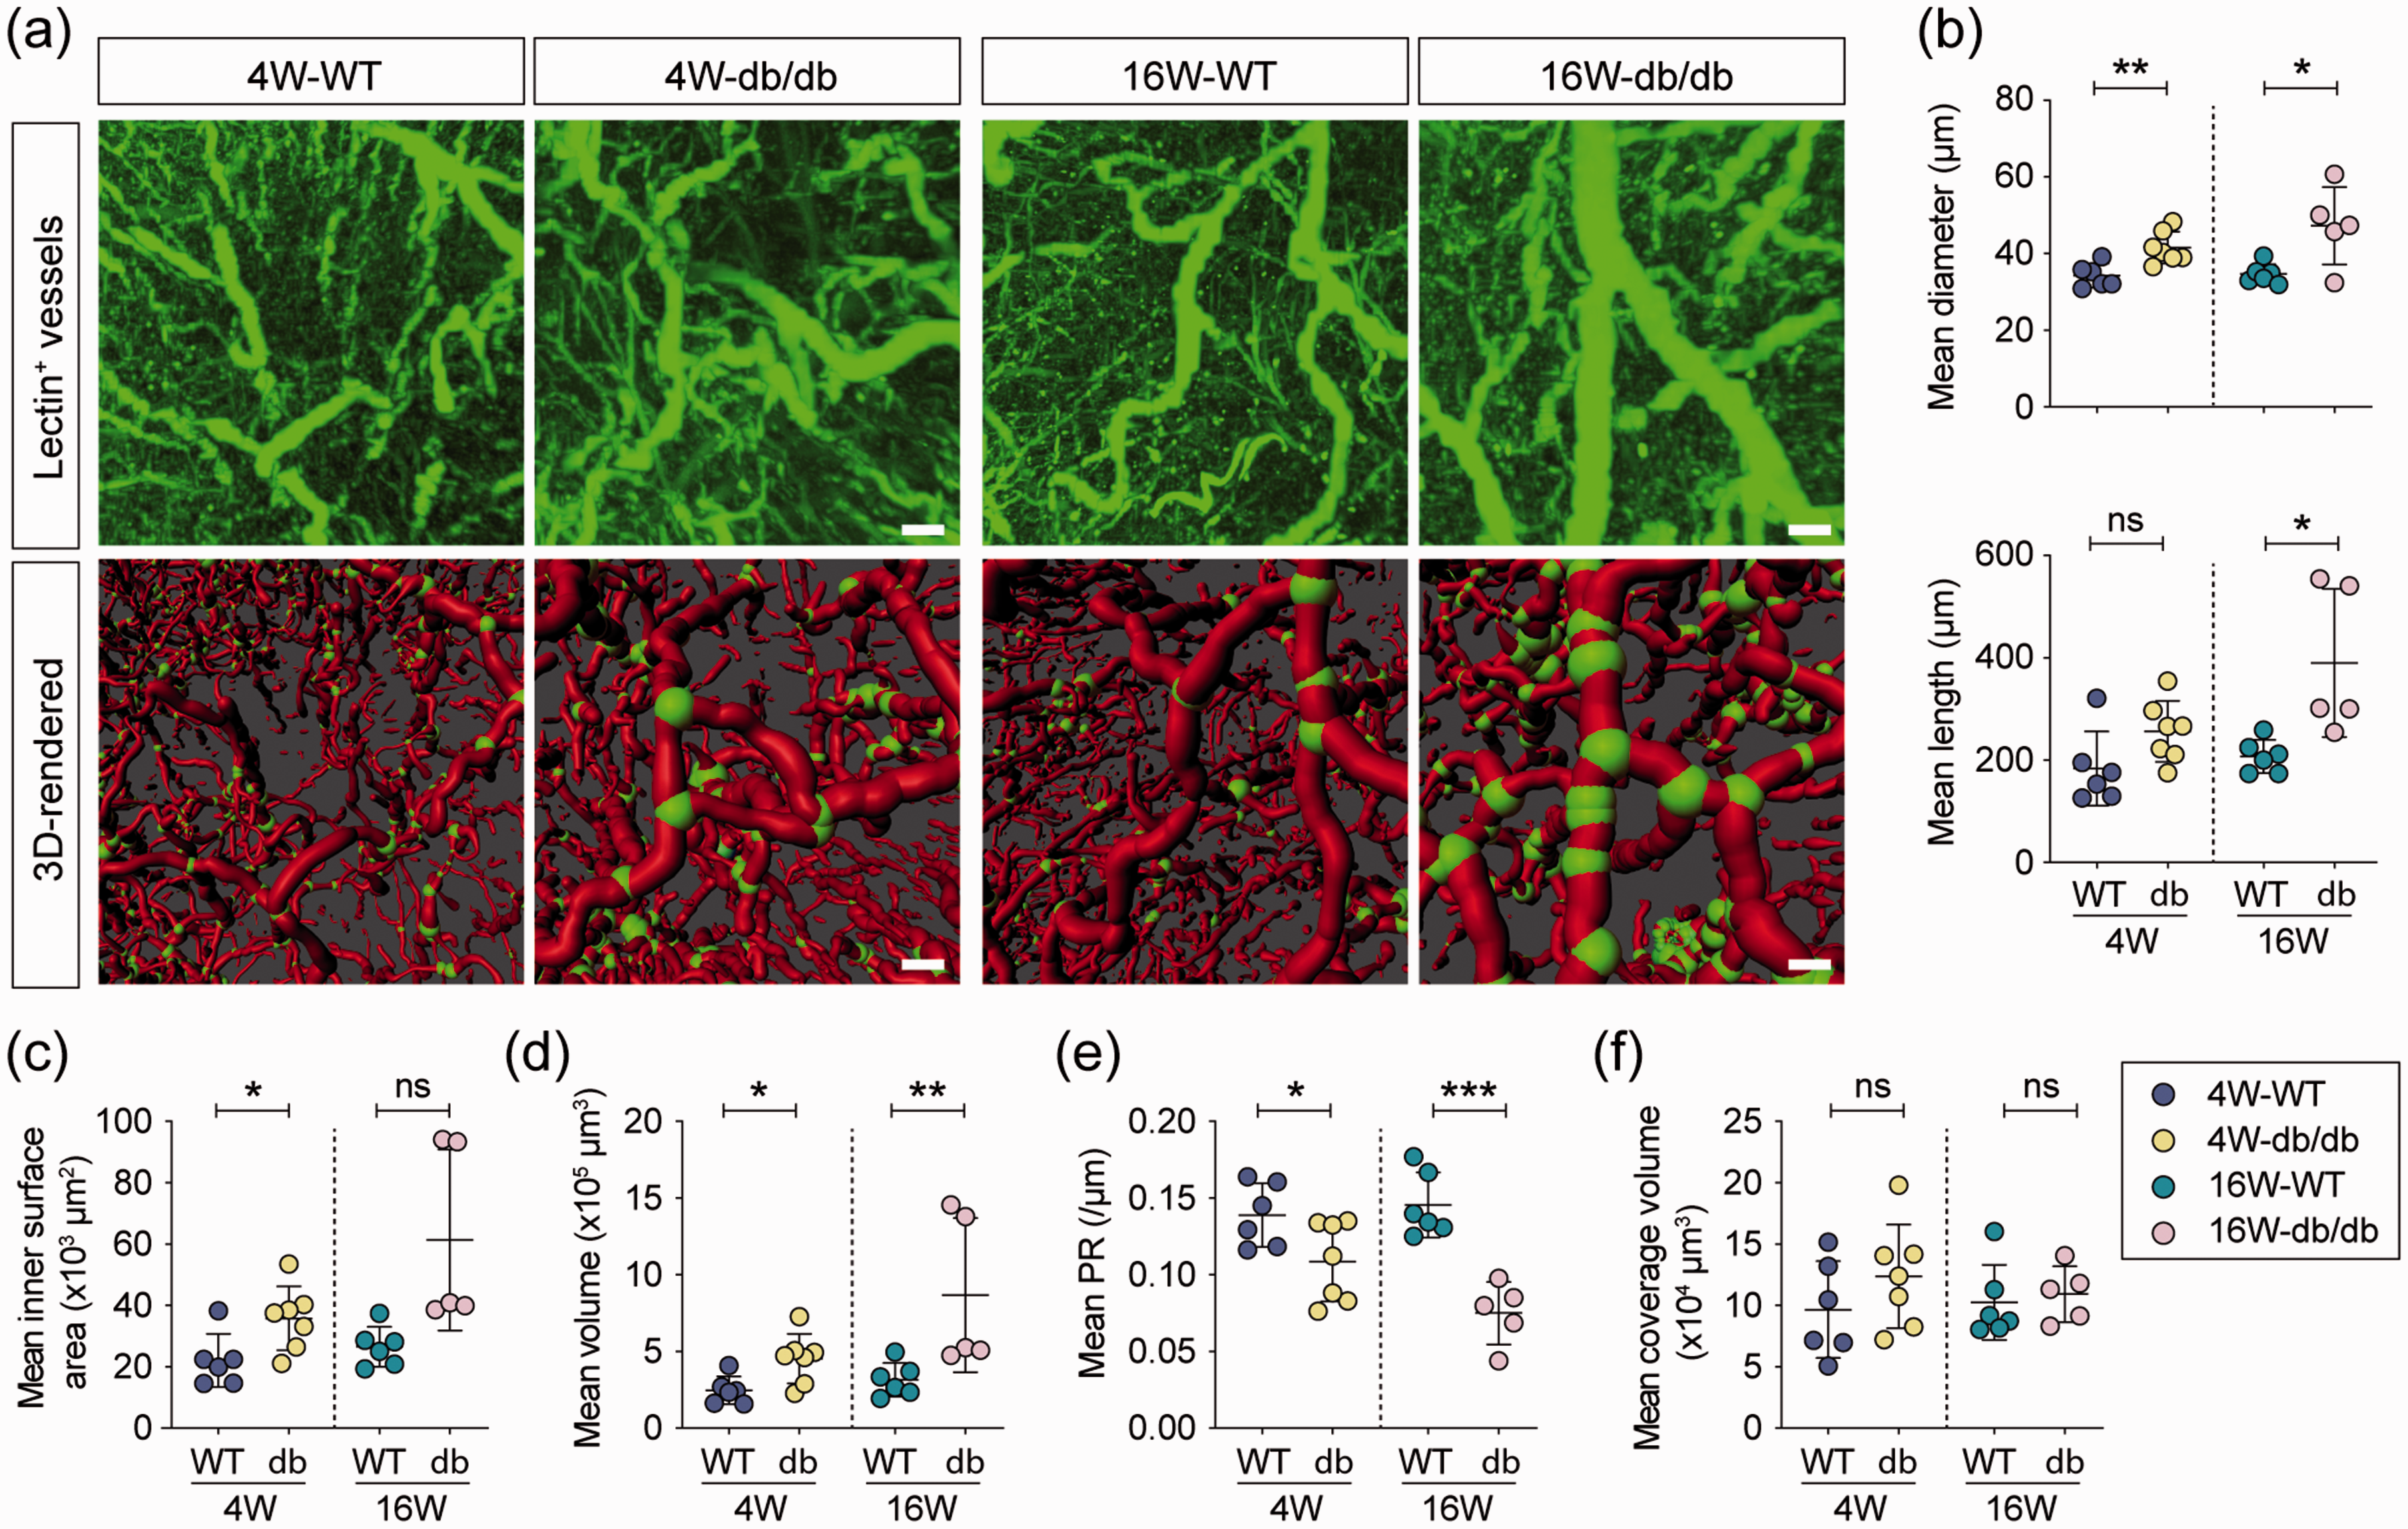
Characteristics of functional cerebrovascular architecture in db/db mice. (a) Representative high-power images of tomato-lectin labeled vessels in the whole brain of 4-week-old and 16-week-old WT and db/db mice (top panel). 3D-reconstructed structure of brain perfused blood vessels labeled by tomato-lectin (bottom panel), red: vessels, scale: 0.6, green: branch points, scale bar = 400 μm. Quantification of mean diameter (top) and length (bottom) (b), mean inner surface area (c) and volume (d), mean perfusion resistance (e, it is proportional to the vascular length and inversely proportional to its cross-sectional area taking into account diameter variations), and mean coverage volume (f, defined as the volume of the minimal rectangular box which fully encloses the vessel) of all functional vessels in the whole brain. n = 5–7 per group, ns = no significant difference, *p < 0.05, **p < 0.01, ***p < 0.001 vs. WT using two-tailed Student’s t test for equal variances, and Welch’s t test for unequal variances.
Imbalanced proportional distribution of macrovessels and microvessels in db/db brain
To determine the differential effect of hyperglycemia on vascular reconstruction, the vessels were further categorized into nine groups based on their diameter (diameter ≤20 μm, ≥90 μm, and 10 μm interval between 20∼90 μm). Images show the 3 D-reconstructed vessels in line-mode scaled by the diameter of vessels in diabetic and WT mice (Figure 4(a)). We examined whether sustained hyperglycemia leads to a proportional change in perfused vessels with different diameters. A significant decrease was only detected in the percentage of vessels with a diameter ≤20 μm in 4-week-old diabetic mice (Figure 4(b) top). In the older mice, the proportion of vessels with a diameter less than 30 μm was significantly decreased in 16-week-old diabetic mice, while the percentage of vessels with a diameter larger than 50 μm was significantly elevated (Figure 4(b) bottom). Thus, hyperglycemia leads to an imbalance in the proportional distribution of functional cerebral vessels with different diameters during maturation.
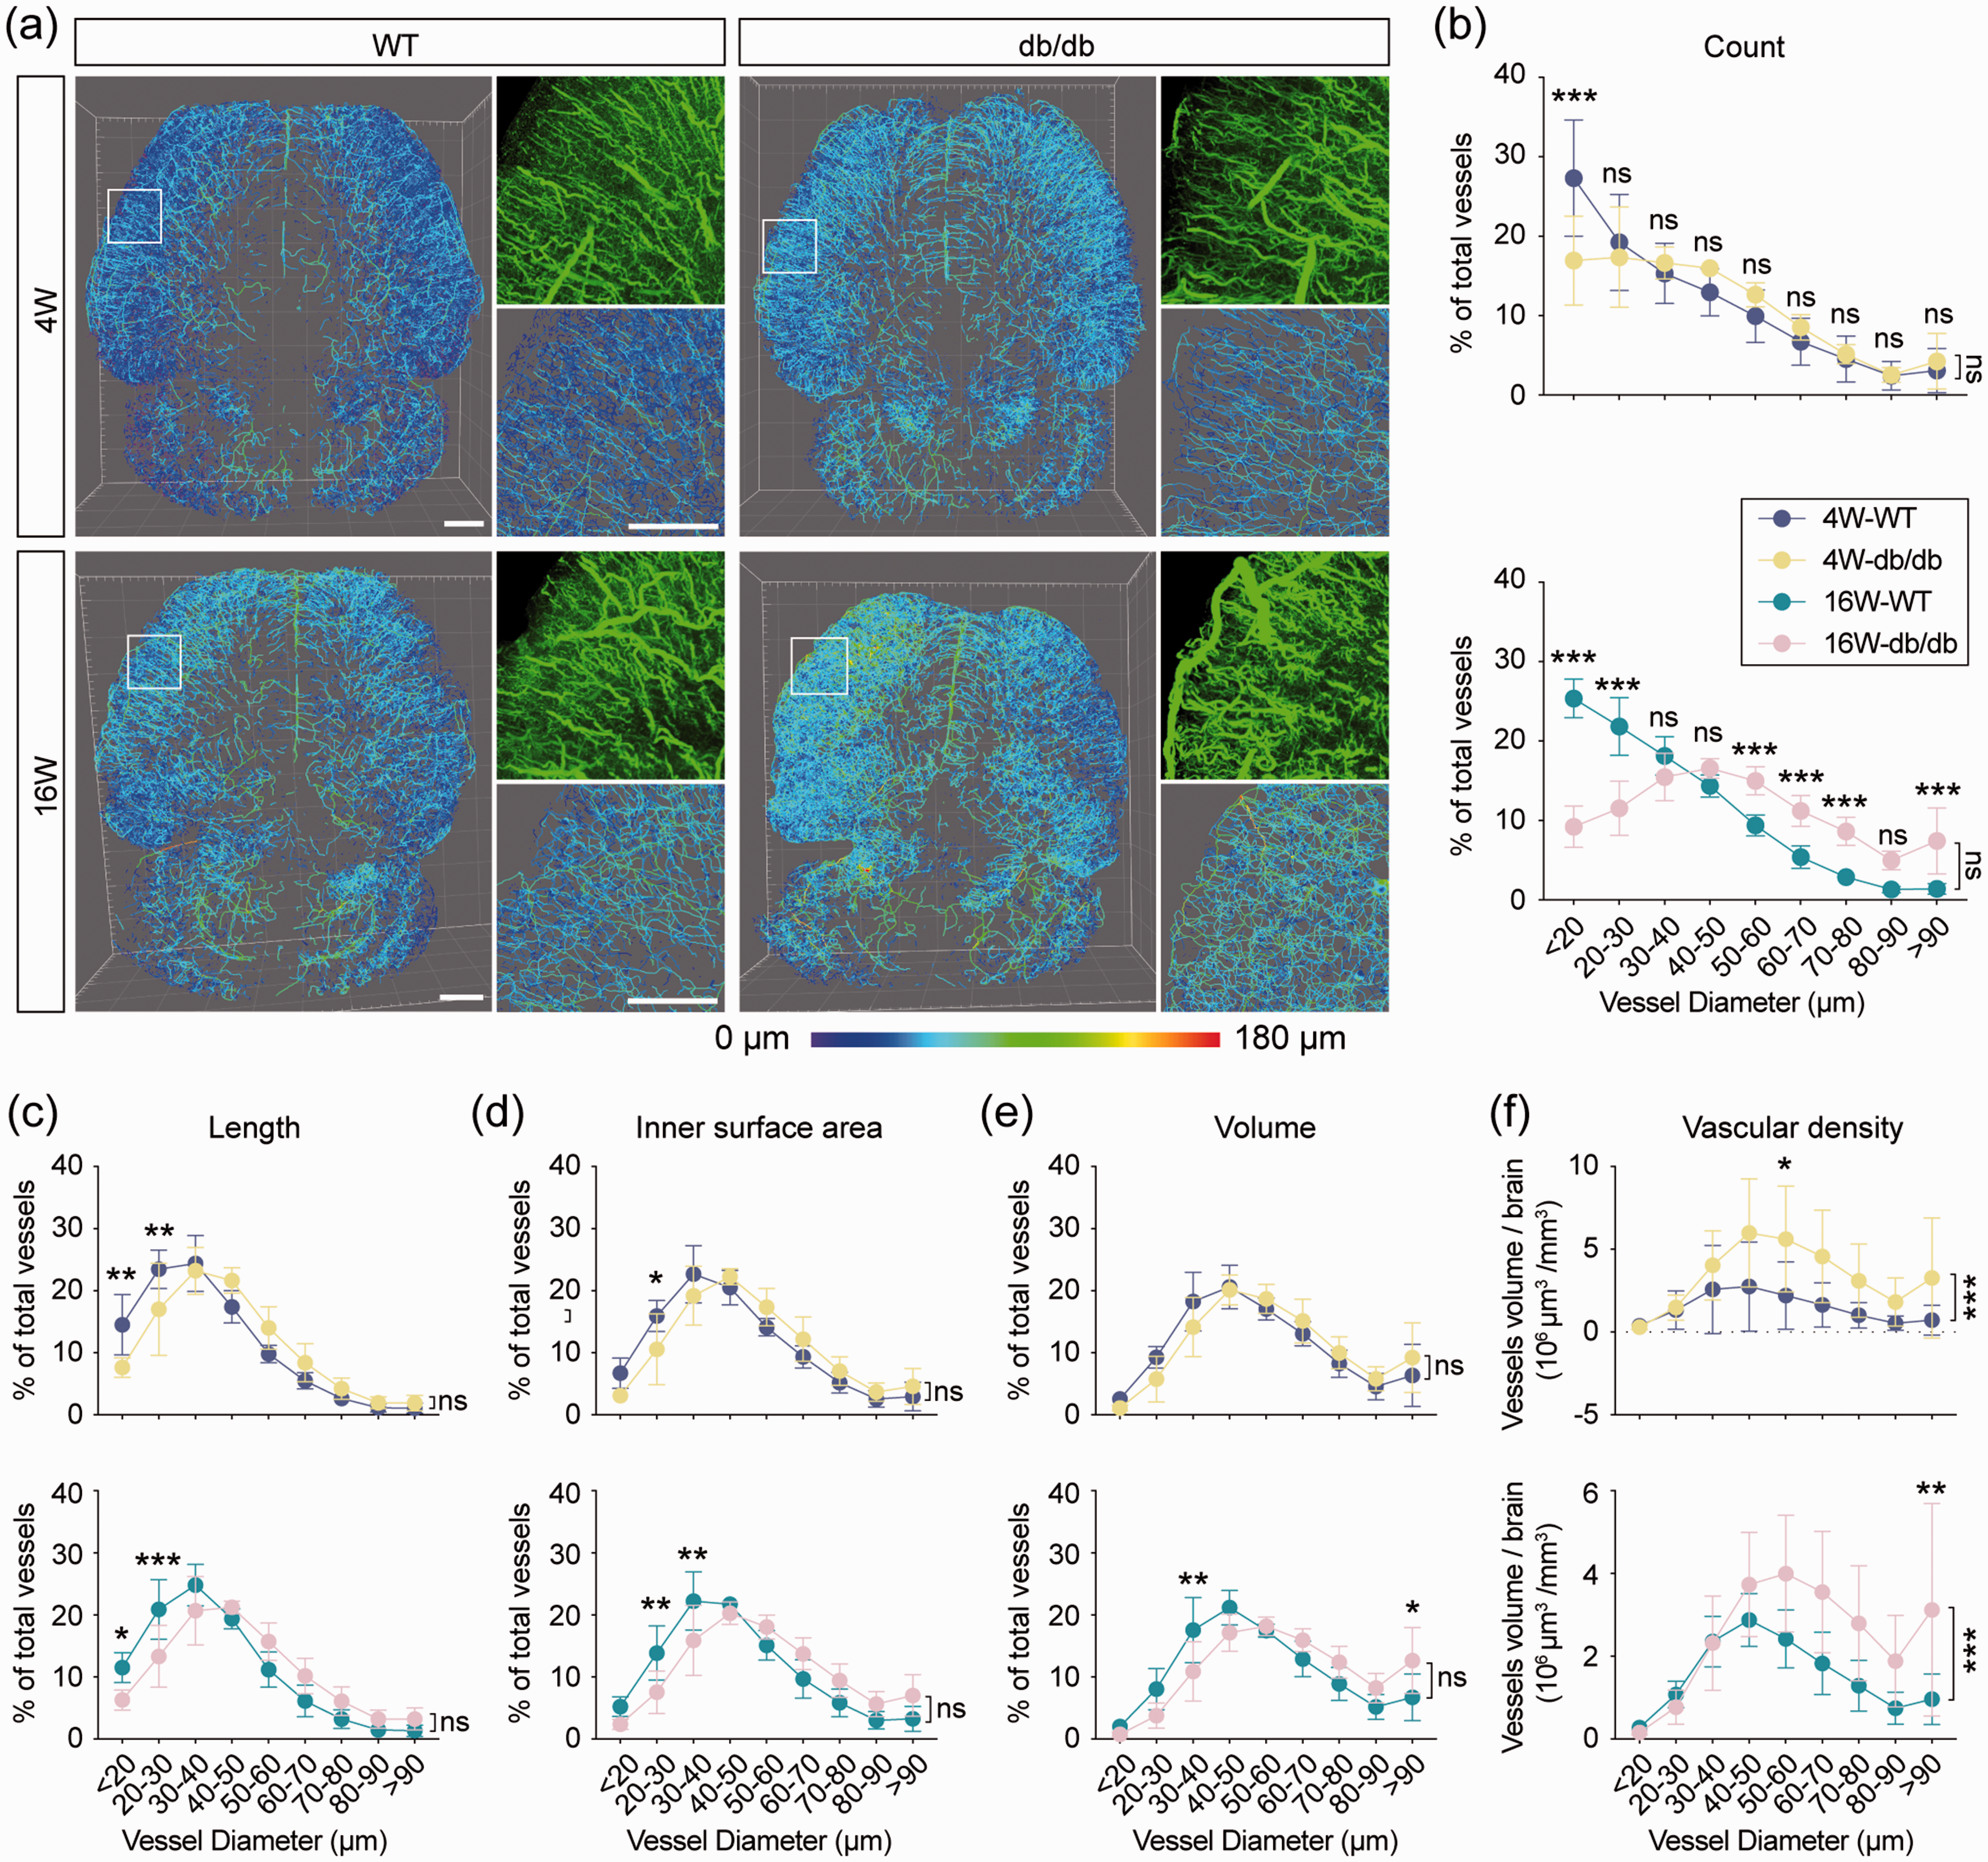
An imbalance between the macrovascular and microvascular perfusion in the db/db brain. (a) Whole-brain perfusion vessels of WT and db/db mice in line mode and colored by vascular diameter. White squares indicate the regions that were enlarged and 3D-rendered in the second column, scale bar = 1000 μm. (b) The percentage of vessels with different diameters in total analyzed vessels of 4-week-old and 16-week-old mice. Quantification of the percentage of vascular length (c), inner surface area (d), and volume (e) with different diameters in total analyzed vessels of 4-week-old and 16-week-old mice, respectively. (f) Quantification of functional vascular volume (μm3) per mm3 brain volume. n = 5–7 per group, ns = no significant difference. *p < 0.05, **p < 0.01, ***p < 0.001 vs. WT using two-way ANOVA followed by Bonferroni post hoc test.
We further compared the percentage of length, inner surface area, and volume of vessels with different diameters between db/db and WT mice. In juvenile mice, hyperglycemia specifically resulted in a decreased percentage of the length and inner surface area whose diameter is less than 30 μm. No significant difference was observed in the ratio of vascular length, inner surface area, and volume with a diameter larger than 30 μm in the brain of juvenile mice (Figure 4(c) to (e) top). The relative cerebral perfusion volume was significantly higher in the juvenile diabetic brain, indicating that functional remodeling of the cerebrovascular architecture occurred as early as four weeks after birth (Figure 4(f) top). With increased age, the decreased percentage of length and inner surface area was extended to vessels less than 40 μm in diameter; however, no significant increase was observed in vessels larger than 50 μm (Figure 4(c) and (d), bottom). We did not find any significant difference in the total vascular perfusion volume between db/db and WT mice (Supplementary Figure 1(d)). Nevertheless, the perfusion of macrovessels (more than 90 μm) was significantly increased in diabetic mice as shown by the higher vascular volume percentage (diameter ≥90 μm) and larger perfusion volume of the whole brain, indicating the pathological redistribution of cerebral blood flow between microvessels and macrovessels in the mature diabetic brain (Figure 4(e) and (f), bottom).
Chronic hypoperfusion of cerebral microvessels in db/db mice
Poor circulation owing to microvascular dysfunction was observed in diabetic sufferers. 25 To investigate the impact of hyperglycemia on cerebral microvessels, we filtered all vessels with a diameter ≤20 μm in Imaris. We explored the morphological and functional deficits of these microvessels in db/db mice. The diameter of microvessels increased with age, and hyperglycemia further enlarged the vascular diameter in juvenile db/db mice. However, no significant difference was detected between adult WT and db/db mice (Figure 5(a)). Regarding branching of microvessels, branch level and vessel depth were reduced as age increased in WT mice. Although no significant difference was detected between juvenile WT and db/db mice, chronic hyperglycemia increased the microvascular branch level, resulting in a larger vessel depth in adult diabetic mice (Figure 5(b)). Age did not affect branch angle in WT mice, whereas with hyperglycemia there was an age-related reduction in the branch angle in diabetic mice. Although no significant difference existed between juvenile WT and db/db mice, the branch angle was significantly decreased in adult db/db mice compared to their WT counterpart (Figure 5(c)). Microvessels were elongated with age in WT mice but shortened with age in db/db mice (Figure 5(d)). Due to the longer diameter and shorter length, vessel PR was significantly decreased in the diabetic brains (Figure 5(e)). The vascular inner surface area and volume were consistently higher in the younger mice than in their older counterparts. Overall, these values were smaller in the db/db mice compared to similarly aged WT mice (Figure 5(f)). Furthermore, linear regression analysis of the perfusion volume with either functional vessel length or the inner surface area of cerebral microvessels showed that regardless of age and genotype, vessel length was positively correlated with volume and inner surface area. In juvenile mice, a significant difference was detected in the slope between the two genotypes, which was exacerbated in adult db/db mice, indicating that the volume and inner surface area were prone to be smaller for vessels with the same length in diabetic mice (Figure 5(g) and (h)). Thus, perfusion of microvessels was restricted as early as four weeks after birth, which could potentially lead to long-lasting deficits in parenchymal blood-oxygen supply in the db/db brain.
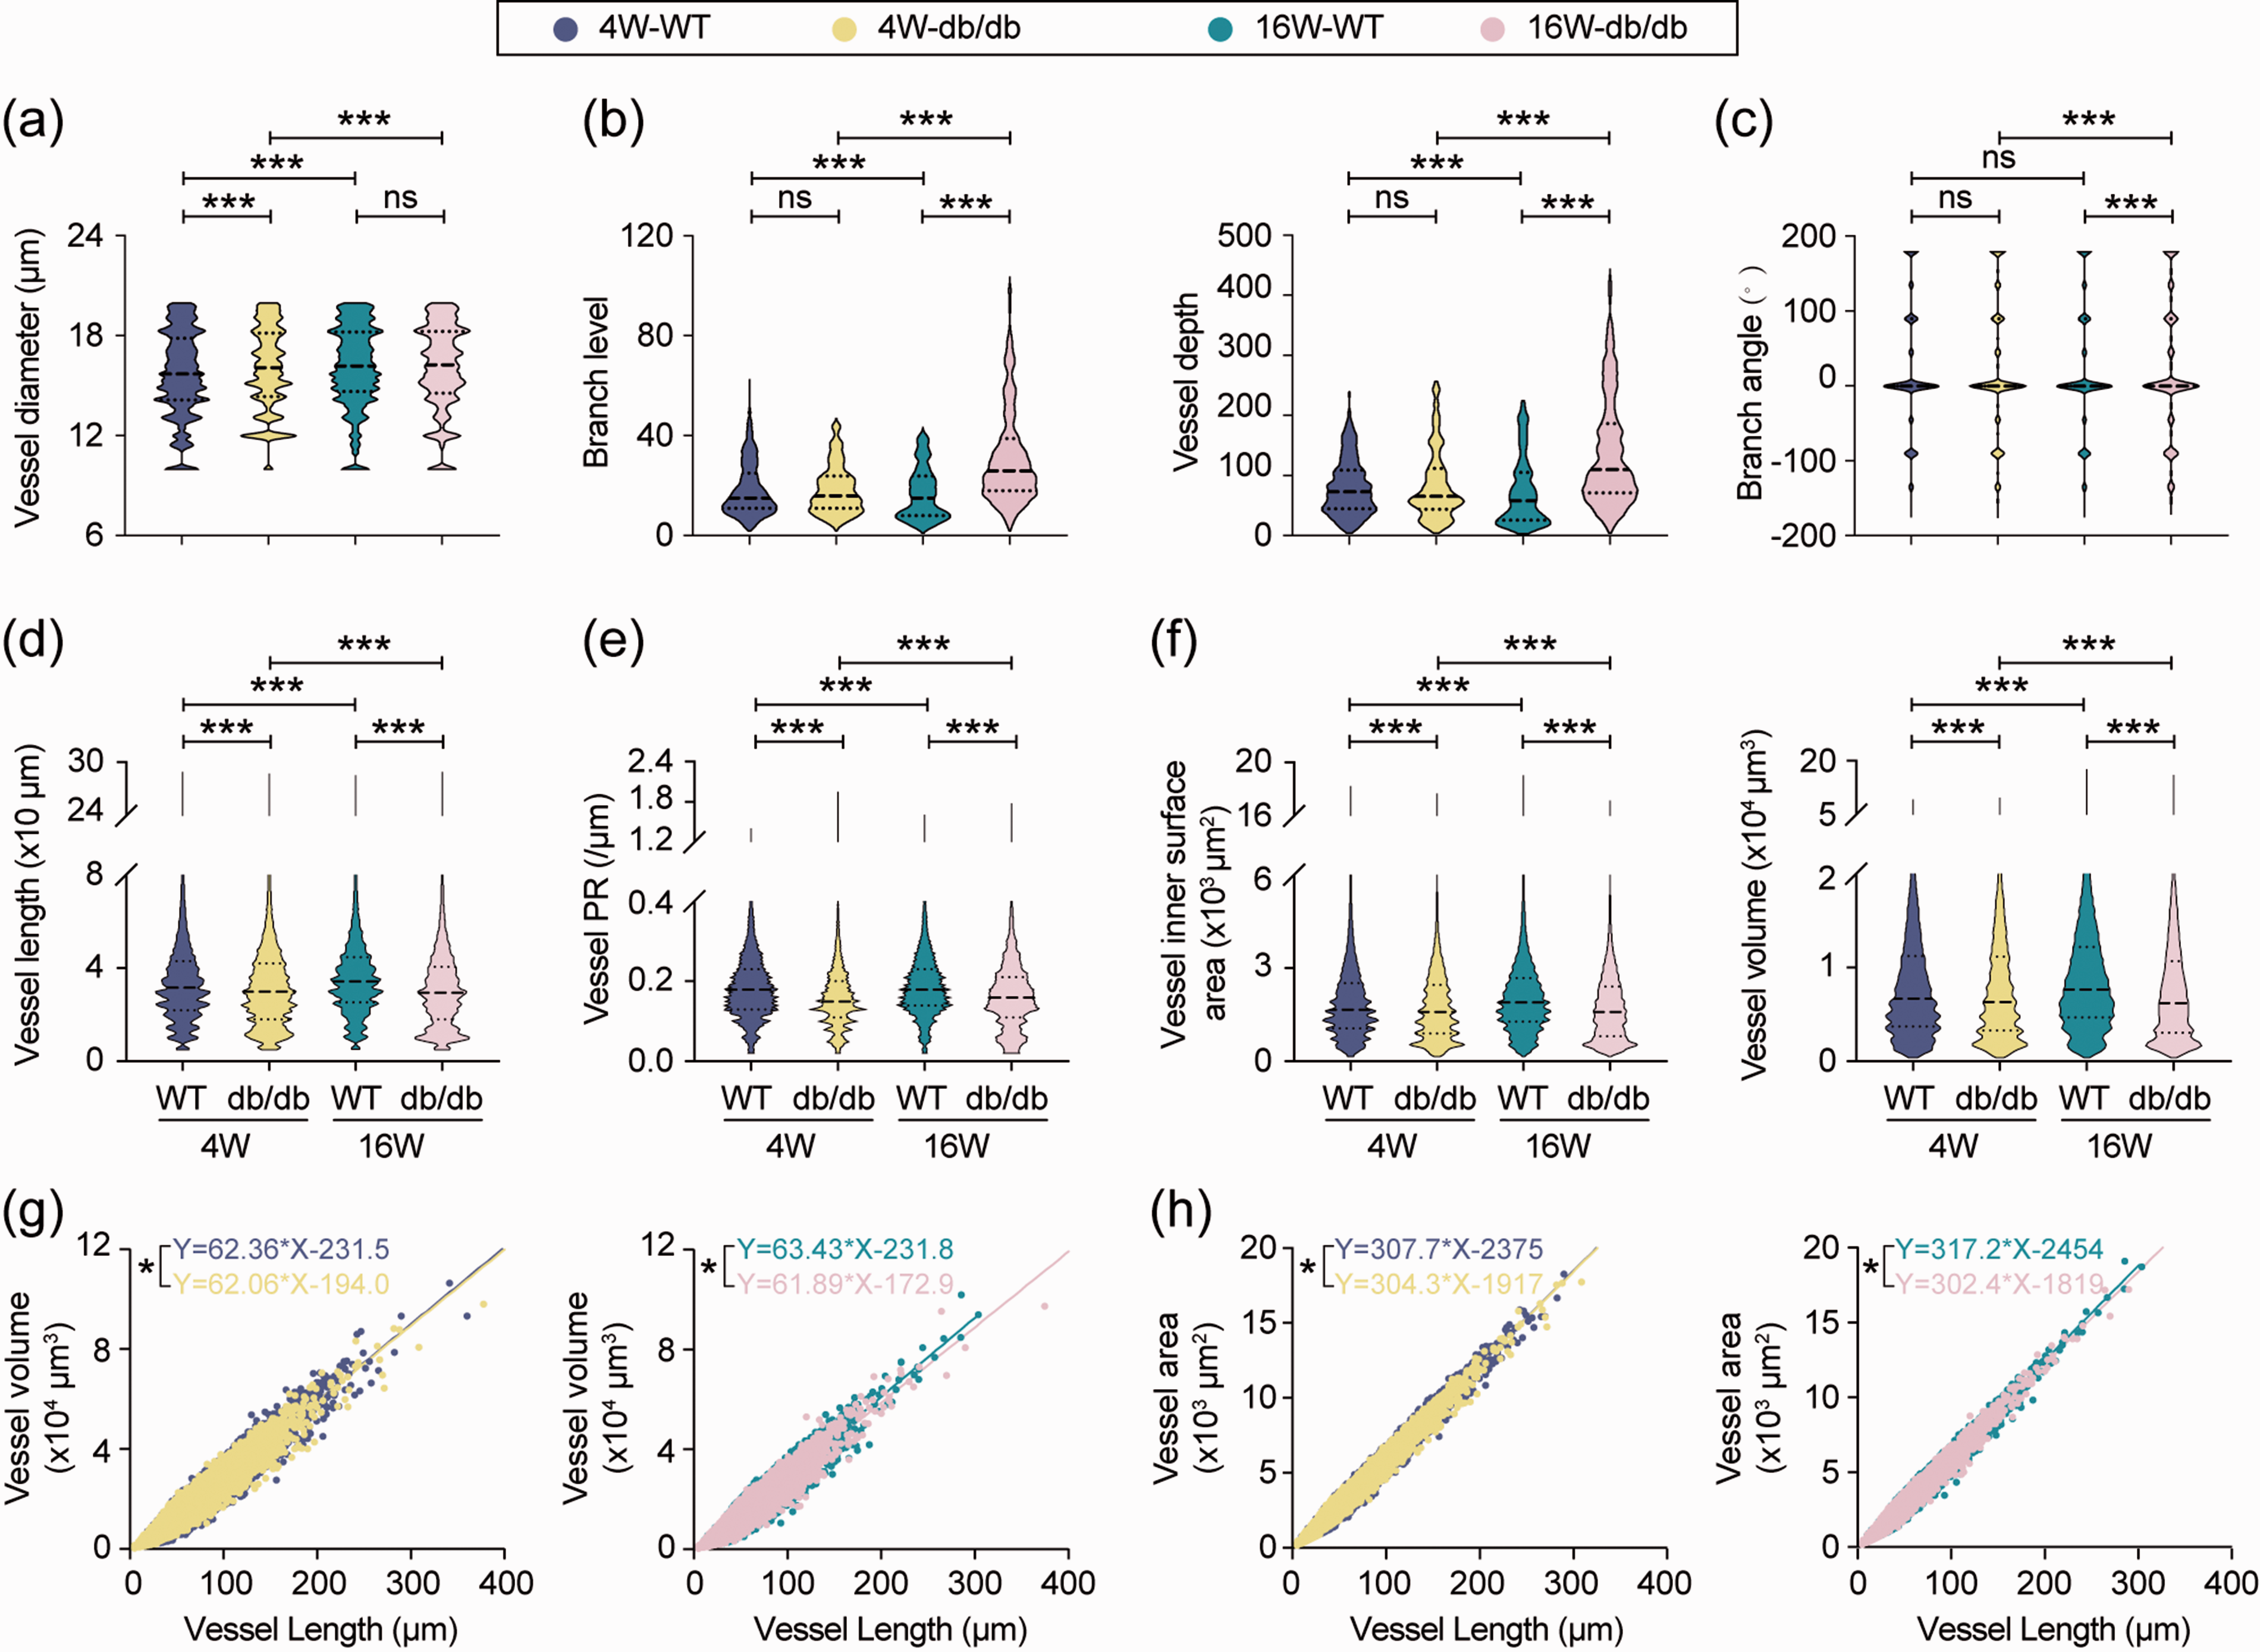
Type 2 Diabetes Mellitus induced cerebral microvasculature hypoperfusion. Rendered microvessels (vessels with diameter less than 20 μm) from WT and db/db mice were filtered and analyzed in Imaris software. (a) Quantification of microvascular diameter, n = 122355 vessel segments for 4-week WT, n = 91857 vessel segments for 4-week db/db, n = 85835 vascular segments for 16-week WT, n = 53065 vascular segments for 16-week db/db, *p < 0.05, ***p < 0.001 vs. indicated group using Kruskal-Wallis test followed by Dunn post hoc test. (b) Quantification of branch level and depth, n = 3654 vascular segments for 4-week WT, n = 1857 vascular segments for 4-week db/db, n = 1962 vascular segments for 16-week WT, n = 10147 vascular segments for 16-week db/db. ns = no significant difference, ***p < 0.001 vs. indicated group using Kruskal-Wallis test followed by Dunn post hoc test. Quantification of branch angle (c), length (d), perfusion resistance (e), inner surface area, and volume (f) of microvessels in WT and db/db mice. n = 122355 vascular segments for 4-week WT, n = 91857 vascular segments for 4-week db/db, n = 85835 vascular segments for 16-week WT, n = 53065 vascular segments for 16-week db/db. ns = no significant difference, ***p < 0.001 vs. indicated group using Kruskal-Wallis test followed by Dunn post hoc test. Linear regression between length and volume (g), and length and inner surface area (h) of all functional microvessels filtered from brain samples. n =122234 vessel segments for 4-week WT, n = 91808 vessel segments for 4-week db/db, n = 73615 vessel segments for 16-week WT, n = 50094 vessel segments for 16-week db/db. Inner surface area: Y = 62.36*X-231.5 (4-week WT), Y = 62.06*X-194.0 (4-week db/db), Y = 63.43*X-231.8 (16-week WT), Y = 61.89*X-172.9 (16-week db/db). Volume: Y = 307.7*X-2375 (4-week WT), Y = 304.3*X-1917(4-week db/db), Y = 317.2*X-2454 (16-week WT), Y = 302.4*X-1819 (16-week db/db). *p < 0.001 vs. WT by analysis of covariance between two regression lines.
Gliovascular coupling deficit in adult db/db mice
The gliovascular unit, composed of endothelial cells, pericytes, and astrocytes, is responsible for controlling cerebral blood flow and BBB properties. Triple immunofluorescent staining of vessels (marked by lectin), pericytes (marked by PDGFRβ), and astrocytes (labeled by GFAP) was conducted in 16-week-old db/db mice and WT mice (Figure 6(a)). Immunofluorescent staining for PDGFRβ was markedly decreased in db/db mice; however, the area of GFAP staining was significantly increased in diabetic mice compared to WT mice (Figure 6(b)). Next, we explored the interaction among endothelial cells, pericytes, and astrocytes in the BBB. Noticeably, the percentage of pericyte coverage on vessels was decreased, and the percentage of astrocyte coverage on vessels was increased in diabetic mice compared to WT mice (Figure 6(c)). The distance between two pericytes (distance between the centers of two cell bodies) was considerably larger in diabetic mice, whereas there was no significant difference in the gap between two adjacent pericytes (the shortest distance between two pericytes including processes) (Figure 6(d)). The number and area of the gliovascular unit were markedly reduced in the db/db mice compared to WT mice (Figure 6(e)). Activated microglia were consistently observed in diabetic mice (Figure 6(f)). Although there was no difference in the number of Iba1+ cells between the db/db and WT animals, microglia in diabetic mice showed an amoebic phenotype characterized by a larger cell volume (Figure 6(f) and (i)). A shorter distance was also measured from microglia cell bodies to the nearest microvessels in diabetic mice compared to WT mice of the same age (Figure 6(h)), suggesting vascular inflammation induced by hyperglycemia in the CNS of db/db mice.
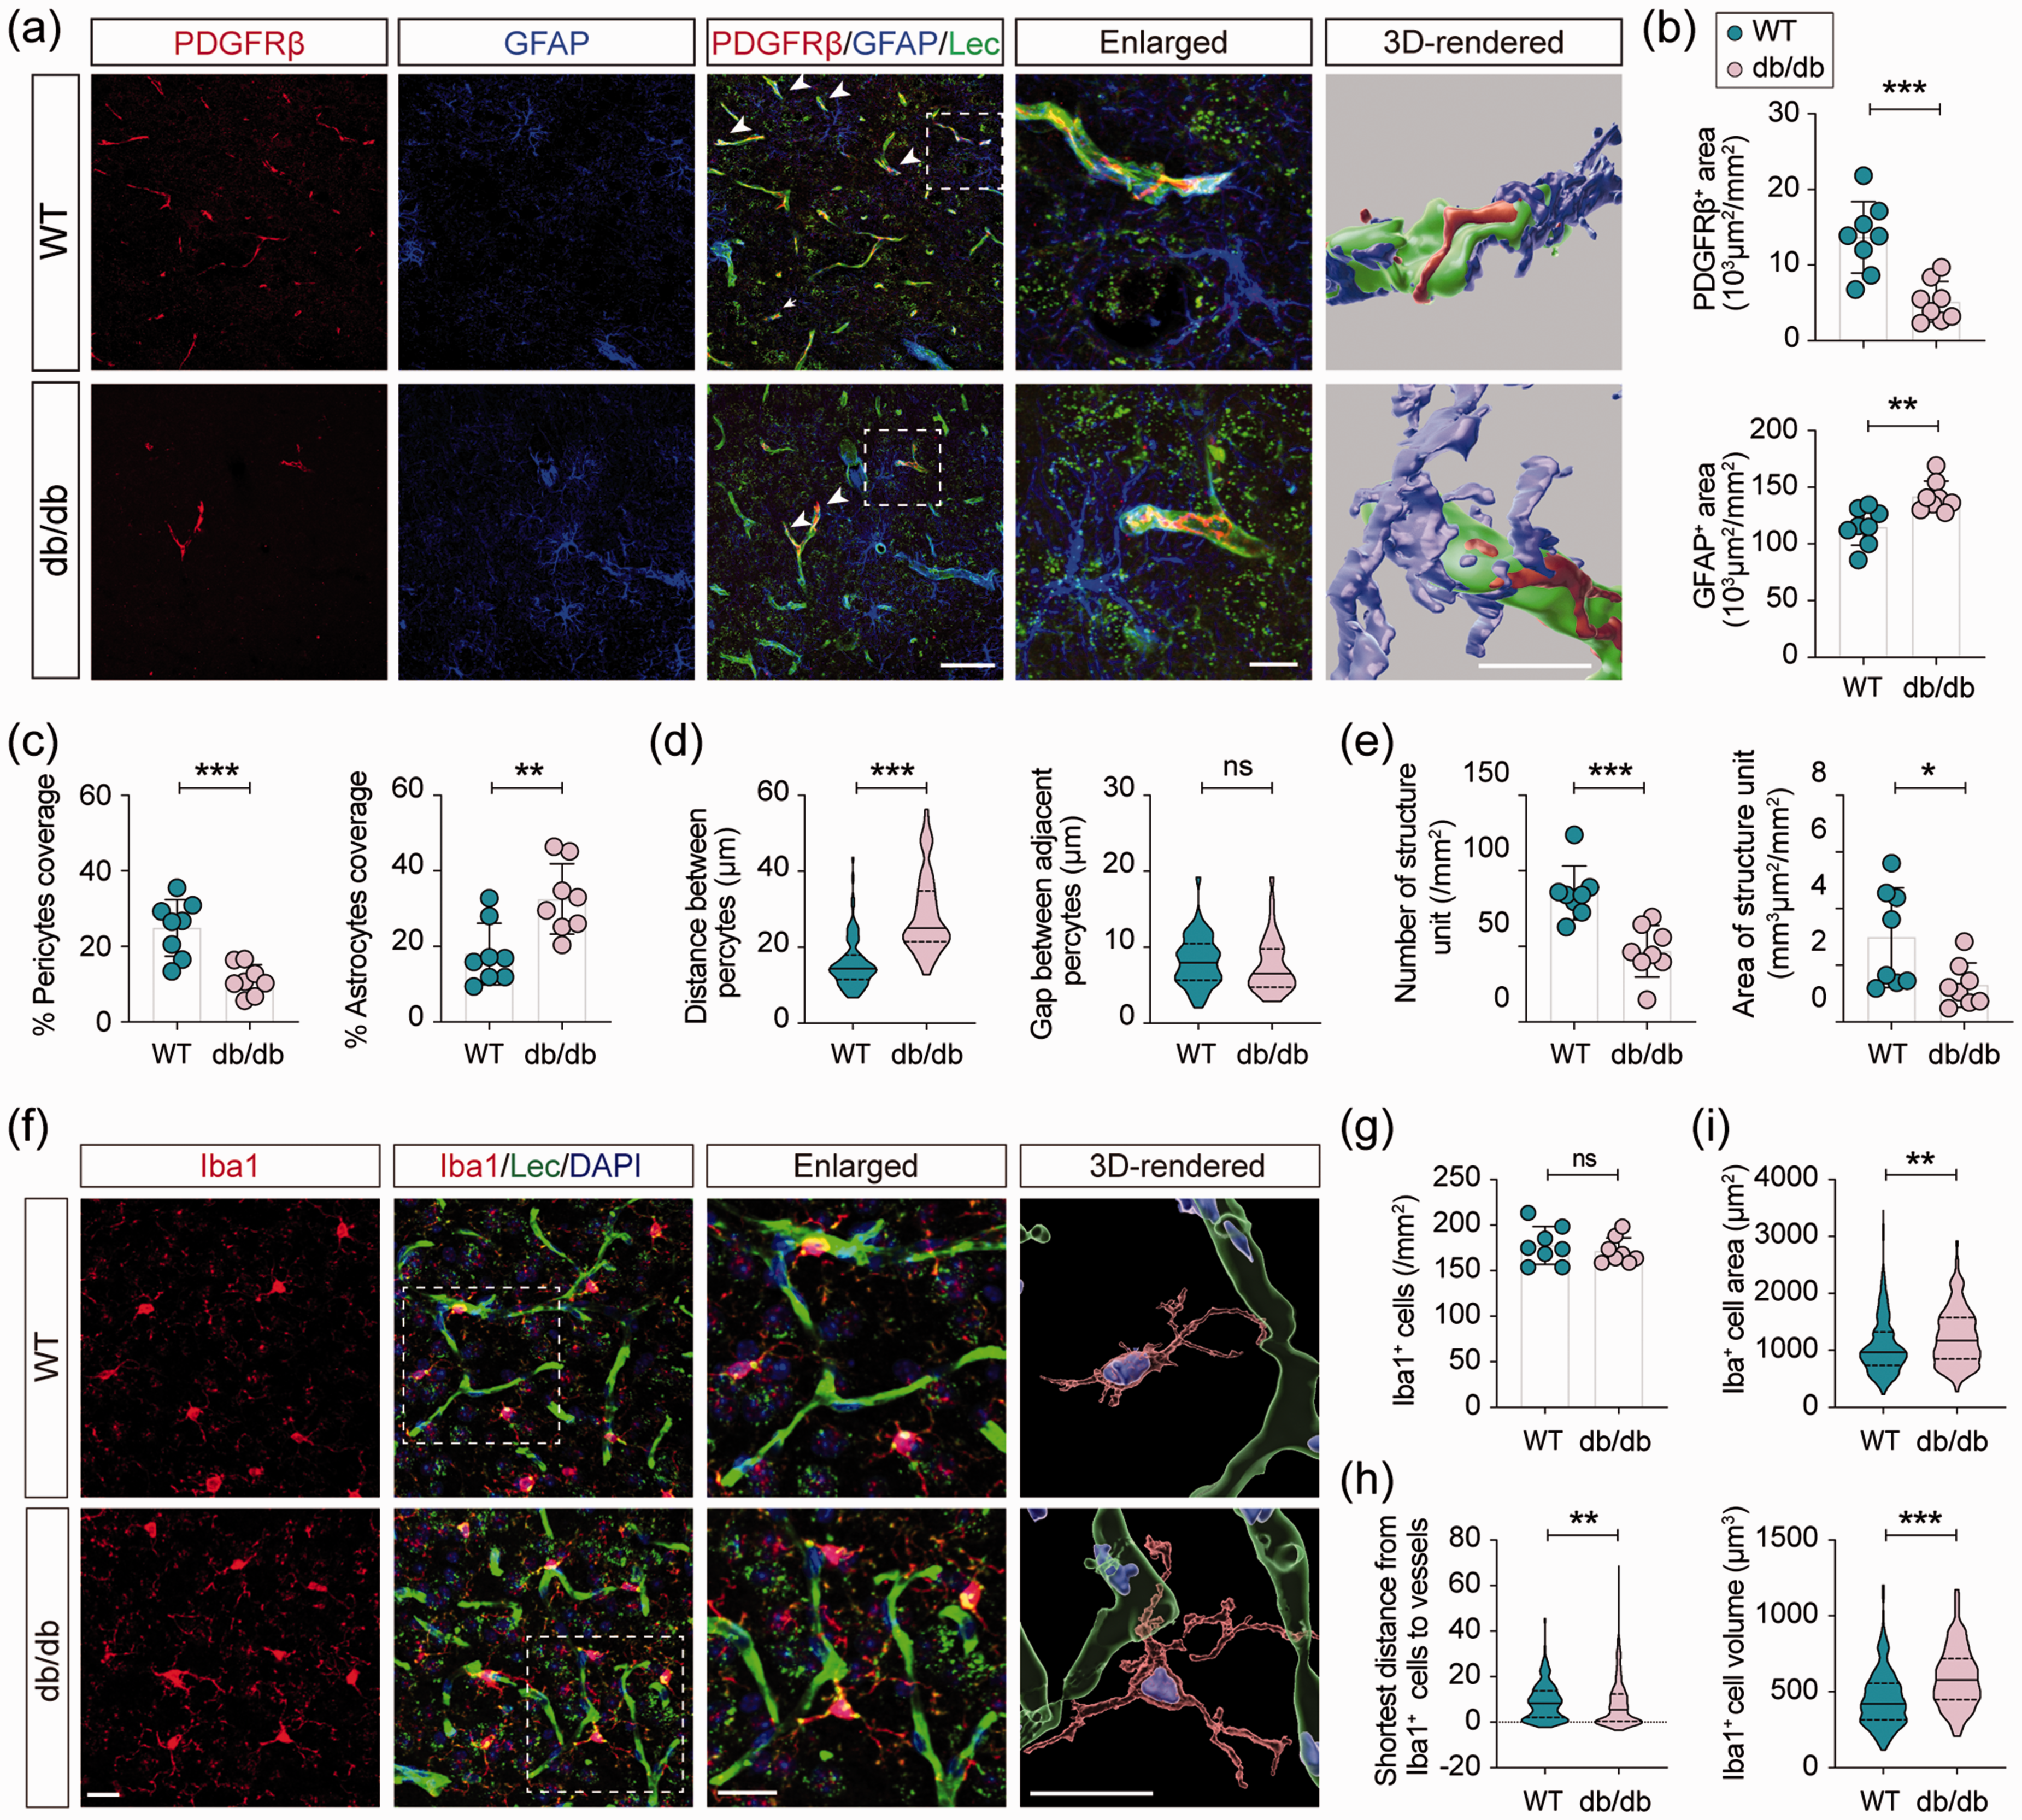
Genetic knockout of leptin-receptor induces the reconstruction of the gliovascular unit. (a) Representative images of triple-labeled immunostaining of Lectin, PDGFRβ, and GFAP in the cortex. Scale bar of the first panel = 50 μm. Boxes indicate areas enlarged (middle, scale bar = 10 μm) and 3D-rendered (bottom, scale bar = 10 μm). (b) Quantification of PDGFRβ+ and GFAP+ signal area in WT and db/db mice. (c) Quantification of pericytes (marked by PDGFRβ) coverage percentage (top) and astrocytes (marked by GFAP) coverage percentage (bottom) on vessels (marked by Lectin), respectively. (d) Quantification of the distance between two pericytes (left) and the gap between adjacent pericytes (right). (e) Quantification of the number and area of the gliovascular unit per mm2 field in the cortex. One gliovascular unit was defined as a combination of endothelial cells (Lectin+), pericyte (PDGFR+), and astrocyte (GFAP+). n = 8 per group, ns = no significant difference, *p < 0.05, **p < 0.01, ***p < 0.001 vs. WT using two-tailed Student’s t test or Welch’s t test for unequal variances. (f) Representative images of double-labeled immunostaining of Iba1 and Lectin. Scale bars = 20 μm. Boxes indicate areas enlarged and 3D-rendered. (g) Quantification of microglia per mm2 in the cortex. n = 8 per group, ns = no significant difference vs. WT using two-tailed Student’s t test. (h) Shortest distance from microglia to vessels in the cortex. n =339 microglia for WT and n=311 microglia for db/db, **p < 0.01 vs. WT using two-tailed Mann-Whitney U test. (i) Quantification of the cell area (top) and cell volume (bottom) of microglia in the cortex. n =301 microglia for WT and 225 microglia for db/db, **p < 0.01, ***p < 0.001 vs. WT using two-tailed Mann-Whitney U test.
Excessive accumulation but not leakage of IgG from microvessels of diabetic brain
Due to functional deficits of the gliovascular unit, BBB breakdown has been widely reported in diabetic mice. 26 However, a recent study did not detect BBB leakage in adult db/db mice. 22 To determine the permeability of the BBB in this study, plasma-derived IgG was labeled in brain slices. The area and fluorescent intensity of IgG+ signals were significantly increased in the cortex and striatum in the diabetic brain, but there was no difference in the hippocampus between the two groups (Figure 7(a) to (c)). To determine whether IgG leaked outside of the vessels, double staining of IgG and lectin was conducted (Figure 7(d)). The morphological characteristics of microvessels were accessed by 3 D reconstruction in Imaris. Vessel length was significantly decreased in the brains of adult diabetic mice. However, no significant difference was detected in the vessel branch, vessel straightness, or the lectin+ areas between diabetic and WT mice (Figure 7(e) and (f)). High-power images were taken to ascertain IgG distribution in the cortical parenchymal (Figure 7(d), Supplementary Videos 2 and 3). To our surprise, the IgG signal was rarely detected outside microvessels, suggesting that BBB integrity was preserved in adult db/db mice (Figure 7(d)). However, compared to the dispersed distribution of IgG in the microvessels of WT mice, IgG accumulated explicitly on the luminal side of the vascular wall in db/db animals (Figure 7(f) and (g), Supplementary Videos 2 and 3). Despite the cortical and striatal increase in IgG+ vessels and changes in its distribution therein in adult diabetic mice, BBB integrity remained intact in the adult db/db brain.
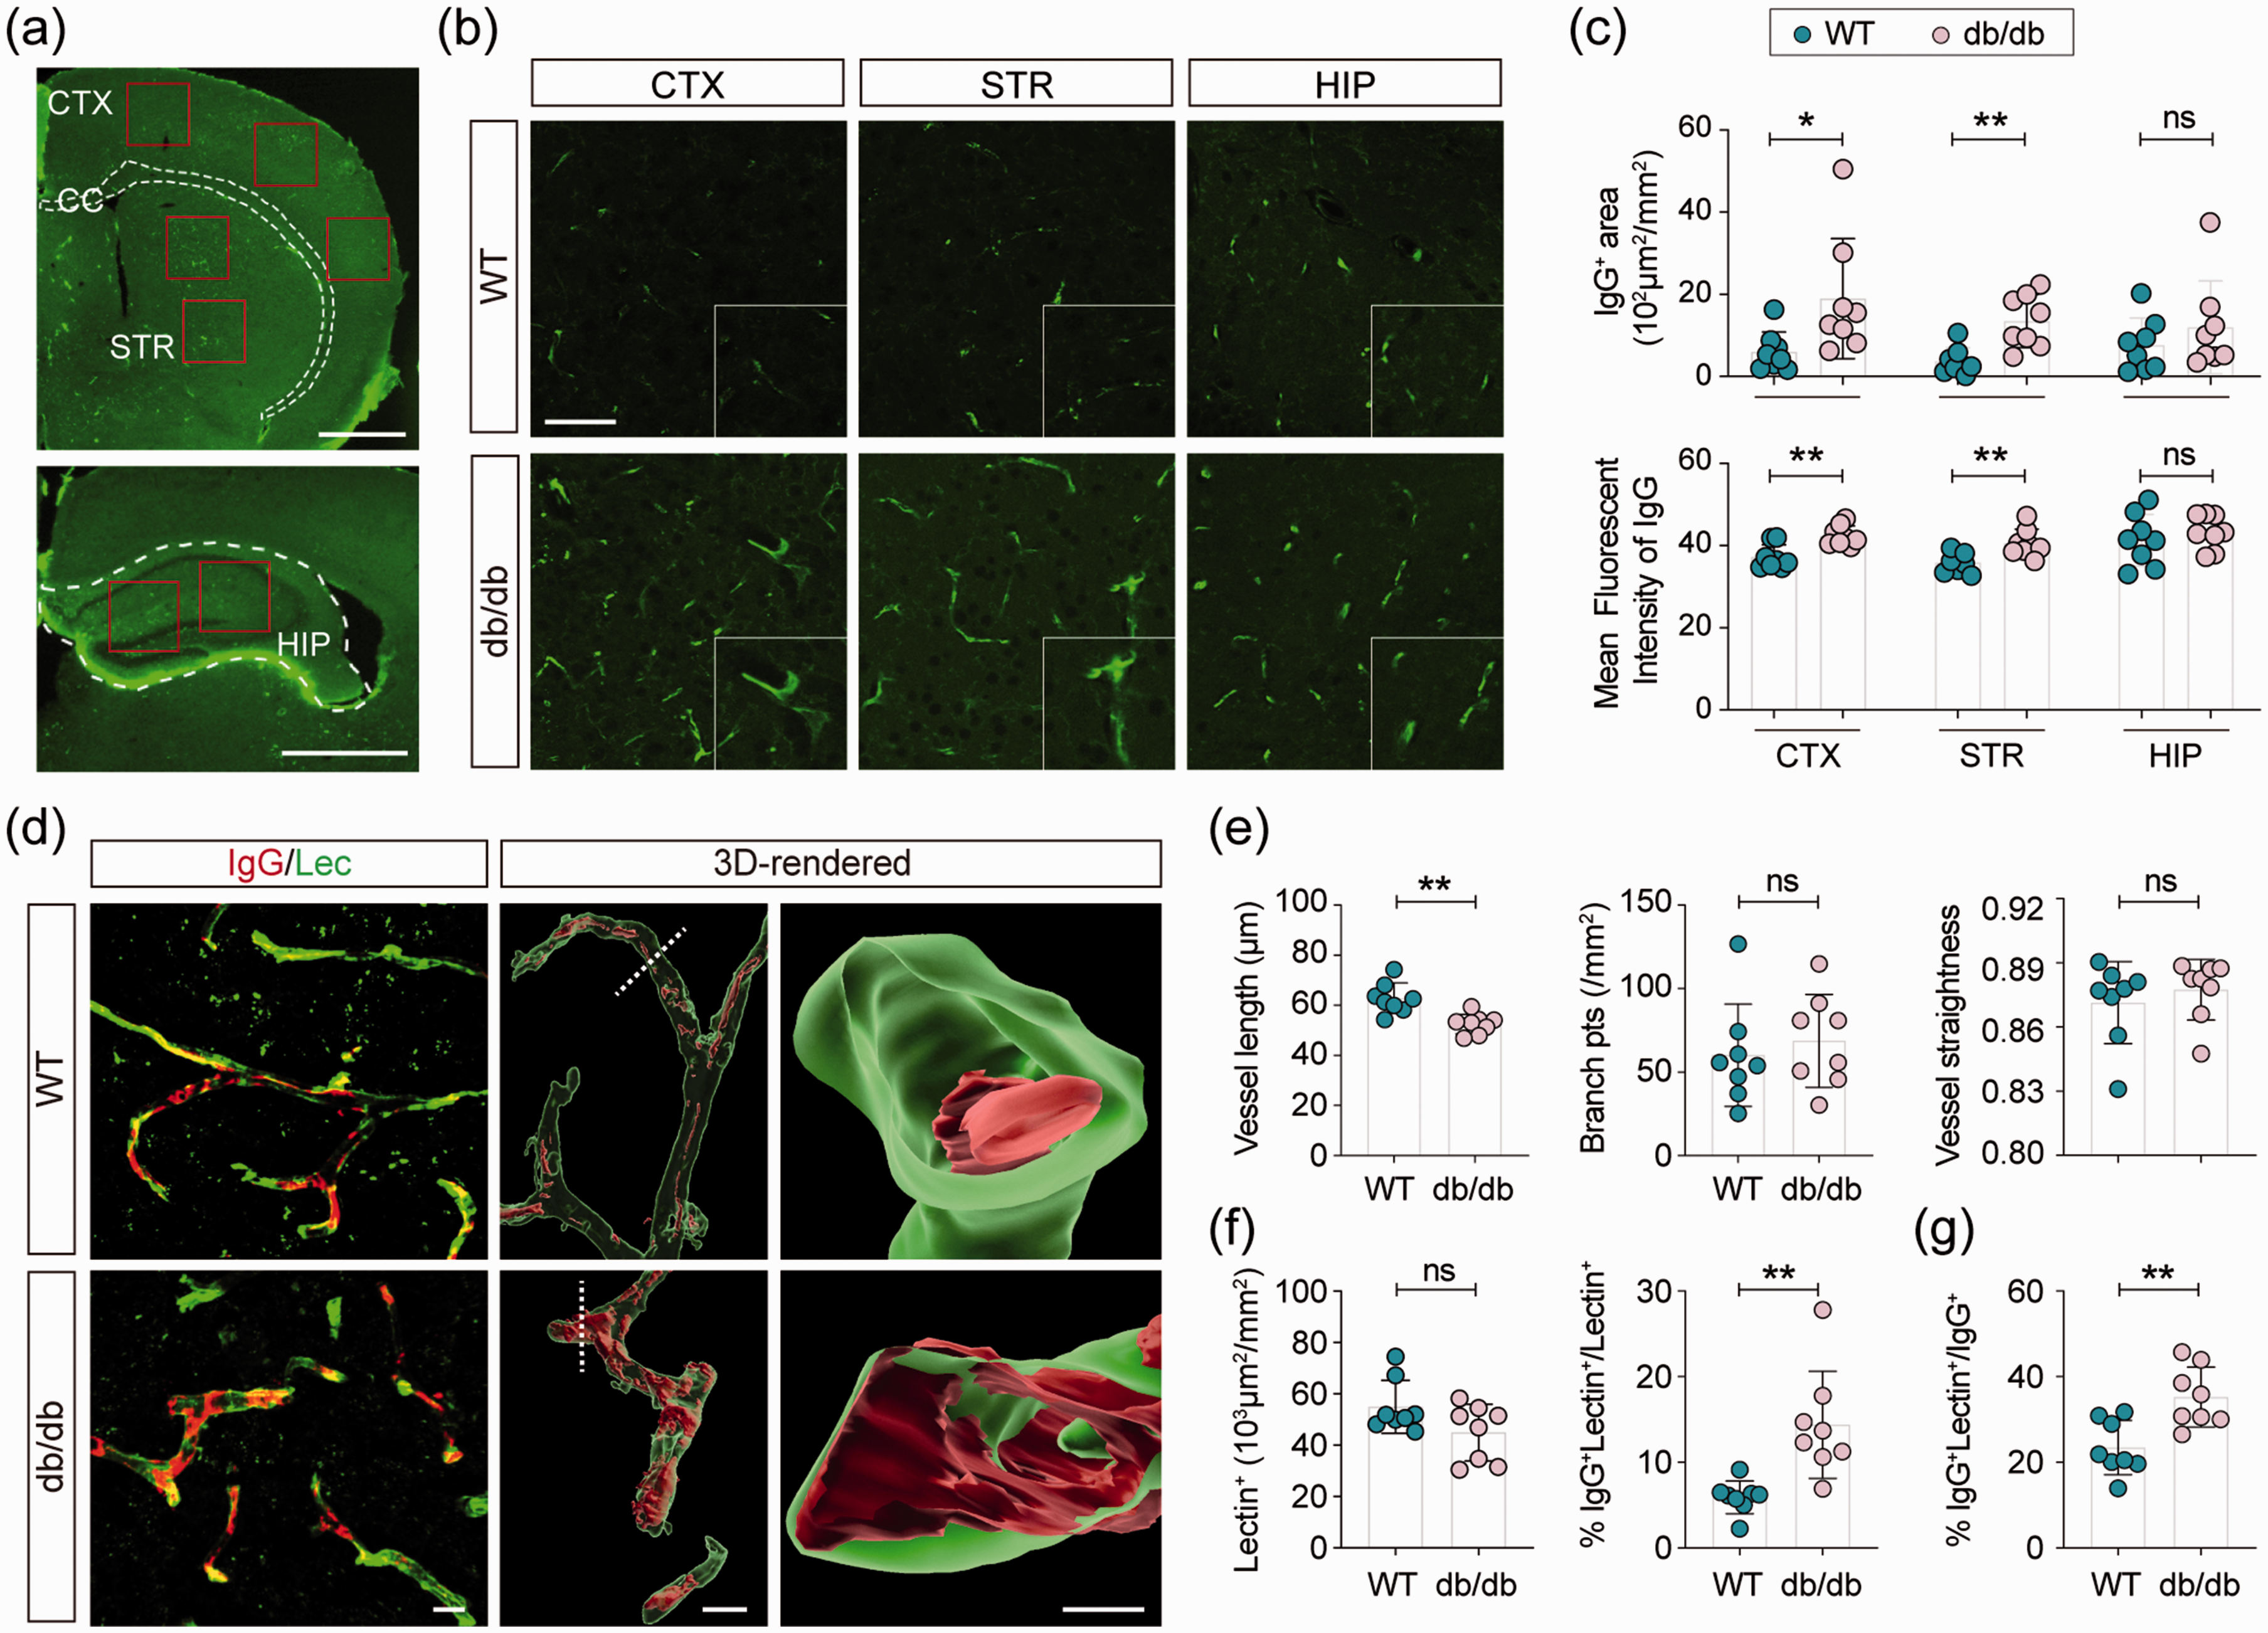
Abnormal deposit of IgG on the cerebral microvascular wall. Representative images of plasma-derived immunoglobulin G (IgG) in the brain of WT and diabetic mice. (a) Low power images (Scale bars = 1mm) represented the regions (rectangles) where images in (b) were captured. CTX: cortex, CC: corpus callosum, STR: striatum, HIP: the hippocampus. Scale bar = 50 μm. (c) Quantification of IgG-positive signal intensity in cortex, striatum, and hippocampus. n = 8 per group, ns = no significant difference. *p < 0.05, **p < 0.01 vs. WT using two-tailed Student’s t test or Mann-Whitney U test. (d) Representative images of double labeling of Lectin and immunoglobulin G (IgG) and 3D-rendered images. Scale bar = 10 μm. Quantification of (e) vessel length, the number of vascular branch points, vessel straightness, (f) Lectin+ area and the percentage of IgG+Lectin+/Lectin+, and (g) the percentage of IgG+Lectin+/IgG+ in WT and db/db mice. n = 8 per group, ns = no significant difference, **p < 0.01 vs. WT using two-tailed Student’s t test or Mann-Whitney U test.
Discussion
Using the FACT clarity method, we, for the first time, visualized perfused vessels in the whole brain of juvenile and adult db/db diabetic mice. Our results indicate that insufficient cerebrovascular perfusion is detected as early as four weeks after birth in hyperglycemic mice. Indeed, in contrast to the increase in morphological parameters of macrovessels in db/db mice, functional microvascular parameters were significantly reduced, indicating cerebral microcirculation hypoperfusion in db/db mice. Further, we observed remodeling of the gliovascular unit, characterized by widespread loss of pericytes, hyperreactivity of astrocytes, and extended microglia sprouts towards endothelial cells, which could potentially exacerbate cerebral hypoperfusion and hypoxia in the diabetic brain. Surprisingly, this pericyte loss and cerebral inflammation did not induce hyperpermeability of the BBB in db/db animals. However, the increased accumulation and atypical deposit of IgG on the microvascular wall in adult diabetic mice could lead to angiopathy, aggravating the hypoperfusion of the diabetic brain.
In response to hyperglycemia, neovascularization has been widely reported in diabetic retinopathy, nephropathy, peripheral arterial disease, and coronary artery disease in various diabetic animal models.27–30 When it comes to the brain, emerging evidence has shown that diabetes induces pathological changes in cerebrovascular structure, including functional vascular remodeling, vascular smooth muscle cell proliferation, endothelial cell degeneration, and basement membrane abnormal thickening which are correlated with cognitive dysfunctions.10,31,32 Cerebral neovascularization was initially confirmed in type 2 GK rats. 9 Although both db/db mice and GK rats have increased vascular branch density and tortuosity of penetrating arterioles, neovascularization was only detected in microvessels in adult db/db mice. 10 Because of technological limitations, previous studies examining vascular morphological changes employed techniques based primarily on immunofluorescent staining of brain slice. With the development of organ clarity methods, three-dimensional visualization of the whole-brain vasculature has been reported using various labeling strategies.33,34 In this study, perfused vessels were labeled with lectin and envisaged by light-sheet imaging after whole-brain clearing with FACT. Functional vessels with different diameters were reconstructed and filtered in Imaris, which allowed us to perform a more comprehensive analysis of the vasculature in the mouse brain. Our results demonstrated that whole-brain vascular density was markedly increased in the adult db/db mice. Despite an increase in vessel branch point number, the vessel terminal points were significantly reduced in the adult diabetic brain, indicating that the newly generated vessels were prone to form loops. This increased loop structure may contribute to the poor perfusion observed in type 2 diabetic animals. In db/db mice, the perfusion volume of macrovessels was noticeably increased, but not significantly different from WT mice. This over perfusion of macrovessels combined with a marked decrease in the percentage of microvessels in 16-week-old mice suggests a redistribution of blood flow between macrovessels and microvessels, in favor of macrovessels in hyperglycemic mice. Indeed, despite the overall increase in vessel diameter, inner surface area, and the volume of vessels in the whole brain, individual vessels with a diameter of less than 20 μm were severely decreased in db/db mice. Compared to WT mice of the same age, microvessels of the same length were prone to have a smaller perfused area and volume in db/db mice. Also, we found that the microvascular density initially declined in juveniles, suggesting short-term hyperglycemia was sufficient to induce cerebrovascular dysfunction in db/db mice. Even though it's impossible to know the relative percentage of arteries and veins in the labeled vessels, we believe the redistribution of blood flow between macrovessels and microvessels accounts for the chronic cerebromicrovascular hypoperfusion in diabetic mice. Further, this cerebral microvessel hypoperfusion occurs at a very early stage and is sustained into adulthood in db/db mice.
The gliovascular unit regulates cerebral vascular perfusion, which facilitates the delivery of nutrients and oxygen to the brain. As the cellular part of the BBB, the dynamic function of the gliovascular unit also determines the permeability of the BBB.35,36 It is formed by a continuous layer of endothelial cells, covered by pericytes, astrocytes, microglia, and vascular basement membrane. As mural cells, pericytes play pivotal roles in angiogenesis, 37 BBB formation and maintenance, 14 regulation of cerebral blood flow, 38 and inflammatory responses in the brain.35,39 Consistent with previous studies in diabetic animals, we observed a substantial loss of pericytes in the leptin receptor-deficient mice; however, it is still unknown whether the loss of these cells is directly caused diabetes.20,40,41 Due to the severe loss of pericytes observed under hyperglycemic conditions, the number of gliovascular units markedly declined in db/db mice, which could have in turn exacerbated the functional deficits of microvessels.40,42 In addition to its involvement with the BBB, pericytes also participate in the regulation of angiogenesis and the vessel maturation process. 43 Neovascularization with reduced pericytes support has been reported to be associated with the formation of capillaries that are leaky and poorly perfused in diabetic mice. 44 Although we didn't examine whether the loss of pericytes had any impact on neovascularization in db/db mice, widespread loss of pericytes could potentially lead to uncontrolled neovascularization in diabetes. Therefore, further investigation to determine the role of pericytes in neovascularization in db/db mice is warranted.
Microglia are the residential macrophages in the brain that serve to regulate immune function, brain development, and maintenance of homeostasis. A previous study revealed that BBB breakdown enables macrophage infiltration and parallel activation of both resident microglia and peripheral-derived macrophages in db/db mice. 26 Herein, no significant difference was detected in the number of Iba1+ cells in the cortex; however, the area and volume of microglia were significantly enlarged, indicating their functional activation in diabetic brain. The underlying mechanism of microglia activation in diabetes is still unknown. Independent of BBB breakdown, hyperglycemia itself could stimulate microglia activation.41,45 Pio del Rio-Hortega first reported an association between microglia and blood vessels in 1932. 46 We found that the interaction between microglia and endothelial cells became more significant in the adult db/db mice. The invasion of microglia cell to neurovascular unit (NVU) was observed in diabetic brain. 47 The elongated cytoplasmic processes from ramified microglia are typically slide in between the intact astrocytes, surveilling damage signals in NVU. 47 In T2DM, chronic inflammation has been characterized with increased blood concentration of pro-inflammatory proteins, such as IL-6, IL-1, TNFα, monocyte chemotactic protein 1 (MCP-1) and fibrinogen. Circulating cytokines enhanced vascular permeability and adhesion of leukocytes, which potentially contribute to the activation of microglia and their vascular-targeting movement. 48 Activated microglia have been shown to stimulate angiogenesis in vivo and in vitro, contributing to neovascularization in diabetic mice. 49 Meanwhile, inflammatory factors released by microglia can damage endothelial cells, which subsequently exacerbate BBB leakage in diabetic animals.26,50 This increased permeability of the BBB and the chronic cerebral inflammatory environment collaboratively result in severe cerebrovascular complications.51–53 In addition to the role that microglia play in the cytotoxic effects of inflammation and oxidative stress, microglia also exert inflammation-independent functions without overt activation. Thus, we cannot exclude the possibility that the increased microglia-capillary association that we observed contributed to the reduced perfusion of microvessels at the early onset of diabetes, when microglia activation was still undetectable. Simultaneously, activated astrocytes on vessels also play a role in innate immunity in diabetic brains akin to the relationship between amoeboid microglia and blood vessels. 54 A previous study suggested that hyperglycemia caused high reactivity in astrocytes of the hippocampus, reflecting an adaptive process to alterations in glucose homeostasis. 55 We didn't examine the detailed interaction between astrocytes and endothelial cells in the db/db brain. However, previous ultrastructural examination showed that the foot processes of activated astrocytes detach from adjacent endothelial cells, resulting in the loss of gliovascular unit coupling in db/db mice. 56
The loss of gliovascular units induces BBB dysfunction, thereby risking exposure of the brain to peripheral toxins. BBB leakage has been considered a critical feature of diabetes-related CNS complications.57,58 In diabetic animals, BBB integrity has been assessed by various tracers, including sodium fluorescein, Evans blue, dextran, and albumin.22,26,40,59 The majority of previous studies have illustrated that cognitive deficits are greatly attributed to BBB damage in experimental diabetic models.19,21 However, a few studies reported that chronic hyperglycemia was insufficient to induce BBB dysfunction and leakage.22,41 Transient BBB dysfunction was observed in juvenile but not adult db/db mice, indicating that hyperglycemia-induced BBB rupture may not be the underlying mechanism of CNS complications in diabetes. 22 Although the characterization and mechanism of BBB breakdown in diabetes are not yet well understood, preserving BBB integrity has been considered a promising therapeutic target to alleviate diabetes-induced neurological disorders.19,60
Given the widespread loss of the gliovascular unit in the current study, we further examined the integrity of the BBB in adult db/db mice. IgG was quantified in the cortex, striatum, and hippocampus. The results showed that both the IgG+ area and fluorescent intensity was increased in db/db mice. Additionally, we compared the distribution of IgG in the control and diabetic brain. To our surprise, IgG was mainly restricted to blood vessels, and was rarely detected in the cerebral parenchyma of adult diabetic animals. Thus, BBB integrity seems to be maintained in 16-week-old leptin receptor-deficient mice, consistent with findings in the human brain. 61 Compared to the dispersed signal detected in WT mice, IgG was confined to the wall of cerebral blood vessels in db/db mice. Previous studies have demonstrated that antibodies produced in T2DM lead to the formation of circulating immune complexes, which could be stable in the blood for a long time and then deposit on small blood vessels, leading to microangiopathy.62–64 The immune complexes have been reported to induce pericyte loss and retinal injury in diabetic retinopathy. 65 The extensive loss of pericytes may exacerbate the abnormal IgG deposit due to insufficient clearance in cerebral endothelial cells.36,66,67 It is too early to definitively conclude that the BBB is intact in adult db/db mice, as we didn't investigate BBB permeability to other tracers of different sizes. Nonetheless, IgG deposits, the primary component of immune complexes formed in diabetes, on the cerebrovascular wall are considered to be harmful to microvascular perfusion and to the viability of endothelial cells. Furthermore, we noticed that several studies have reported unignorable gender differences in vascular biology, especially in microvessels in both physiological and pathological environments.68–71 We believed that gender differences in the diabetic animal cerebrovasculature are an issue worth more attention in the future.
In this study, no significant difference was observed in the endothelial cell coverage area, vessel branch points number, or straightness between brain slices derived from control and db/db mice. These data contrast with those obtained with the cleared whole brain, where differences in these parameters between the control and db/db mice were observed, indicative of neovascularization in the diabetic brain. This discrepancy probably results from a fundamental difference in the vessels analyzed in the whole-brain versus the brain slice. Indeed, only functional vessels labeled by transcardially injected lectin were analyzed in the cleared whole brain, whereas immunohistological analysis of vessels on brain slices assessed all blood vessels. The mismatch between results generated from the analysis of the entire vasculature compared to just perfused vessels could be partially explained by the presence of thrombi in cerebral capillaries of the diabetic brain, the presence of acellular capillaries, or string vessel formation. Thrombi generated in cerebral capillaries of diabetic individuals have been reported to result in a reduction in blood flow perfusion. 72 In diabetic animals, the existence of acellular capillaries indicates endothelial cell death in capillaries, leaving only a thin layer of the non-perfused basement membrane. 73 Thus, we assumed that capillary thrombus formation and excessive endothelial cell death in diabetic mice might suggest equal coverage of endothelial cells when in actuality there was a distinct difference in the extent of tissue perfusion between two groups.
Despite evidence of vascular remodeling in diabetic experimental models, the underlying molecular mechanism is still largely unknown. What has been reported is a notable increase in matrix metalloprotease (MMP)-2 and -9 expression activity and cerebral vascular tortuosity in GK rats. Therapeutic strategies that inhibit MMPs expression/activity are beneficial in preventing vascular dysfunction in diabetic models, suggesting the fundamental roles of MMPs in hyperglycemia-induced cerebrovascular remodeling.7,32 Additionally, MMP-2 activity was upregulated by endothelin-1 (ET-1), a potent vasoconstrictor excessively produced by endothelial cells in GK diabetic rat,10,74 via activation of its receptor ETA and/or ETB. ET-1 is involved in regulating cerebral autoregulation, myogenic response, cerebrovascular remodeling, neovascularization, as well as neurovascular coupling under both physiological and diabetic conditions. 74 Thus, more investigation is needed to reveal the molecular mechanism of cerebrovascular structure and functional remodeling during T2MD progression over time.
In summary, diabetes-induced effects on the cerebrovasculature may underlie the increased susceptibility of diabetic patients to develop neurological disorders, such as stroke, vascular dementia, and Alzheimer’s disease.5–7 However, not much is known about the dynamic changes in cerebrovascular structure and functional remodeling as T2DM progresses. We used the FACT clarity method in juvenile and adult db/db mice to examine the structural and functional changes in the vasculature of the whole brain in response to hyperglycemia, and the role that the gliovascular unit might play in these changes. We observed an onset of cerebrovascular hypoperfusion as early as four weeks after birth in db/db mice correlated with the remodeling of the functional cerebrovascular architecture. This remodeling culminated in the redistribution of cerebral blood flow towards macrovessels with sustained exposure to the hyperglycemic environment. Loss of hyperglycemic-induced gliovascular coupling, characterized by marked pericyte loss, as well as astrocyte and microglia activation, may have partially played a role in microvessel and endothelial cell dysfunction in db/db mice. However, these early changes were independent of any effects of the loss of gliovascular units on BBB integrity. Thus, further studies are needed to clarify the role of glial cells in pathological neovascularization and gliovascular coupling during T2DM.
Supplemental Material
sj-pdf-1-jcb-10.1177_0271678X211006596 - Supplemental material for Three-dimensional remodeling of functional cerebrovascular architecture and gliovascular unit in leptin receptor-deficient mice
Supplemental material, sj-pdf-1-jcb-10.1177_0271678X211006596 for Three-dimensional remodeling of functional cerebrovascular architecture and gliovascular unit in leptin receptor-deficient mice by Yaan Liu, Di Chen, Amanda Smith, Qing Ye, Yanqin Gao and Wenting Zhang in Journal of Cerebral Blood Flow & Metabolism
Footnotes
Funding
The author(s) disclosed receipt of the following financial support for the research, authorship, and publication of this article: This project was supported by the Chinese Key R&D Plan of the State Ministry of Science and Technology 2017YFC1308403 (to Y.G.), Shanghai Municipal Science and Technology Major Project (No.2018SHZDZX01) and ZJLab.
Declaration of conflicting interests
The author(s) declared no potential conflicts of interest with respect to the research, authorship, and/or publication of this article.
Authors’ contributions
WZ and YG designed the study. YL performed the experiments. YL and DC analyzed the data. YL and WZ wrote the manuscript. AS and QY contributed to data interpretation and critical revisions of the manuscript.
Supplementary material
Supplemental material for this article is available online.
References
Supplementary Material
Please find the following supplemental material available below.
For Open Access articles published under a Creative Commons License, all supplemental material carries the same license as the article it is associated with.
For non-Open Access articles published, all supplemental material carries a non-exclusive license, and permission requests for re-use of supplemental material or any part of supplemental material shall be sent directly to the copyright owner as specified in the copyright notice associated with the article.