
Abstract
Traumatic Brain Injury (TBI) is associated with both diffuse axonal injury (DAI) and diffuse vascular injury (DVI), which result from inertial shearing forces. These terms are often used interchangeably, but the spatial relationships between DAI and DVI have not been carefully studied. Multimodal magnetic resonance imaging (MRI) can help distinguish these injury mechanisms: diffusion tensor imaging (DTI) provides information about axonal integrity, while arterial spin labeling (ASL) can be used to measure cerebral blood flow (CBF), and the reactivity of the Blood Oxygen Level Dependent (BOLD) signal to a hypercapnia challenge reflects cerebrovascular reactivity (CVR). Subjects with chronic TBI (n = 27) and healthy controls (n = 14) were studied with multimodal MRI. Mean values of mean diffusivity (MD), fractional anisotropy (FA), CBF, and CVR were extracted for pre-determined regions of interest (ROIs). Normalized z-score maps were generated from the pool of healthy controls. Abnormal ROIs in one modality were not predictive of abnormalities in another. Approximately 9-10% of abnormal voxels for CVR and CBF also showed an abnormal voxel value for MD, while only 1% of abnormal CVR and CBF voxels show a concomitant abnormal FA value. These data indicate that DAI and DVI represent two distinct TBI endophenotypes that are spatially independent.
Introduction
Traumatic brain injury (TBI) is a heterogeneous disorder encompassing a number of distinct pathophysiological injuries to various brain structures and cell types, including focal injuries such as contusions and hematomas, and diffuse injuries characterized by axonal shearing, diffuse microvascular injury, and inflammation. Multiple workshops convened by the National Institutes of Health and the Department of Defense have concluded that effective therapies for TBI will need to target these specific pathophysiological mechanisms. 1 Evidence of diffuse axonal injury (DAI) and traumatic cerebral vascular injury (TCVI), believed to result from diffuse shearing and stretching forces, is common in brain injured patients, and may serve as a useful measure for this purpose. However, it is not fully understood what relationship, if any, exists between these heterogeneous endophenotypes throughout the pathobiological progression of brain trauma related illness.
DAI is nearly universally detected in post-mortem studies in humans who die after a TBI 2 as well as in preclinical studies of experimental TBI.3–5 DAI is commonly assessed in vivo using magnetic resonance imaging (MRI) via diffusion tensor imaging (DTI). While DTI is not specific to traumatic axonal damage, it has been shown to be a sensitive tool for detection of microstructural damage in white matter tracts after TBI. 6 Numerous studies report changes in the DTI metrics such as fractional anisotropy (FA) and mean diffusivity (MD) after brain injury.7–9 A metanalysis of several studies found that FA is consistently reduced in various white matter tracts in brain injured patients. 10 In preclinical studies, changes in DTI metrics correlate with axonal damage11,12 and gliosis. 13 Furthermore, DAI is accompanied by multiple molecular and cellular changes including cell membrane disruption, Wallerian degeneration and vasogenic edema. DTI abnormalities are more accurately classified as microstructural changes of which axonal damage is one contributing component.
TCVI is less commonly studied than diffuse axonal injury, however multiple reports of structural and functional vascular abnormalities substantiate a need for further investigation and development of clinically useful biomarkers. Preclinical studies utilizing numerous animal models including controlled cortical impact,14,15 fluid percussion injury,16,17 and impact acceleration18,19 report damage to the cerebral microvasculature after injury. Density of small blood vessels away from the impact site is significantly reduced immediately after FPI and remains low up until 3 weeks after the injury. 16 The vessel walls are structurally compromised after experimental TBI, showing enlargement of intracellular junctions and swelling of endothelial cells. 20 Structural damage to the cerebral vasculature has been demonstrated in postmortem TBI tissue.21–24 Clinical and preclinical imaging studies have revealed disrupted cerebral blood flow (CBF) as well as disruptions in cerebrovascular reactivity (CVR) after TBI.25,26 Whether these disruptions are linked to DAI lesions or are separate entities is unclear.
The neurovascular unit links cerebral vasculature to synaptic activity associated metabolic demand. Damage to blood vessels after TBI can exacerbate the injury to surrounding tissue by inducing tissue hypoxia.27,28 Additionally, damage to axons may trigger abnormal cerebral vasogenic tone in affected areas. The extent of the relationship between structural tissue damage and vascular dysfunction following TBI is not well understood. This study utilized a multi-modal magnetic resonance imaging protocol to investigate the spatial relationship between macrostructural and microstructural damage and vascular dysfunction in a cohort of chronic TBI subjects.
Methods
Population study
The Central Neuroscience Institutional Review Board (IRB) at the National Institute of Neurological Disorders and Stroke, National Institutes of Health, governed by the Helsinki Declaration (as revised in 1983) and the Belmont Report approved the study. Written consent was obtained from all study participants.
Following recruitment of subjects, and a priori omission of individuals exhibiting technical difficulties in data collection, such as excessive head movement during MRI acquisition, 42 subjects (27 with TBI and 14 control subjects) between the ages of 18 and 55 were included in the final analyses. Subjects were consented under an IRB-approved protocol and prospectively studied (ClinicalTtrial.gov NCT01762475). Patients with TBI were eligible if they had suffered a moderate or severe TBI (by Department of Defense criteria defined by at least one of the following criteria: initial Glasgow Coma Score between 3 and 12, post-traumatic amnesia > 24 hours, or TBI-related abnormality on neuroimaging- CT or MRI). TBI participants had been injured 6 months or more prior to enrollment. Patients were excluded if they had: penetrating head injury, pre-existing disabling neurologic or psychiatric disorder, current pregnancy, or an unstable pulmonary or vascular disorder. Controls were gender- and age-matched. Healthy controls (HC) were enrolled if they had no history of TBI, pre-existing disabling neurological or psychiatric disorders or current pregnancy.
Imaging sequences
MRI was performed on a Siemens Biograph mMR, a fully integrated 3 T MRI/PET scanner. T1 Magnetization Prepared Rapid Gradient Echo (MPRAGE), Susceptibility weighted imaging (SWI), T2- gradient echo sequences (GRE), Diffusion weighted imaging (DWI), Diffusion tensor imaging (DTI), Fluid-attenuated inversion recovery (FLAIR), pulsed Arterial Spin Labeling (ASL) and Magnetic Resonance Imaging–Blood Oxygenation Level Dependent (MRI-BOLD) sequences were acquired on each subject.
FLAIR
Fluid-attenuated inversion recovery (FLAIR) images were acquired with the following parameters: TR = 9090 ms, TE= 112 ms, TI= 2450 ms, Flip angle = 120 degrees, voxel size =0.9×0.9×3 mm3.
DTI
Diffusion weighted images were acquired on the same scanner with parameters TR = 8900 ms, TE = 92 ms, Flip angle = 90 degrees, Voxel size = 2× 2×3.5 mm3, Matrix size = 128×128, and Slices = 40. One image at b = 0 s/mm2 and 12 images with non-collinear directional gradients at b = 1000 s/mm2 were acquired twice with reversed phase encoding gradients (also known as blip-up blip-down).
ASL
Arterial spin labeling (ASL) images were acquired using a pulsed sequence with the PICORE Q2TIPS labeling scheme, on the same scanner. The following parameters were established for the acquisition of 111 2 D-EPI volumes: TR/TE =2700/15 ms, TI1/TI2 = 700/1800 ms.
fMRI with hypercapnia challenge (CVR)
The parameters used were; TR/TE = 2,000/25 msec, flip angle = 80°, field of view = 220×220 mm2, matrix= 64×64, 36 slices, thickness = 3.6 mm, no gap between slices, 210 volumes. During the sequence, each participant underwent hypercapnia challenge according to the methods developed previously.35,36 Hypercapnia is induced by breathing alternatively room air and 5% carbon dioxide (CO2) mixed with 21% O2 and 74% N2. End-tidal CO2 (EtCO2) was measured continuously during the experiment using a capnograph (Smith Medical, Model 9004). Arterial oxygenation and pulse were recorded by a fingertip pulse oximeter throughout the experiment.
Data processing
DTI
Images were processed using the CATNAP software29,30 for tensor estimation, with the exception that EPI and eddy current distortions were removed using the TOPUP software within the FMRIB software library (FSL), which takes advantage of the blip-up blip-down acquisition. This pipeline also takes into account motion correction and adjustments to the gradient table performed based on patient position. Linear tensor estimation was performed followed by computation of fractional anisotropy (FA).
CBF
Image data analyses were performed with the Statistical Parametric Mapping software (SPM12) and ASL data processing toolbox. The control and label ASL images were realigned and resliced to correct for head motion. Images were smoothed using an isotropic Gaussian kernel with a 4 mm full width at half-maximum. CBF images were reconstructed using the ASL Data Processing Toolbox: ASLtbx.
CVR
Voxel-by-voxel CVR maps were calculated based on a linear regression between BOLD signal time courses and the vascular input function. The BOLD response signal is temporally delayed from the EtCO2 trace which corresponds to the time needed for the blood to travel between the lungs to the cerebrovascular network. The EtCO2 time delay is individually timed to achieve the maximum correlation with the BOLD response signal. We processed voxel-by-voxel CVR maps using a general linear model, with the shifted EtCO2 time course as the regressor to generate CVR maps (in the units of % BOLD change/mmHg CO2 change, %/mmHg) for each subject. The full method is previously described by Lu et al. 31
Volumetrics and cortical thickness
Cortical reconstruction and volumetric segmentation was performed using the T1 weighted image with the Freesurfer image analysis suite (http://surfer.nmr.mgh.harvard.edu/). The technical details of these procedures are described in prior publications.32–34 Volumetric data for the regions of interest as well as cortical thickness maps were generated for each subject.
ROIs
The volume segmentation maps generated from Freesurfer for each subject were used to segment and extract ROI averages for MD, FA, CVR, and CBF. MPRAGE images were registered to the Freesurfer T1 image using SPM12, and the same transformation was applied to all other images. A custom Matlab script was then used to extract an average MD, FA, CBF, and CVR value for each ROI in the volume segmentation map.
Normalization
All subject images (FA, MD, CBF, CVR) were rigidly co-registered with their associated MPRAGE image using SPM12. All MRI maps were normalized into a common space (MNI-atlas) using SPM12. Normalization was performed by using the MPRAGE images, and then applying the same transformation to all other images. The MD, FA, CBF, CVR and Cortical thickness maps were then z-transformed using the pool of healthy controls from the study.
Statistical analysis
MRI maps were z-transformed using FSL. The 14 uninjured healthy volunteers were used to create voxel-wise mean and standard deviations in order to generate z-maps for each subject. A z-score for each ROI was generated as well using the average and standard deviation of each ROI from the pool of healthy volunteers for each modality. Normality of an ROI/voxel was determined based on z-score. An abnormal value was defined as a z-score > 2.5 for MD, and a z-score < −2.5 for FA, CBF, CVR, volume, and cortical thickness. All groups of data were assessed for displaying a normal distribution by Shapiro-Wilk. Normally distributed data was analyzed via unpaired, two-tailed Student’s t-test, and those data not distributed normally were analyzed using unpaired, two-tailed, non-parametric Wilcoxon Mann-Whitney U-test. Correlations, t-tests, and Mann-Whitney U were performed in Graphpad Prism (version 8). Statistical analyses comparing multiple regions of interest were corrected for multiple comparisons using the Holm-Sidak method in GraphPad Prism.
Results
Demographics
The 27 TBI subjects included in this study were predominantly male (71%), had a mean age of 37.6 years (SD 11.1 years), and had suffered a TBI a median of 23 months prior to enrollment (IQR 15–34 months). The cause of injury was a road traffic accident in 58%, with 37% of TBI subjects reporting a loss of consciousness of more than 30 minutes immediately following trauma. All but three injured subjects had TBI-related neuroimaging findings on initial cranial tomography (CT), including extra-axial hemorrhages (subdural and subarachnoid) and intraparenchymal contusions. 35 The median Glasgow Outcome Scale-Extended score was 7 (range, 4 to 8) and the majority (77%) had persistent post-concussive symptoms). Over half (15 of 27) had visible trauma-related encephalomalacia visible on standard structural MRI. Full details about the functional and neurocognitive measures for this cohort have been previously published. 25 The 14 participating healthy control subjects were matched for age and gender.
Subject-specific mapping of structural and functional brain abnormalities following TBI
Previous work in this cohort of patients has shown that global CBF and CVR are both decreased in these chronic TBI subjects, with CVR being a much more sensitive indicator of TCVI than CBF. 25 The relationship between CVR abnormalities and structural abnormalities was assessed in the same chronic TBI cohort via a multimodal MRI study. Representative brain images from a chronic TBI (Figure 1(a) to (e)) and a HC (Figure 1(f) to (j)) subject acquired using T1-MPRAGE (A, F), FLAIR (B, G), FA (C, H), MD (D, I), and MRI-BOLD/CVR (E, J) show regions of encephalomalacia (Figure 1(a) to (e), open circles labelled 1, 2, and 3) that are visually apparent on the FLAIR, FA, MD, and CVR maps of the TBI patient, as compared to the healthy control. In addition to those structurally damaged areas, the CVR map of the TBI subject shows additional regions of reduced CVR (Figure 1(e), open circles labeled 4 and 5) that do not co-localize with the mapped structural or microstructural lesioned areas. These representative images suggest that there can be limited overlap between vascular abnormalities and structural abnormalities in the chronic TBI cohort.
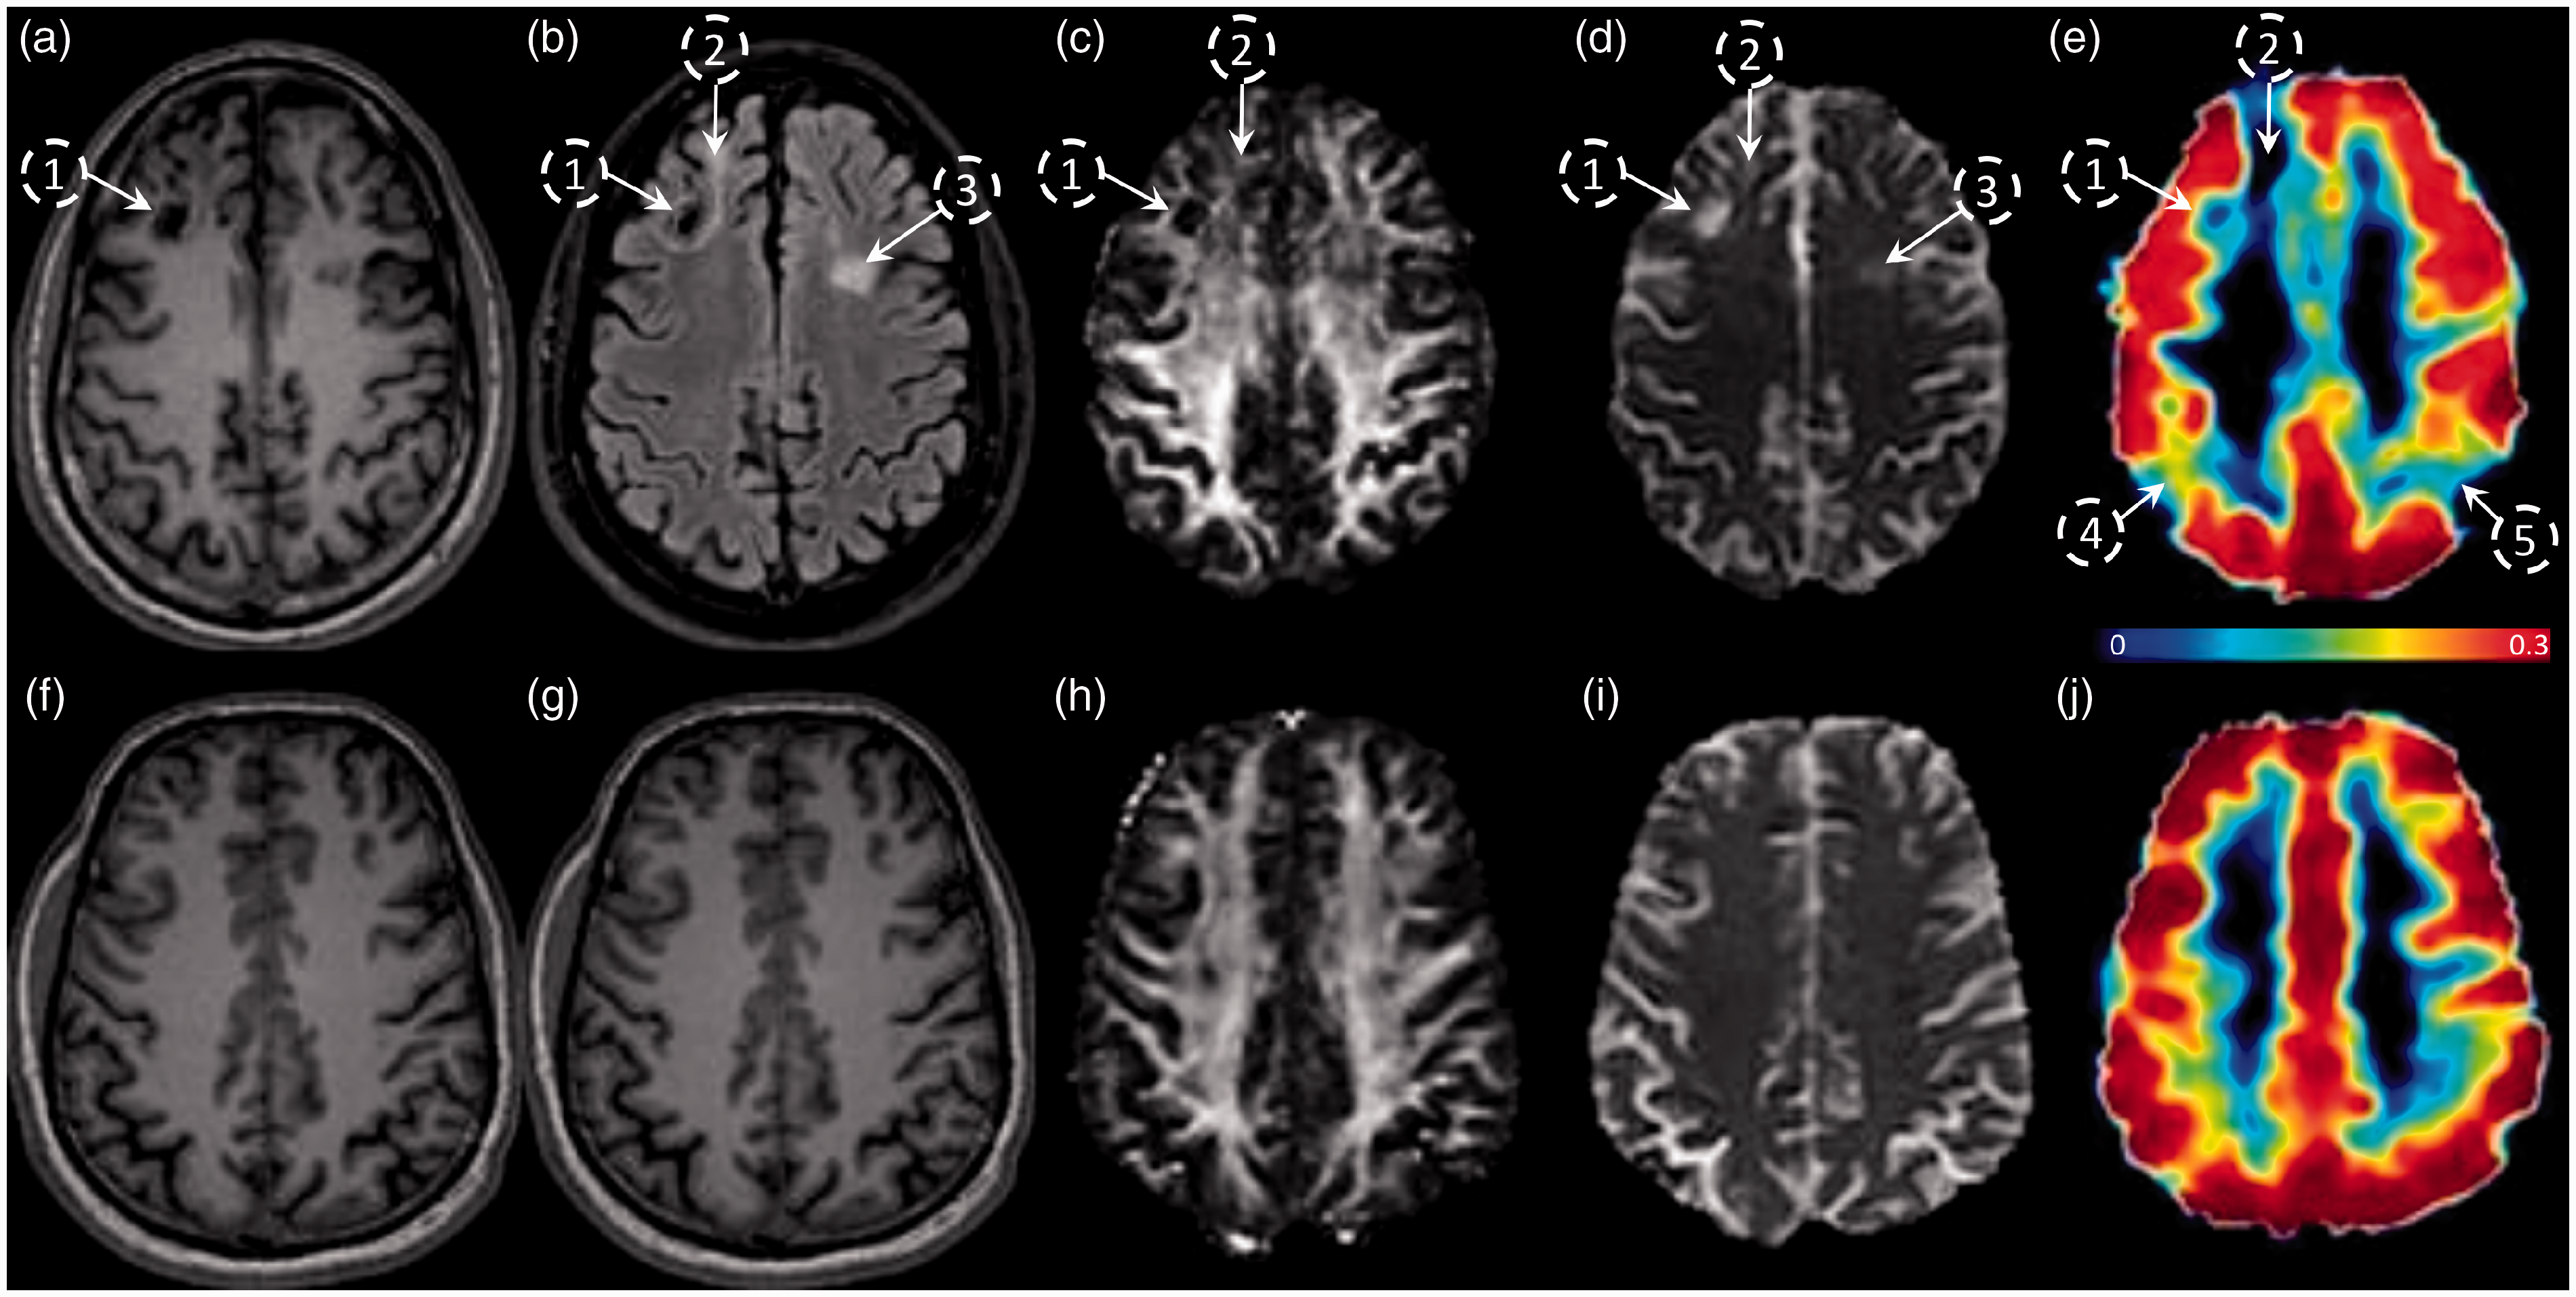
Evaluation of the spatial distribution and colocalization of CVR and structural abnormalities in chronic TBI-related illness. Subject-specific imaging abnormalities in a functional MRI metric do not always co-register with abnormalities in structural modalities. Representative images of a TBI subject (top panel) and HC subject (lower panel) acquired with 5 different MRI modalities; MPRAGE (a and f), FLAIR (b and g), DTI-FA (c and h), DTI-MD (d and i), and MRI-BOLD/CVR in %BOLD/mmHg (e and j). Encephalomalacia in region 1 is associated with low intensity FLAIR, FA, and CVR, and complementary high MD. Gliosis in regions 2 and 3 is associated with a high intensity FLAIR and high MD, however, only region 2 has a low CVR. Regions 3 and 4 have a low CVR, but no visible abnormalities in FLAIR or DTI images.
Ultrastructural brain volume vs. perfusion correlation analysis
To determine whether large scale structural alterations are related to overall vascular deficits, whole brain (WB), grey matter (GM), and white matter (WM) tissue volumes were assessed against their respective CBF and CVR values (Figure 2). Pearson correlation revealed that pooled TBI and HC whole brain, grey matter, and white matter volume showed a significant positive correlation with their respective CBF values (Figure 2(a) to (c)). Individual group analyses confirmed a positive correlation between whole brain volume and CBF values for both TBI and HC subjects (Figure 2(a)), and a statistically significant positive correlation between CBF and grey matter volume in HC participants, and a trend towards significance in correlation between TBI patient grey matter volume and CBF readings (Figure 2(b), P = 0.053). HC white matter volume was moderately correlated with CBF values (Figure 2(c)), and TBI patient white matter volume demonstrated a trend toward positive correlation with its respective CBF readings, however, this did not reach statistical significance (P = 0.12). There was no significant relationship between whole brain or grey matter volume and CVR, either for pooled TBI and HC subject values (Figure 2(d) and (e)), or for individual group TBI and HC values plotted against their respective CVR scores (Figure 2(d) and (e)). White matter volume showed a weak correlation and trend towards significance with white matter CVR for pooled TBI and HC values (Figure 2(f), r = 0.30, P = 0.06), and individual group analysis showed a weak, positive correlation and trend towards significance of white matter volume with TBI subject CVR (Figure 2(f), r = 0.32, P = 0.09), without a correlation of HC white matter volume with CVR.
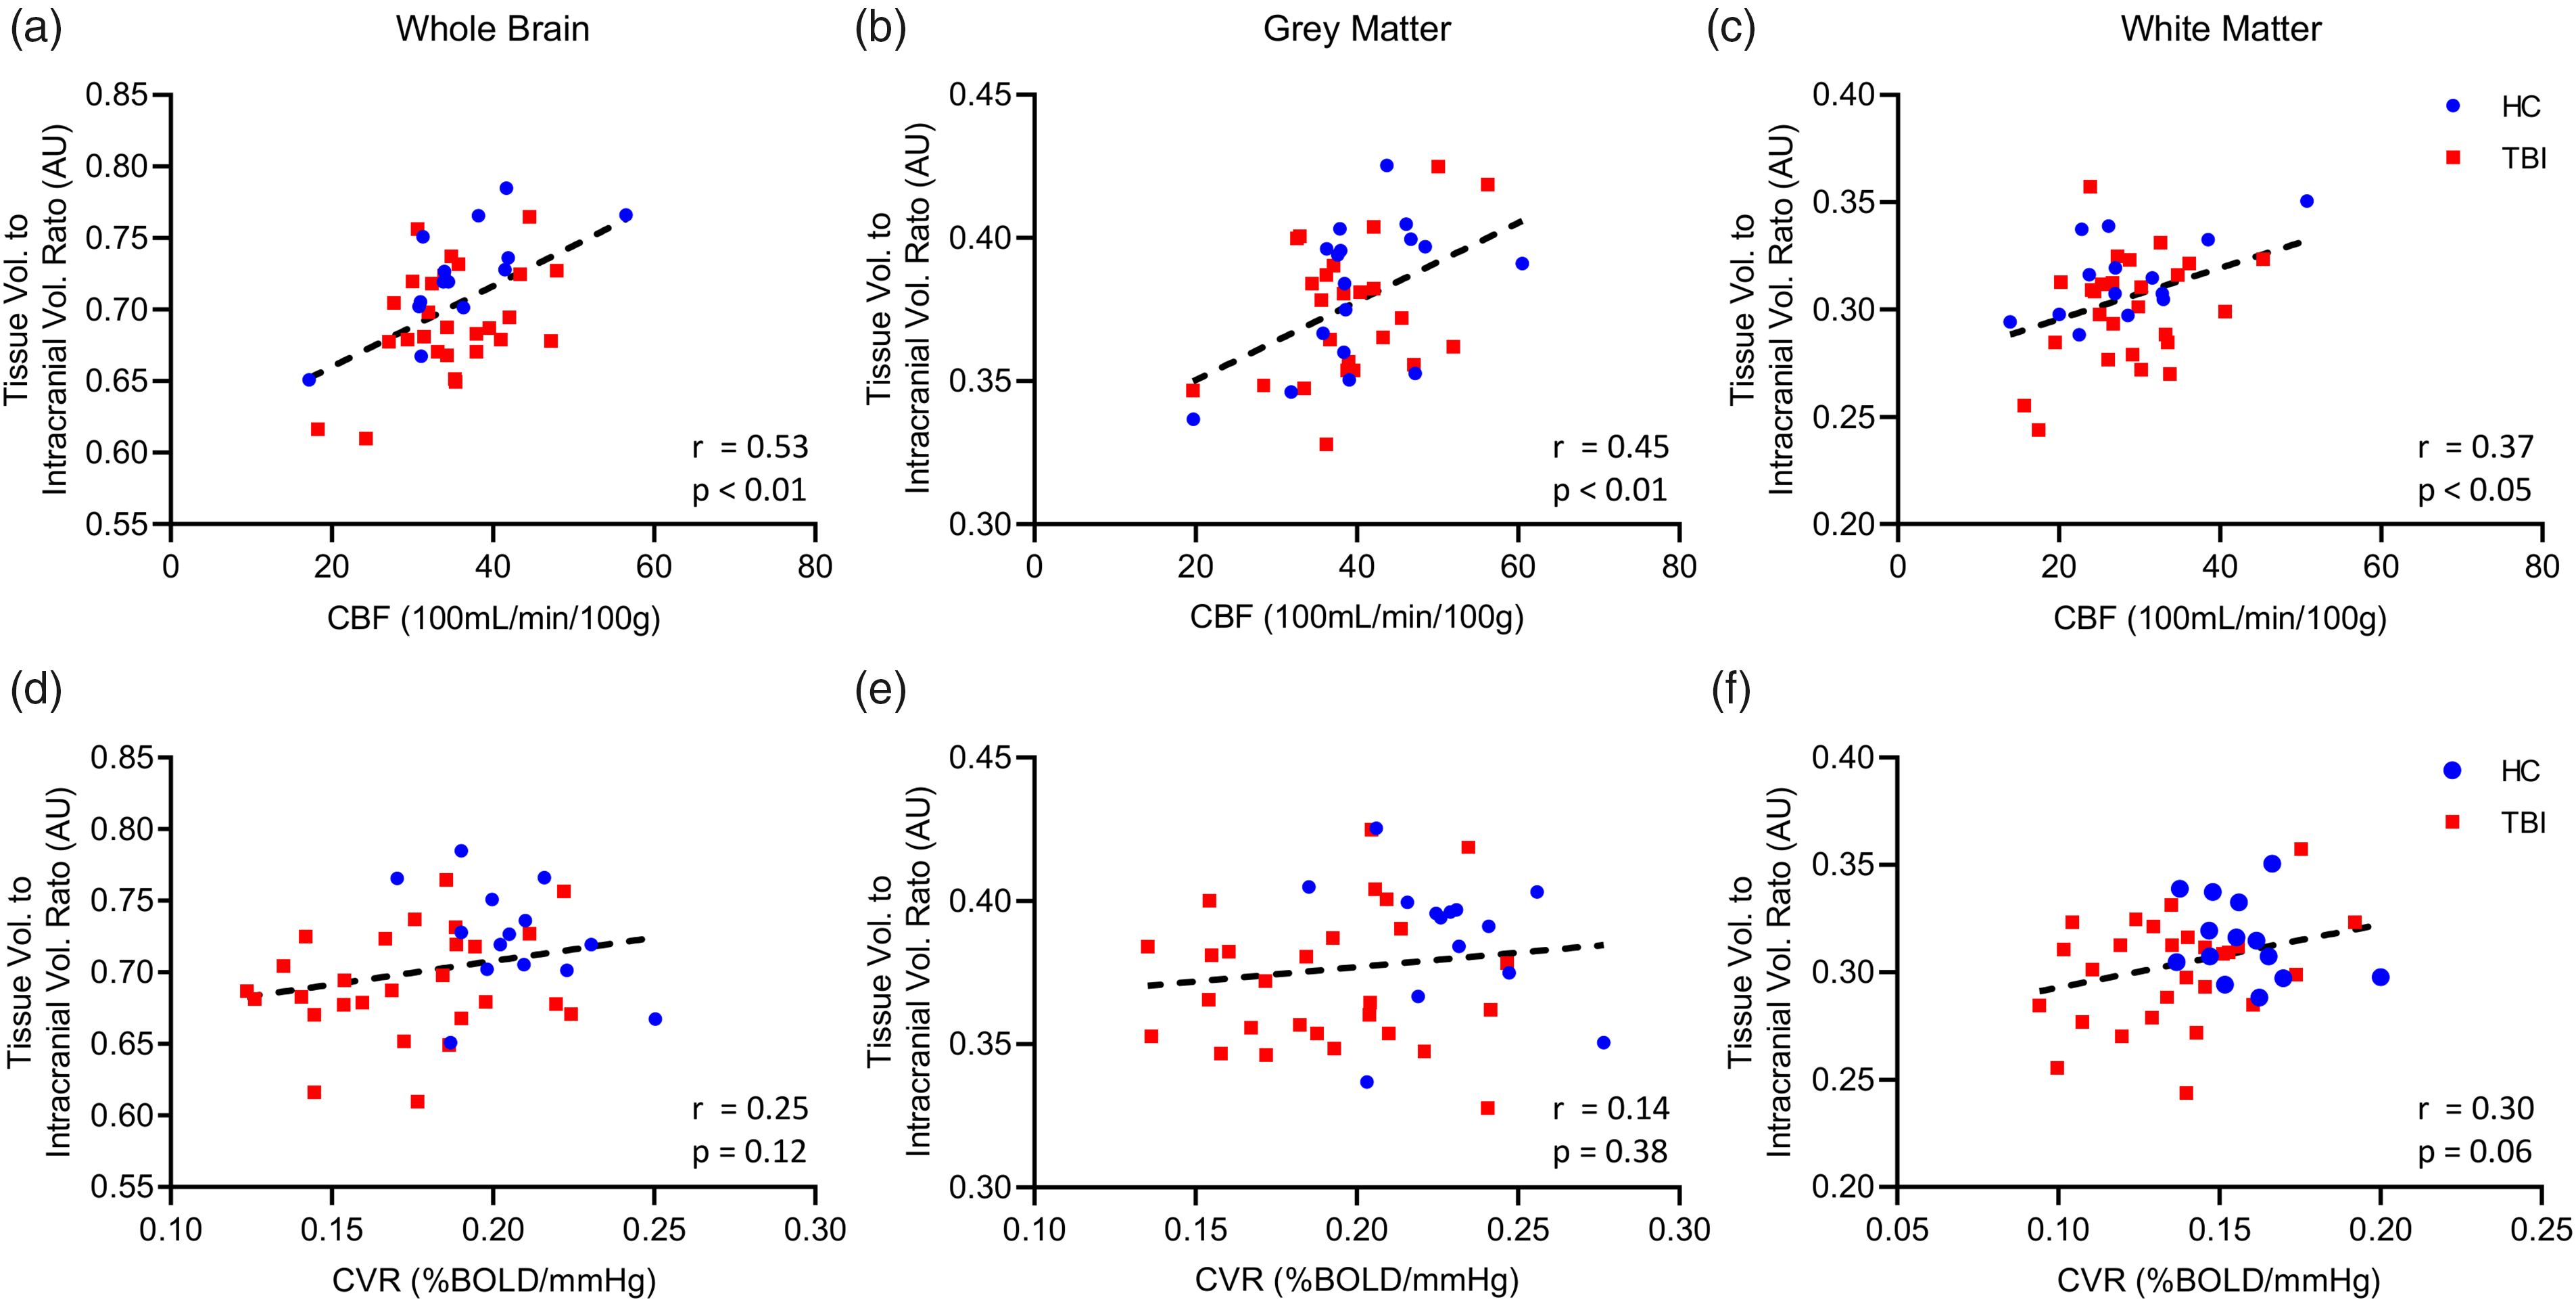
Correlation of CBF and CVR with whole brain, grey, and white matter volume in TBI and HC subjects. CVR does not correlate with brain volume. Plots of pooled TBI and HC subject whole brain, grey matter, and white matter volume against respective CVR (a–c), and CBF (d–f) showing standard linear regression curve (dotted line) and Pearson correlation statistical values (lower right corner). There was no correlation between whole brain, or grey matter volume when compared to the respective CVR for each tissue type (a–c), however, there is a trend towards significance for correlation between white matter volume and white matter CVR (c). TBI and HC individual group analysis showed correlation between HC whole brain, grey matter, or white matter volume and CVR (a, b, c, Pearson, P > 0.05), and no correlation between TBI whole brain, and grey matter volume and CVR (a, b, Pearson, P > 0.05). There was a weak trend towards correlation between TBI white matter volume and CVR, however, this was not statistically significant (c, Pearson, P = 0.09). Combined values for TBI and HC whole brain, grey matter, and white matter showed strong correlation with respective CBF readings (d–f). Analysis of TBI and HC groups separately demonstrated a positive correlation between whole brain volume and CBF values for both TBI and HC subjects (d). There was a statistically significant positive correlation between CBF and grey matter volume in HC participants, and a trend toward correlation between TBI patient grey matter volume and CBF readings, however, this was not statistically significant (e, Pearson, P = 0.053). HC group white matter volume was strongly correlated with CBF values (f), and TBI patient white matter volume demonstrated a trend toward positive correlation with its respective CBF readings, however, this did not reach statistical significance (P = 0.12). HC, n = 14; TBI, n = 27.
Subcortical grey matter regional volumetric and perfusion analysis
Regional deficits in subcortical grey matter volume, CVR, and CBF were assessed between the HC and TBI groups (Figure 3). There were no statistically significant differences in volume of the hippocampus, thalamus, or amygdala between the HC and chronic TBI groups (Figure 3(a)). CBF did not show any significant differences between the TBI and HC groups in the subcortical grey matter regions investigated (Figure 3(b), unpaired student t test, P > 0.05). CVR was significantly decreased in all subcortical grey matter regions of the TBI group as compared to HC (Figure 3(c), unpaired student t test).
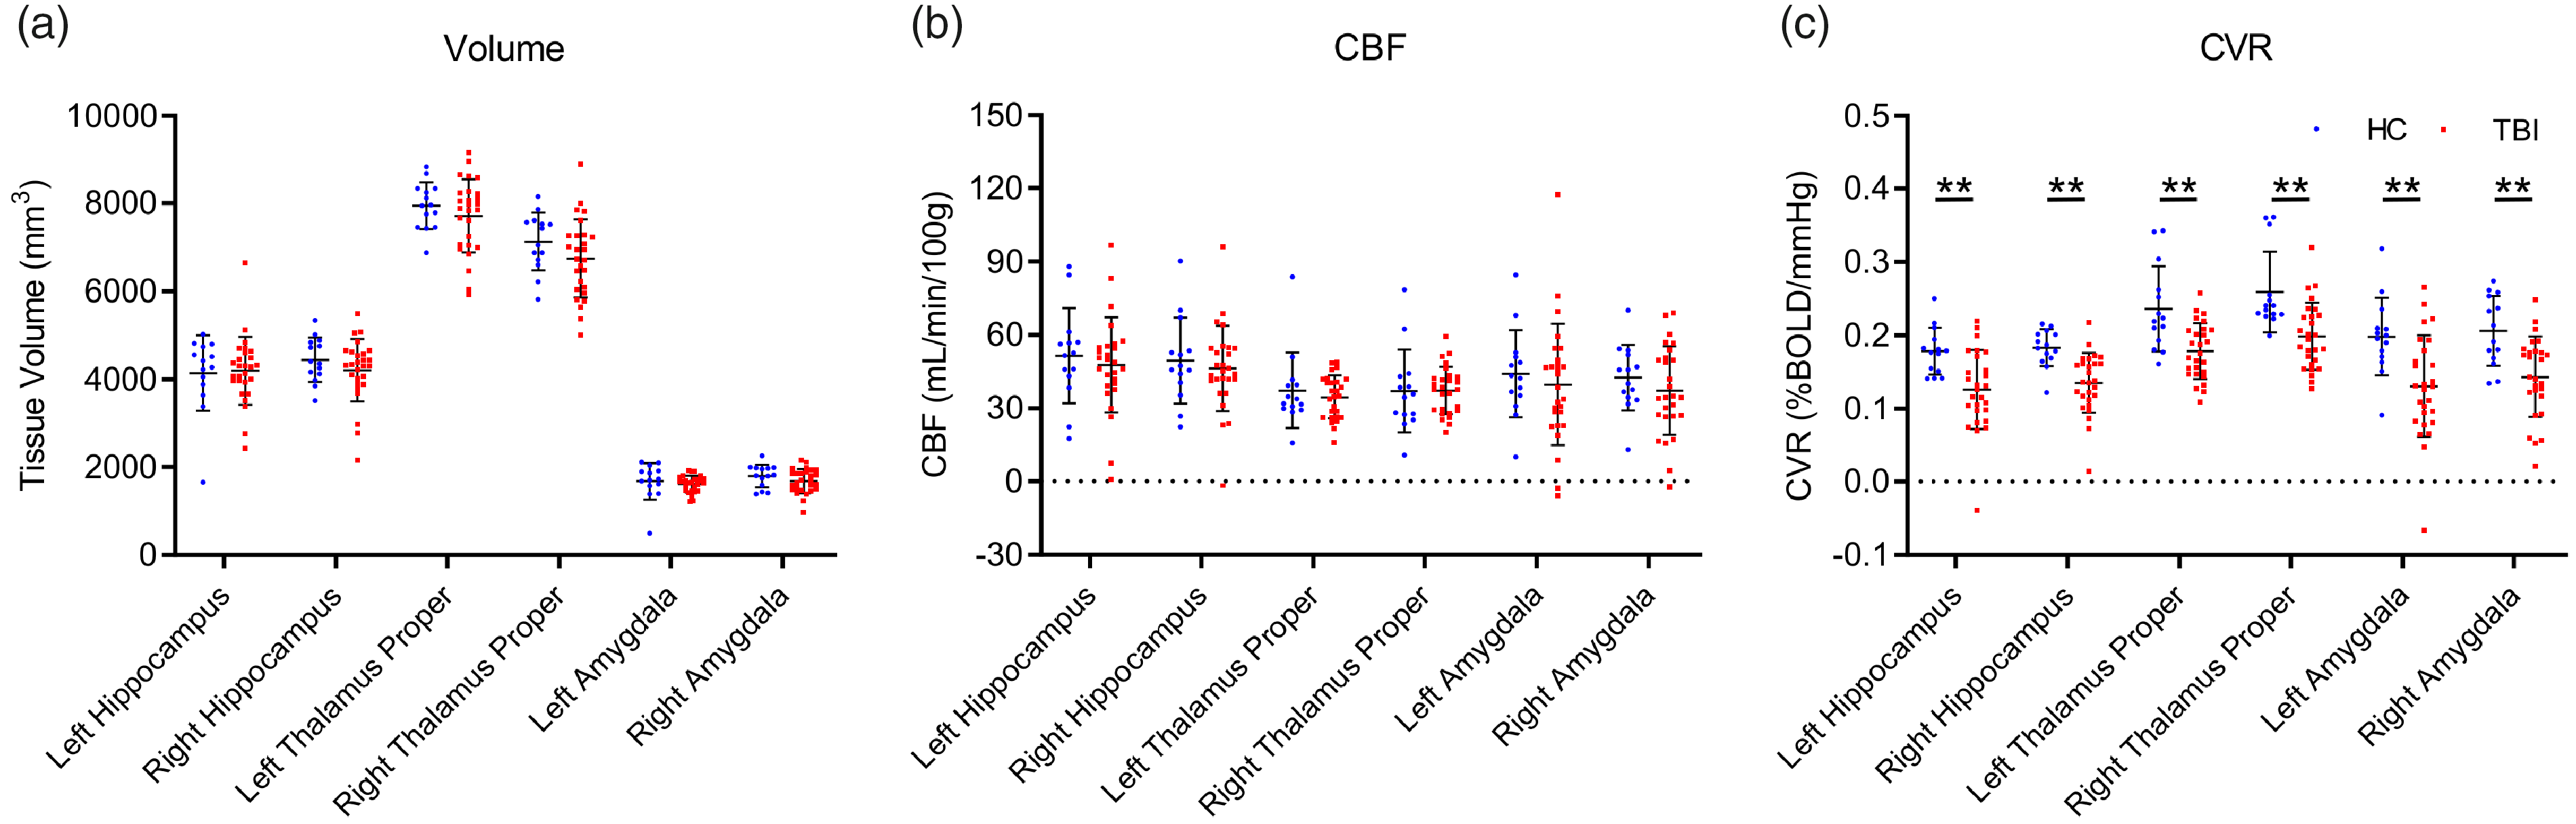
Subcortical volume and perfusion in chronic TBI and HC subjects. CVR is reduced in sub-cortical grey matter in chronic TBI. Subcortical regional-specific tissue analysis revealed no difference in sub structure volume or CBF values between chronic TBI patients and HC subjects (a and b, unpaired student t test, p > 0.05), however, there was a statistically significant decrease in CVR of TBI subjects, in comparison to HC controls, in all grey matter subregions analyzed (c, unpaired student t test, p < 0.01). No statistical significance between groups unless otherwise stated. Error bars represent ± SD. HC, n = 14; TBI, n = 27. **p < 0.01.
Cortical gyri thickness, CBF, and CVR
To determine if cerebrovascular changes were associated with alterations in cortical thickness, we assessed cortical gyri in the frontal and temporal lobes. There was no significant difference in gyri thickness in either the left or right hemisphere of the TBI versus HC groups (Figure 4(a) and (b), t test, P > 0.05). The CBF of cortical gyri of TBI subjects was not significantly different to that of HC participants in either hemisphere (Figure 4(c) and (d), t test, P > 0.05). In contrast, CVR was significantly decreased bilaterally in several temporal lobe gyri of the TBI group versus the HC group (Figure 4(e) and (f)). Specifically, the temporal gyri of the left hemisphere of the TBI group had significantly decreased CVR values of 28% and 22% in the inferior temporal and superior temporal regions, respectively, relative to the HC group (Figure 4(e)). Additionally, the CVR values of the inferior temporal, middle temporal, and superior temporal gyri of the right hemisphere of TBI patients were significantly decreased by 30%, 24%, and 22%, respectively, compared to those of HC subjects (Figure 4(f), t test, P < 0.05). These data suggest that CVR in the temporal lobe is particularly sensitive to TBI. We also looked at sex differences for cortical thickness, CBF, CVR, FA, MD. We did not find any differences in imaging variables by sex (Student’s t test, p > 0.2). However, our sample size (19 males, 8 females) was not large enough to exclude small sex-based differences.
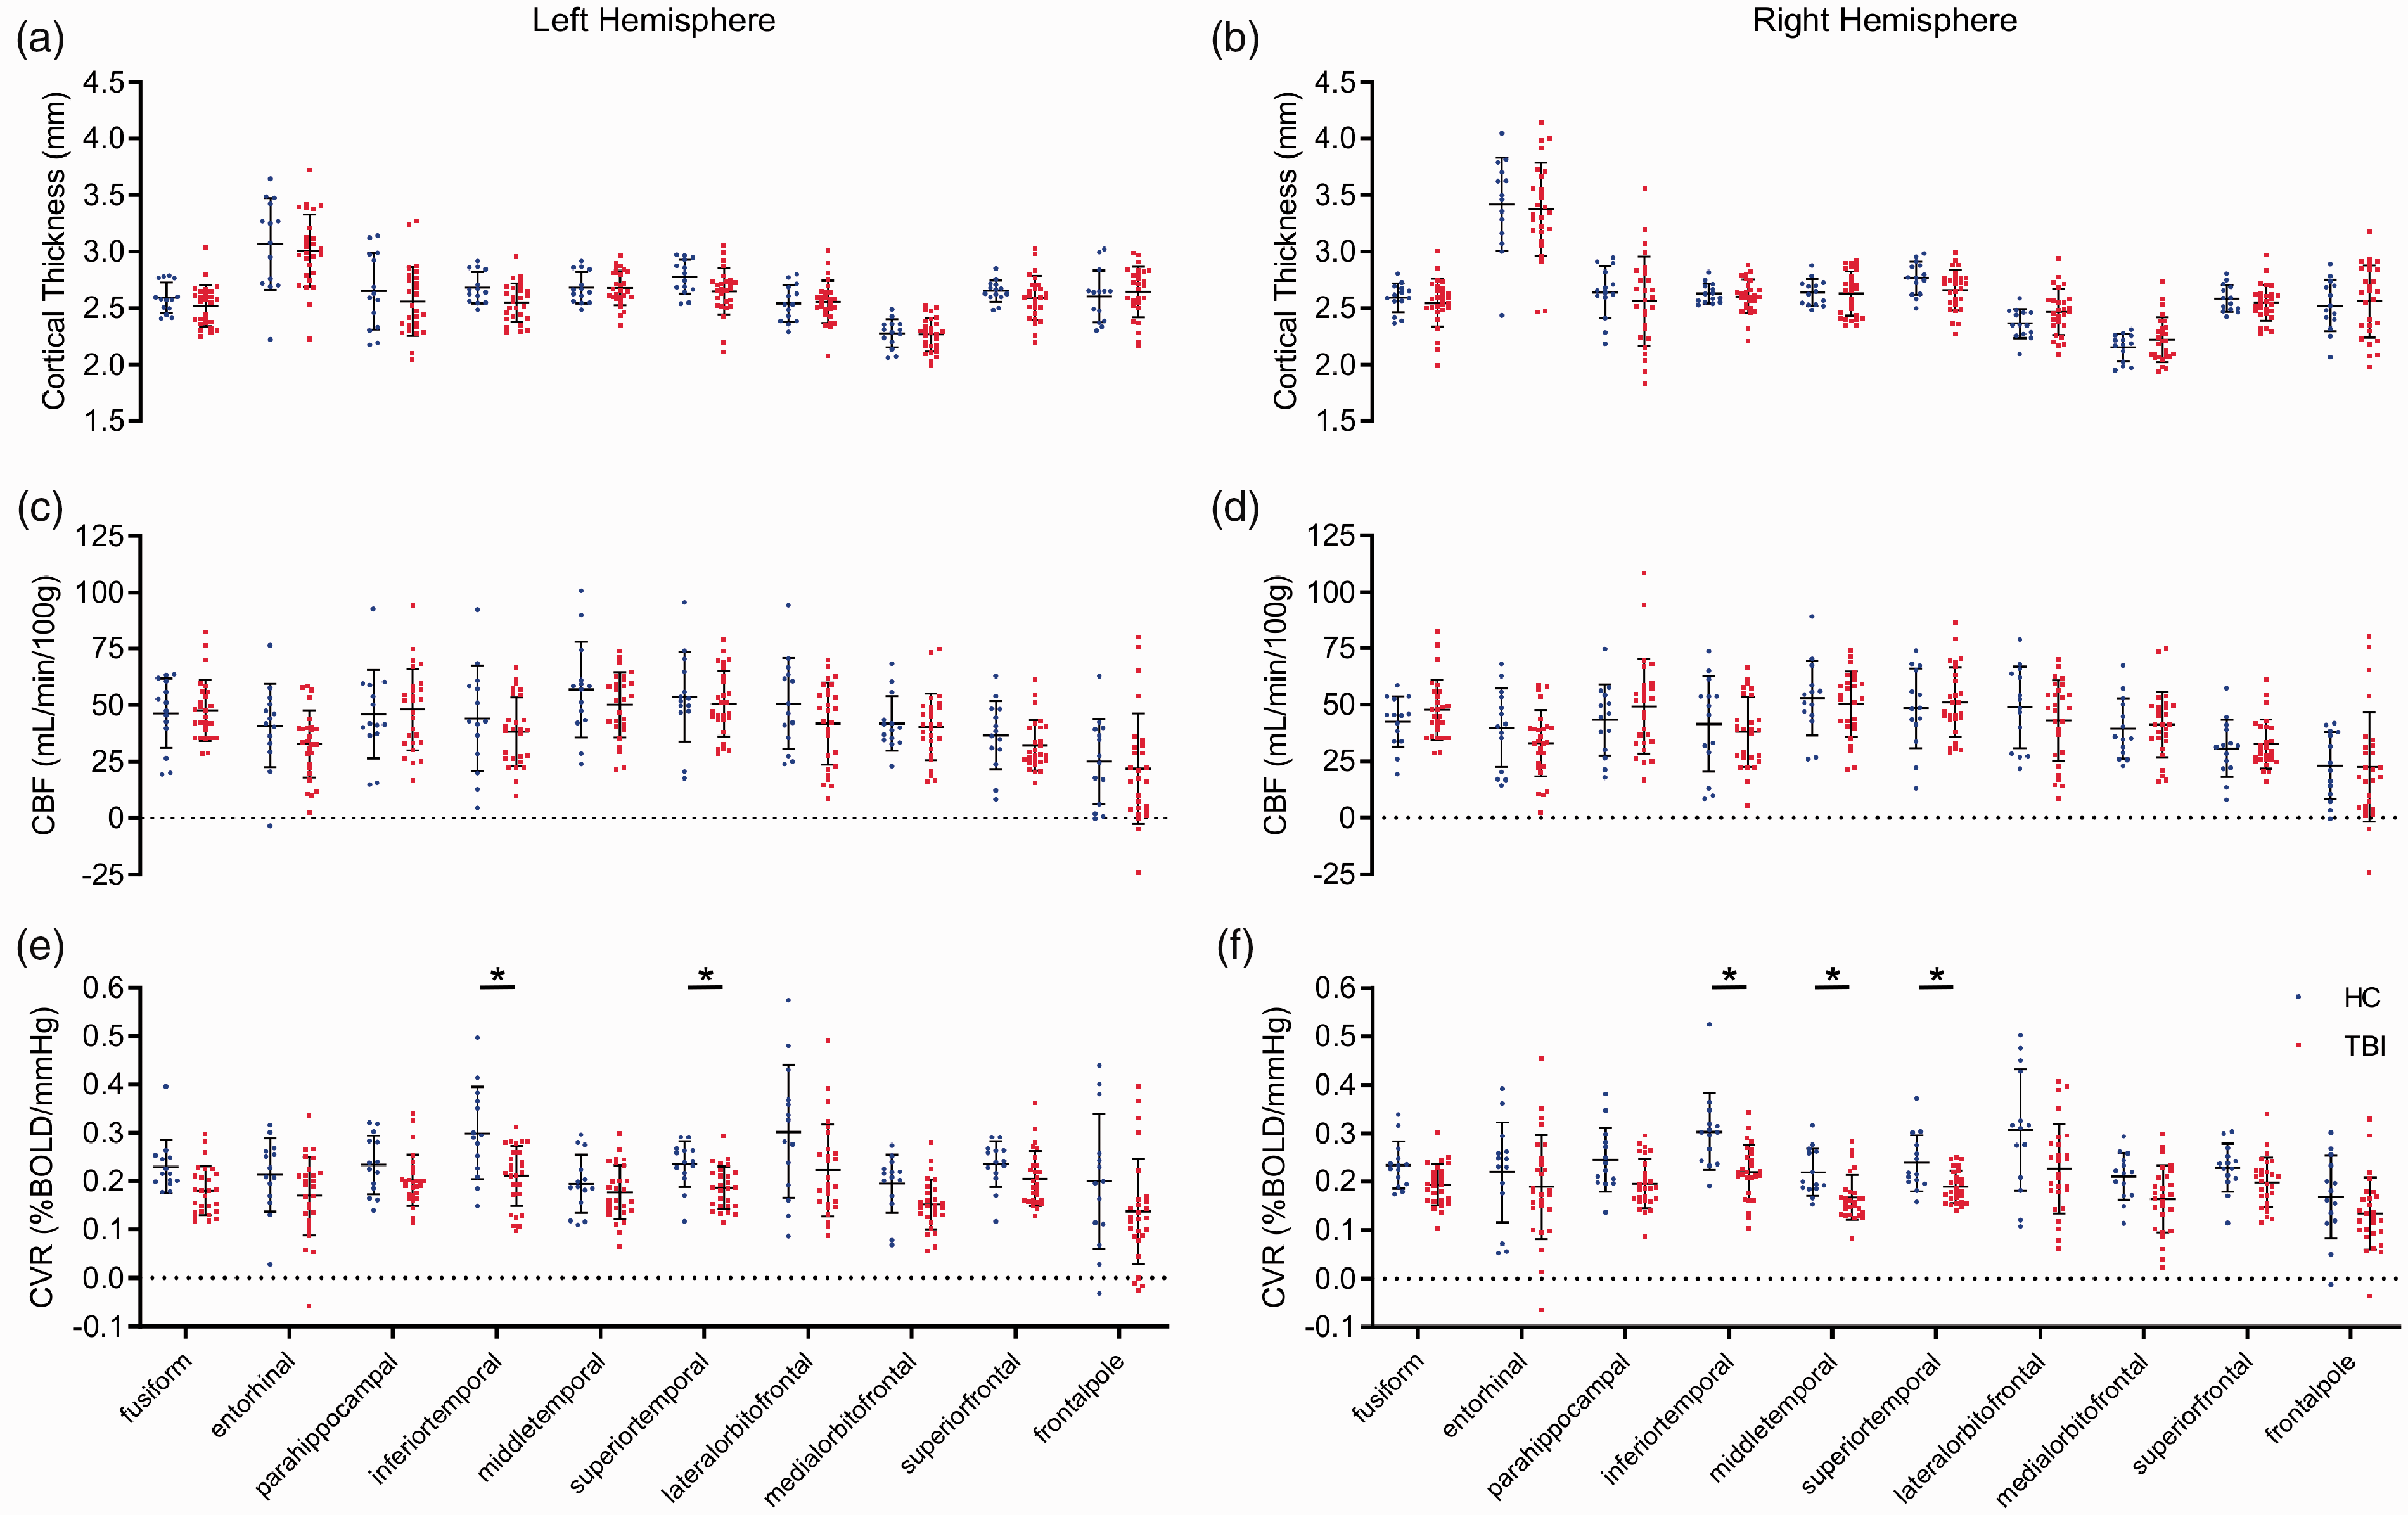
Cortical gyri perfusion and structure in chronic TBI. CVR is decreased in temporal grey matter of the brains of chronic TBI subjects. T1-weighted MRI analysis showed no statistically significant differences in thickness (a and b, t test, p > 0.05) or resting CBF (c and d, t test, p > 0.05) values of the cortical gyri of the multiple cortical sub-regions of either the left or right hemisphere between TBI patients and HC subjects. There was a statistically significant decrease in CVR values of the inferior- and superior-temporal cortical gyri of the left hemisphere of TBI patients, with respect to HC participants (e, unpaired t test, p < 0.05), and a decrease in CVR values of the inferior-, middle-, and superior-temporal cortical gyri of the right hemisphere of TBI patients, compared to that of HC subjects (f, unpaired student t test, p < 0.05). No statistical significance between groups unless otherwise stated. Error bars represent ± SD. HC, n = 14; TBI, n = 27. *p < 0.05.
Voxel directed analysis of functional and structural abnormality overlap in chronic TBI
Because TBI is heterogenous in pathology, severity, and spatial distribution, group statistical metrics, while useful for interrogating robust effects, are not helpful for detecting subtle, focal or multifocal neuropathology which is likely to be stochasic. A voxel-wise analysis was used to determine whether vascular abnormalities physically align with structural abnormalities in an individual subject. Cortical thickness maps generated by Freesurfer software were used to determine if abnormally thin areas of cortex were associated with an abnormal reduction in CVR or CBF. Abnormality was defined as a voxel z-score value below −2.5. The representative image depicts a single chronic TBI subject (Figure 5). Voxels with cortical thinning (Figure 5(a) to (d), blue) and decreased CVR (Figure 5(e) to (h), red) are depicted in the same volume of brain tissue. Regions of cortical thinning (white circle) do not consistently overlap or contain voxels with decreased CVR. Within individual TBI subjects, 0−8% of abnormal thickness voxels also show a CVR abnormality (median: 0%).
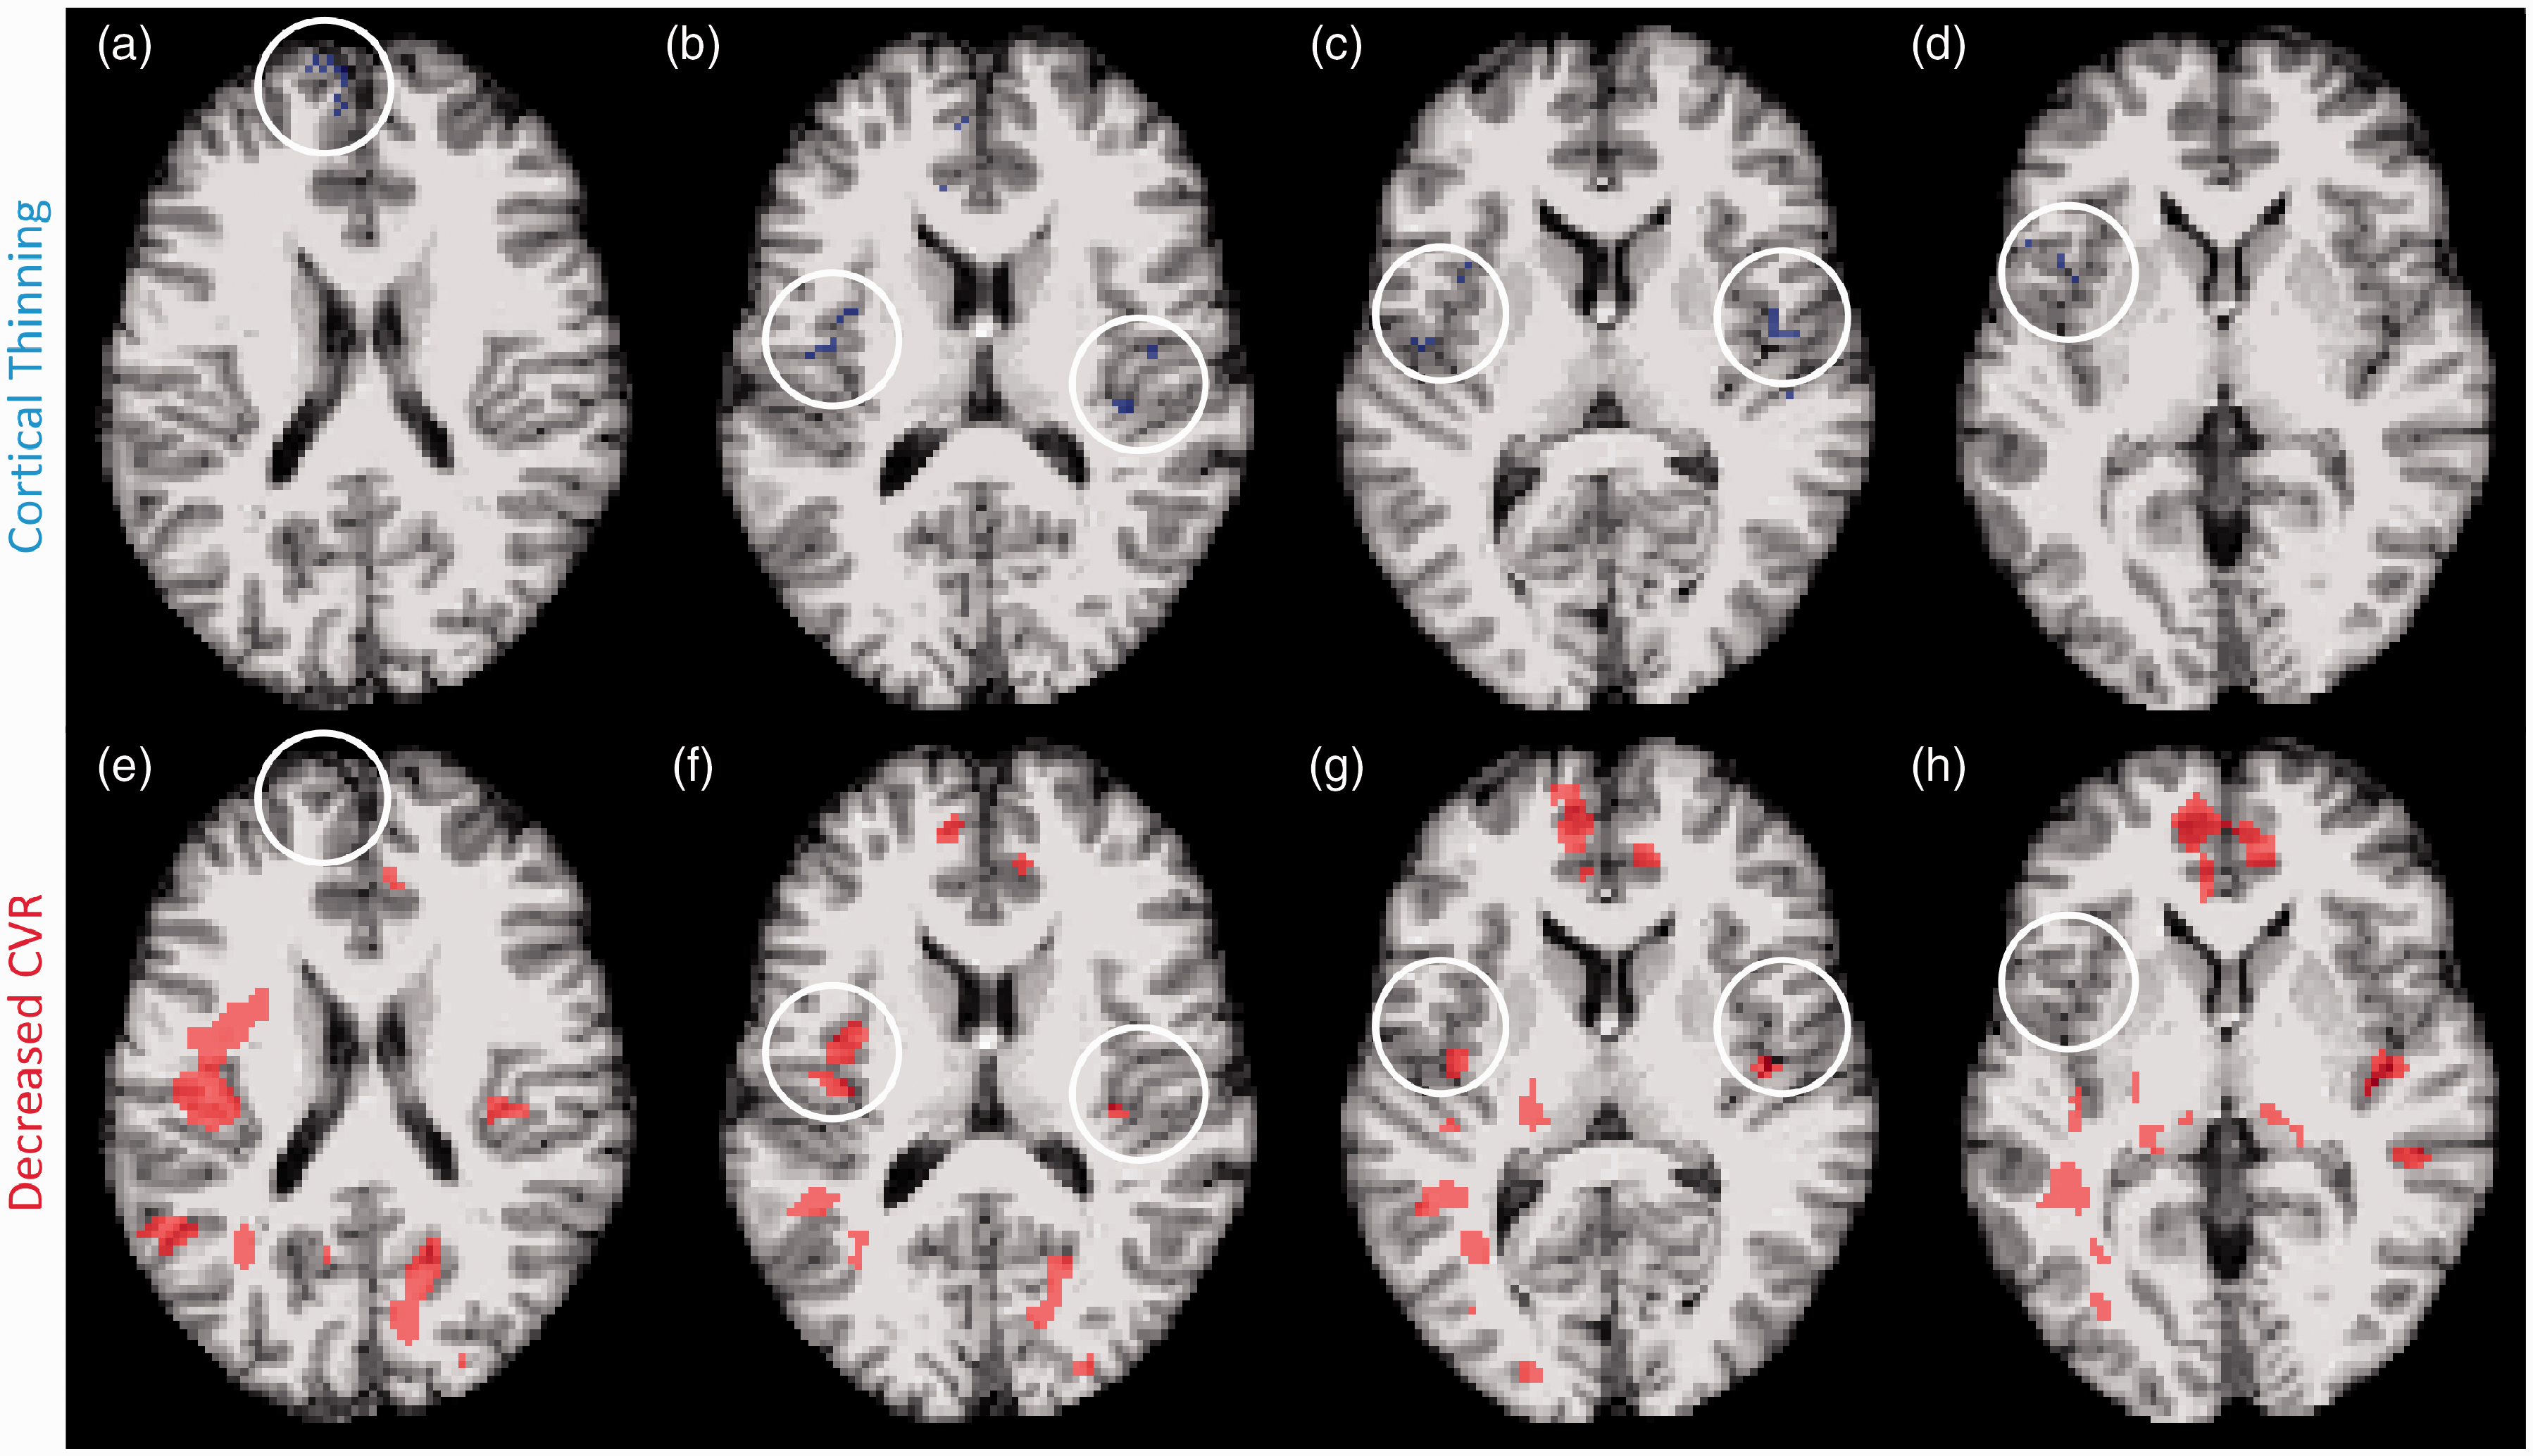
Subject-specific voxel by voxel analysis of cortical thinning and CVR deficit. Abnormal thickness voxels do not frequently co-localize with abnormal CVR voxels in the brains of chronic TBI subjects. Representative MRI images from a chronic TBI subject exhibiting cortical thinning and CVR impairment. T1-weighted and z-transformed voxels with a z-score < −2.5, defined as cortical thinning, are highlighted in blue (a–d), and MRI-BOLD acquired, z-transformed voxels with a z-score > 2.5, defined as abnormal CVR, are highlighted in red (e–h). Chronic TBI subjects had significantly more abnormal thickness and CVR voxels. Overlapping z-score maps showed occasional adjacent abnormal thickness and CVR voxels, however, few voxels demonstrated both abnormal thickness and CVR deficit.
Imaging abnormalities across multiple brain ROIs
DTI measures the movement of water to assess the microstructure of brain tissue. To determine which structural regions had MD and FA abnormalities, regional mean values of MD and FA were z-transformed using the HC group. A regional z-score value above 2.5 was considered abnormal for MD, while values below −2.5 were considered abnormal for FA. Regional values of CBF and CVR were also z-transformed and considered abnormal if below −2.5. The TBI subjects showed more abnormal regions for each of the imaging modalities investigated (Figure 6(a) to (d)). To determine whether microstructural abnormalities are associated with vascular abnormalities, the frequency of a region showing abnormalities for both a structural and vascular metric was calculated. Of the 96 regions examined, approximately 0.5% of the abnormal CVR regions also had an abnormal MD value. Of the regions showing CBF abnormalities, 0.04% also exhibited an MD abnormality. No overlap was shown for abnormal FA regions with abnormal vascular metrics.
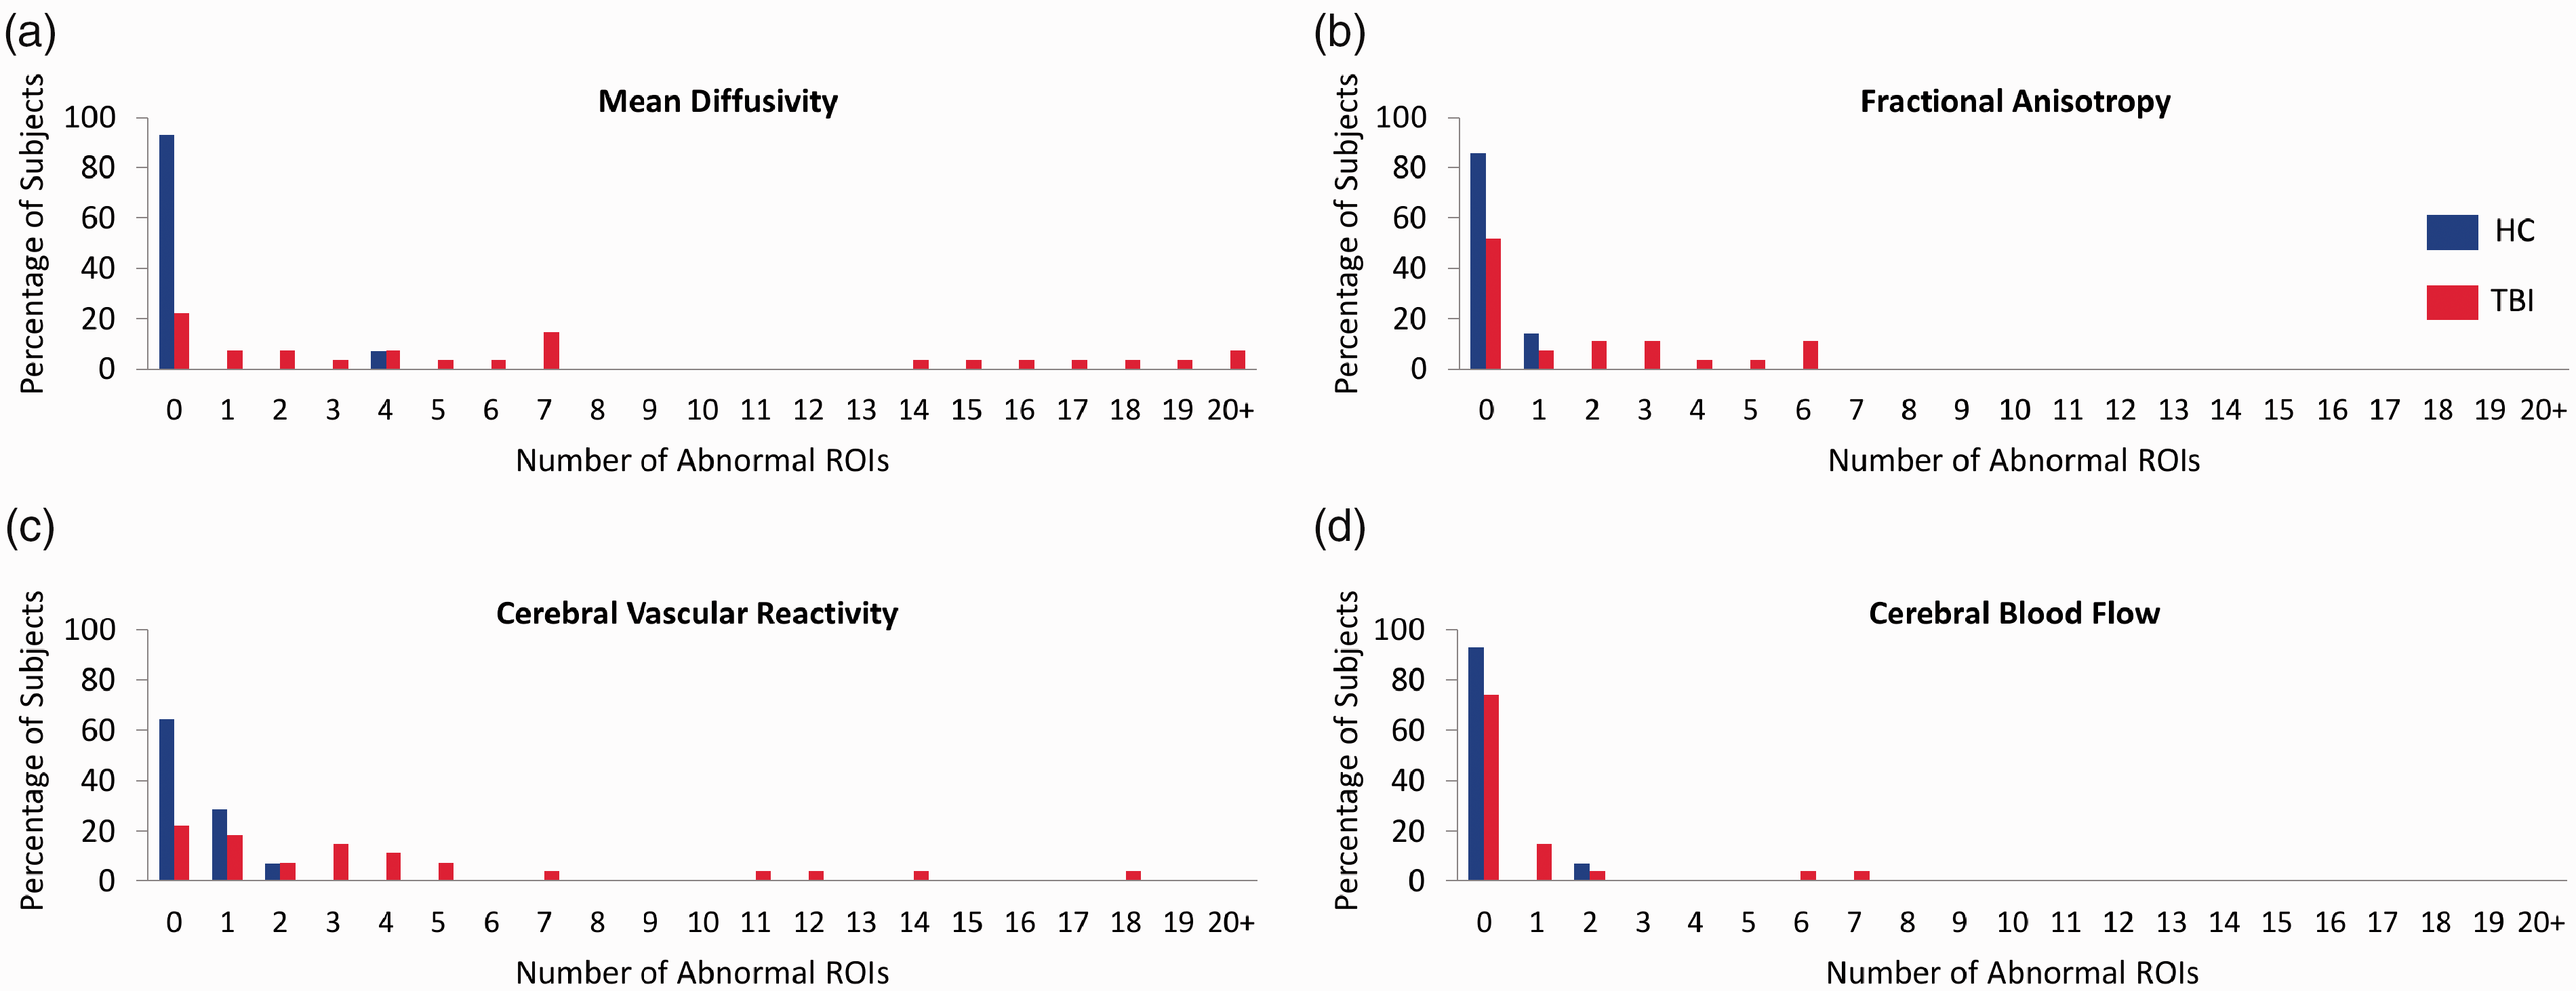
Comparison of the proportion of imaging abnormalities between TBI and HC subjects across multiple brain ROIs using separate modalities. Chronic TBI patients have more abnormal ROIs than HC subjects in all imaging modalities studied. Each brain was segmented into 96 ROIs and the mean MD, FA, CVR, and CBF in each ROI was measured. Mean values were converted to z-scores based on the pool of healthy controls. Number of abnormal ROIs with a MD > 2.5 z-score (a) or FA, CVR, and CBF < −2.5 z-score (b–d) were tallied. TBI subjects had more abnormal ROIs in both structural and vascular modalities. HC, n = 14; TBI, n = 27.
Abnormal voxel count and spatial distribution in TBI
Regional values can obfuscate subtle abnormalities by averaging across large areas. To determine if subtle abnormalities were occurring, a voxel-wise analysis for overlap of microstructural and vascular damage was performed. Abnormality of a voxel was defined as any voxel z score above 2.5 for MD and any voxel below −2.5 for FA, CBF, and CVR. Overall, the TBI subjects showed significantly higher readings for abnormal voxel volume and count in all imaging modalities (Figure 7(I) and (II)). The total number of abnormal MD voxels in TBI subjects was 3.75x greater than that of HC subjects (Figure 7(II, a), Mann-Whitney, P < 0.05). There was a 5.4x fold increase in abnormal FA voxel count, relative to HC (Figure 7(II, b), Mann-Whitney, P < 0.05). Furthermore, the average count of abnormal CBF and CVR voxels of TBI subjects was 3.9x, and 4.35x greater than the respective HC values (Figure 7(II, b and d), Mann Whitney, P < 0.05). TBI subjects have abnormal voxels for each imaging modality assessed, however, the microstructural and vascular abnormalities are not spatially concurrent.
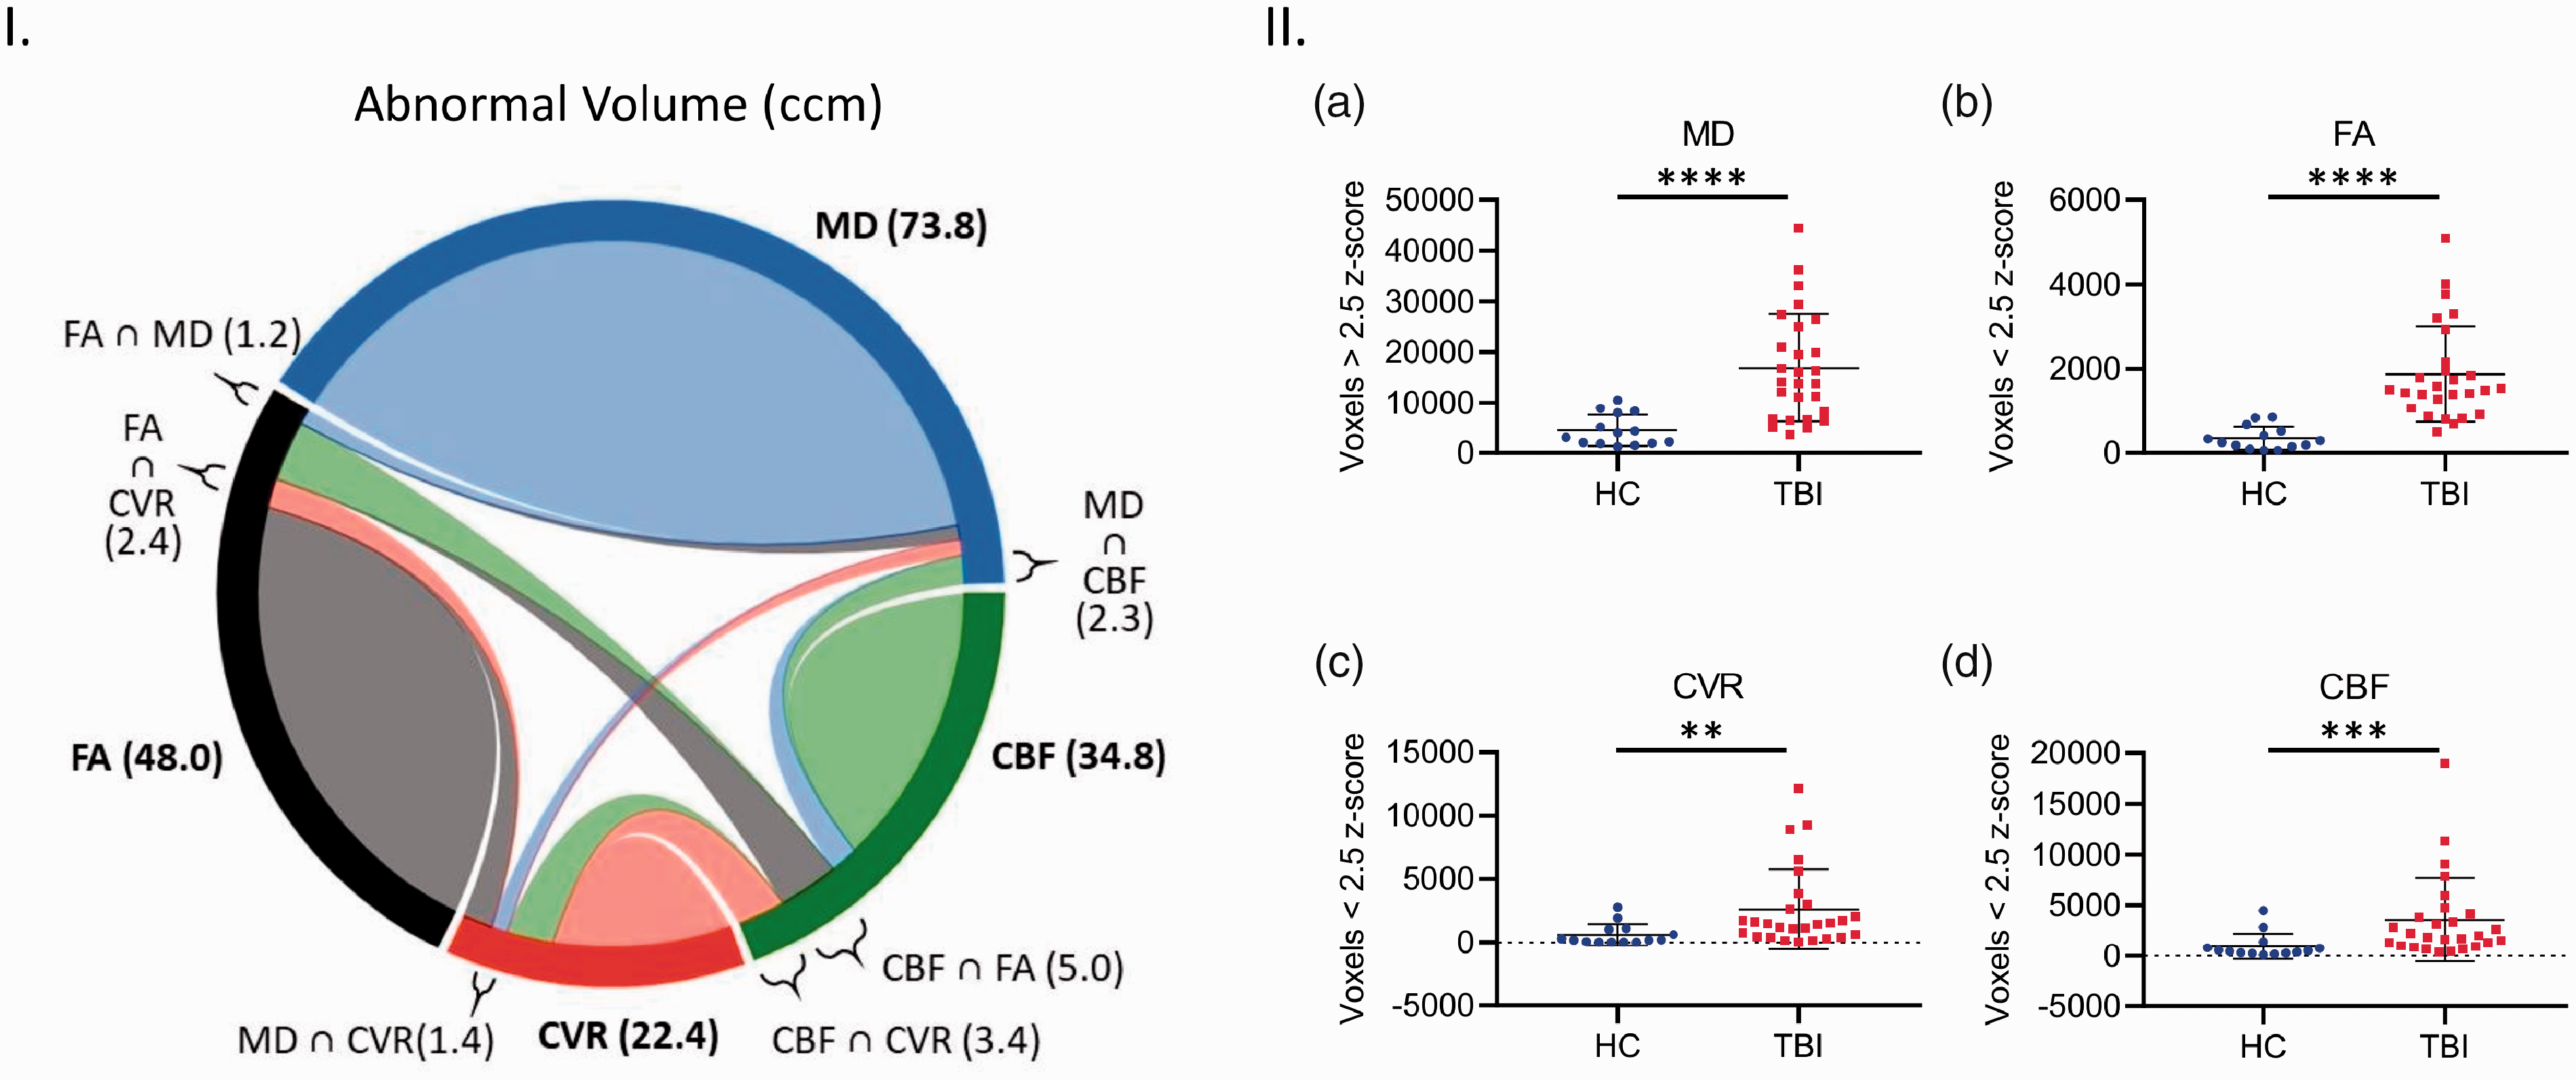
Analysis of abnormal cerebral structural and vascular voxel count and spatial co-localization in chronic TBI and HC subject brains. Abnormal cerebral structural voxels do not always co-localize with abnormal cerebrovascular voxels in chronic TBI (Left panel, I), and abnormal voxel counts are higher across all imaging modalities in TBI subjects, as compared with HC individuals (Right panel, II, a–d). Panel I Chord diagram of mean abnormal volume size in ccm in our chronic TBI group. On average, each imaging modality (MD, FA, CBF and CVR) shows several abnormal volumes with a voxel-based analysis. A small part of these quantities in one modality is shared (∩) with another modality. For example, a subject in our chronic TBI group has a total brain volume of 73.8ccm with abnormal MD measures; 1.2ccm of this volume (73.8ccm) also has an abnormal FA value (FA ∩ MD); 1.3ccm has an abnormal CVR value (CVR ∩ MD) and 2.3ccm has an abnormal CBF value (CBF ∩ MD). Panel II; There was a statistically significant increase in average abnormal voxel counts in the brains of TBI patients compared to healthy control subjects, across all modalities (II, a–d, Mann Whitney, p < 0.05; Error bars represent ± SD. HC, n = 14; TBI, n = 27. ****p < 0.0001, ***p < 0.001, **p < 0.01; ccm, cubic centimeter.
Discussion
This study investigates the spatial relationship between structural and vascular imaging abnormalities in a cohort of chronic moderate/severe TBI subjects. Both CBF and CVR were assessed in relation to volume, MD, and FA imaging modalities. The study revealed that vascular and parenchymal MRI abnormalities do not co-localize in chronic TBI. Neither structural nor microstructural metrics showed any spatial relationship with the vascular imaging abnormalities by either group or voxel-wise analyses. This study suggests that vascular and structural injury are spatially distinct in chronic TBI.
Brain volume was significantly associated with CBF, but not CVR, in both the healthy control group and the TBI subject cohort, indicating this relationship to be independent of brain trauma. Intracranial whole brain volume, as well as white and GM volumes analyzed individually, significantly correlated with mean whole brain, WM, and GM CBF, respectively. Interestingly, this correlation was not true for CVR, which showed a trend towards a correlation with WM volume, but this did not reach statistical significance. Da Costa et al 36 investigated CVR and volumetric values at 3 and 6 months after injury. They similarly found that whole brain and GM volume did not significantly correlate with CVR, however, in this more acute cohort, WM volume negatively correlated with CVR. 36 This relationship between CVR and WM volume has not been further characterized, and requires a more focused investigation which is beyond the scope of this study.
Numerous studies have investigated volumetric changes after TBI.36–41 As the current report’s analysis is cross-sectional and based on a single imaging time point, we did not have serial images to assess atrophy in individual participants. A recent cross-sectional analysis found a significant correlation between brain volume and CBF that was independent of TBI status. Hypoperfusion has previously been shown to correlate with smaller brain volumes in multiple neurological disorders. 42 For example, the SMART-MR study showed that symptomatic atherosclerotic patients with lower CBF had smaller GM volume. 43 While brain tissue volume correlates with perfusion rates, it does not appear to be a TBI specific phenomenon. Morphological changes by themselves, particularly brain atrophy, are known to occur over time after TBI. Most of those changes occur relatively early, within the first 6 months,38,40,41 but recent studies indicate that rates of atrophy are greater than expected for age many years after TBI.44,45 Our subjects were all in the chronic stage, at least 6 months but no more than 10 years after injury, although most were between 1 and 3 years after injury [median (IQR) was 23 (15 – 34) months]. Our sample size was not large enough to allow analysis of time from injury as a variable.
Recent studies have shown the subcortical grey matter to be highly sensitive to alterations following TBI in human patients.41,46 Group analyses revealed that chronic TBI subjects had a significant reduction in CVR in subcortical GM regions compared to HC. CBF and volumetric measurements were not significantly altered in those same regions. This not only suggests an association between parenchymal volume and resting state perfusion, but not vessel reactivity, in these regions, but also posits CVR in subcortical GM and temporal lobe gyri as particularly sensitive to TBI. Subcortical GM has been shown to be susceptible to injury after TBI. In a cohort of 66 patients with severe TBI, 72% of the subjects exhibited deep GM lesions on T2 imaging. 47 Presence of deep GM lesions was significantly associated with poor outcome. Animal models have shown that TBI alters multiple neurochemical and physiological mechanisms in the hippocampus. 48 In athletes with sports-related concussion, CVR was positively correlated with increased functional connectivity within the hippocampus. 49 This positive correlation between CVR and functional connectivity was not seen in athletes without concussion, and no differences were observed in resting mean CBF.
In this study, the CVR of chronic TBI patients was significantly decreased in multiple temporal lobe gyri bilaterally when compared to the healthy controls. Cortical thickness and CBF were not significantly altered in the same areas with CVR abnormalities. A study of chronic sports-related TBI has shown clusters of decreased cortical thickness in the middle temporal lobe gyrus and entorhinal cortex compared to age-matched controls. 39 Our study did not show a significant decrease in cortical thickness in temporal lobe regions, which may be the result of averaging over the entire region versus identifying small but significant clusters. The study of chronic sports-related concussion showed a relationship between total numbers of recurrent TBIs and decreased cortical thickness within those regions, 39 indicating that the temporal lobes are prone to TBI-related injury. This study suggests that there are also abnormalities in CVR within temporal lobe gyri after TBI. The fact that CVR was significantly decreased when averaged over an entire ROI suggests that CVR is particularly sensitive to TBI-related injury.
We used a voxel-wise analysis to assess any subject-specific relationship between CVR and cortical thickness. There was very little overlap between abnormal CVR voxels and abnormal cortical thickness voxels for any individual (0–8%.) Abnormal CVR voxels were located within the cortical sulci as well as occasionally in WM. Voxels with abnormal cortical thickness occurred in both sulci and gyri. Interestingly, tau pathology within cortical sulci has been identified as a pathognomonic feature of chronic traumatic encephalopathy.50,51 The relationship between CVR and tau pathology has yet to be investigated.
To further examine the relationship between structural and vascular injury, we assessed whether vascular physiological metrics, CVR and CBF, showed abnormalities within the same regions as the DTI anatomical metrics, MD and FA. While there were more abnormal regions in all imaging modalities for the chronic TBI subjects, there was very little overlap between abnormal regions or abnormal voxels. Johnson et al 3 have investigated histopathologically the degree of spatial coincidence of aberrant blood brain barrier (BBB) permeability, a proxy of cerebrovascular integrity, and APP proteinopathy, a hallmark of axonal injury, in a porcine concussion model at an acute time point post-injury. As with our current study, wherein detriments in the functional integrity of the cerebrovasculature are spatially distinct from structural abnormalities, Johnson and colleagues 3 found limited regional overlap (60%) between fibrinogen extravasation and presence of APP at 48 and 72 hours after injury. A recent neuropathological analysis of human tissue from chronic TBI subjects revealed widespread BBB leakage, a phenomenon not typically evident on conventional in vivo imaging, and directly demonstrative of chronic vascular pathology. 52 Furthermore, a recent report by Andreasen et al 53 has shown a limited correlation between microbleeds, as assessed by SWI, and white matter microstructure, interrogated via DTI, in patients during the sub-acute phase following severe TBI, with an association between microvascular leakage and loss of axonal integrity in only the mid-sagittal region, and not the frontotemporal or parieto-occipital lobes. 53 While our study did not specifically assess BBB integrity, this chronic TBI cohort did show evidence of persistent vascular dysfunction. These data suggesting that vascular and structural damage resulting from TBI are distinct endophenotypes that can be detected using multimodal MRI.
As with most human TBI studies, the mode and history of trauma endured by the patients herein was heterogenous across subjects, and so, it is not feasible to define any correlation between specific directional force or magnitude of trauma and consequent spatial pattern of DVI and DAI abnormality. It is, however, interesting that, regardless of this heterogeneity of injury, previously published work on this cohort shows a majority (15 of the 27 cases) displayed multi-focal parenchymal lesions. 25 Furthermore, both the cerebral vasculature of patients displaying multi-focal encephalomalacia, and that of those without detectable parenchymal lesion exhibited perturbed CVR, indicating that gross tissue damage may not be necessary for the diffuse voxel-wise functional vascular detriments reported, but also implicating the vascular endophenotype as a more sensitive metric across the spectrum of TBI severity. 25
It is well established that rotational acceleration trauma during unrestricted head movement is the principal mechanism responsible for DAI in both murine4,54 and swine55,56 models of TBI, with inertial loading of the brain tissue imparting shear, tensile, and compressive strains throughout the vasculature and white matter tracts. 2 The varying size, spatial distribution, and susceptibility to injury of the cerebral vasculature and axonal tracts could account for some proportion of the spatial disparity between the aberrant radiographic signature for each in the current report. For example, the highly anisotropic arrangement of white matter tracts may lead to a higher and more uniform dispersion of primary and secondary axotomy, and by default, number of abnormal FA and MD voxels than were these to be oriented less homogenously, such as is the case for the reticular network of arteries, arterioles, and capillaries. Indeed, human case studies of non-penetrant, lethal blunt force trauma show vertebral and carotid artery rupture, 57 laceration, 58 and dissection 59 post-mortem, and transmission electron microscopy of resected carotid artery segments at four weeks following non-lethal craniocerebral trauma shows endothelial and smooth muscle cell apoptotic, pro-apoptotic, and regenerative markers, 60 demonstrating a sensitivity of larger cerebral vessels to gross primary injury, and perhaps a latent reparative proclivity of traumatized cerebrovasculature. Previous data from this cohort25,61 and that of a separate group of sub-acute to chronic TBI patients 62 has shown CVR impairment to occur in absence of cerebrovascular anatomical differences or resting CBF,25,61,62 indicating preserved cerebral vessel density and perfusion in these subjects chronically following trauma, suggesting the microvascular apoptotic processes reported in the acute stages post injury21,60 may not fully translate to partial atrophy of the vascular unit. Indeed, a single oral dose of 25 mg Sildenafil was found to restore CVR to near-control levels in the patients in the current report, 35 further implying the cerebral endothelium of these subjects may be functionally impaired, but not physically absent, a hypothesis supported by several clinical and preclinical studies.17,26,63,64 In contrast to this preserved physicality of the cerebrovasculature, presumed white matter atrophy on DTI in chronic TBI patients41,65 is identified by post mortem studies66,67 to represent some degree of loss of integrity of the axons themselves, indicating an exaggerated susceptibility of white matter stability to injury, compared to that of the cerebral vasculature. Altogether, these data support a rationale for a more diffuse distribution of abnormal CBF and CVR voxels, and consequent limited co-occurrence with axonal MD and FA voxels, as reported here.
It is difficult to delineate the extent to which any non-cell autonomous effects of those comprising the vascular unit are incurring on white matter tracts, and vice versa, in chronic TBI, however, it would not be unreasonable to assume a persistent dysregulated vasogenic tone manifested by alter cerebral vasoreactivity may lead to progressive synaptic, neuronal, and axonal disruption over time. Physiologically, micro-vasculopathy, such as that resulting from TCVI, can over time directly manifest as bilateral leukoaraiosis in cerebral autosomal dominant arteriopathy with subcortical infarcts and leukoencephalopathy (CADASIL), the most common form of inherited stroke. 68 Indeed, reduced CBF in the cingulate cortex of veterans with a history of TBIs has been shown to correlate with decreased white matter integrity in those subjects furthest removed from their injury, 69 indicating that, much as with the leukoariosis seen in CADASIL,70,71 TCVI in chronic head trauma may further attenuate white matter integrity beyond the effects of the primary mechanical injury, in both the aforementioned veterans, 69 and perhaps the patients in the current report.
This study has several limitations. The TBI subjects in this study were assessed at a single time point, making assessments about atrophy and progression of the abnormalities assessed impossible. While several groups, including our own, 38 have measured subtle brain atrophy after TBI, these studies have used within-subject longitudinal design. The relationship between vascular and structural damage may be more similar acutely and diverge only as secondary injury mechanisms develop. Additionally, the subjects in this study had moderate or severe TBI by DoD criteria. 72 The relationship between vascular and structural damage may be different in mild TBI. Despite its enhanced resolution compared to CT, MRI still has significant limitations compared to direct visualization. Highly focal damage to axons or blood vessels cannot be detected due to partial volume averaging over the entire voxel. Ergo, an MRI analysis of tissue damage detects the most robust effects only. Accompanying an MRI study with neuropathology or immunohistochemistry would reveal more precise details about the extent of damage. DTI has traditionally been thought to be more sensitive in WM regions. Segmenting WM more finely may have revealed more overlap between vascular metrics and DTI metrics in WM ROI. However, since the voxel-wise analysis agrees with the ROI analysis, we are more confident in our primary study findings regarding limited colocalization of vascular and microstructural abnormalities.
Conclusion
Significant differences between healthy control and chronic TBI subjects were detectable when comparing global CVR, but not by using global resting state CBF. There was no evidence of co-localization between volumetric data and CVR as shown by both voxel-by-voxel comparison of CVR and thickness maps and regional correlations among TBI patients. ROI and voxel-wise comparisons of microstructural DTI metrics, MD and FA, did not co-localize with abnormalities obtained by vascular physiological metrics, CVR and CBF. These findings suggest that CVR is a sensitive biomarker for vascular dysfunction induced by TBI, and that TBI related vascular injury does not spatially correspond with axonal disruption seen in these chronic TBI patients. These findings further support the assertion that vascular and axonal injury represent distinct underlying endophenotypes of injury in moderate and severe TBI. Future studies will investigate both components to better understand the relationship and time course between vascular and brain parenchymal integrity as well as how these individual components affect TBI outcomes.
Footnotes
Authors’ note
Kelley Flesher is now affiliated with Department of Neurology, Madigan Army Medical Center, Tacoma, WA, USA. Sarah Woodson is now affiliated with Department of Neurology, Naval Hospital-Portsmouth, Portsmouth, VA, USA.
Funding
The author(s) disclosed receipt of the following financial support for the research, authorship, and/or publication of this article: Work in the authors’ laboratory was supported by the Center for Neuroscience and Regenerative Medicine (CNRM), Uniformed Services University of the Health Sciences (USUHS), Bethesda, MD, by the Military Clinical Neuroscience Center of Excellence (MCNCoE), Department of Neurology, USUHS, and by the Intramural Research Program of the National Institutes of Health. This work was also funded by NINDS U01 NS086090, DoD W81XWH-14-2-0176 and W81XWH-19-2-0002.
Declaration of conflicting interests
The author(s) declared no potential conflicts of interest with respect to the research, authorship, and/or publication of this article: The views expressed in this manuscript are those of the authors and do not reflect the official policy of the Department of Army/Navy/Air Force, Department of Defense, or U.S. Government.
Authors’ contributions
CL, DS, KW, CM, ES, YC, and DP contributed to the revision of the manuscript and approved its submission for publication. KF and SW contributed to data analysis. MH, FA, KK, and RDA conceived and designed the study, analyzed and interpreted the data, and prepared the manuscript.