
Abstract
Consistent cerebral blood flow (CBF) is fundamental to brain function. Cerebral autoregulation ensures CBF stability. Chronic hypertension can lead to disrupted cerebral autoregulation in older people, potentially leading to blood pressure levels interfering with CBF. This study tested whether low BP and AHD use are associated with contemporaneous low CBF, and whether longitudinal change in BP is associated with change in CBF, using arterial spin labelling (ASL) MRI, in a prospective longitudinal cohort of 186 community-dwelling older individuals with hypertension (77 ± 3 years, 53% female), 125 (67%) of whom with 3-year follow-up. Diastolic blood pressure, systolic blood pressure, mean arterial pressure, and pulse pressure were assessed as blood pressure parameters. As additional cerebrovascular marker, we evaluated the ASL signal spatial coefficient of variation (ASL SCoV), a measure of ASL signal heterogeneity that may reflect cerebrovascular health. We found no associations between any of the blood pressure measures and concurrent CBF nor between changes in blood pressure measures and CBF over three-year follow-up. Antihypertensive use was associated with lower grey matter CBF (−5.49 ml/100 g/min, 95%CI = −10.7|−0.27, p = 0.04) and higher ASL SCoV (0.32 SD, 95%CI = 0.12|0.52, p = 0.002). These results warrant future research on the potential relations between antihypertensive use and cerebral perfusion.
Introduction
High blood pressure (BP) in midlife is associated with an increased risk of late life dementia, but this relationship is less clear in old-age. 1 Longitudinal studies suggest that with aging, a J-shaped curve develops, with both high and low BP being associated with an increased risk of dementia, especially in individuals with a history of hypertension and other cardiovascular risk factors. 1 , 2 This could be due to alterations in cerebral blood flow (CBF) that occur with aging and vascular disease. 3
Consistent CBF is fundamental to cerebral function. 4 Stability of CBF is ensured by cerebrovascular autoregulation, which adapts cerebral arteriolar resistance to adjust to fluctuations in BP. 4 Aging and chronic hypertension can cause arteriolar damage and vascular remodelling, disrupting the cerebral autoregulatory capacity.5–7 Inability of cerebral vessels to adapt to BP changes may cause CBF to change with changing BP, causing vulnerability to hypoperfusion when systemic BP is reduced. 3 , 7 These mild reductions in CBF may cause cerebral damage and inhibit neuronal function, leading to cognitive decline. 5 , 7 Cerebral hypotension in older individuals predicts cognitive deterioration, particularly in individuals with a history of hypertension. 8 , 9 This suggests that low BP and antihypertensive drugs (AHD) in older individuals with a history of hypertension may induce hypoperfusion, potentially causing cognitive decline.
This study tested whether low BP and AHD use are associated with contemporaneous low CBF, and whether longitudinal change in BP is associated with change in CBF, in community-dwelling older individuals at increased risk of disrupted cerebral autoregulation due to a history of hypertension.
Materials and methods
Participants
Data were derived from the Prevention of Dementia by Intensive Vascular Care (preDIVA) trial MRI sub study, described previously. 10 , 11 In brief, preDIVA tested the effect of 6–8 years of nurse-led cardiovascular risk management on dementia incidence in community-dwelling older people, aged 70–78 years at baseline. 10 Trial recruitment was from June 2006 until March 2009. The MRI sub study evaluated the intervention’s effect on the progression of cerebral small vessel disease over three years in a subset of preDIVA participants, and was also described previously. 11 Briefly, a consecutive subset of approximately 200 participants with elevated systolic BP (≥140 mmHg), equally distributed across trial treatments arms, were invited to participate during their two-year follow-up measurement. Individuals with elevated blood pressure were selected to increase the risk of small vessel disease. Exclusion criteria were contra-indications for MRI, dementia, and medical conditions likely to impede three-year follow-up (e.g. terminal illness) at the time of the first MRI scan. Overall, there was no effect of the intervention on the primary outcome of incident dementia nor on change in MRI anomalies. 10 , 11 Therefore, in the current study, we studied the sample as one single cohort, i.e. irrespective of treatment arm.
Clinical assessment
Clinical parameters were assessed at preDIVA baseline and every two years thereafter until the final assessment. Demographics, anthropometrics, cardiovascular and family history, medication use, and self-reported diet and smoking habits were collected and cross-checked with participants’ electronic health records. Cognitive function was assessed using the Mini-Mental State Examination (MMSE). 12 Visit BP was operationalized as the mean of two measurements taken using an automated BP monitor (M6 OMRON Healthcare, Kyoto, Japan) in sitting position, according to a standard protocol. 10 MRI scan 1 took place after the preDIVA two-year assessment (17 June 2011 to 20 July 2011), scan 2 around the time of final preDIVA assessment (28 May 2014 to 29 May 2015). Clinical data for the analyses were taken from the two-year assessment for scan 1 and data from the final assessment for scan 2.
Blood pressure parameters
Under the mechanism investigated in this paper, different blood pressure parameters may correlate with changes in cerebral perfusion in slightly different ways. 7 , 13 , 14 Systolic BP (SBP) may be insufficient to overcome the increased cerebral microvascular resistance and thereby lead to low SBP correlating with low CBF. Low diastolic BP (DBP) could lead to minimum pressure values dropping below thresholds needed for successful cerebral autoregulation, and thereby correlate with low CBF. Mean arterial pressure (MAP), defined as (2×DPB+SBP)/3, being a combined measure of SBP and DBP may give the best reflection of overall perfusion pressure and thereby correlate best with CBF. Finally, pulse pressure, defined as the difference between SBP and DBP, is a BP measure strongly related to atherosclerosis, and therefore may best correlate with the hypothesized relation between BP and hypoperfusion. In the interest of being comprehensive and to ensure our results were not influenced by the choice of BP parameter, we performed analyses with SBP, DBP, MAP and PP.
MRI acquisition
Baseline imaging was performed on a 3 Tesla Intera (Philips Healthcare, Best, the Netherlands) MRI scanner with a SENSE 8-channel head coil. 3D T1-weighted and a 3D FLAIR sequences were collected. Pseudocontinuous arterial spin labeling (ASL) sequences with a 2D EPI readout were acquired without and with flow crushing gradients: TR/TE = 4000/17 ms, labeling duration = 1650 ms, post-labeling delay first/last slice = 1525/2080 ms, FOV = 240 × 240 mm, resolution = 3.75 × 3.75 × 7 mm, 17 slices with 7 mm thickness, velocity cut-off of flow-crushing gradients in 3 directions 50 mm/s. 15 , 16 Due to hardware replacement, follow-up imaging used a 3 Tesla Philips Ingenia scanner with a SENSE-16-channel head coil, using the same protocol. pCASL sequence parameters were maintained throughout the study to ensure continuity in the ongoing study. To evaluate comparability between scan results, a purposive sample of nine participants with a broad range of WMH severity were scanned on both scanners before and after hardware replacement, with a median interval of 6.0 months (IQR = 5.6–6.9). Scanning parameters were identical. WMH volumes obtained using automatic segmentation showed excellent agreement between scanners (two-way mixed intraclass correlation coefficient 0.99, p < 0.001). 11
Assessment of CBF and brain volumes
ExploreASL 17 and SPM12 18 were used to process structural and ASL images, as reported previously. 17 ASL processing included 3D motion correction, motion outlier detection, and rigid-body registration of CBF to the 3D T1 grey matter probability map. 17 The grey matter (GM) masks were defined as pGM > 0.7, where pGM are the GM segmentations from the T1w, smoothed to the estimated resolution of the ASL image. CBF was quantified from crushed ASL images using a single compartment model, 16 , 17 for the supratentorial grey and white matter only, masking the cerebellum using the registered T1 probability map.
As a cross-sectional proxy of atrophy, brain parenchymal fraction (BPF) was calculated as GM plus WM volume divided by intracranial volume (the sum of CSF, GM and WM volumes). As an alternative cerebrovascular marker, we included the ASL signal spatial coefficient of variation (ASL-SCoV) derived which is related to the arterial transit time of blood from the cervical arteries to the cerebral microvasculature. 15 SCoV was calculated from the non-crushed CBF images as the standard deviation divided by the mean CBF in the voxels within the GM mask. 15 SCoV was not normally distributed and log transformed in line with previous analyses. 15 WMH were segmented from FLAIR scans as described previously. 11
Statistics
Baseline characteristics between participants with and without follow-up were compared using Student’s t-tests, Mann–Whitney U tests and Fisher’s exact tests. All analyses of contemporaneous associations were performed combining data from baseline and follow-up scans using linear mixed models, adjusting for scan number (1 or 2) and including a random intercept for each participant to account for multiple measurements within individuals. Longitudinal correlations between changes in BP and CBF were assessed using linear regression adjusted for baseline values of both, and time between scans.
To assess the relationship between the blood pressure parameters/AHD use (predictors) and contemporaneous CBF (outcome), we used separate models for each predictor. Model 1 adjusted for scan number and included a random intercept per participant. Model 2 additionally adjusted for sex, age, AHD use, diabetes mellitus, history of stroke, history of cardiovascular disease (CVD), WMH volume, and BPF. Models with AHD as predictor adjusted for diastolic BP (DBP) and systolic BP (SBP) instead of AHD use. Individuals with missing data were left out per model (pairwise). We included WMH volume as potential confounder in model 2 because higher WMH volume has been associated with both elevated blood pressure and lower CBF, particularly in the white matter.19–21
We assessed the correlation between annual change in CBF and annual change in blood pressure metrics using linear regression with CBF predicted by the BP metric, adjusted for baseline values of both (Model 1). Model 2 additionally adjusted for age, sex, time between scans, change in AHD use (never/stopped/continued/started), incident diabetes, incident stroke, incident CVD, change in WMH volume, and change in BPF. An analogous model was used for AHD, with change in AHD use as predictor and CBF change as outcome adjusted for baseline CBF, with model 2 adjusting for DBP and SBP instead of change in AHD use. Post hoc, based on previous preDIVA trial findings indicating that calcium channel blockers (CCB) and angiotensin receptor blockers (ARB) were specifically associated with lower dementia risk while other AHD were not, 22 we compared the relations between individual antihypertensive classes with CBF and SCoV, adjusted for each other antihypertensive class and total number of AHD classes. Furthermore, we assessed the dose–response relationship between the number of AHD classes used concurrently, and CBF and SCoV.
Interactions between AHD use and BP measures in their relation to the evaluated MRI measures were also assessed. For regression analyses, partial plots were inspected for influential outliers and non-linear relations. To assess the influence of outliers, using Tukey’s definition, we repeated analyses excluding CBF values below the 25th percentile minus 1.5×inter quartile range (IQR) and above the 75th percentile plus 1.5×IQR. 23 To assess whether use of crushed instead of non-crushed ASL CBF estimates influenced results, analyses were repeated using non-crushed CBF estimates. Finally, since a history of stroke may affect CBF, SCoV, and AHD use, we performed a sensitivity analysis excluding all individuals with a clinical history of stroke (including TIA) to assess whether this affected our findings.
Ethics
PreDIVA and the MRI sub study were approved by the medical ethics committee of the Academic Medical Center, Amsterdam, the Netherlands. The studies were conducted in accordance with the World Medical Declaration of Helsinki. All participants gave written informed consent before participating. The preDIVA trial was registered with the ISRCTN trial registry, number: ISRCTN29711771.
Results
In total, 195 participants were scanned at baseline, and 135 (69%) underwent the follow-up session, on average 34 (±1.2) months later. Figure 1 lists the reasons for not attending MRI follow-up. ASL data were available for 95.4% (186/195) of participants at baseline and for 92.6% (125/135) at follow-up. Table 1 lists baseline demographic details, split by MRI follow-up availability. Participants without follow-up had lower BPF (69.2% ± 3.1 vs. 70.5% ± 2.9, p = 0.01) and higher BMI (27.3 ± 4.4 vs. 25.6 ± 3.1, p = 0.01), and tended to have lower GM CBF (63.4 ± 20.5 vs. 69.3 ± 22.3 ml/100 g/min, p = 0.08) and higher SCoV (0.542 ± 0.161 vs. 0.507 ± 0.142, p = 0.10). BP values ranged 104–220 mmHg (median 151.5) for SBP and 52–126 mmHg (median 80) for DBP.
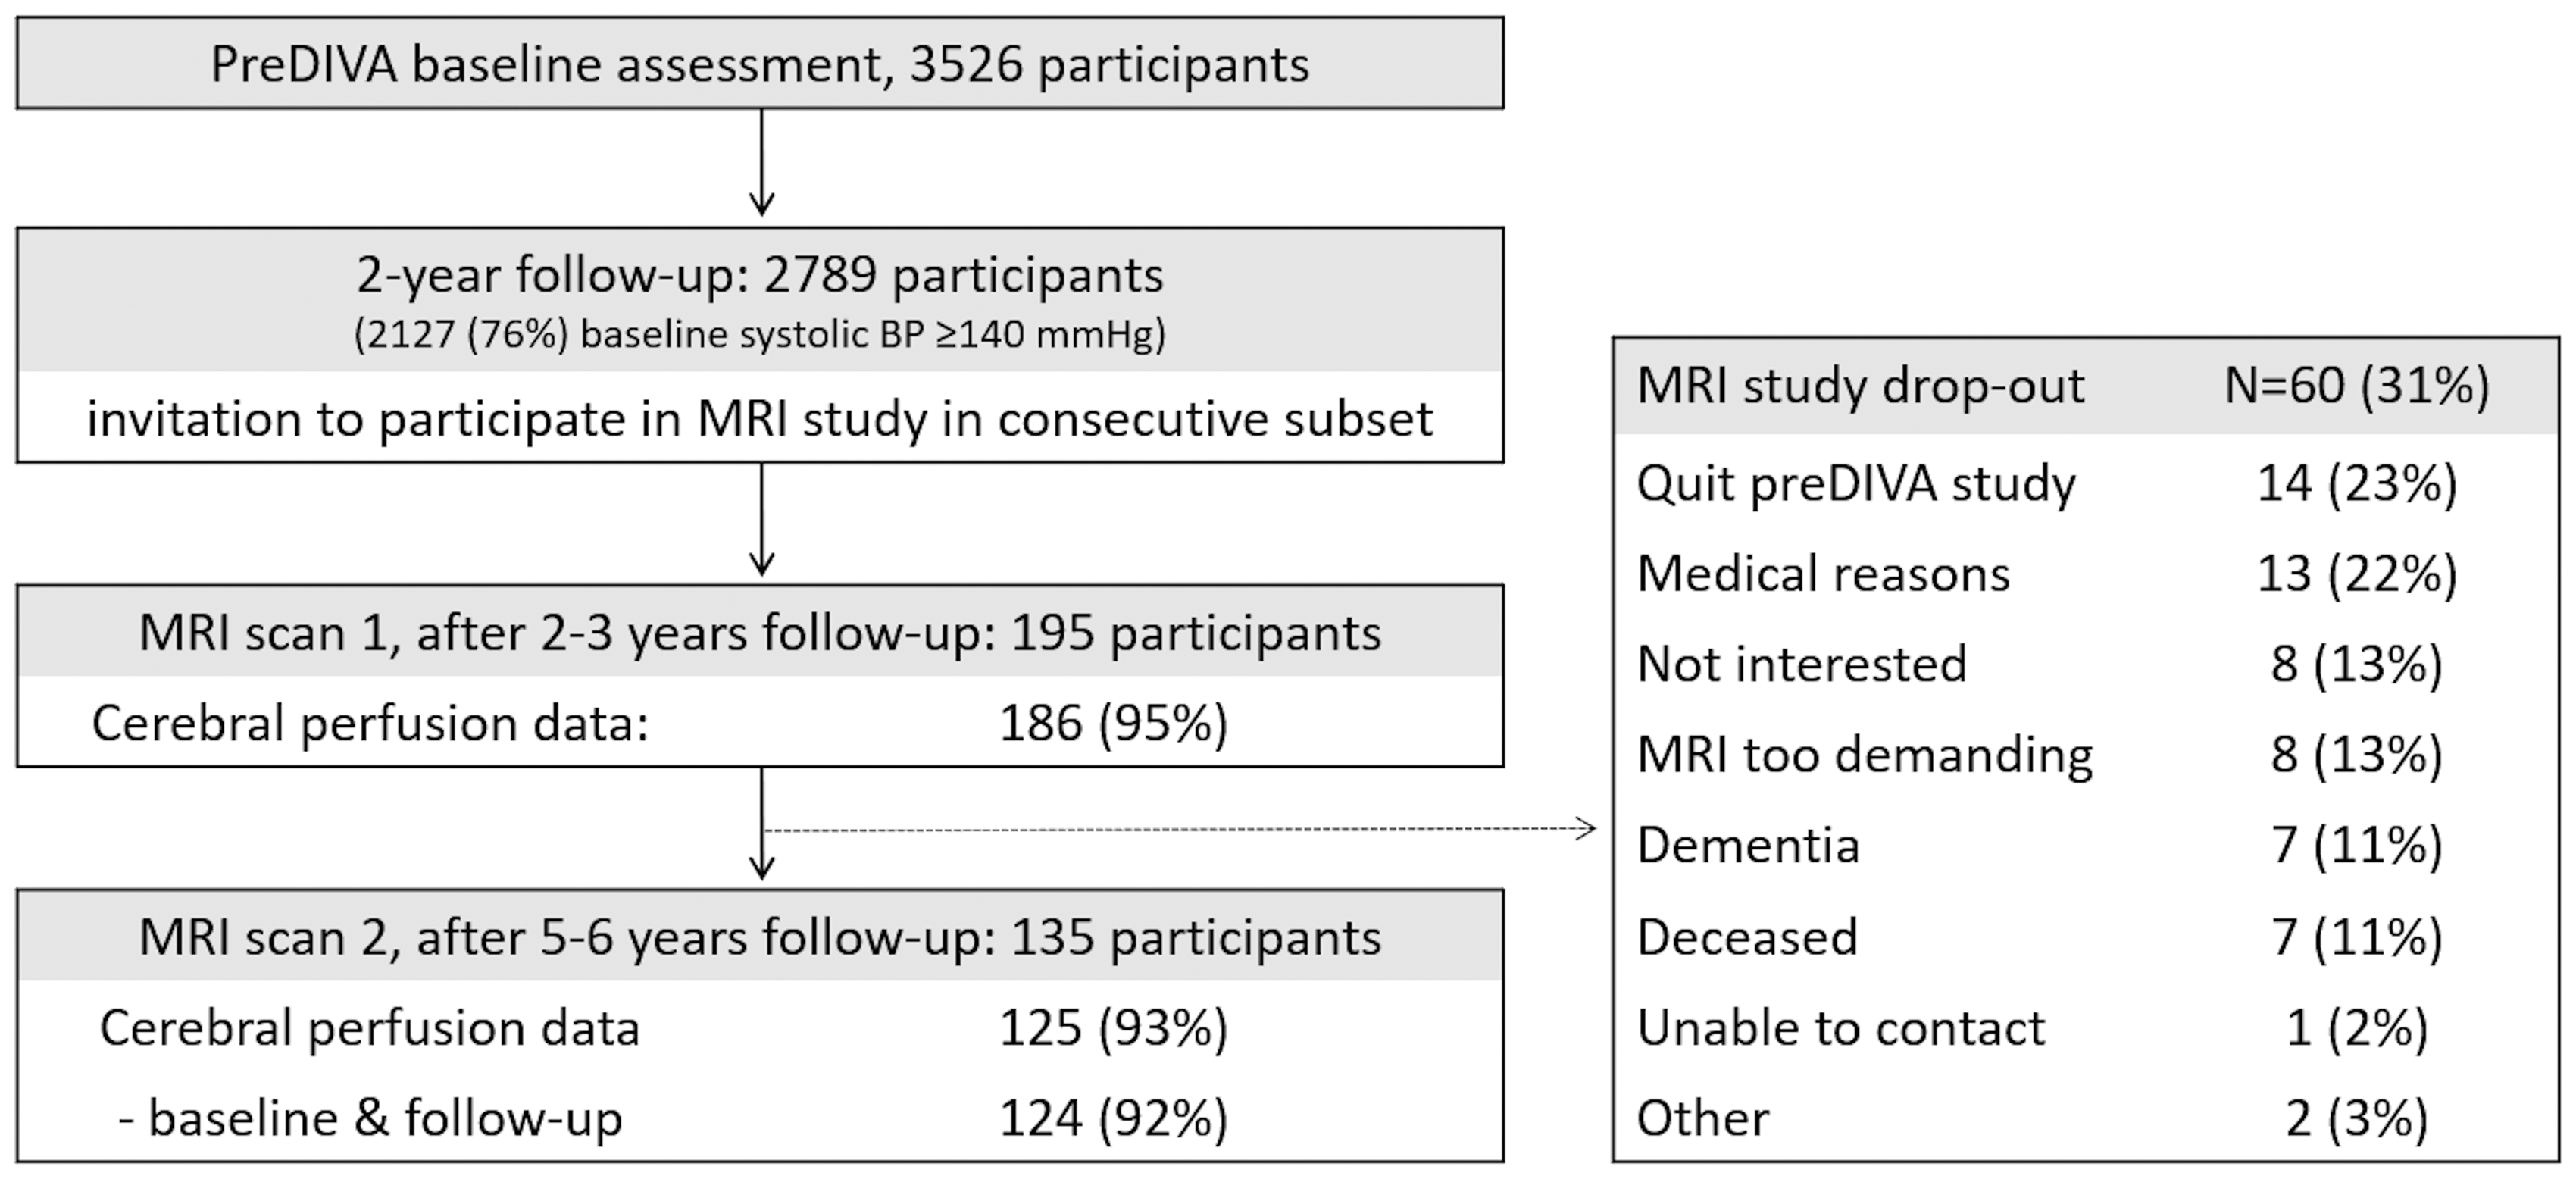
Flow-chart.
Baseline characteristics mean (standard deviation), median (inter quartile range), or numbers (%).
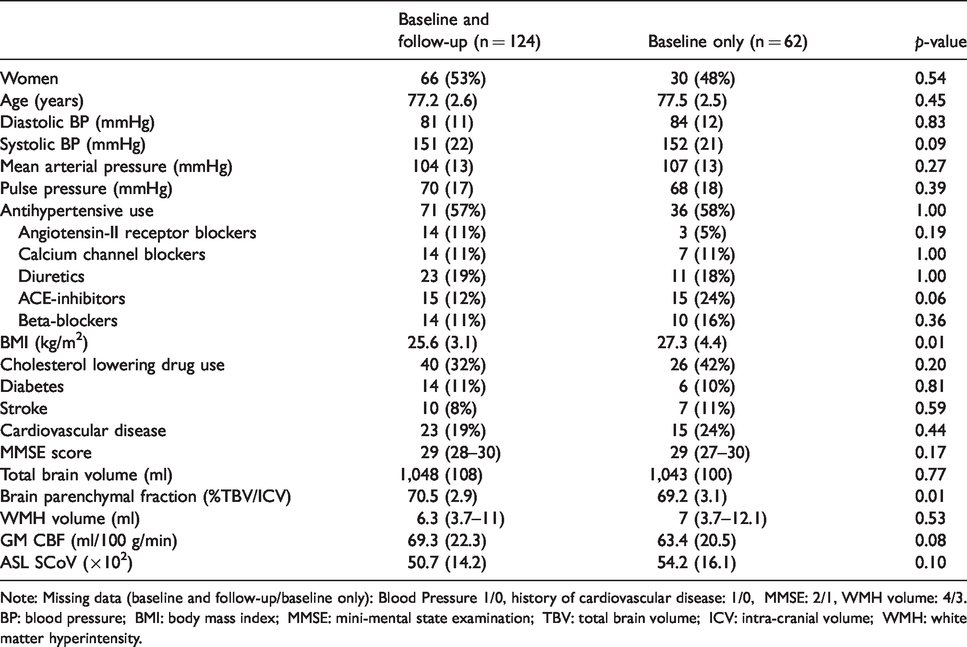
Note: Missing data (baseline and follow-up/baseline only): Blood Pressure 1/0, history of cardiovascular disease: 1/0, MMSE: 2/1, WMH volume: 4/3.
BP: blood pressure; BMI: body mass index; MMSE: mini-mental state examination; TBV: total brain volume; ICV: intra-cranial volume; WMH: white matter hyperintensity.
Representative examples of ASL gray scale images and mean population CBF maps for baseline and follow-up are given in Figure 2. Supplemental Table 1 describes the relations between CBF measures and possible confounders. Higher GM CBF and lower SCoV were associated with female sex, lower age, and higher brain parenchymal fraction. Supplemental Table 2 presents the change in longitudinal measures during the course of the study. At follow-up, GM volume had declined by 4.1 (±4.5, p < 0.001) ml/year, WM volume by 2.7 (±3.1, p < 0.001) ml/year, and WMH volume had increased by 0.7 (±0.7, p < 0.001) ml/year. CBF in the GM decreased by 1.6 (±8.0, p = 0.002) ml/100 g/min per. Mean SCoV was unchanged with time (−0.003 ± 0.052 per year, p = 0.46), but change differed greatly between participants.
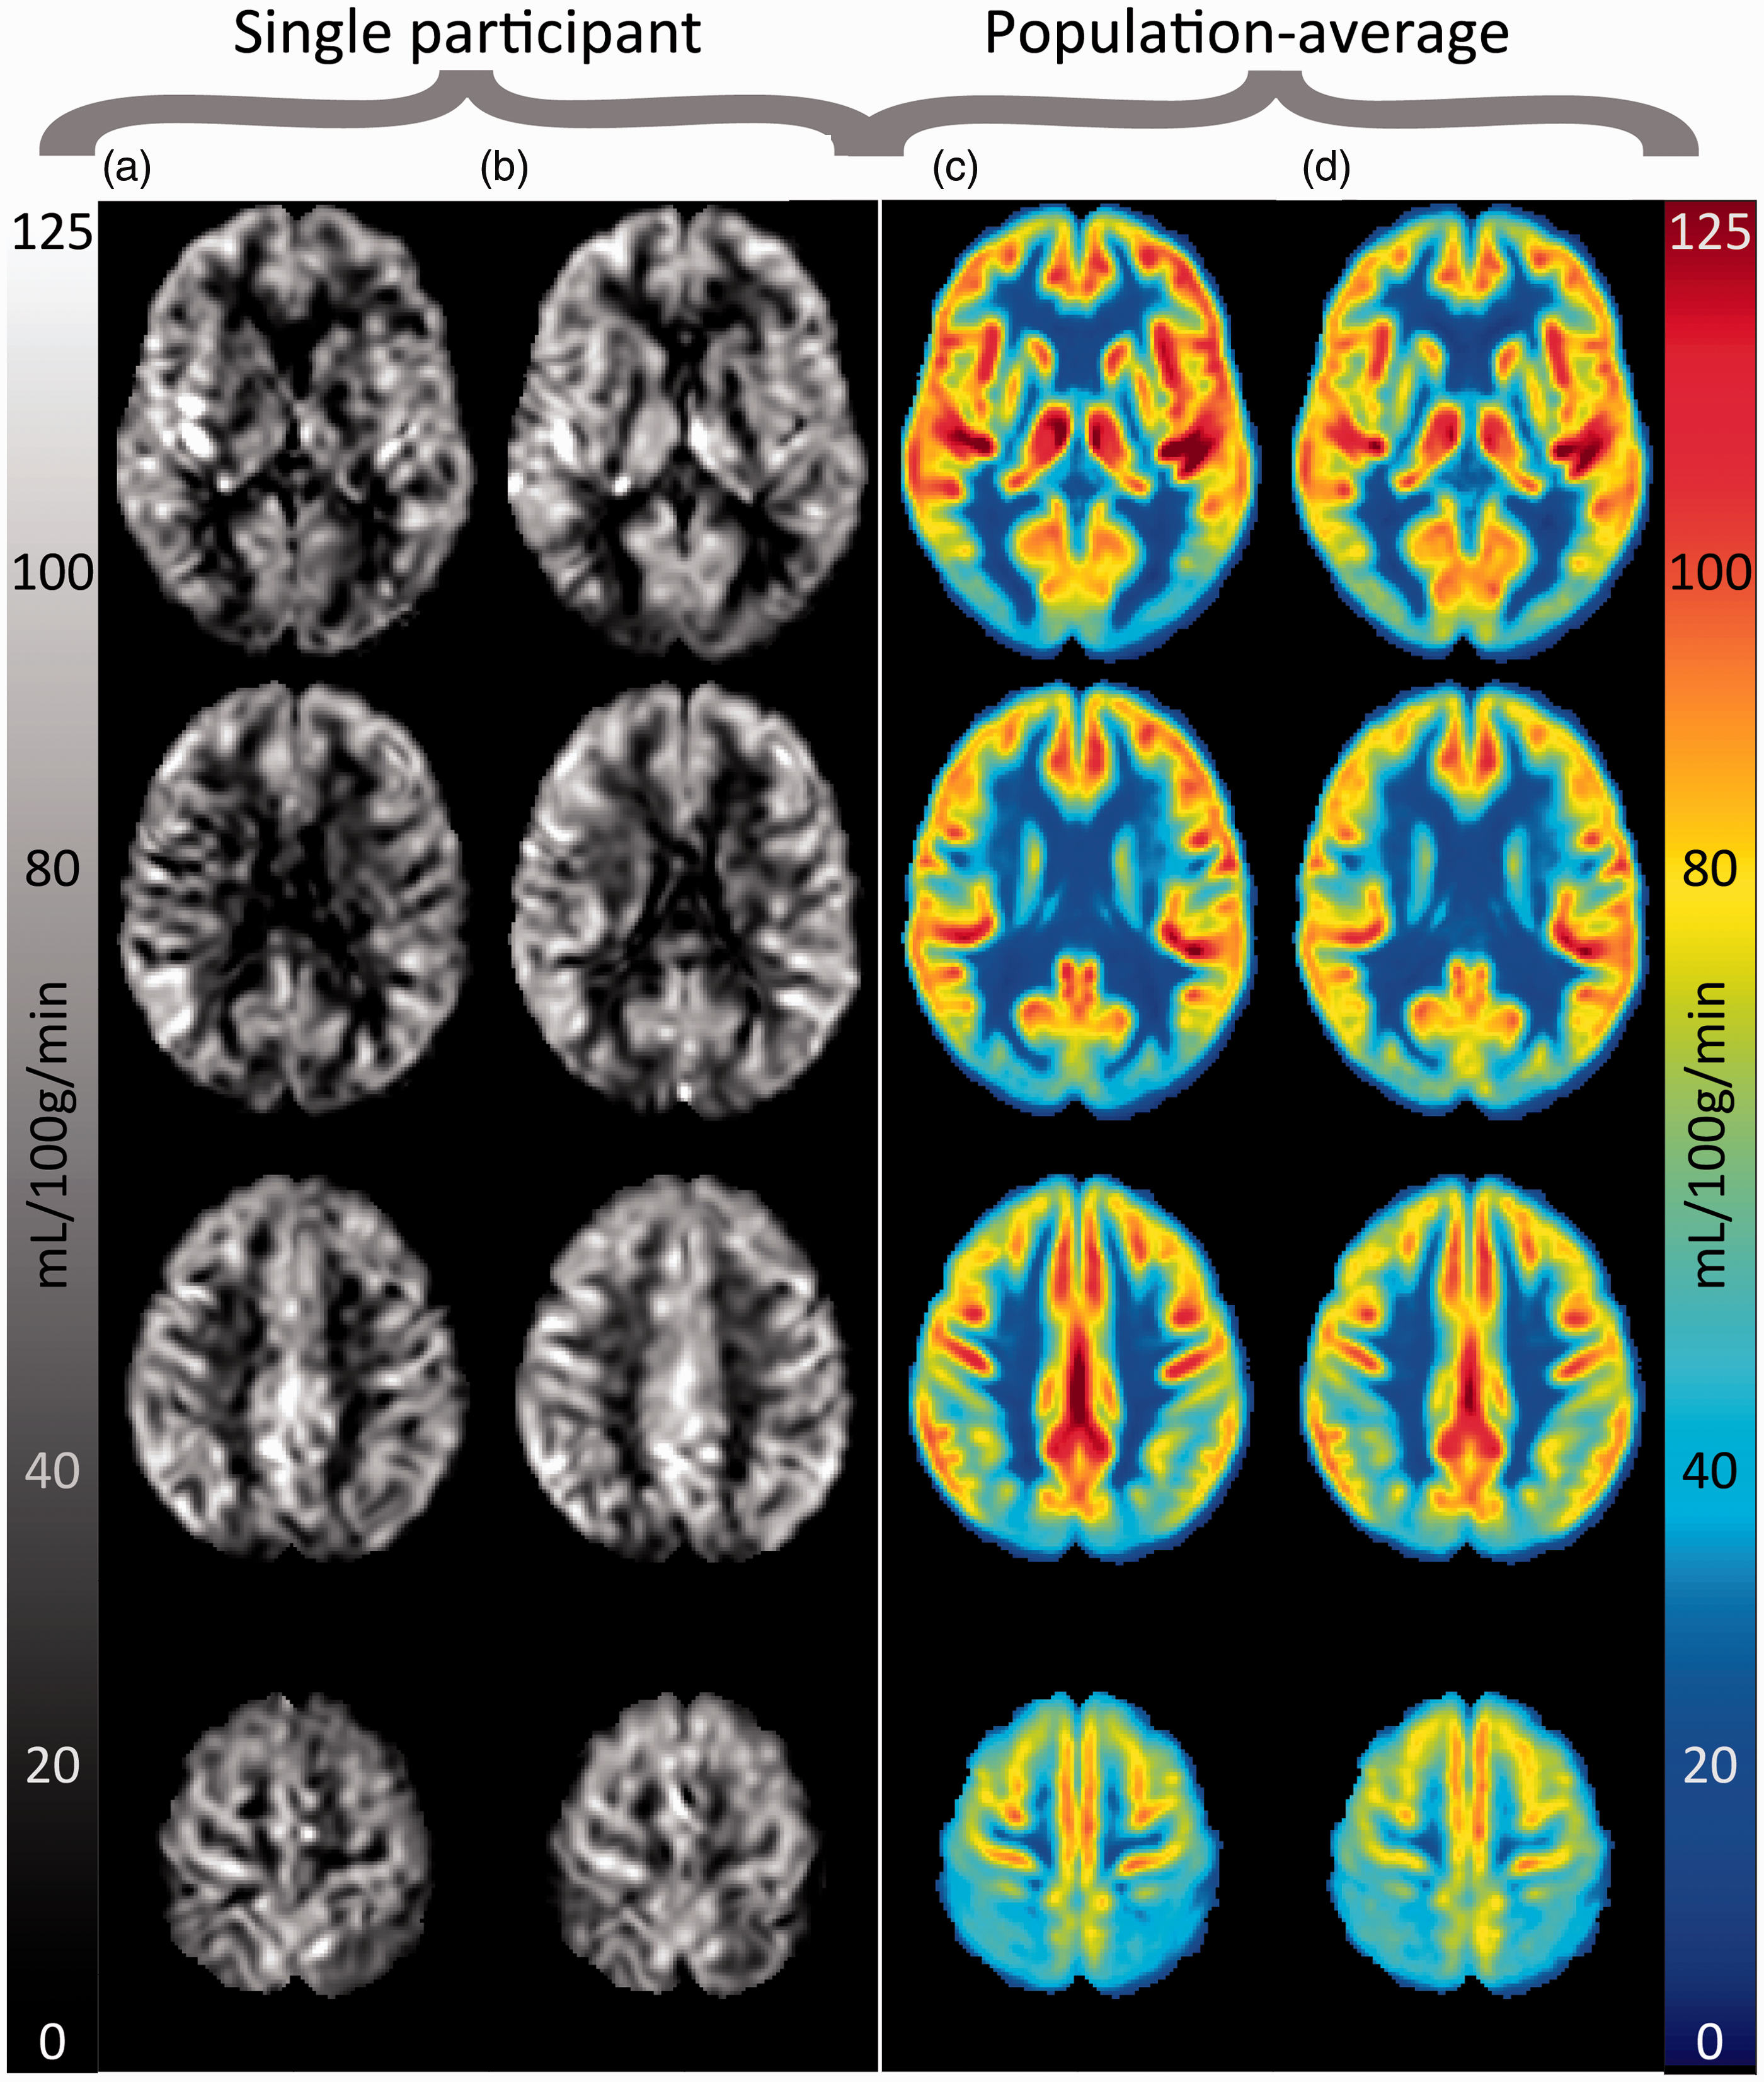
Single participant CBF images in grayscale for baseline (a) and follow-up (b), as well as population-average CBF images for baseline (c) and follow-up (d).
Tables 2 and 3 list relations between BP and CBF parameters. There was no positive correlation between BP and contemporaneous CBF. In contrast, associations tended towards a relation between higher DBP with lower GM CBF (−1.95 ml/100 g/min per 10 mmHg DBP, 95%CI: −4.05 to 0.14, p = 0.07). AHD use was associated with low GM CBF (−5.49 ml/100 g/min, 95%CI: −10.7 to −0.27, p = 0.04) and higher SCoV (0.32 SD, 95%CI: 0.12 to 0.52, p = 0.002) (Table 2). There were no correlations between change in BP or AHD use and change in CBF parameters (Table 3). There were no interactions between AHD use and any of the BP measures in their relation to CBF.
Contemporaneous relation of blood pressure parameters with GM CBF, WM CBF, and ASL SCoV.
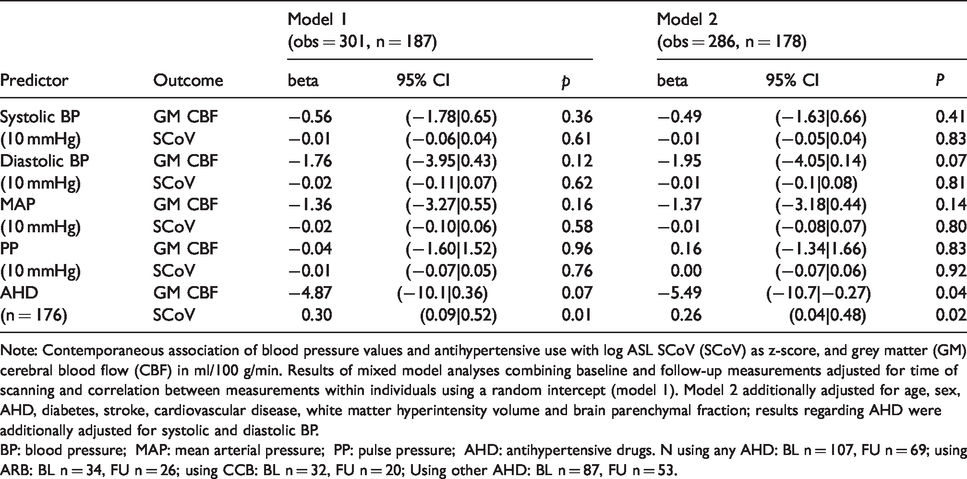
Note: Contemporaneous association of blood pressure values and antihypertensive use with log ASL SCoV (SCoV) as z-score, and grey matter (GM) cerebral blood flow (CBF) in ml/100 g/min. Results of mixed model analyses combining baseline and follow-up measurements adjusted for time of scanning and correlation between measurements within individuals using a random intercept (model 1). Model 2 additionally adjusted for age, sex, AHD, diabetes, stroke, cardiovascular disease, white matter hyperintensity volume and brain parenchymal fraction; results regarding AHD were additionally adjusted for systolic and diastolic BP.
BP: blood pressure; MAP: mean arterial pressure; PP: pulse pressure; AHD: antihypertensive drugs. N using any AHD: BL n = 107, FU n = 69; using ARB: BL n = 34, FU n = 26; using CCB: BL n = 32, FU n = 20; Using other AHD: BL n = 87, FU n = 53.
Relation between change in blood pressure parameters and change in GM CBF, WM CBF, and ASL SCoV during the study.
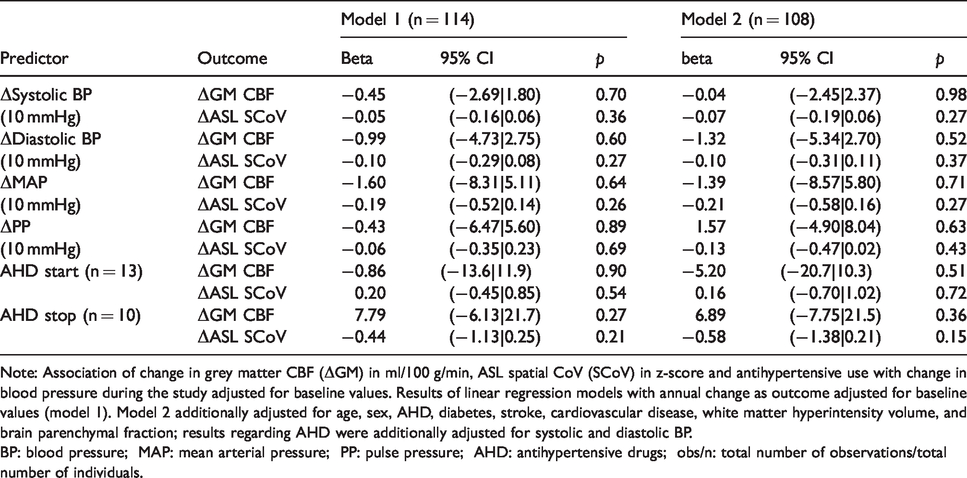
Note: Association of change in grey matter CBF (ΔGM) in ml/100 g/min, ASL spatial CoV (SCoV) in z-score and antihypertensive use with change in blood pressure during the study adjusted for baseline values. Results of linear regression models with annual change as outcome adjusted for baseline values (model 1). Model 2 additionally adjusted for age, sex, AHD, diabetes, stroke, cardiovascular disease, white matter hyperintensity volume, and brain parenchymal fraction; results regarding AHD were additionally adjusted for systolic and diastolic BP.
BP: blood pressure; MAP: mean arterial pressure; PP: pulse pressure; AHD: antihypertensive drugs; obs/n: total number of observations/total number of individuals.
Mean CBF and SCoV values per AHD type are presented in Supplemental Table 3, and Table 4 lists the results of analyses comparing AHD classes in their association with CBF and spatial CoV. These analyses showed no clear consistent differences between specific AHD subtypes in their relation with CBF and SCoV. Compared to individuals not using any AHD, effects sizes for CBF ranged from −0.21 ml/100 g/min (95%CI: −6.84 to 6.42, p = 0.95) for ARBs to −4.73 ml/100 g/min (95%CI: −10.7 to 1.23) for diuretics, and for log SCoV from 0.01 SD (95%CI: −0.28 to 0.29, p = 0.96) for betablockers to 0.23 SD (0.00 to 0.45, p = 0.051) for diuretics. Table 5 lists the associations of CBF and SCoV per number of AHD classes used concurrently categorically and as a continuous predictor, and Supplemental Table 3 as mean CBF and SCoV values. Compared to individuals not using AHD, there were indications of an association with a stepwise decrease in CBF per number of classes used (1 through 3: −5.40 [95%CI:−11.2;0.42] to −11 [95%CI:−21.0; −1.01] ml/100 g/min), and a stepwise increase in log SCoV (1 through 3: 0.26 [95%CI: 0.04;0.48] to 0.59 [95%CI: 0.21;0.97] SD), except for individuals using four AHD types (CBF: 2.00 ml/100 g/min [95%CI: −14.7;18.7] and SCoV: 0.23 SD [−0.40;0.86]). As a continuous measure, an increase in AHD used was associated with a non-significant decline of −2.29 ml/100 g/min (95%CI: −4.82 to 0.23, p = 0.08) in CBF and an increase of 0.16 SD (95%CI: 0.06 to 0.26, p = 0.02) in log SCoV per AHD.
Associations of antihypertensive drug (AHD) subtypes with GM CBF (top rows) and spatial CoV (bottom rows).
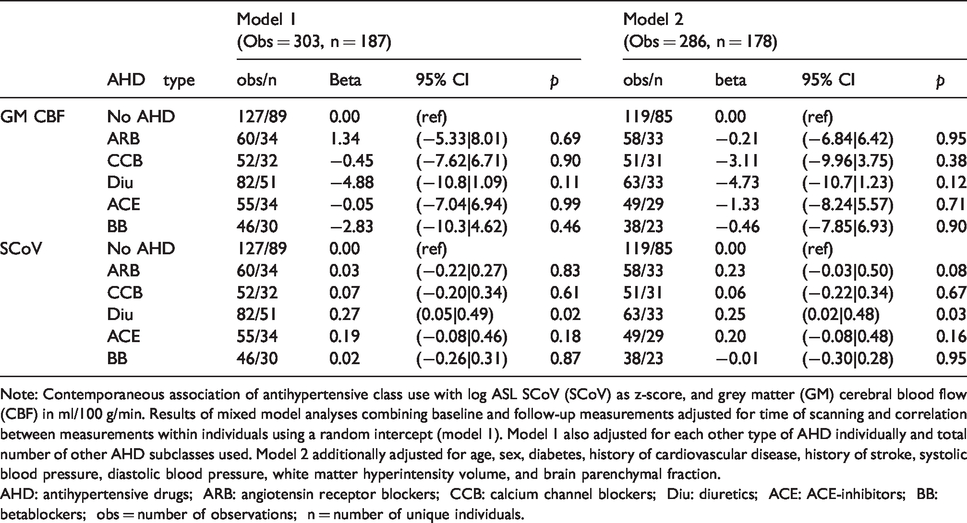
Note: Contemporaneous association of antihypertensive class use with log ASL SCoV (SCoV) as z-score, and grey matter (GM) cerebral blood flow (CBF) in ml/100 g/min. Results of mixed model analyses combining baseline and follow-up measurements adjusted for time of scanning and correlation between measurements within individuals using a random intercept (model 1). Model 1 also adjusted for each other type of AHD individually and total number of other AHD subclasses used. Model 2 additionally adjusted for age, sex, diabetes, history of cardiovascular disease, history of stroke, systolic blood pressure, diastolic blood pressure, white matter hyperintensity volume, and brain parenchymal fraction.
AHD: antihypertensive drugs; ARB: angiotensin receptor blockers; CCB: calcium channel blockers; Diu: diuretics; ACE: ACE-inhibitors; BB: betablockers; obs = number of observations; n = number of unique individuals.
Associations of numbers of antihypertensive drugs (AHD) subtypes used concurrently with GM CBF (top rows) and spatial CoV (bottom rows).
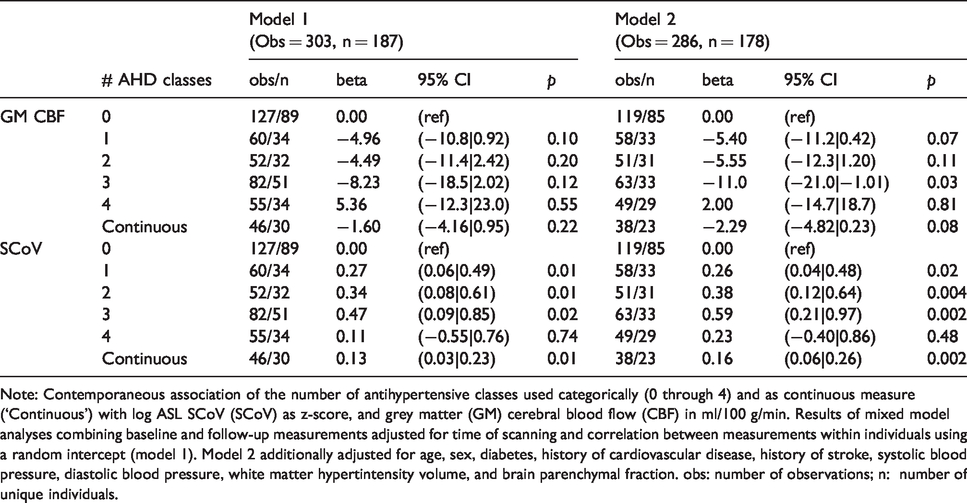
Note: Contemporaneous association of the number of antihypertensive classes used categorically (0 through 4) and as continuous measure (‘Continuous’) with log ASL SCoV (SCoV) as z-score, and grey matter (GM) cerebral blood flow (CBF) in ml/100 g/min. Results of mixed model analyses combining baseline and follow-up measurements adjusted for time of scanning and correlation between measurements within individuals using a random intercept (model 1). Model 2 additionally adjusted for age, sex, diabetes, history of cardiovascular disease, history of stroke, systolic blood pressure, diastolic blood pressure, white matter hypertintensity volume, and brain parenchymal fraction. obs: number of observations; n: number of unique individuals.
Using Tukey’s definition, 23 18 observations in 17 participants were identified as outliers for concurrent analyses, and 14 observations in 13 participants for longitudinal analyses (Supplemental Figure 1). Results of sensitivity analyses leaving out these measurements were similar to the main analyses’ findings (Supplemental Tables 4 to 6). Sensitivity analyses excluding individuals with a clinical history of stroke, and using non-crushed CBF estimates also gave results similar to the main analyses.
Discussion
Our results suggest that BP levels in older people with hypertension have limited influence on CBF in the short term. Lower BP was not associated with lower concurrent CBF, nor was increase or decrease in BP associated with change in CBF over time. There was some evidence that participants on AHD had a lower GM CBF. Post hoc analyses did not show any clear differences between AHD subtypes in relation to CBF and SCoV.
The observed relations of age and male sex with lower GM CBF and higher SCoV concur with the literature. 24 , 25 The absence of an association of CBF with BP values agrees with previous literature regarding older people and patients with MCI. 26 , 27 One previous study in men only reported an association between higher BP and lower SPECT-derived CBF in healthy younger individuals. 28 Another study in older people found that greater increase in MAP during the 12 years preceding MRI was associated with lower ASL-derived CBF values. 27 Our study suggested a small, non-significant association between higher DBP and lower CBF, in line with these results. Possibly, these associations are not due to a direct relation between BP and CBF but rather to elevated BP being a marker of more severe and long-standing hypertension and therefore more extensive cerebral damage. If there was also an association between low BP and low CBF, this could lead to a J-shaped association between blood pressure and CBF, which may not be apparent in linear regression. However, we did not observe any J-shaped curves in the data.
The observed relation between antihypertensive use and lower CBF may be complex. One previous study found no effect of discontinuation of AHD on ASL measured CBF, while another reported that introduction of AHD treatment in patients with metabolic syndrome increased CBF, measured using SPECT. 26 , 29 This may be explained by the relation between AHD and CBF being specific to certain AHD types, concurring with a growing number of reports that suggest specific AHD types convey a lower risk of dementia. 2 , 30 , 31 Several mechanisms have been hypothesized to explain this phenomenon.30–32 AHD types that induce expansion of peripheral arterioles (e.g. CCBs and ARBs) possibly help preserve cerebral microvascular perfusion, which predominantly depends on such arterioles. 4 , 5 AHD that decrease peripheral perfusion (e.g. BB, diuretics) could have the contrary effect, potentially explaining the heterogeneous findings. Also, ASL SCOV is inversely related to the arterial transit time of the ASL labelled blood to the brain. AHD classes may modulate the ATT, and thereby sCOV, by changing the blood flow velocity. Vasodilating antihypertensive medications (including ARB’s and CCB’s) may increase blood flow velocity, especially in patients with hypertension and cerebral atherosclerosis, by decreasing vasoconstriction. 33 Conversely, AHD that have vasoconstrictive effects or limit the total blood volume (betablockers, diuretics), may decrease blood flow velocity. 33 However, we did not find any clear differences between AHD subtypes in their relation to CBF or ASL SCoV. This may be due to limited power caused by the small and often overlapping AHD groups. Also, although we extensively adjusted AHD type analyses for medical history, confounding by indication (i.e. choice of AHD being influenced by patients characteristics also related to cerebrovascular health) may still play role in our findings regarding differences between AHD subclasses. Crucially, the relation between AHD use and CBF might be due to AHD use being a marker of more severe hypertension. This could have led to more severe arteriopathy, potentially causing lower CBF. This may also explain our findings suggesting CBF estimates decreased and ASL SCoV estimates increased with use of multiple AHD types concurrently, which is a marker of more severe hypertension. In these analyses, we found similar associations for AHD use with CBF and ASL SCoV, although the latter correlation was stronger. The ASL SCoV indicates the potential inaccuracy of the CBF measurement by incomplete tissue arrival, but may also be a more sensitive parameter for cerebrovascular pathology than CBF. 15 , 34 , 35 Higher ASL SCoV is associated with a longer arterial transit time, 15 , 35 and increased vascular resistance (e.g. due to arteriolar stiffness, increased tortuosity or stenoses). 36 ASL SCoV has been associated with SVD parameters and cognitive decline. 34 , 37 , 38 The associations found with lower ASL SCoV may thereby reflect lower cerebrovascular health in individuals using antihypertensive medication.
Our study has some limitations. The voluntary recruitment and inclusion criteria led to a relatively healthy sample of older people with hypertension. 10 , 11 Relations between BP and CBF may be more evident in individuals with more extensive cerebral damage and more disturbed cerebral autoregulation. Furthermore, longitudinal MRI analyses could only be performed in participants attending baseline and follow-up. Participants with strong decline in CBF and/or BP may have dropped out of the study, as these are both risk factors for morbidity and mortality. 39 , 40 This is supported by the lower baseline BPF and CBF in participants without follow-up. Also, by only including individuals with hypertension, we may have missed relations between CBF and BP levels at lower BP ranges. However, BP values ranged widely at the time of MRI (DBP: 52–126 mmHg, SBP: 104–220 mmHg), and by selecting individuals with a history of hypertension, we increased the chance of participants having autoregulatory disorders following arteriolar damage, which occurs mostly after chronic hypertension.5–7 More generally, the high intra-individual variability in CBF makes it difficult to assess relations with CBF. In particular, analyses of change in CBF may have been hampered by the large variance, as these were based on one-third as many observations. Also, the hardware change between scans may have influenced our longitudinal observations. Although WMH volumes were similar on both scanners, the large intra-individual variance in CBF impeded assessment of the effects on CBF measurements. Finally, this is a descriptive study of longitudinal relations between BP and CBF. Because we tested related hypotheses all pertaining to the same research question, we did not adjust for multiple testing but weighed the results for consistency throughout subgroup and sensitivity analyses. Given the consistency of results regarding the blood pressure parameters, the risk of type-II error seems small. Although the association of AHD with lower CBF and ASL CoV was consistent throughout analyses, and there were also indications of a dose–response relationship with more AHD types relating to greater differences in CBF and ASL CoV, we cannot completely exclude type-I error in these associations. Furthermore, due to the observational design, no causal inferences can be made. Despite the relatively large sample size for a longitudinal ASL CBF study, our conclusions are limited by the large number of potentially important covariates, particularly in the longitudinal analyses. Our study therefore provides evidence that systemic BP is not a major predictor of CBF or ASL SCoV, but replication in a larger sample size is required to characterize this relationship more definitively.
Conclusion
Our findings provide more insight into the relations between BP and CBF in older individuals. There was no evidence for a direct relation between BP and CBF. Studies measuring BP during MRI, ideally with manipulation of BP, may corroborate our results. We only included individuals with a history of elevated blood pressure. Only other studies can show whether our findings are generalizable to individuals treated with AHD from lower BP thresholds, e.g. the 120 mmHg SBP in SPRINT MIND which was associated with less WMH progression. 41 Associations with SCoV were somewhat stronger in a number of analyses. Future research may easily evaluate this measure further, as it does not require extra ASL acquisitions and may add important information, in particular in pathology where CBF is relatively unaffected while the blood flow velocity is, for example in arterial stenosis. 15 Most importantly, whether the relation between (multiple) AHD types and CBF/SCoV are causal with (multiple) AHD affecting cerebral perfusion or merely by AHD use being a marker of cerebrovascular health requires further study.
Supplemental Material
sj-pdf-1-jcb-10.1177_0271678X20966975 - Supplemental material for Longitudinal relation between blood pressure, antihypertensive use, and cerebral blood flow, using arterial spin labelling MRI
Supplemental material, sj-pdf-1-jcb-10.1177_0271678X20966975 for Longitudinal relation between blood pressure, antihypertensive use, and cerebral blood flow, using arterial spin labelling MRI by Jan Willem van Dalen, Henri JMM Mutsaerts, Jan Petr, Matthan WA Caan, Eric P Moll van Charante, Bradley J MacIntosh, Willem A van Gool, Aart J Nederveen and Edo Richard in Journal of Cerebral Blood Flow & Metabolism
Footnotes
Funding
The author(s) disclosed receipt of the following financial support for the research, authorship, and/or publication of this article: This work was supported by: PreDIVA trial: Dutch Ministry of Health, grant 50-50110-98-020, Innovatiefonds Zorverzekeraars, grant 05-234; the Netherlands Organisation for Health Research and Development (ZonMW) grant 620000015. MRI sub study: Internationale Stichting Alzheimer Onderzoek, grant 10157.
Acknowledgements
We would like to thank all preDIVA participants and research personnel for making this study possible.
Declaration of conflicting interests
The author(s) declared the following potential conflicts of interest with respect to the research, authorship, and/or publication of this article: MWA Caan is shareholder of Nico-lab B.V. The other authors have no disclosures.
Authors’ contributions
Conception and design of the study: JWvD, HJJM, EPMvC, WAvG, AJN, ER.
Acquisition and analysis of data: JWvD, HJMM, JP, MWAC.
Drafting a significant portion of the manuscript or figures: JWvD, HJJM, JP, BMM, ER.
Supplemental material
Supplemental material for this article is available online.
References
Supplementary Material
Please find the following supplemental material available below.
For Open Access articles published under a Creative Commons License, all supplemental material carries the same license as the article it is associated with.
For non-Open Access articles published, all supplemental material carries a non-exclusive license, and permission requests for re-use of supplemental material or any part of supplemental material shall be sent directly to the copyright owner as specified in the copyright notice associated with the article.