
Abstract
Neonatal hypoxia-ischemia (nHI) disrupts hippocampal GABAergic development leading to memory deficits in mice. Polysialic-acid neural-cell adhesion molecule (PSA-NCAM) developmentally declines to trigger GABAergic maturation. We hypothesized that nHI changes PSA-NCAM abundance and cellular distribution, impairing GABAergic development, and marking nascent neurodegeneration. Cell degeneration, atrophy, and PSA-NCAM immunoreactivity (IR) were measured in CA1 of nHI-injured C57BL6 mice related to: (i) cellular subtype markers; (ii) GAD65/67 and synatophysin (SYP), pre-synaptic markers; (iii) phospho-Ser396Tau, cytoskeletal marker; and (iv) GAP43, axonalregeneration marker. PSA-NCAM IR was minimal in CA1 of shams at P11. After nHI, PSA-NCAM IR was increased in injured pyramidal cells (PCs), minimal in parvalbumin (PV)+INs, and absent in glia. PSA-NCAM IR correlated with injury severity and became prominent in perikaryal cytoplasm at P18. GAD65/67 and SYP IRs only weakly related to PSA-NCAM after nHI. Injured phospho-Ser396Tau+ PCs and PV+INs variably co-expressed PSA-NCAM at P40. While PCs with cytoplasmic marginalized PSA-NCAM had increased perisomatic GAP43, those with perikaryal cytoplasmic PSA-NCAM had minimal GAP43. PSA-NCAM increased in serum of nHI-injured mice. Increased PSA-NCAM is likely a generic acute response to nHI brain injury. PSA-NCAM aberrant cellular localization may aggravate neuronal degeneration. The significance of PSA-NCAM as a biomarker of recovery from nHI and nascent neurodegeneration needs further study.
Introduction
Neonatal hypoxia-ischemia (nHI) brain injury disrupts the normal GABAergic development in the mouse hippocampus1,2 and leads to hippocampal atrophy and memory deficits.2–4 While therapeutic hypothermia (TH), the standard of care for nHI encephalopathy (HIE) in children, protects motor aspects of neurodevelopment in humans5,6 and in mouse models, 3 TH does not prevent memory deficits, suggesting ineffective hippocampal protection.5,7–12 Supporting these findings, TH fails to persistently protect against hippocampal atrophy and GABAergic deficits in mice injured by nHI.1,3,4 Similar lack of hippocampal protection by TH is reported in lambs exposed to nHI brain injury, 11 while in humans hippocampal protection is yet to be proven. 12 Although early life ‘stressors’ have been epidemiologically linked to neurodegeneration,13–18 the effect of nHI and the resulting hippocampal atrophy and GABAergic disruption in later neurodegeneration, and the potential modulation by TH needs study.
Neural cell-adhesion molecule (NCAM) is a membrane glycoprotein essential for cell recognition. NCAM post-translationally adds polysialic acid to form PSA-NCAM, before trafficking to the membrane and synapses. 19 PSA-NCAM is crucial during early development to allow neurogenesis, differentiation, migration, and anchoring of pyramidal cells (PCs).20–25 When developmentally appropriate, PSA-NCAM decreases, triggering GABAergic network maturation, and initiation of the critical period of synaptic plasticity.26,27 These events are well described in the visual cortex, 26 and in other regions of the neocortex, 28 amygdala, 29 and hippocampus.30,31 In the hippocampus, premature decrease of PSA-NCAM32 or prevention of normal developmental decline in PCs33–36 results in cognitive and memory impairments.
The impact of nHI brain injury on developmental patterns of PSA-NCAM expression is unknown. Thus, we studied the temporal changes in immunoreactivity (IR) and cellular compartment localization of PSA-NCAM and its correlation with injury severity, GABAergic development, and neurodegeneration after nHI injury in the dorsal CA1, a subfield important for memory processing.37,38 We additionally studied the utility of PSA-NCAM as a serum biomarker for ongoing neurodegeneration after nHI. We hypothesized that nHI changes the abundance and cellular distribution of PSA-NCAM, impairing GABAergic development and marking nascent and ongoing neurodegeneration in the mouse CA1. Because TH fails at protecting hippocampal function in mice, and likely in humans, 5 we also hypothesized that TH would not modulate the effect of nHI in PSA-NCAM.
Materials and methods
Animals
One hundred and fourteen C57BL6 mice of both sexes were used for experiments. Animal protocol was approved by the Institutional Animal Care and Use Committee at Johns Hopkins University-School of Medicine and followed the Guide for the Care and Use of Laboratory Animals provided by the NIH, US Department of Health and Human Services 85-23, 1985. Experiments are reported in compliance with the ARRIVE guidelines (www.nc3rs.org.uk/arrive-guidelines).
nHI brain injury and TH
A modified Rice-Vannucci model was used at postnatal day (P)10 to induce nHI in 84 C57BL6 mice as previously described.39,40 In brief, mice were exposed to inhaled nitrous oxide/isoflurane 3% (induction, 30 s) and 1% (maintenance, 3–5 min) to perform right carotid artery ligation. After 1 h recovery with dam, mice were exposed to hypoxia (45 min, FiO2 = 0.08), followed by randomization to normothermia (NT, 36°C) or TH (31°C) in isolation chambers (two to three mice per chamber) for 4 h.2–4 Targeted temperature was achieved in 5–10 min and rewarming to 36°C occurred in ∼15 min. Rectal temperature monitoring (PowerLab, Ad Instruments, Inc., Colorado Springs, CO) was performed in one pup per treatment group per experiment using a rectal implantable thermocouple-microprobe. P10 sham mice were also exposed to anesthesia (5 min). Sham pups were maintained at 36°C for 4 h away from the dam until injured mice finished treatments. Pups were killed at 24 h (P11; n = 32), 8 d (P18; n = 39), and 30 d (P40; n = 28) after experiments (Supplemental methods: Table 1). Both sexes were equally represented in all groups and stratification was taken into account for pilot analysis, looking for dimorphism. Mice were deeply anesthetized by exposure to 20% (v/v) mixture of isoflurane in propylene glycol via one drop exposure method 41 and then were perfused intracardially with 10 mM PBS (pH 7.4) for exsanguination, and 4% paraformaldehyde in 0.1 M phosphate buffer for brain fixation (30 min at 4 ml/min). After cryoprotection using a 15%/30% sucrose gradient in PBS, fixed brains were used for immunohistochemistry (IHC). Additional brains (two to three per group) were harvested as unfixed fresh tissue for western blotting (WB) to validate antibodies. Peripheral blood was also collected and centrifuged at 5000 RPM for 5 min to test PSA-NCAM detection in serum by WB (two to three per group).
Exclusion criteria
A ∼20% mortality, similar in both sexes, has been previously reported for this model. 4 For our experiments, 15 pups initially assigned to the described experiments died mostly during hypoxic exposure (13.1%). This model also carries significant hippocampal injury variability. Thus, injury was assessed by Nissl staining and glial fibrillary acidic protein (GFAP) IHC, as previously reported,1,2 to exclude animals with hippocampal obliteration (Supplemental methods: Table 1).
Forebrain crude homogenates, which included the hippocampus (two to three mice per group) were prepared at P11, P18, and P40, and used for immunoblotting accordingly to the timing at which target proteins were tested in IHC. Details about western blot experiments are found in Supplemental methods. The criterion used to utilize the specific antibodies for immunofluorescence (IF)-IHC experiments were as follows: (i) identification of a single or multiple bands at molecular weights described for the target proteins, and (ii) lack of non-specific bands, unless reported post-transcriptional modifications detected with the antibody. A full list of tested antibodies is provided (Supplemental methods: Table 2).
Standard IHC
Perfused brains were cryoprotected by immersion in 15%/30% sucrose/PBS until they sank, and then frozen and stored in −80°C. Brains were cut coronally using a freezing microtome (50 µm). Floating IHC was performed as previously described with rabbit anti-GFAP (DAKO/Agilent Technologies, Santa Clara, CA; 1:1000) followed by goat anti-rabbit antibody (1:200) secondary antibody and DAB as chromogen. Nissl counterstaining was used to assess injury along with a GFAP-derived scoring system. 1
Double-labeled IF-IHC
Sections (50 µm) were washed in TBS (pH 7.2, 10 min, RT) followed by antigen retrieval with sodium citrate buffer (pH 6.0, 90 min, 80°C). Tissues were permeabilized using Triton X/TBS (15 min, RT; 0.2%, 0.4%, and 0.6% for P11, P18, and P40, respectively). After blocking using 10% NGS/0.1% Tween/TBS (1 h, RT), sections were exposed to primary antibodies in the following combination: mouse anti-PSA-NCAM (Millipore, Burlington, MA; 1:250) combined with (i) chicken anti-PV (Novus Biological LLC, Centennial, CO; 1: 250), (ii) rabbit anti-somatostatin (SST, Genetex, Inc., Irvine, CA; 1:400), (iii) rabbit-calretinin (CAL, Abcam PLC, Cambridge, MA; 1:250), (iv) rabbit anti-cholecystokinin (CCK, Origene Technologies Inc., Rockville, MD; 1:250), (v) chicken anti-GFAP (Novus Biological LLC; 1:1000), (vi) rabbit anti-Iba1 (Fujifilm Wako Chemicals USA Corp; 1:500), (vii) rabbit anti-GAD65/67 (Abcam PLC; 1:400), (viii) rabbit anti-SYP (Novus Biological LLC; 1:400), (ix) rabbit anti-phosphoSer396Tau (Thermofisher Scientific Inc., Waltham, MA; 1:400), or (x) rabbit anti-GAP43 (Abcam PLC; 1:200). Primary antibodies were mixed in 4% NGS in TBS (only for PSA-NCAM) or TBS-T overnight at 4 °C. Following incubation, tissues were exposed in the dark for 2 h at RT to goat anti-chicken IgY Alexa Fluor 488, goat anti-rabbit or anti-mouse conjugated to either Alexa Fluor 568 or 488, emitting red and green fluorescence signal, respectively (Thermo Fisher Scientific, Inc.), mixed in 4% NGS/TBS-T. Lastly, tissues were incubated for 5 min in 4′,6-diamidino-2-phenylindole (DAPI, 1 µg/mL) in TBS, washed in TBS, and mounted and dried for 30 min, then coverslip with ProLong Glass Antifade Mountant (Molecular Probes, Life Technologies Corp., Carlsbad, CA). Negative controls included no primary antibody and subtype and species-specific immunoglobulin replacing primary antibody at identical concentrations (Supplemental methods).
Quantification of IHC
IHC was performed in coronal sections to evaluate the dorsal CA1 pyramidal cell layer (PCL). Anterior brain sections were defined by appearance of the fasciola cinereum in the vicinity of the dorsal third ventricle and the end of the dorsal subiculum and before the CA3 descends inferiorly to the horizontal level of the fasciculus retroflexus in the diencephalon. The dorsal CA1 PCL analyzed included the region limited by the subiculum (medially) and the CA2 subfield (laterally). 42 Representative microphotographs of brain sections exposing the dorsal CA1 subfield of the hippocampus are shown in Figure 1(a) and (b) for uninjured and HI-injured mice at P18. Posterior brain sections were not used for our experiments (Figure 1(c)).
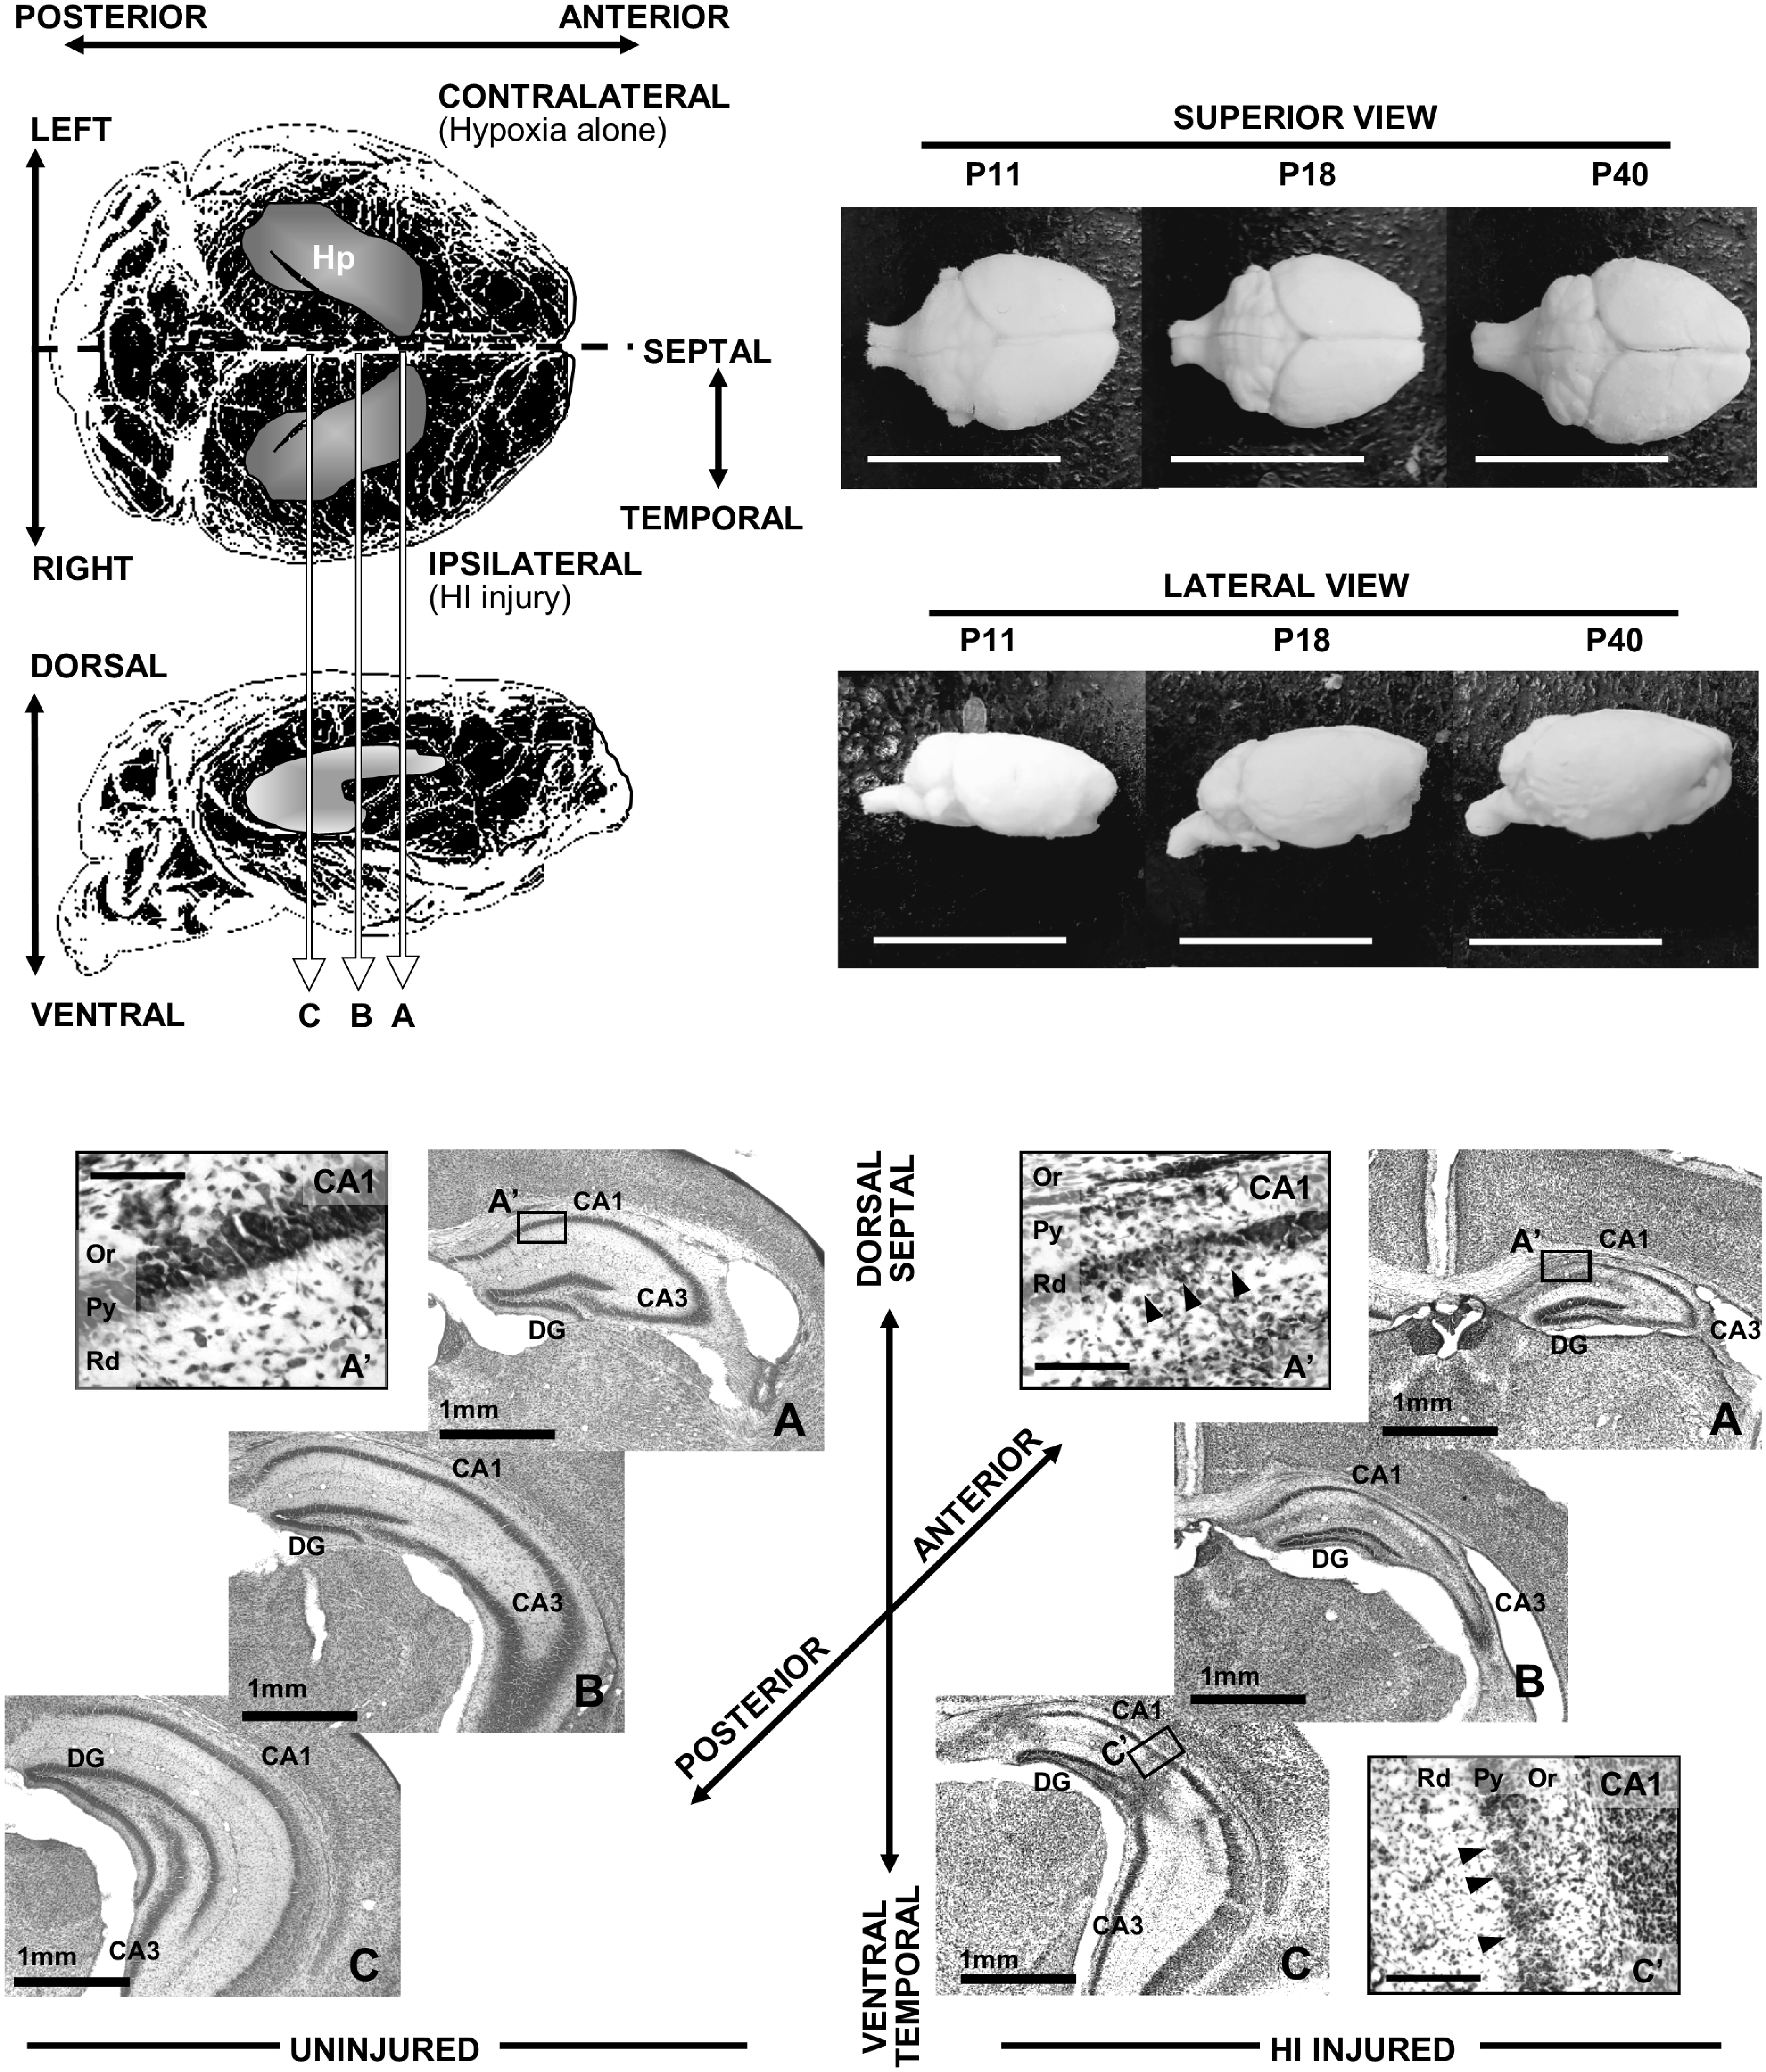
Diagram showing regions of interest for the study. Top left quadrant shows a diagram of the mouse brain in superior view (top) and lateral view (bottom). HI injury was produced in the right side of the brain via right carotid artery ligation followed 1 h later by hypoxia exposure, thus left hemisphere receive only hypoxia for 45 min. Position of the hippocampus is shown (Hp). Level of anterior (a), middle (b), and posterior (c) sections are represented in the diagram. Photographs of superior (top) and lateral (bottom) views of mouse brains at P11, P18, and P40 are shown in upper right quadrant of the figure, demonstrating normal progression of growth (bar = 1cm). Representative microphotographs of brain sections including the dorsal CA1 subfield of the hippocampus are shown in panels a and b for uninjured and HI-injured mice at P11. Posterior brain sections were not used for our experiments (c). Detail of typical HI injury of the CA1 is observed in the high magnification panels on the lower right quadrant of the figure (a’ and c’ bar = 100 microns).
Immunofluorescence
Immunofluorescent PSA-NCAM images were taken at 2048 × 2048 pixels, 16-bit depth, and averaged X8, captured using a 20X/0.8 objective/1.0 zoom to produce an uncompressed image of 320 × 320 µm presenting the entire CA1 subfield limited by the dorsal subiculum and the CA2 using a Laser Scanning Confocal Microscope LSM700 (Carl Zeiss AG, Oberkochen, Germany). Similar settings were applied to all images using the identical imaging configurations. Total immunofluorescence signal within the dorsal CA1 PCL was quantified with standard software-generated thresholding using the histogram function in Zen 2.3 blue software (Carl Zeiss Microscopy GmbH, Jena, Germany).
Quantification of pyknotic nuclei
Morphology and size of CA1 PC nuclei were assessed using DAPI staining at P11 (24 h post-nHI) to correlate with PSA-NCAM IR. A proxy to pyknotic nuclei quantification was calculated using the color threshold and particle identification functions of ImageJ 1.8.0 software (NIH, Bethesda, MD) to identify round particles with diameter between 3 and 6 µm (normal mean diameter of CA1 PC nucleus is 8.1 ± 0.9 µm).
Quantification of dorsal CA1 PCL area
To establish correlations with PSA-NCAM IR, dorsal CA1 PCL areas were measured in triplicate first using the draw spline contour function of Zen 2.3 blue edition software followed by freehand selection function of Image J (Fiji) software. We report the average of these measurements. Inconsistencies (>10%) between the averages obtained using the two software warranted review by second observed (CL). Measurements calibrated to mm2 were taken in images captured using 20×/0.8 objective and 1.0 zoom. For all purposes described in this manuscript, DAPI staining guided drawing of CA1 PCL margins, established by the loss of PC packing density appearance of foci of cell loss/degeneration exceeding in average 15 µm. Well-defined clusters of cells that appear separated from the uniform cell-dense layering of the PCL were not included in area measurements even if located at less than 15 µm from the ROI.
Quantification of percent area of immunoreactivity
Images were taken at 576 × 576 pixels, 16-bit depth, and averaged X4, captured using 63X/1.40 oil immersion objective and 2.5 zoom to produce uncompressed images of 40 × 40 µm. Three photomicrographs were taken at the most medial, middle, and most lateral regions of the dorsal CA1. Percent area of immunostaining was determined by calculating the area of immunofluorescence using the threshold function in ImageJ software relative to the area of the CA1 PCL contained within the image. Margins of the CA1 PCL were drawn following the same limits described above. The reported representative percent area of immunostaining was calculated by the average of the three photomicrographs taken across the CA1 PCL.
Quantification of number of PV+ and phosphoSer396 Tau+ cells
Z-stacks were taken at 2048 × 2048 pixels, 16-bit depth, and average X2, capture with a 20X/0.8 objective and 1.0 zoom to produce an uncompressed image of 320 × 320 µm presenting the entire CA1 subfield. Following 3D reconstruction, the number of PV+ and/or phosphoser396Tau+ neurons were calculated relative to the evaluated volume (mm3). Because number of PV+ INs within the PCL of the CA1 subfield far exceeds those of SST, CAL, or CCK expressing INs (Supplemental Figure 1), we focused on the concurrent evaluation of PV+INs.
3D-reconstruction for GAP43 and PSA-NCAM
Z-stacks were taken at 360 × 360 pixels, 16-bit depth, and average X4, capture with a 63X/1.4 oil immersion objective and 4.0 zoom to produce an uncompressed image of 25 × 25 µm targeting the compartment immunostaining. Following 3D reconstruction surface rendering images were captured.
Statistics
Data deviated from normal distribution (Shapiro–Wilk test), thus non-parametric Kruskal–Wallis one-way analysis of variance (ANOVA) with Dunn-Bonferroni’s post-hoc test and Spearman Rho correlations were applied. Data were presented as hybrid box and whisker/scatter vertical plot, where the box was limited by the 25th and 75th percentiles, and the solid line represented the median with all experimental data-points shown. Significance was assigned by P-value ≤ 0.05 with adjustment for multiple comparisons. When applicable, a best-fit regression line was calculated. Analysis was performed using IBM SPSS Statistics 24v (IBM Corporation, Armonk, NY).
Results
nHI persistently increased PSA-NCAM IR in CA1 PCL in correlation with injury severity
In sham P11 mice, PSA-NCAM IR in dorsal hippocampus was most enriched in the alveus (al), the stratum lacunosum-moleculare, and the polymorphic layer of the dentate gyrus (DG), with relatively minimal IR in the CA1 PCL (Figure 2(a3)). The PSA-NCAM antibody was highly specific for recognizing high molecular weight proteins in 150–250 kDa range (Figure 2(a5)), consistent with expectations. 43 Strong PSA-NCAM labeling of individual neural progenitor cells was also present in the DG subgranular layer (Figure 2(a5)), which served as internal control. Twenty-four hours after nHI, PSA-NCAM IR increased by 5.7-fold in the CA1 PCL (KW ANOVA P < 0.001, P < 0.001 NT vs. sham) regardless of TH (Figure 2(b) to (d)). Enhanced PSA-NCAM IR was uneven throughout the PCL, but typically surrounded severely injured areas with cell loss 24 h after nHI. Negative control IHC using concentration-matched non-immune IgM instead of PSA-NCAM antibody did not have this pattern (Supplemental Figure 2). Eight days after nHI, PSA-NCAM IR in CA1 PCL was still increased by 4-fold in NT (KW ANOVA P = 0.001, P = 0.002 NT vs. sham) and 2.6-fold in TH (P = 0.01 TH vs. sham; Figure 2(e) to (g)). We studied CA1 PCL neuron nucleus attrition (pyknosis) by nuclear shrinkage and chromatin condensation identified by DAPI staining (Figure 2(h1) insets). Counts of pyknotic nuclei within the CA1 PCL 1d after HI (P11) (KW ANOVA P = 0.001, P = 0.004 NT vs. sham, Figure 2(h1)), and residual CA1 PCL area at 8d after HI (P18) (KW ANOVA P = 0.001, P = 0.004 NT vs. sham, Figure 2(i1)) revealed the injury severity and the lack of protection by TH. PSA-NCAM IR directly correlated with the number of pyknotic nuclei at P11 (R2 = 0.57, Spearman P < 0.001, Figure 2(h2)) and inversely with the residual CA1 PCL area at P18 (R2 = 0.60, Spearman P < 0.001, Figure 2(i2)). Thus, higher number of pyknotic nuclei at P11 or greater CA1 PCL atrophy (smaller residual area), equated with higher PSA-NCAM IR. Baseline PSA-NCAM IR persisted at low levels in CA1 of sham mice and in the hippocampus contralateral to HI injury (hypoxia alone) at P40 (Supplemental Figure 3A and 3B). Conversely, PSA-NCAM IR remained elevated in the CA1 PCL as late as 30 day after nHI (Figure 2(j)). At this time, cells showing cytoplasmic marginalized PSA-NCAM were still identified mostly in the CA1 radiatum layer after nHI; in contrast, most positive cells in the PCL displayed cytoplasmic PSA-NCAM accumulation (Supplemental Figure 3C, closed vs. opened arrow heads). We examined PSA-NCAM IR specifically in relation to CA1 INs. The level of PSA-NCAM IR appeared inversely related with the PV IR at P18 (Figure 2(e2)/(f2) vs. (e3)/(f3)). The small population of cells with high PSA-NCAM IR marginalized to the plasma membrane identified did not co-expressed PV (Supplemental Figure 3A’, 3B’, and 3C’, closed arrow heads) or calretinin (data not shown).
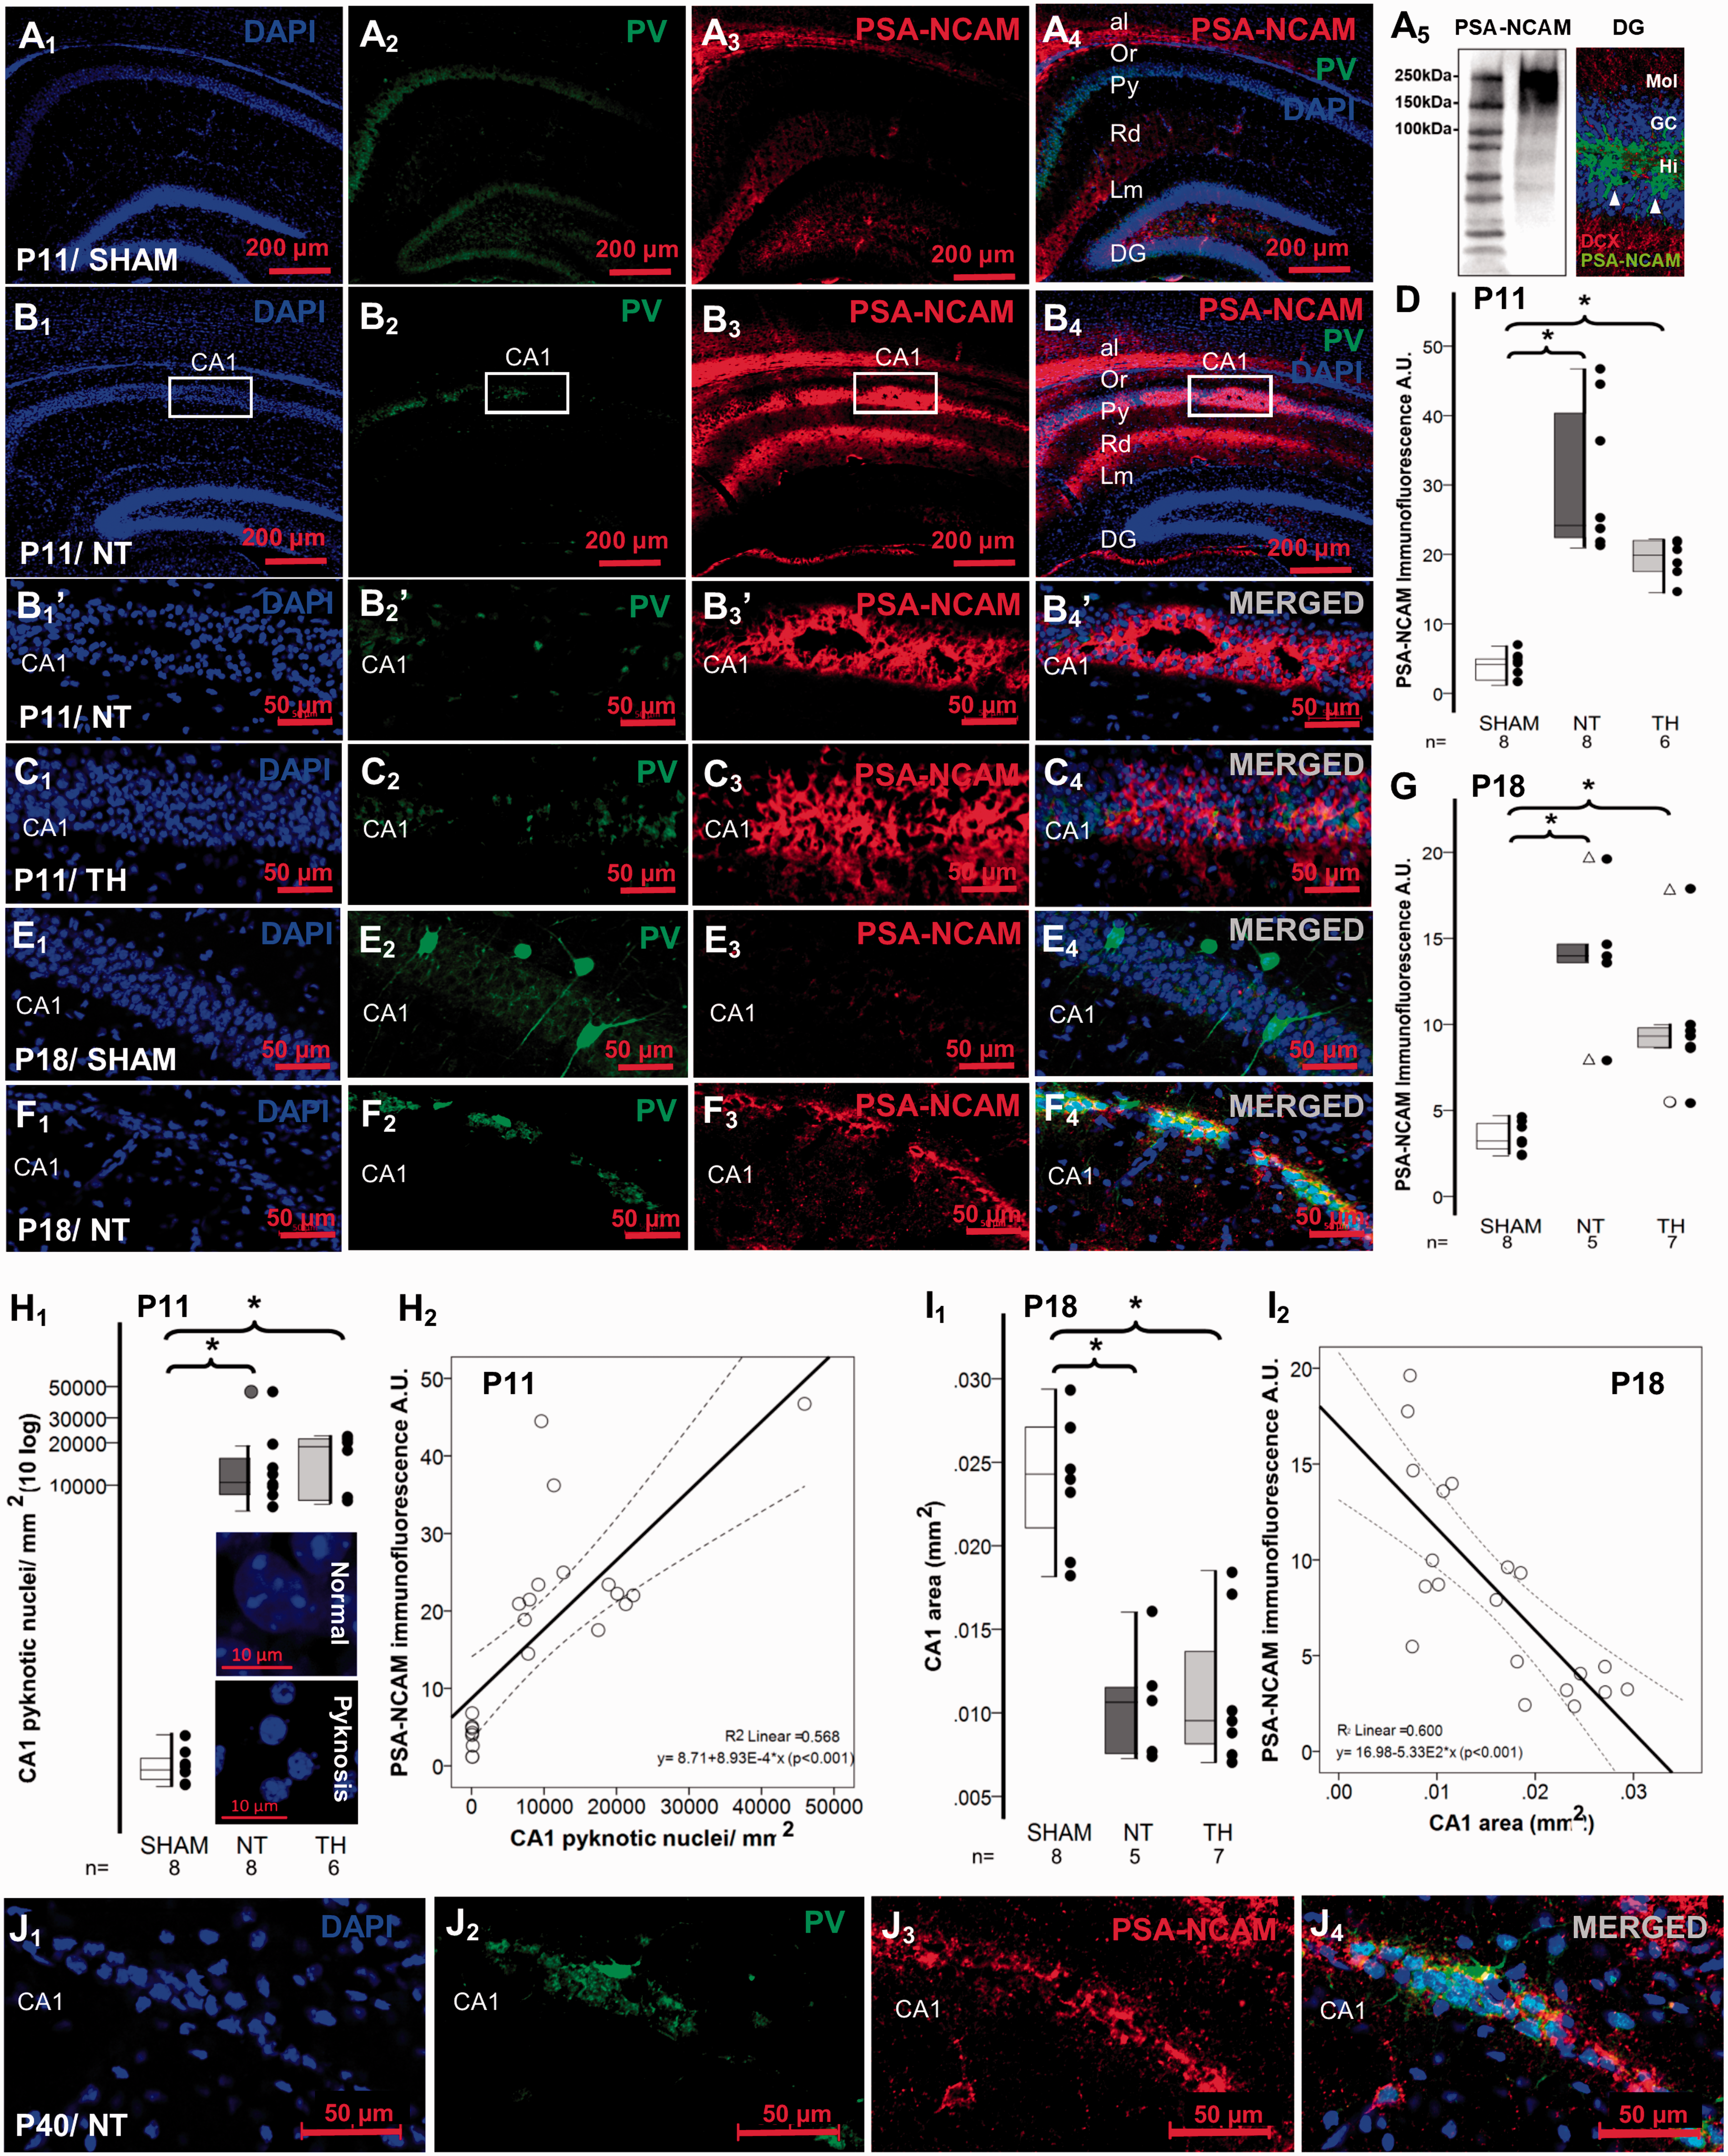
Neonatal HI persistently increased PSA-NCAM IR in the CA1 pyramidal cell layer. Representative low magnification images shows IR for PV in green (Alexa 488 goat anti chicken) and PSA-NCAM in red (Alexa 568 goat anti mouse) for sham (a1 to a4) and NT (b1 to b4). Specificity of the mouse monoclonal IgM PSA-NCAM antibody was determined by the western blot demonstrating bands between 150 and 250 kDa, by the specific PSA-NCAM staining of the neural stem cells here also immunolabeled with DCX in the DG subgranular cell layer (a5), which serves as an internal control, and with negative controls (shown in Supplemental Figure 2). Higher magnification images are shown for CA1 pyramidal cell layer of P11 NT (b1’ to b4’), P11 TH (c1 to c4), P18 Sham (e1 to e4), P18 NT (f1 to f4), and P40 NT (j1 to j4). Mixed box and whiskers with column scatter plots represent the increased PSA-NCAM IF 24 h (d), and 8d (g) after neonatal HI. Boxes are limited by the 75th and 25th percentiles (interquartile range, IQR) and whiskers are limited by the last data point within 1.5 times the IQR from the median (continuous line inside the box), with outliers represented as Δ. Kruskal–Wallis ANOVA with Dunn-Bonferoni post-hoc testing for pair analysis was applied. *P < 0.05. Mixed box and whiskers with column scatter plots also represent the increased number of pyknotic nuclei per mm2 (h1) and the CA1 area in mm2 (i1) at 24 h and 8 d after neonatal HI, respectively. Inserts in h1 show neuron nucleus attrition (pyknosis) by nuclear shrinkage and chromatin condensation identified by DAPI staining compared to normal nucleus. The increase in PSA-NCAM IR (y-axis) has a direct correlation with the number of pyknotic nuclei per mm2 (x-axis) at P11 and an inverse correlation CA1 area in mm2 (x-axis) at P18 shown in h2 and i2, respectively. Continuous line represent the fitted line derived from a linear regression and the discontinuous line represent the 95% confidence interval. Spearman Rho correlation was applied. P < 0.05 was consider significant. al, Alveus; A.U., Arbitraty units; CA, cornus ammonis; DCX, doublecortin; DG, Dentate Gyrus; GC, granular cell layer; HI, hypoxia-ischemia; Hi, Hilus of the DG; IF, immunofluorescence; INs, Interneurons; IR, immunoreactivity; Lm, Lacunosum Moleculare layer; Mol, Moleculare layer of the DG; NT, normothermia; Or, Oriens Layer; P, post-natal age; PV, Parvalbumin; Py, pyramidal cell layer; Rd, Radiatum layer; TH, therapeutic hypothermia.
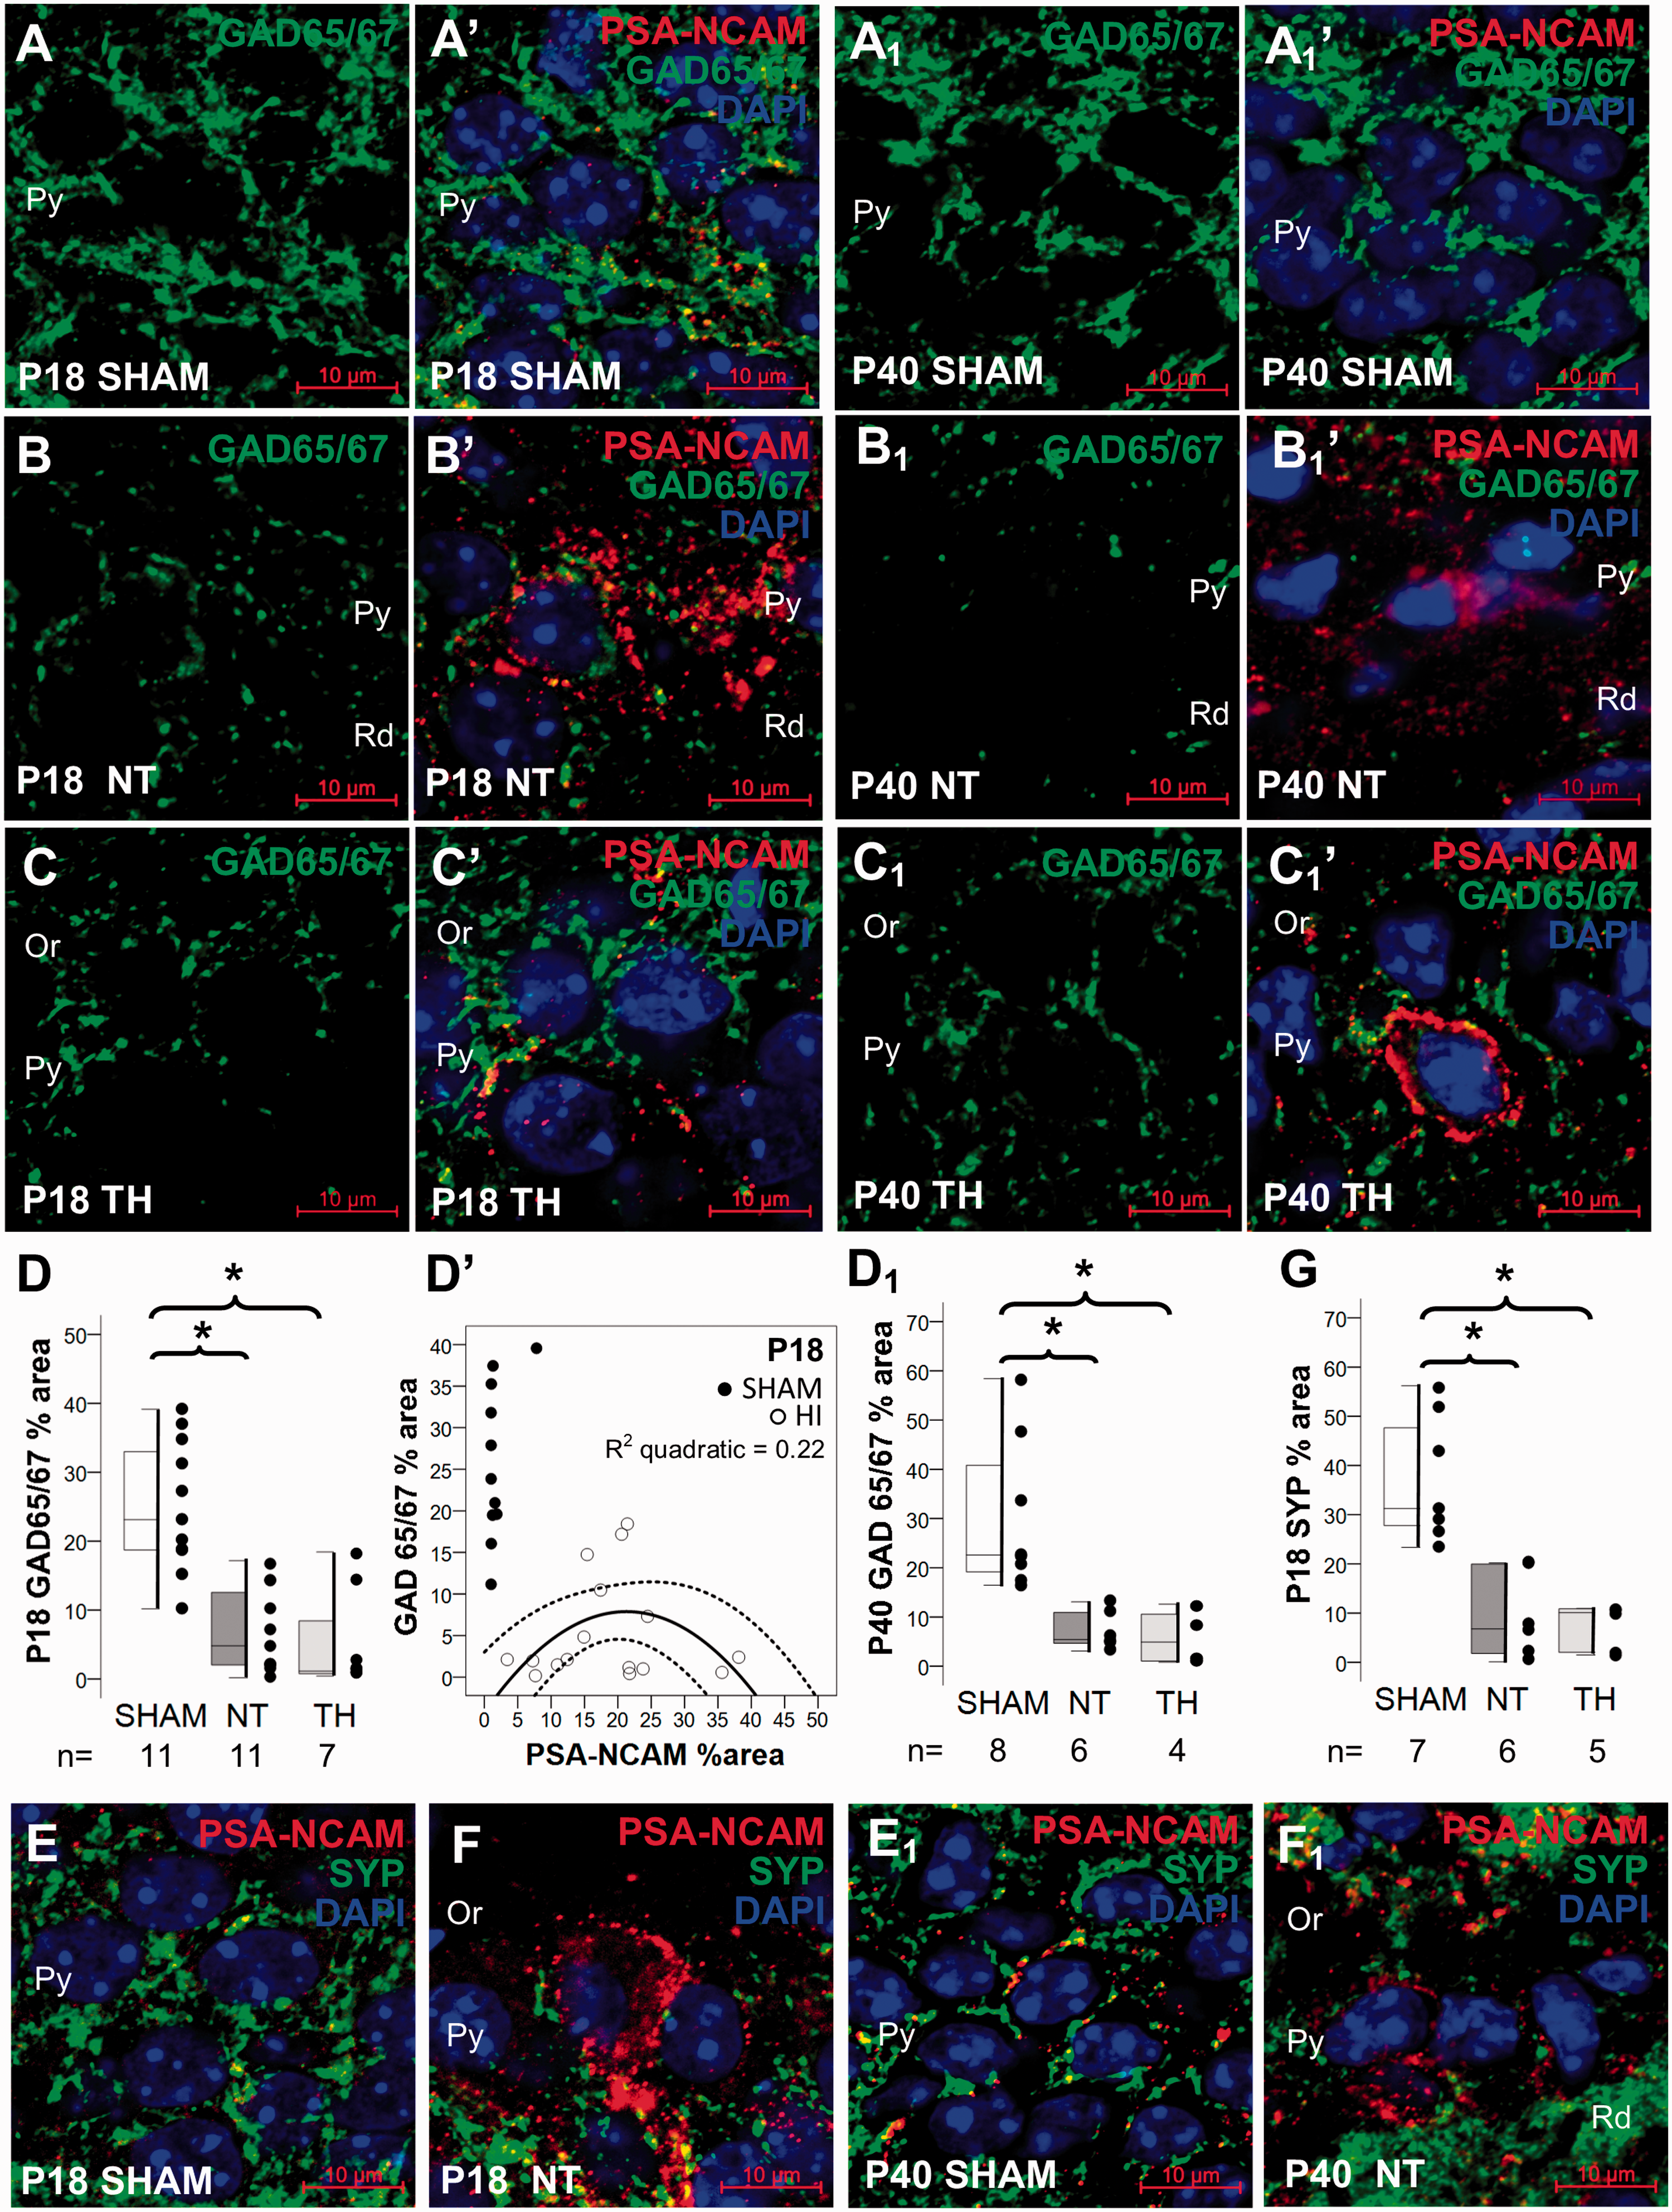
Relationship between PSA-NCAM and presynaptic markers GAD 65/67 and SYP. Double immunolabeling detected GAD65/67 IR in green (Alexa 488 goat anti rabbit), PSA-NCAM IR in red (Alexa 568 goat anti mouse), and DAPI staining in dorsal CA1 pyramidal cell layer, as shown in panels for P18 sham (a), NT (b), and TH (c) and for P40 sham (A1), NT (B1), and TH (C1). Mixed box and whiskers with column scatter plots represent the percent area of GAD 65/67 IR at P18 (D) and at P40 (D1). Boxes are limited by the 75th and 25th percentiles (interquartile range, IQR) and whiskers are limited by the last data point within 1.5 times the IQR from the median (continuous line inside the box), with outliers represented as Δ. Kruskal–Wallis ANOVA with Dunn–Bonferoni post-hoc testing for pair analysis was applied. *P < 0.05. The decrease in GAD65/67 IR (y-axis) had a weak inverted “U-shape” correlation at P18 (y = −4.26 + 1.14x − 0.03x2) with the percent area of PSA-NCAM IR (x-axis) as shown in the scatter plot in d’. Continuous line represents the fitted line derived from a quadratic regression and the discontinuous line represents the 95% CI. Spearman Rho correlation was applied. P < 0.05 was consider significant. Double immunolabeling detected SYP IR in green (Alexa 488 goat anti rabbit), PSA-NCAM IR in red (Alexa 568 goat anti mouse), and DAPI staining in dorsal CA1 pyramidal cell layer, as shown in panels for P18 sham (e) and NT (f) and for P40 sham (e1), and NT (f1). Mixed box and whiskers with column scatter plots represent the percent area of SYP IR at P18 (g). CA, cornus ammonis; CI, confidence interval; HI, hypoxia-ischemia; IR, immunoreactivity; NT, normothermia; Or, Oriens Layer; P, post-natal age; Py, pyramidal cell layer; Rd, Radiatum layer; SYP, Synaptophysin; TH, therapeutic hypothermia.
Relationship between PSA-NCAM and presynaptic markers
At 8-day after HI, CA1 PCL GAD65/67 bouton IR was 78% lower in NT mice than in sham (KW ANOVA P < 0.001; P = 0.01 vs. sham; Figure 3(a) to (d)). At 30-day after injury, there was a loss of GAD65/67 IR by 86% (KW ANOVA P = 0.002; P = 0.009 vs. sham; Figure 3(a1) to (d1)). TH did not attenuate GAD65/67 depletion at either 8 day (P = 0.002, Figure 3(c)) or 30 day (P = 0.01, Figure 3(c1)) after nHI. PSA-NCAM and GAD 65/67 levels in CA1 PCL showed a weak correlation at P18 even with the best-fit regression model (Figure 3(d’)). Thus, although GAD 65/67 IR was reduced in the CA1 PCL of HI mice, regardless of treatment, those with the highest GAD 65/67 IR were those with PSA-NCAM level of ∼20%. No correlation between PSA-NCAM and GAD 65/67 was observed at P40 (data not shown). SYP, a general pre-synaptic marker, was also decreased by 87% by 8d after HI (KW ANOVA P = 0.002, P = 0.007 sham vs. NT; Figure 3(e) to (g)), a deficit that persisted to 30 day (Figure 3(e1) and (f1)). TH had not effect in attenuating the decrease of SYP (Figure 3(g)). SYP IR did not correlate with PSA-NCAM IR (data not shown). No significant change in GAD65/67 or SYP IR was detected in the contralateral hemisphere (hypoxia alone) compared to sham mice (Supplemental Figure 4A and 4B).
Accumulation of intracellular PSA-NCAM relates to neuronal cytoskeletal perturbations after HI
To assess the link between PSA-NCAM accumulation and neuronal pathobiology independent of nuclear pyknosis, we assessed tau phosphorylation. PhosphoSer396 Tau IR was most prominent in the Al, Or, LM, and the polymorphic layer of the DG in the hippocampus only exposed to hypoxia (contralateral to HI injury, Figure 4(a1)), this distribution of baseline phosphoSer396 Tau IR was also found in shams (data not shown). While phosphoSer396 Tau IR in the stratum lacunosum-moleculare and the DG appeared unchanged between contralateral (hypoxia alone, Figure 4(a1)) and ipsilateral (HI) hemispheres, phosphoSer396 Tau IR showed specific changes in the PCL (Figure 4(a2)). At higher magnification, phosphoSer396 Tau was also present in the CA1 PCL contralateral to the injury (gray arrows in Figure 4(a1’)). HI increased the level of phosphoSer396 Tau IR in CA1 PCL (Figure 4(a2’), white arrows with detail). Frequently, neurons with pyknotic nuclei that accumulated cytoplasmic PSA-NCAM were also strongly positive for phosphoSer396 Tau (Figure 4(b1), split channels shown in Figure 4(b1’) and (b1”)). In other instances, neurons expressed either cytoplasmic PSA-NCAM (Figure 4(b2), open arrow) or phosphoSer396 Tau (closed arrow, split channels shown in Figure 4(b2’) and (b2”)). These subsets of cells accumulating PSA-NCAM or manifesting phospho-Tau phenotype may represent different neuronal populations within the CA1. Few dying cells with pyknotic nuclei 30d after HI injury were identified with apparent “spilling” of PSA-NCAM and phosphoSer396 Tau into the parenchyma (arrowhead in Figure 4(b2), shown in detail in Figure 4(b3)). This pattern of immunolabeling was not seen in immunoglobulin negative controls (Supplemental Figure 1). At P40, the number of neurons showing increased phosphoSer396 Tau IR in CA1 was ∼9- to 10-fold greater in HI- mice than in sham mice (KW ANOVA P= 0.002; P = 0.009 NT vs. sham; Figure 4(c1)) without differences between sexes (data not shown). The number of neurons showing increased phosphoSer396 Tau in the CA1 PCL was similar in the hypoxia-alone (contralateral) hemisphere and sham mice (Figure 4(a1’) and (a2’)). Double immunolabeling for PV and phosphoser386 Tau demonstrated phospho-Tau accumulation in PV+ INs in CA1 PCL (Figure 4(c2), Field 1 [F1]) with cell death suggested by pyknosis in phosphoSer396 Tau+ neurons (Figure 4(c3), Field 2 [F2]). The number of CA1 PV+ INs was ∼49% lower HI mice compared to shams (KW ANOVA P = 0.014; P = 0.012 vs. sham; Figure 4(d1)). TH did not attenuate this decrease. These changes were not apparent in the contralateral hemisphere (Figure 4(a1) and (a1’) and supplemental Figure 4C). In PV+ INs, co-labeling with phosphoser396 tau was higher in CA1 of HI mice compared to shams (KW ANOVA P = 0.002; P = 0.02 vs. sham; Figure 4D2; and KW ANOVA P = 0.002; P = 0.004 vs. sham, Figure 4(d3)).
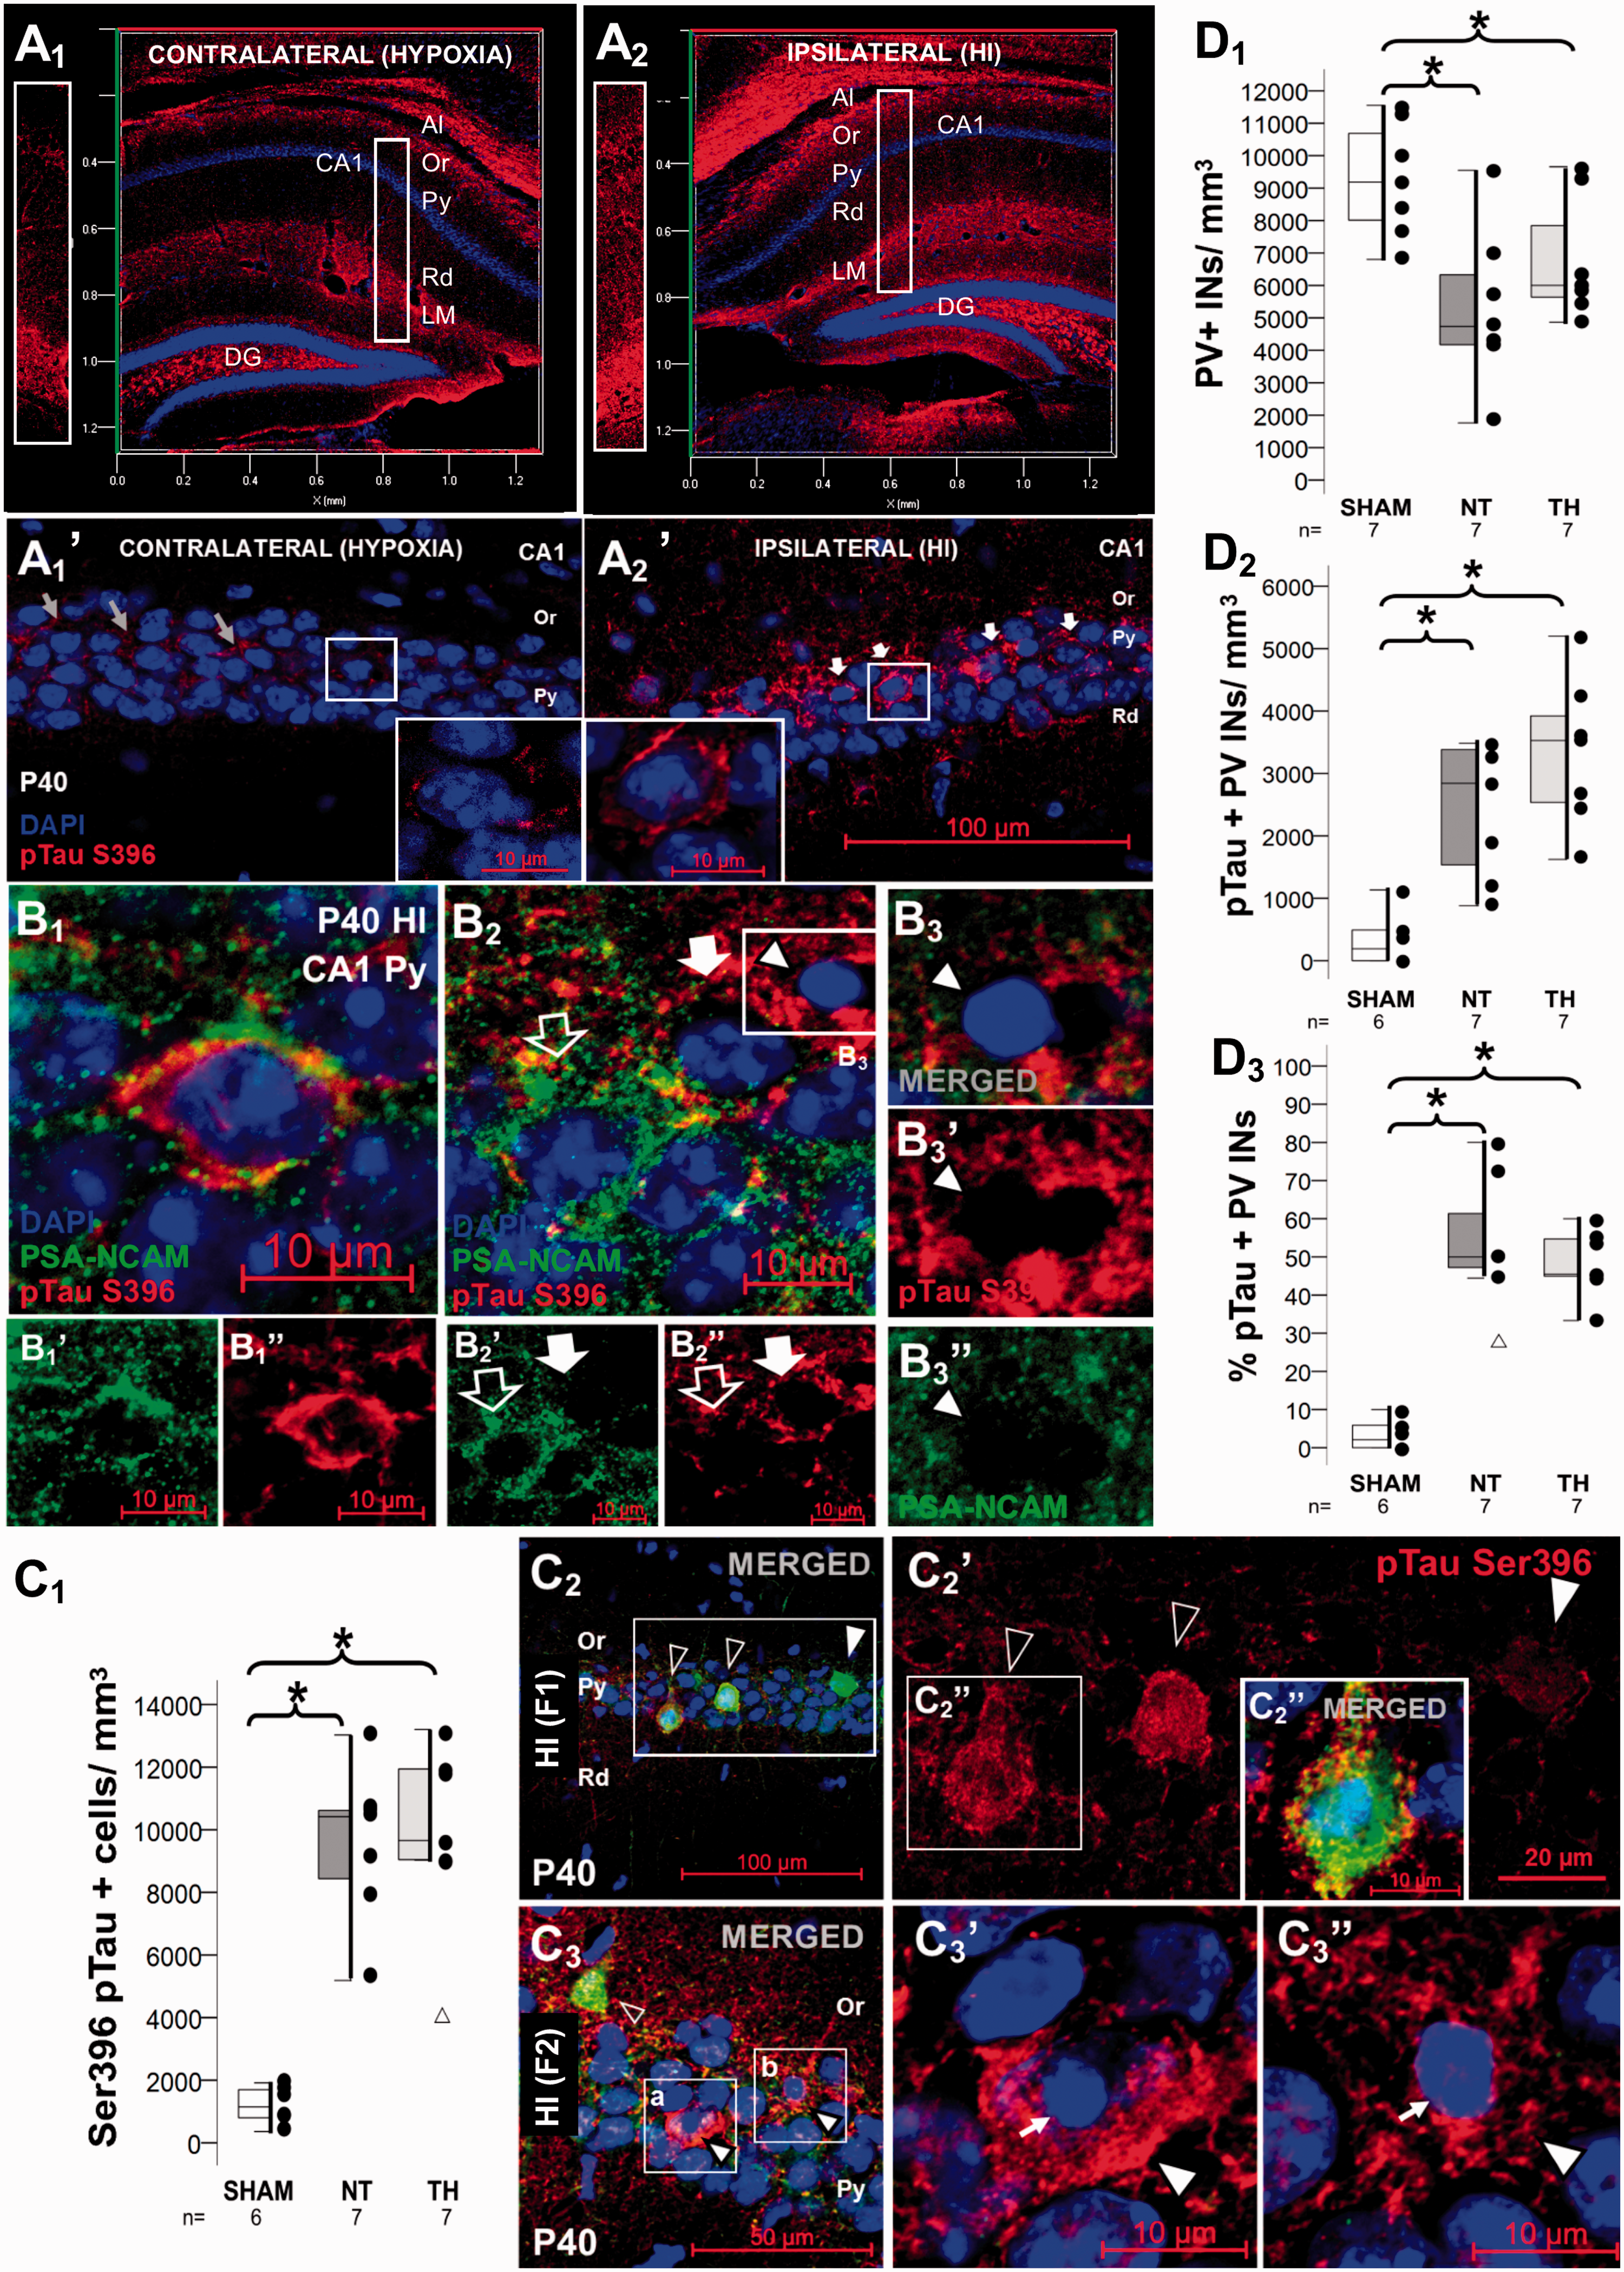
Relationship between accumulation of PSA-NCAM in perikaryal cytoplasm and neuronal cytoskeletal perturbations detected with phosphoSer396 Tau early after HI. Baseline expression of phosphoSer396 Tau at P40 are shown in 3D reconstruction from z-stack with transparent rendering in panels a1 (contralateral, hypoxia alone) and a2 (ipsilateral, HI). Detail panels of the dorsal CA1 are shown in vertical panels across hippocampal CA1 layers left to panels a1 and a2, and in panels a1’ and a2’ with phosphoSer396 Tau shown in red (Alexa 568 goat anti rabbit). Double immunolabeling detected PSA-NCAM IR in green (Alexa 488 goat anti mouse), phosphoSer396 Tau IR in red (Alexa 568 goat anti rabbit), and DAPI staining in P40 dorsal CA1 pyramidal cell layer, as shown in panels b. While some cells are co-labeled with PSA-NCAM and phosphoSer396 Tau (b1), others expressed either PSA-NCAM (open arrow in b2) or phosphoSer396 Tau (closed arrow in b2). Some showed clear evidence of cell death suggested by nuclear pyknosis (b3, arrow head) with spillage of cytosolic contents (red and green channels are shown in b3’ and b3”, respectively). Double immunolabeling detected PV IR in green (Alexa 488 goat anti chicken), phosphoSer396 Tau IR and in red (Alexa 568 goat anti rabbit), and DAPI in HI injured P40 dorsal CA1 pyramidal cell layer, as shown in panels c2 (Field 1) and c3 (Field 2). Many PV+INs showed high phosphoSer396 Tau IR (open arrow heads in c2, showed in detail in c2’ and c2”), while others showed minimal phosphoSer396 Tau IR (closed arrow head in c2 and c2”). In the same mouse, many phosphoSer396 Tau + cells with pyknotic nuclei (white arrow in c3’and c3”) are found that do not express PV (closed arrow heads in c3, c3’, and c3”). Mixed box and whiskers with column scatter plots represent the number of phosphoSer396 Tau+ cells per mm3 (c1); the number of PV+ interneurons (INs) per mm3 (d1), the number of PV+ INs that are phosphoSer396 Tau+ per mm3 (d2), and the percent of PV+ INs that are phosphoSer396 Tau+ (d3). Boxes are limited by the 75th and 25th percentiles (interquartile range, IQR) and whiskers are limited by the last data point within 1.5 times the IQR from the median (continuous line inside the box), with outliers represented as Δ. Kruskal–Wallis ANOVA with Dunn-Bonferoni post-hoc testing for pair analysis was applied. *P < 0.05. Al, Alveus; CA, cornus ammonis; DG, Dentate Gyrus; F, field; HI, hypoxia-ischemia; INs, Interneurons; IR, immunoreactivity; LM, Lacunosum Moleculare layer; NT, normothermia; Or, Oriens Layer; P, post-natal age; PV, Parvalbumin; Py, pyramidal cell layer; Rd, Radiatum layer; TH, therapeutic hypothermia.
Localization of PSA-NCAM relate to axonal plasticity
At P18, GAP43 IR, a pre-synaptic marker enriched in axonal growth cones during development and plasticity, 44,45 was increased 2.7-fold in the CA1 of HI mice (KW ANOVA P = 0.008; P = 0.04 NT vs. sham; Figure 5(a) to (d1)). Although lesser in magnitude, GAP 43 IR remained increased in the CA1 PCL at P40, 30d after HI (KW ANOVA P = 0.01; P = 0.04 NT vs. sham, Figure 5(d2)). At both times, elevated GAP43 was also found in those HI mice treated with TH (P = 0.01 vs. sham). GAP43 was unchanged in the contralateral hemisphere (Supplemental Figure 4D, compared to Figure 5). The pattern of PSA-NCAM localization within neurons of the CA1 PCL was associated with the abundance of GAP43 after HI injury. PSA-NCAM enrichment marginalized near the membrane of some cells appeared related to adjacent GAP43+ axonal processes (Figure 5(b1)); in contrast, accumulation PSA-NCAM throughout the cytoplasm of cells appeared associated with lower presence of GAP43+ boutons (Figure 5(b2)). Surface rendering 3D reconstruction better illustrated PSA-NCAM compartment distribution peripherally (Figure 5(b1.a)) and cytoplasmic (Figure 5(b2.a)) and the relative GAP43 abundance. The abundance of these cells accumulating PSA-NCAM in the cytoplasm within the CA1 PCL is also shown in Supplemental Figure 2.
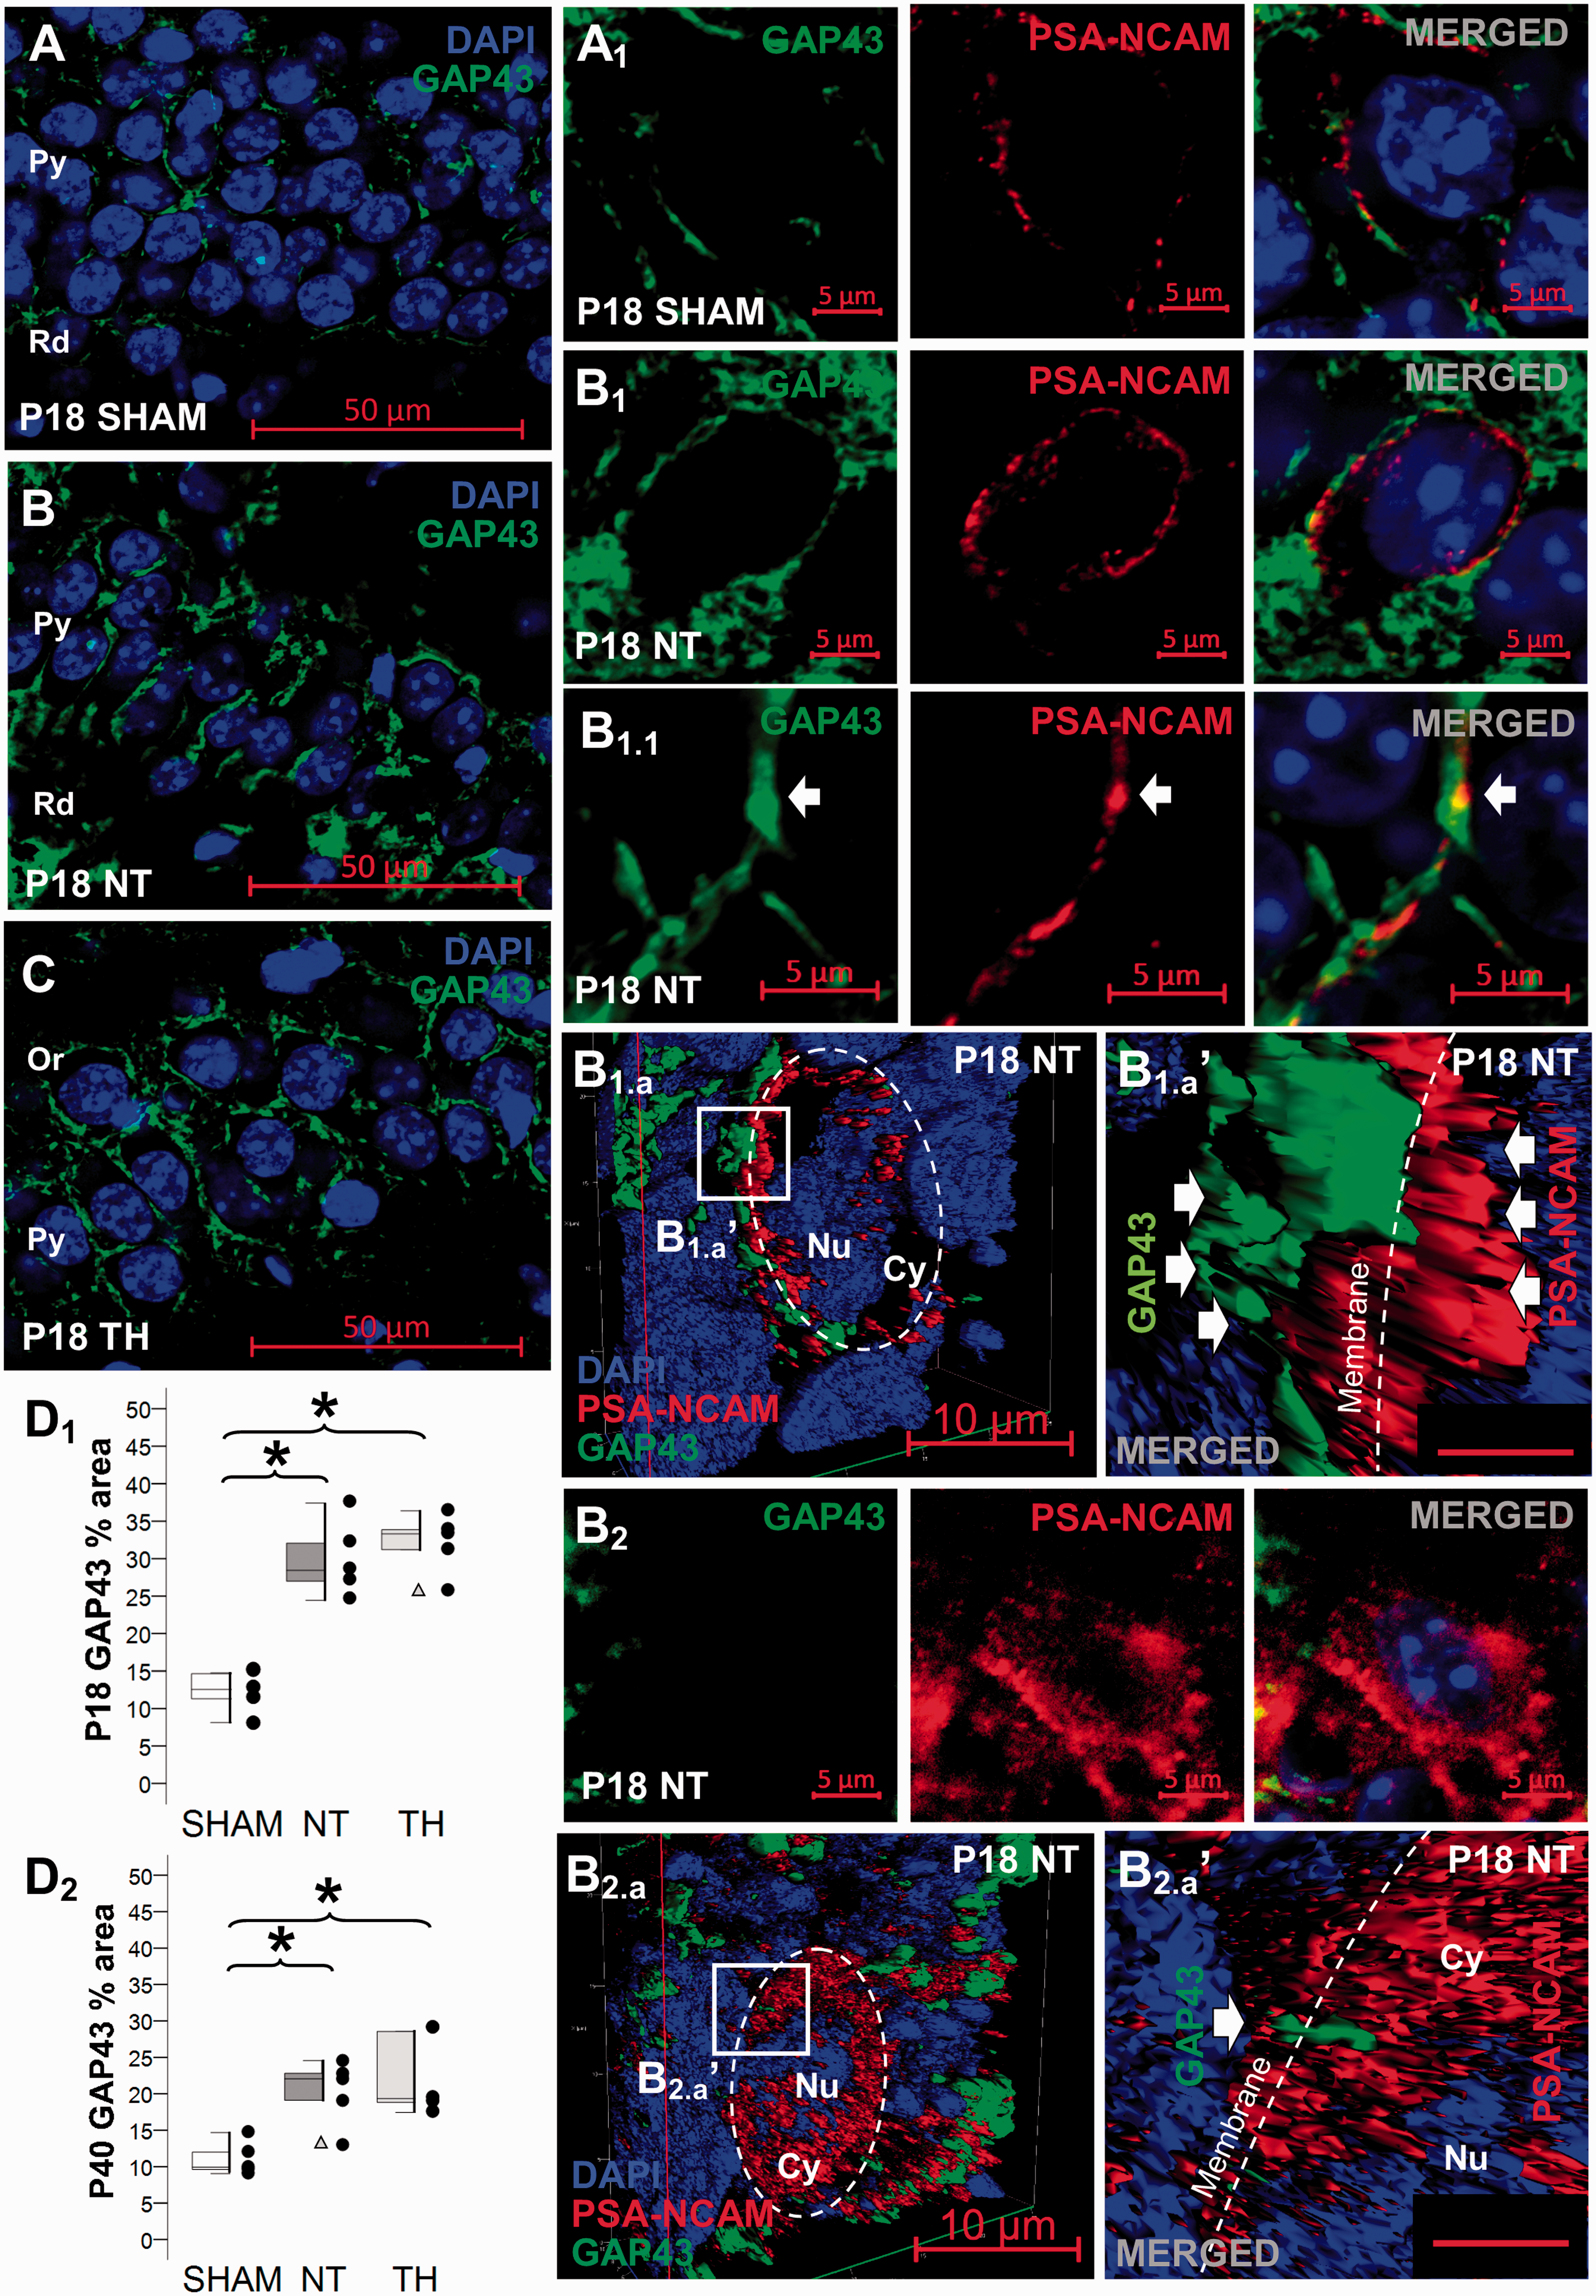
Location of PSA-NCAM may determine axonal plasticity. Baseline expression of GAP43 at P18 are shown for sham (a), NT (b), and TH (c). Mixed box and whiskers with column scatter plots represent the percent area of GAP43 IR at P18 (d1) and P40 (d2). Boxes are limited by the 75th and 25th percentiles (interquartile range, IQR) and whiskers are limited by the last data point within 1.5 times the IQR from the median (continuous line inside the box), with outliers represented as Δ. Kruskal–Wallis ANOVA with Dunn–Bonferoni post-hoc testing for pair analysis was applied. *, P < 0.05 (n = 5 per group). To study the relation between PSA-NCAM and GAP43 we performed double immunolabeling detected GAP43 IR in green (Alexa 488 goat anti rabbit), PSA-NCAM IR in red (Alexa 568 goat anti mouse), and DAPI staining in P18 dorsal CA1 cells of the pyramidal cell layer. In high magnification images (400×), a pattern of PSA-NCAM marginalized towards the membrane in close proximity to GAP43+ axonal processes was found in neurons of the CA1 pyramidal cell layer of sham (a1) and in some neurons of injured mice treated with NT (b1 and b1.1). Z-stacks were then taken to identify the compartment location of PSA-NCAM in relationship with GAP43 in single cells using 3D reconstruction surface rendering. Abundant GAP43+ axonal processes were found adjacent to cell surface of neurons demonstrating PSA-NCAM marginalized near the membrane (b1.a and b1.a’). In contrast, cells demonstrating PSA-NCAM accumulation in the perikaryal cytoplasm (b2), better shown in the 3D reconstruction surface rendering image (b2.a and b2.a’), had lower GAP43+ axonal processes. Bar =2 µm in b1.a’ and b2.a’. CA, cornus ammonis; GAP43, growth associated protein 43; HI, hypoxia-ischemia; IR, immunoreactivity; NT, normothermia; Or, Oriens Layer; P, post-natal age; Py, pyramidal cell layer; Rd, Radiatum layer; TH, therapeutic hypothermia.
Correlations between PSA-NCAM enrichment after neonatal HI and glial activation
In response to HI, the overall area of GFAP IR increased fourfold at P11 (KW P = 0.002; P = 0.002, NT vs. sham; Figure 6(a1–3)) and remained increased at P18 (KW P = 0.002; P = 0.002, NT vs. sham; Figure 6(b1–3)), and at P40 (KW P = 0.01; P = 0.001, NT vs. sham; Figure 6(c1–3)). However, the cellular distributions and staining patterns for GFAP progressed from diffuse (Figure 6(a2) and (b2)) at P11 and P18, to clustered at P40, forming well-defined astrocytic scars (Figure 6(c2)). Although the astrocytic response in TH-treated HI mice was also increased compared to sham at P11 (Figure 6(a3)), this increase was not significant at P18 and P40 (Figure 6(b3) and (c3)). At all timepoints, the percent areas of GFAP IR in the CA1 PCL in TH-treated HI mice trended to be lower than the response found in NT-treated mice. PSA-NCAM and GFAP co-localization was minimal at any time point, but PSA-NCAM IR directly correlated with GFAP IR at P11 (R2 = 0.86, P < 0.001; Figure 6(a4)), and also at P18 (R2 = 0.609, P = 0.005; Figure 6(b4)). The correlation between PSA-NCAM and GFAP was lost at P40, time point when most PSA-NCAM staining occurred in CA1 PCL (Figure 6(c4)).
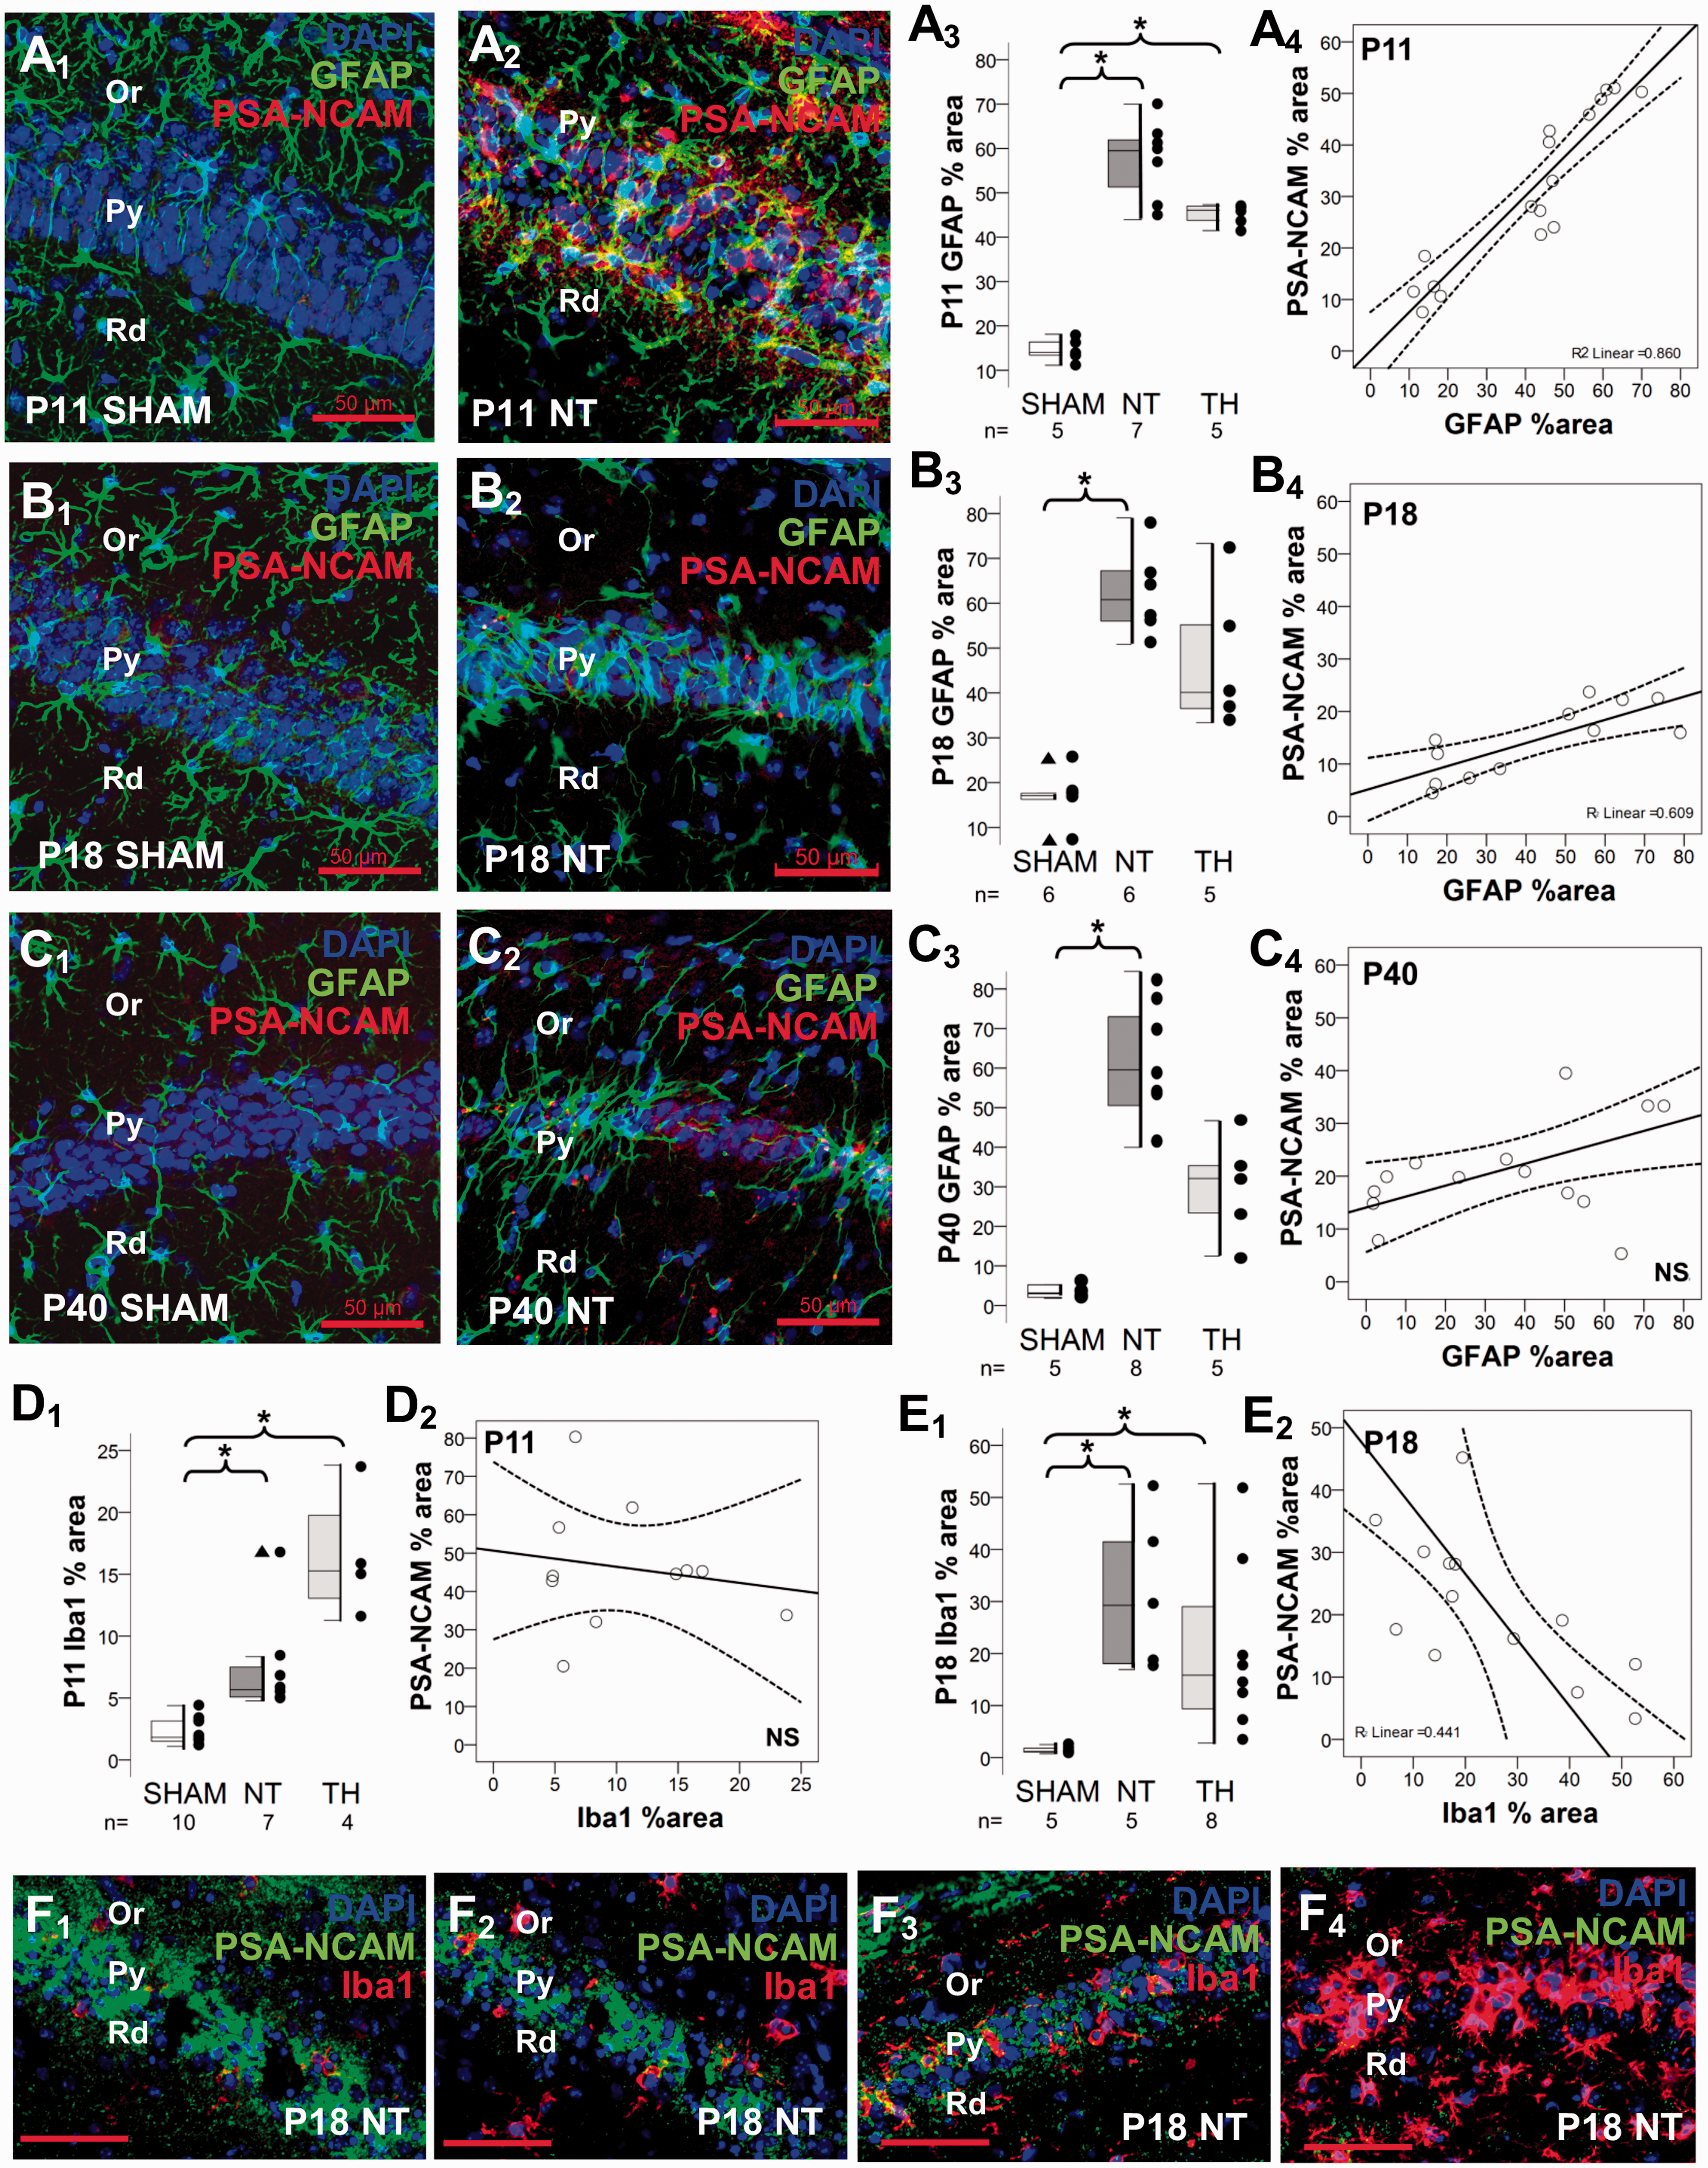
Correlations between PSA-NCAM IR and astroglial and microglial activation. Double immunolabeling detected GFAP IR in green (Alexa 488 goat anti chicken), PSA-NCAM IR in red (Alexa 568 goat anti mouse), and DAPI staining in the dorsal CA1 pyramidal cell layer of P11 sham (a1) and NT (a2), P18 sham (b1) and NT (b2), and P40 sham (c1) and NT (c2). Mixed box and whiskers with column scatter plots represent the percent area of GFAP IR at P11 (a3), P18 (b3) and P40 (c3). Boxes are limited by the 75th and 25th percentiles (interquartile range, IQR) and whiskers are limited by the last data point within 1.5 times the IQR from the median (continuous line inside the box), with outliers represented as Δ. Kruskal–Wallis ANOVA with Dunn–Bonferoni post-hoc testing for pair analysis was applied. *P < 0.05. The increase in percent area of PSA-NCAM IR (y-axis) was directly correlated with the percent area of GFAP IR (x-axis) as shown in the scatter plots at P11 (a4) and P18 (b4). Correlation was lost by P40 (c4). Continuous line represent the fitted line derived from a linear regression and the discontinuous line represent the 95% CI. Spearman Rho correlation was applied. P < 0.05 was consider significant. Mixed box and whiskers with column scatter plots was also used to represent the percent area of Iba1 IR at P11 (d1), and P18 (e1). While no correlation was found between percent area of PSA-NCAM (y-axis) and Iba1 (x-axis) IRs at P11 (d2), an inverse correlation between them was found at P18 (e2), which is exemplified in panels f1 to f4. In those images PSA-NCAM IF is green (Alexa 488 goat anti mouse) and Iba1 is red (Alexa 568 goat anti rabbit). CA, cornus ammonis; GFAP, glial fibrillary acidic protein; HI, hypoxia-ischemia; Iba-1, ionized calcium-binding adapter molecule-1; IR, immunoreactivity; NT, normothermia; Or, Oriens Layer; P, post-natal age; Py, pyramidal cell layer; Rd, Radiatum layer; TH, therapeutic hypothermia.
Similar to GFAP, Iba1 area of IR was increased 2.5-fold 24 h after neonatal HI in NT-treated mice (KW P < 0.001; P = 0.01, NT vs. sham; Figure 6(d1)). TH further increased Iba1 area of IR 6-fold compared to sham (P = 0.001) and threefold compared to NT-treated mice. Between P11 and P18, the percent area of Iba1 IR within the CA1 PCL increased fivefold in NT-treated mice (P = 0.005), while it was unchanged in TH-treated mice (P = 1.0; Figure 6(d1) vs. (e1)). As result, at P18, Iba1 IR was 14-fold higher in NT-treated mice than in sham (KW P = 0.004; P = 0.004 vs. sham, Figure 6(e1)), and remained sixfold higher in TH-treated than in sham (P = 0.02 vs. sham). Unlike GFAP, Iba1 IR did not correlate with PSA-NCAM at P11 in injured mice (Figure 6(d2)). However, at P18 percent area of Iba1 IR inversely correlated with PSA-NCAM (R2 = 0.44, Spearman P = 0.02; Figure 6(e2)). Representative illustrations of the inverse relationship between PSA-NCAM and Iba1 IR at P18 in NT-treated HI mice CA1 PCL are shown in Figure 6(f1) to (f 4 ), where the lower the PSA-NCAM (green channel), the higher the level of Iba1 IR (red channel).
PSA-NCAM is detected in serum of peripheral blood from nHI-injured mice
Using the same PSA-NCAM antibody used for IF-IHC, we detected a ∼250 kDa band in serum samples (250 µg in ∼4 to 8 µl of serum was loaded per lane), which matched the molecular weight documented in forebrain crude homogenates. In shams, serum PSA-NCAM levels increased between P11 to P18, and then decreased at P40 (Figure 7). While at P11 serum PSA-NCAM levels were higher after nHI, at P40 levels were highly variable in injured mice. Representative P40 blots from two P40 extreme sets (out of three sets) are shown in Figure 7. At P40, the increase in serum PSA-NCAM levels appeared milder in TH-treated than in NT-treated nHI-injured male and female mice.
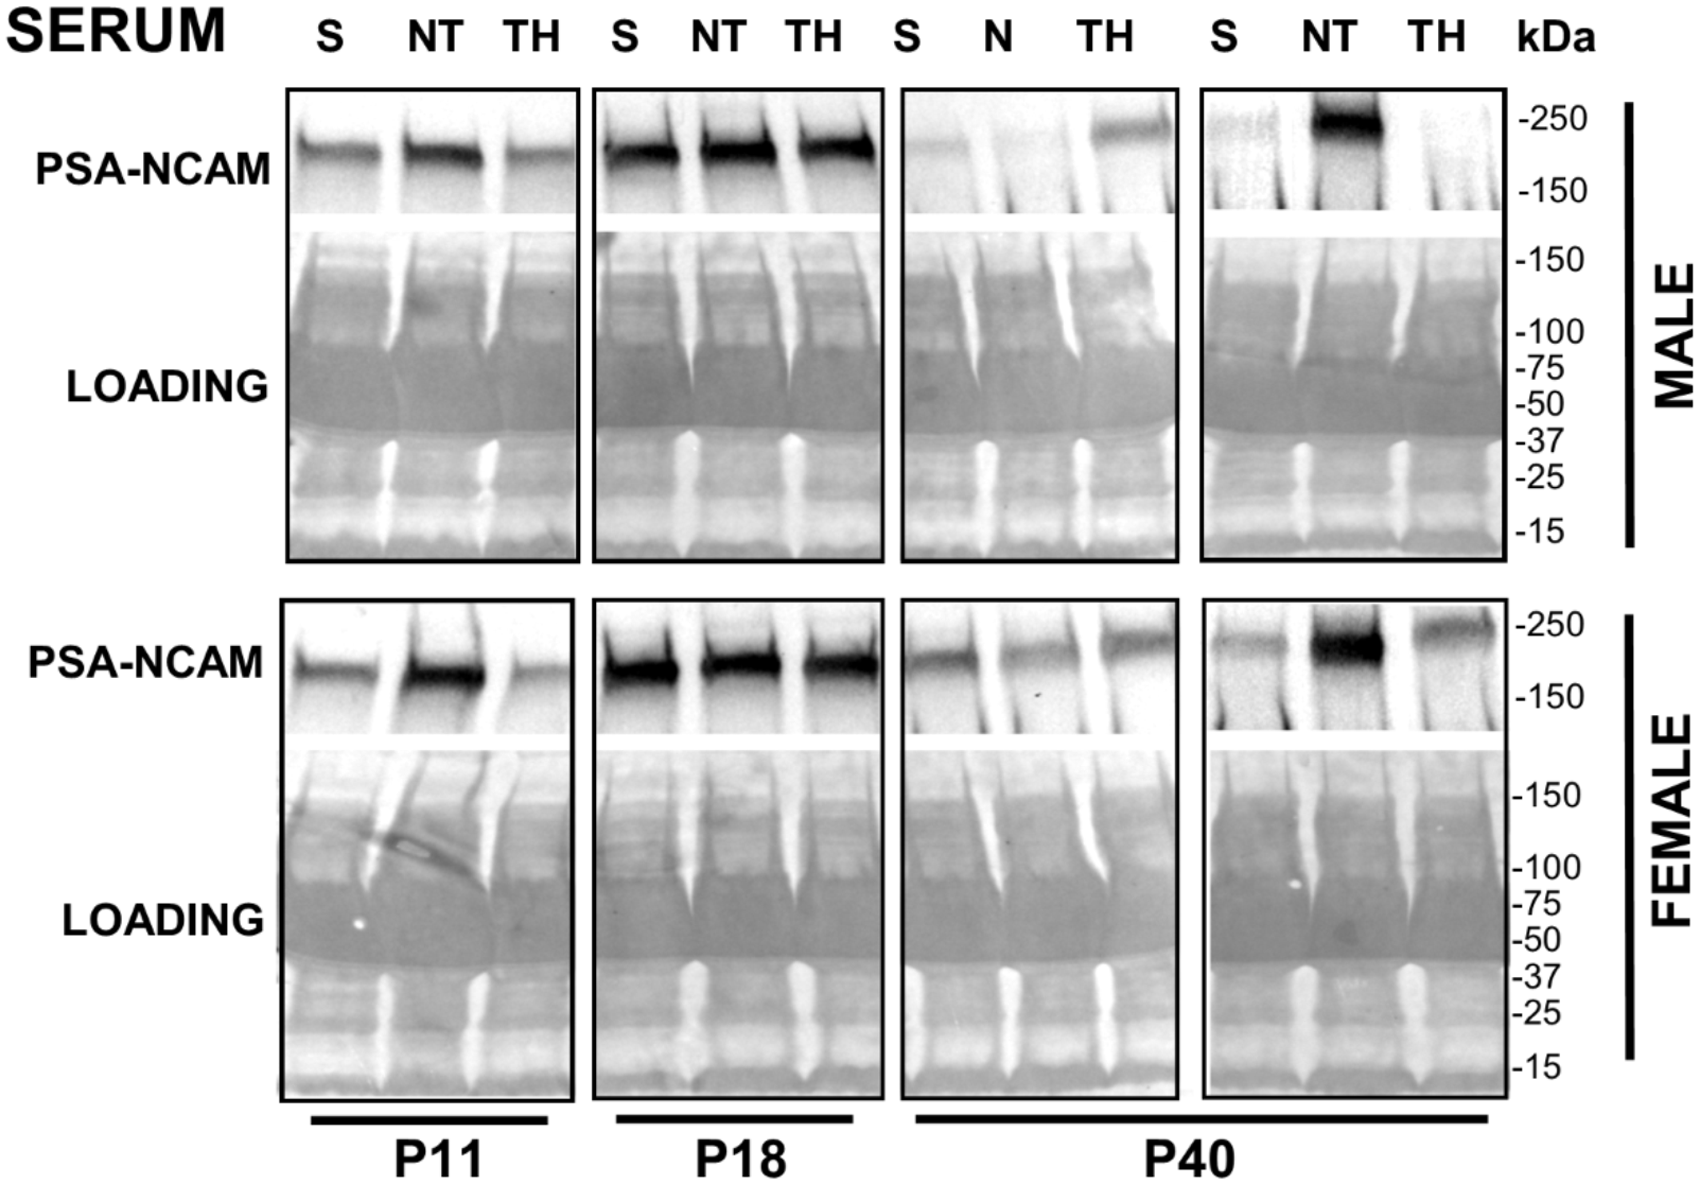
Serum PSA-NCAM levels in anesthesia-exposed shams and nHI-injured mice at P11, P18, and P40. PSA-NCAM band at ∼250 kDa is shown in representative western blots of serum for male and female mice. P40 blots represent the extreme examples out of three experiments. Sample loading and protein transfer was verified by staining nitrocellulose membranes with Ponceau S before immunoblotting, shown here. kDa, kilodalton; NT, normothermia; S, sham; TH, therapeutic hypothermia.
Discussion
Here, we report that after nHI brain injury PSA-NCAM IR increases acutely and persistently in the dorsal CA1 PCL. This neuropathological finding might be related to greater serum PSA-NCAM protein levels. The increased PSA-NCAM IR correlated with the acute destruction of CA1 PCs at P11 and the delayed PCL atrophy at P18. Degenerating CA1 PCs and PV+INs show variable degrees of perikaryal PSA-NCAM accumulation as early as P18, while phosphoSer396 tau accumulation occurs at P40. Surprisingly there is no correlation between PSA-NCAM IR and presynaptic markers, including GAD65/67, which were persistently decreased after nHI. These findings suggest that after nHI, PSA-NCAM is a neuropathological marker of early brain injury and neurodegeneration that correlates with the amount of cell death, atrophy and astrogliosis in the dorsal CA1, but does not correlate with the significant CA1 PCL synaptic bouton loss. TH may attenuate the increase in PSA-NCAM, GFAP and Iba1 IR, but these effects are incomplete and do not result in preservation of synaptic buttons or prevention of late neurodegeneration. Thus, even with TH, PSA-NCAM may serve as a serum biomarker of early and ongoing nHI injury, response to therapy, and later neurodegeneration.
This is the first study reporting PSA-NCAM changes in the nHI-injured hippocampus. PSA-NCAM IR in CA1 PCL was acutely and persistently increased. This enhanced PSA-NCAM IR was independent of the hippocampal neural progenitor cell niche and was mostly associated with CA1 PCs. Previous work has focused on PSA-NCAM in adult rat and gerbil models of global or focal ischemia in the context of neural progenitor cells.46,47 One study showed higher PSA-NCAM in neurons after traumatic brain injury in adult mice. 48 Although INs and astrocytes also express small amounts of PSA-NCAM, 49 in our model of nHI, neither PV+INs, astrocytes nor microglia were identified as significant cellular sources of PSA-NCAM IR. Since PV+ INs are the most abundant INs located within the CA1 PCL (see Supplemental Figure 1), it is unlikely that other IN subpopulations are the source of acute PSA-NCAM increase. The abundance and distribution of PSA-NCAM IR suggest that PCs are the main source of acute increase after nHI. PSA-NCAM IR, which was mostly marginalized to the membrane at early stages after nHI, accumulated overtly in the cytoplasm in an increasing number of neurons between 8 and 30 days after the initial insult at P10. This finding suggests impaired intracellular transport of PSA-NCAM produced in the ER-Golgi system to the membrane, 49 aberrant degradation pathways, or altered half-life of protein. Impaired intracellular trafficking is a well-described event reported in many models of human neurodegenerative disorders including nHI.50–54 Additionally, cytoplasmic accumulation of PSA-NCAM after nHI may be a marker of delayed or late ER stress with persistent unfolded protein response and entrapment of PSA-NCAM and other proteins, a pathological event described previously by our group. 55
An important finding was the relationship between PSA-NCAM level and severity of HI injury. There is a direct correlation between PSA-NCAM IR and the number of pyknotic nuclei (cell death) and overall decreased residual CA1 PCL area at 24 h and 8 d after the insult, respectively. In our system, DAPI nuclear staining of chromatin “condensation” was not informative due to the inability to clearly differentiate areas of greater condensation surrounding the nucleolus as a form of apoptosis, and thus, overall nuclear pyknosis was used as an assessment of cell death. The biological function of the PSA-NCAM increase is unknown. Knowing that PSA-NCAM remodels apical dendrites of CA1 and CA3 PCs in CA1 to limit arborization and attenuate the effects of glutamate excitotoxicity and free radical production, 56–58 early PSA-NCAM increase may attenuate excitatory inputs to the CA1 to limit further excitotoxic injury after nHI.
In our study, we used a combination of phosphoSer396Tau staining and nuclear phenotype to identify neuronal degeneration. Tau hyperphosphorylation is a neuropathological indication of cytoskeletal disruption and neurodegeneration in many human diseases (i.e., Alzheimer’s disease) and traumatic encephalopathies.59,60 However, phosphorylation of Ser 396 site of the tau protein is also essential for preservation of hippocampal long-term depression and spatial reversal learning; 61 and thus, phosphoSer396Tau in rodent is not an unequivocal histological marker of neurodegeneration by itself. In this regard, phosphoSer396Tau was detected at baseline in the CA1 PCL and in the neuropil of the oriens and radiatum layers and the stratum lacunosum-moleculare. Thirty days after nHI, neurons showing evidence of degeneration (pyknosis) had greater cytoplasmic accumulation of phosphoSer396Tau, PSA-NCAM, or a combination of both. This accumulation occurred in CA1 PCs and PV+ INs. These observations suggest that PSA-NCAM and phosphoSer396Tau accumulations are unrelated events, but both are markers of neurodegeneration, with PSA-NCAM accumulation notably occurring at earlier stages (P18).
Neonatal HI persistently decreases GAD65/67 IR by over 75% in dorsal CA1 PCL 30d after HI and TH does not prevent this deficit. These findings complement our previous report describing delayed deficits 8 d after nHI1 and is similar to effects of glutamate excitotoxicity in hippocampal neurons. 62 Because PSA-NCAM decline triggers the maturation of inhibitory GABAergic circuits, we hypothesized that PSA-NCAM would be inversely correlated with GAD65/67. However, the correlation between GAD65/67 and PSA-NCAM expressions was modest, likely because the compartment at which PSA-NCAM accumulates is greatly variable at delayed and late stages after nHI and thus, PSA-NCAM function as it relates to synaptic plasticity might also be variable. Despite persistent deficits in GAD65/67 and SYP after nHI, the increased in GAP43+ synaptic boutons suggests persistent potential for axonal plasticity after the insult. GAP43 is more abundant in neurons demonstrating marginalized PSA-NCAM, while GAP43 is minimal when PSA-NCAM accumulates in the cytosol. The link between PSA-NCAM and GAP43 has been described in fetal and neonatal rodent brain and neuronal cultures.45,63 In adult rats, PSA-NCAM and GAP43 co-expression is linked to regenerative capacities following hypothalamic injury. 64 In hippocampal neurons, overexpression of GAP43 potentiates neurite extension, via functional association with NCAM-180. 44 Thus, it is possible that PSA-NCAM marginalized to the membrane of PCs serves as a marker of overall neuronal “health” and the ability to proceed with axonal regeneration in this model of nHI injury.
PSA-NCAM IR in glial cells was negligible in this study. However, PSA-NCAM and GFAP IRs directly correlated, reinforcing the concept that PSA-NCAM is linked to severity of nHI brain injury as detected by astrogliosis. As expected Iba1 IR increases in the injured CA1, but surprisingly 24 h after nHI TH-treated mice show greater increases. This finding may suggest that TH provides protection to the local ramified microglia, which may have a neuroprotective role.65,66 Following the acute phase, at P18, the abundance of infiltrating activated microglia increases. Unlike GFAP, Iba1 inversely correlated with PSA-NCAM IR 8 d after nHI. This delayed inverse relationship may suggest a modulatory role of neuronal PSA-NCAM in microglia activation and perhaps infiltration. This hypothesis is supported by cell culture data from LPS-activated murine microglia-neuron co-culture paradigm showing PSA-NCAM present on the surface of neurons binds to sialic acid-binding Ig superfamily lectins, specifically Siglec-11 (CD33-related), present at the microglia surface. 67 This signaling inhibits the transcription of pro-inflammatory mediators IL-1β and inducible NOS leading to neuroprotection. 67 Thus, PSA-NCAM marginalized to the neuronal membrane 8d after nHI may serve as an immunomodulator limiting microglia activation and infiltration.
TH may modulate some effects of nHI reported here in the CA1 PCL. We have reported that despite persistent neocortical protection afforded by TH in this murine model, TH does not provide persistent structural protection to the hippocampus beyond P183 and does not prevent either delayed hippocampal GABAergic deficits 1 , or later memory deficits.2–4 In a fetal sheep model of TH, Gunn et al. described a similar partial hippocampal protection after nHI. 11 These pre-clinical results are consistent with outcomes documented from TH randomized clinical trials after HIE in humans, where motor rescue contrasted with persistent cognitive impairments,5,68 which are likely linked to persistent injury of the hippocampus. 12 Here, we show that TH appears to attenuate the increase in PSA-NCAM, GFAP, and Iba1 in the CA1 PCL after nHI, suggesting an attenuation of hippocampal parenchymal destruction, similar to reports by others,69–71 perhaps leading to an attenuation in PSA-NCAM increase. However, TH neither prevents the marked decrease in GAD 65/67 or SYP at P18 and P40, nor limits the increase in the number of phosphoSer396Tau+ cells in the CA1 PCL at P40, perhaps explaining the reported persistent memory deficits in animals models and humans
In our experiments, PSA-NCAM is detected in peripheral blood serum and its level may increase acutely after nHI (24 h) despite TH and may variably persist to early adulthood (P40) in mice of both sexes. While we interpret this potential elevation as the result of the release of PSA-NCAM from the nHI-injured brain, other sources could be the peripheral nervous system 72 or other tissues (i.e., NK cells, 73 cardiomyocytes, 74 or adipocytes 75 ). In humans, PSA-NCAM is detected in serum and its level progressively decreases after early development. 76 Serum PSA-NCAM levels may become elevated in patients with glioblastoma, 77 meduloblastoma,78,79 and other pediatric CNS tumors. 80 Due to limitations in rodent blood drawing techniques, we are unable to monitor serum PSA-NCAM levels longitudinally after injury and correlate levels with end-point neuropathology. We find a subset of mice in which serum PSA-NCAM remains elevated 30 d after nHI, whether this elevation is the result of more prominent ongoing brain plasticity, including axonal regeneration, or persistent neurodegeneration (with perikaryal accumulation) remains under investigation.
We acknowledge several limitations in this study. The mechanism by which PSA-NCAM increases and the biological function in the hippocampus after nHI are not addressed here. A behavioral correlate to the changes in PSA-NCAM after nHI was not possible because mice were killed before testing was feasible.2–4 Although increased PSA-NCAM persists until P40, the intracellular localization is heterogeneous among cells in the PCL, thus behavioral correlations would be challenging at this later time point. Similar challenges applied when establishing correlations between PSA-NCAM and GAD65/67 or SYP because only PSA-NCAM localized in the cellular membrane modulate synaptogenesis. Another mechanistic aspect that needs study is the cascade that leads to PSA-NCAM cytosolic accumulation and its correlation with serum PSA-NCAM levels. Lastly, we acknowledge that in the mouse model of nHI brain injury, hippocampal damage is often temporally accelerated and spatially more severe than that seen in humans with HIE, and thus extrapolation of our results to human pathology is uncertain.
We conclude that PSA-NCAM is a neuropathological marker for nascent neurodegeneration that is evident as early as 8 d after nHI brain injury in the mouse. Additionally, serum PSA-NCAM levels may serve as a biomarker to determine severity of acute nHI brain injury, response to therapy, and delayed ongoing neurodegeneration. Increased PSA-NCAM is likely an acute generic response to nHI insult of the hippocampus. PSA-NCAM marginalized to the membrane may protect the surviving PCs by modulating microglia, as suggested by the inverse correlation with Iba1, and may facilitate axonal plasticity after nHI injury, as suggested by the increased GAP43+ boutons found contiguous to PSA-NCAM. However, impaired intracellular trafficking in injured neurons may lead to aberrant PSA-NCAM accumulation in the perikaryal cytoplasm aggravating neuronal degeneration in the CA1. PSA-NCAM accumulation precedes phosphoSer396Tau accumulation only observed 30d after nHI. Altogether, PSA-NCAM may be an early immunomodulatory signal expressed by PCs in a magnitude proportional to the severity of nHI injury to attenuate microglia activation and infiltration and facilitate axonal plasticity, but later it may become a marker of overall neuronal viability, with neurons demonstrating cytosolic PSA-NCAM accumulation in their progression to neurodegeneration. The translational aspects of these neuropathological findings and their correlation with persistently increased serum PSA-NCAM levels after nHI need further investigation.
Supplemental Material
sj-pdf-1-jcb-10.1177_0271678X20942707 - Supplemental material for Accumulation of PSA-NCAM marks nascent neurodegeneration in the dorsal hippocampus after neonatal hypoxic-ischemic brain injury in mice
Supplemental material, sj-pdf-1-jcb-10.1177_0271678X20942707 for Accumulation of PSA-NCAM marks nascent neurodegeneration in the dorsal hippocampus after neonatal hypoxic-ischemic brain injury in mice by Raul Chavez-Valdez, Charles Lechner, Paul Emerson, Frances J Northington and Lee J Martin in Journal of Cerebral Blood Flow & Metabolism
Footnotes
Funding
The author(s) disclosed receipt of the following financial support for the research, authorship, and/or publication of this article: National Institutes of Health (KO8NS096115, 3K08NS096115-03S1 – RC-V and RO1HD070996, RO1HD086058, R21AG061643 - FJN.), the JHU-SOM Clinician Scientist Award – RC-V, the Sutland-Pakula Endowment for Neonatal Research - RC-V, and the JHU Alzheimer’s Disease Research Center (AG005146 – LJM).
Acknowledgements
The authors thank Deborah Flock and Mark St. Pierre for their technical support and Rosie Silva for her administrative assistance.
Declaration of conflicting interests
The author(s) declared no potential conflicts of interest with respect to the research, authorship, and/or publication of this article.
Authors’ contributions
All authors had full access to all the data in the study and take responsibility for the integrity of the data and the accuracy of the data analysis. Contributions: RC-V, FJN, and LJM in conception; RC-V, FJN, and LJM in design; RC-V, CL, and PE in acquisition of data; RC-V and CL in analysis, RC-V, CL, PE, FJN, and LJM in data interpretation, RC-V and LJM in drafting of manuscript; and RC-V, FJN, and LJM in funding acquisition. All authors have critically reviewed the final manuscript for important intellectual content and have given their final approval for publication.
Supplemental material
Supplemental material for this article is available online.
References
Supplementary Material
Please find the following supplemental material available below.
For Open Access articles published under a Creative Commons License, all supplemental material carries the same license as the article it is associated with.
For non-Open Access articles published, all supplemental material carries a non-exclusive license, and permission requests for re-use of supplemental material or any part of supplemental material shall be sent directly to the copyright owner as specified in the copyright notice associated with the article.