
Abstract
The leptomeningeal collateral status is an independent predictor of stroke outcome. By means of optical coherent tomography angiography to compare two mouse strains with different extent of native leptomeningeal collateralization, we determined the spatiotemporal dynamics of collateral flow and downstream hemodynamics following ischemic stroke. A robust recruitment of leptomeningeal collateral flow was detected immediately after middle cerebral artery (MCA) occlusion in C57BL/6 mice, with continued expansion over the course of seven days. In contrast, little collateral recruitment was seen in Balb/C mice during- and one day after MCAO, which coincided with a greater infarct size and worse functional outcome compared to C57BL/6, despite a slight improvement of cortical perfusion seven days after MCAO. Both strains of mice experienced a reduction of blood flow in the penetrating arterioles (PA) by more than 90% 30-min after dMCAO, although the decrease of PA flow was greater and the recovery was less in the Balb/C mice. Further, Balb/C mice also displayed a prolonged greater heterogeneity of capillary transit time after dMCAO in the MCA territory compared to C57BL/6 mice. Our data suggest that the extent of native leptomeningeal collaterals affects downstream hemodynamics with a long lasting impact in the microvascular bed after cortical stroke.
Introduction
The circle of Willis (CW) and the leptomeningeal (LMA) vessel networks comprise the primary and secondary collateral pathways, respectively. The LMA collaterals potentially provide bidirectional arterial blood to the cortical surface, connecting the anterior cerebral arteries (ACA) and middle cerebral arteries (MCA), the MCA and posterior cerebral arteries (PCA), and to a lesser extent, the ACA and PCA. 1 They are recruited to maintain blood supply when there is a sudden occlusion of a cerebral artery downstream from the CW. 2 A plethora of evidence suggests that LMA collateralization after ischemic stroke is a strong predictor of stroke outcome.3,4 Consequently, the evaluation of collateral flow status via an array of neuroimaging techniques has become a reliable decision-making assessment for the therapeutic management of acute ischemic stroke patients, as attested by the ESCAPE trial. 5 The factors influencing cerebrovascular collateralization are not completely understood, although age,6,7 vascular risk factors and genetics are known to regulate the development and dynamic response of collaterals. 2
Genetic influence on the extent of native LMA collaterals is well studied by comparing inbred mouse strains and was used to predict infarct volume after MCA stroke. 8 Congenic mapping identified that Dce1 (determinant of collateral extent 1) underlies this genetic variation. Introgression of Dce1 allele into the Balb/C genome rescued pial collateral extent by 83% in wild-type Balb/C mice, and restored CBF and reduced infarct volume after MCAO in an allele dose-dependent fashion, 9 affirming the importance of native collaterals in determining cerebral blood perfusion in the ischemic territory.
Despite the established link between the native collateral circulation and the severity of brain injury after acute ischemic stroke, it remains unclear how the LMA collateral system compensates cerebral blood flow in a temporal fashion and how it affects downstream blood supply in smaller vessels following ischemic stroke. Many previous preclinical studies could not evaluate the contribution of the feeding arteries to an ischemic region owing to lack of appropriate methodology, instead relying on the assessment of overall blood perfusion 10 or on post-mortem examination. 8 To test the hypothesis that reduced LMA collateral extent and smaller diameters of preexisting LMA collaterals would impact blood perfusion after stroke from pial vessels to microvascular bed, we employed optical coherence tomography angiography (OCTA), an emerging neuroimaging technique, to assess cortical cerebral blood flow dynamics with excellent spatial resolution and sensitivity. 11 We were able to determine the spatial and temporal dynamics surrounding the LMA anastomoses following ischemic stroke using two mouse strains, C57BL/6 and Balb/C, with different extent of native LMA collaterals. We also characterized and compared the impact of differential collateral flow on downstream blood flow in the penetrating arterioles and capillary vessels as well as on stroke outcome.
Materials and methods
Animals and housing
All animal experiments were conducted in accordance with the Guide for Care and Use of Laboratory Animals, and reported in compliance with the Animals in Research: Reporting In Vivo Experiments (ARRIVE) guidelines,12,13 and were approved by the San Francisco Veterans Affairs Medical Center Institutional Animal Care and Use Committee. Male C57BL/6 and Balb/C mice (10–12 weeks old, Jackson Laboratories, ME) were housed 4 per cage on a 12-h dark/light cycle with access to food and water ad libitum.
Animal surgery
Mice were coded at the beginning of the experiment. Although the mouse strain was apparent to investigators performing in vivo procedures owing to respective unique coat color, the identity of each mouse subject was blinded to investigators who conducted the experiments and data analysis. A total of 31 C57BL/6 and 31 Balb/C mice were used for this study. Sample sizes for individual experiments are listed in the figure legends. Four C57BL/6 and seven Balb/C mice did not contribute to the final data set owing to ischemic injury-related mortality before reaching the seven-day time point. There were no other exclusions.
Cranial window implantation
Two weeks prior to imaging, mice were anesthetized and placed on a stereotaxic frame. An incision of the scalp in the midline was made to expose the skull, and a craniotomy was performed with a dental drill on the parietal cortex 2 mm lateral and 1 mm posterior from the bregma. A circular piece of skull was carefully detached and replaced with a round coverslip glass 5 mm in diameter. The coverslip was sealed to the skull with cyanoacrylate glue and dental cement, producing a cranial window for high-resolution blood flow imaging. The pulled-back skin was sealed to the skull with 3 M VetBond (St. Paul, MN). Core temperature was maintained around 37 ± 0.5°C by the use of a heating blanket and rectal thermistor servo-loop throughout the procedure and during imaging.
Induction of experimental stroke
Ischemic stroke was induced by permanent left middle cerebral artery occlusion (MCAO) plus 60 min of left CCAO, then removal of the CCA occlusion using the distal MCAO method as previously described. 14 Sham-operated mice did not receive occlusion of either the MCA or CCA.
Measurement of cerebral blood flow dynamics via optical coherence tomography
System configuration
Cortical blood flow was evaluated under isoflurane anesthesia by a custom-built spectral domain OCT system (Figure 1(a)) equipped with a broadband super-luminescent diode (SLD) light source (LS2000B, Thorlabs Inc.) with a center wavelength of 1310 nm and a spectral bandwidth of ∼110 nm at 3 dB, providing an axial resolution of ∼6 µm in tissue.14,15 A 5× objective lens was used in the sample arm to perform wide-field scans of the pial blood flow in intact cranium, 14 and a 10× lens for high-resolution imaging via a cranial window. The backscattered signal interfering with the counterpart from the reference arm is detected by a spectrometer consisting of a transmission grating, an achromatic doublet lens, and a 1024-pixel InGaAs line scan camera operated at 92,000 axial scans per second. The light beam was scanned over the sample using a paired X-Y galvanometer (6210, Cambridge Technology), yielding a 3D volumetric dataset (z-x-y). The system sensitivity was measured to be 105 dB at the focus (∼500 µm below the zero delay line). A visible light camera was coupled to the system to aid in targeting the OCT scans.
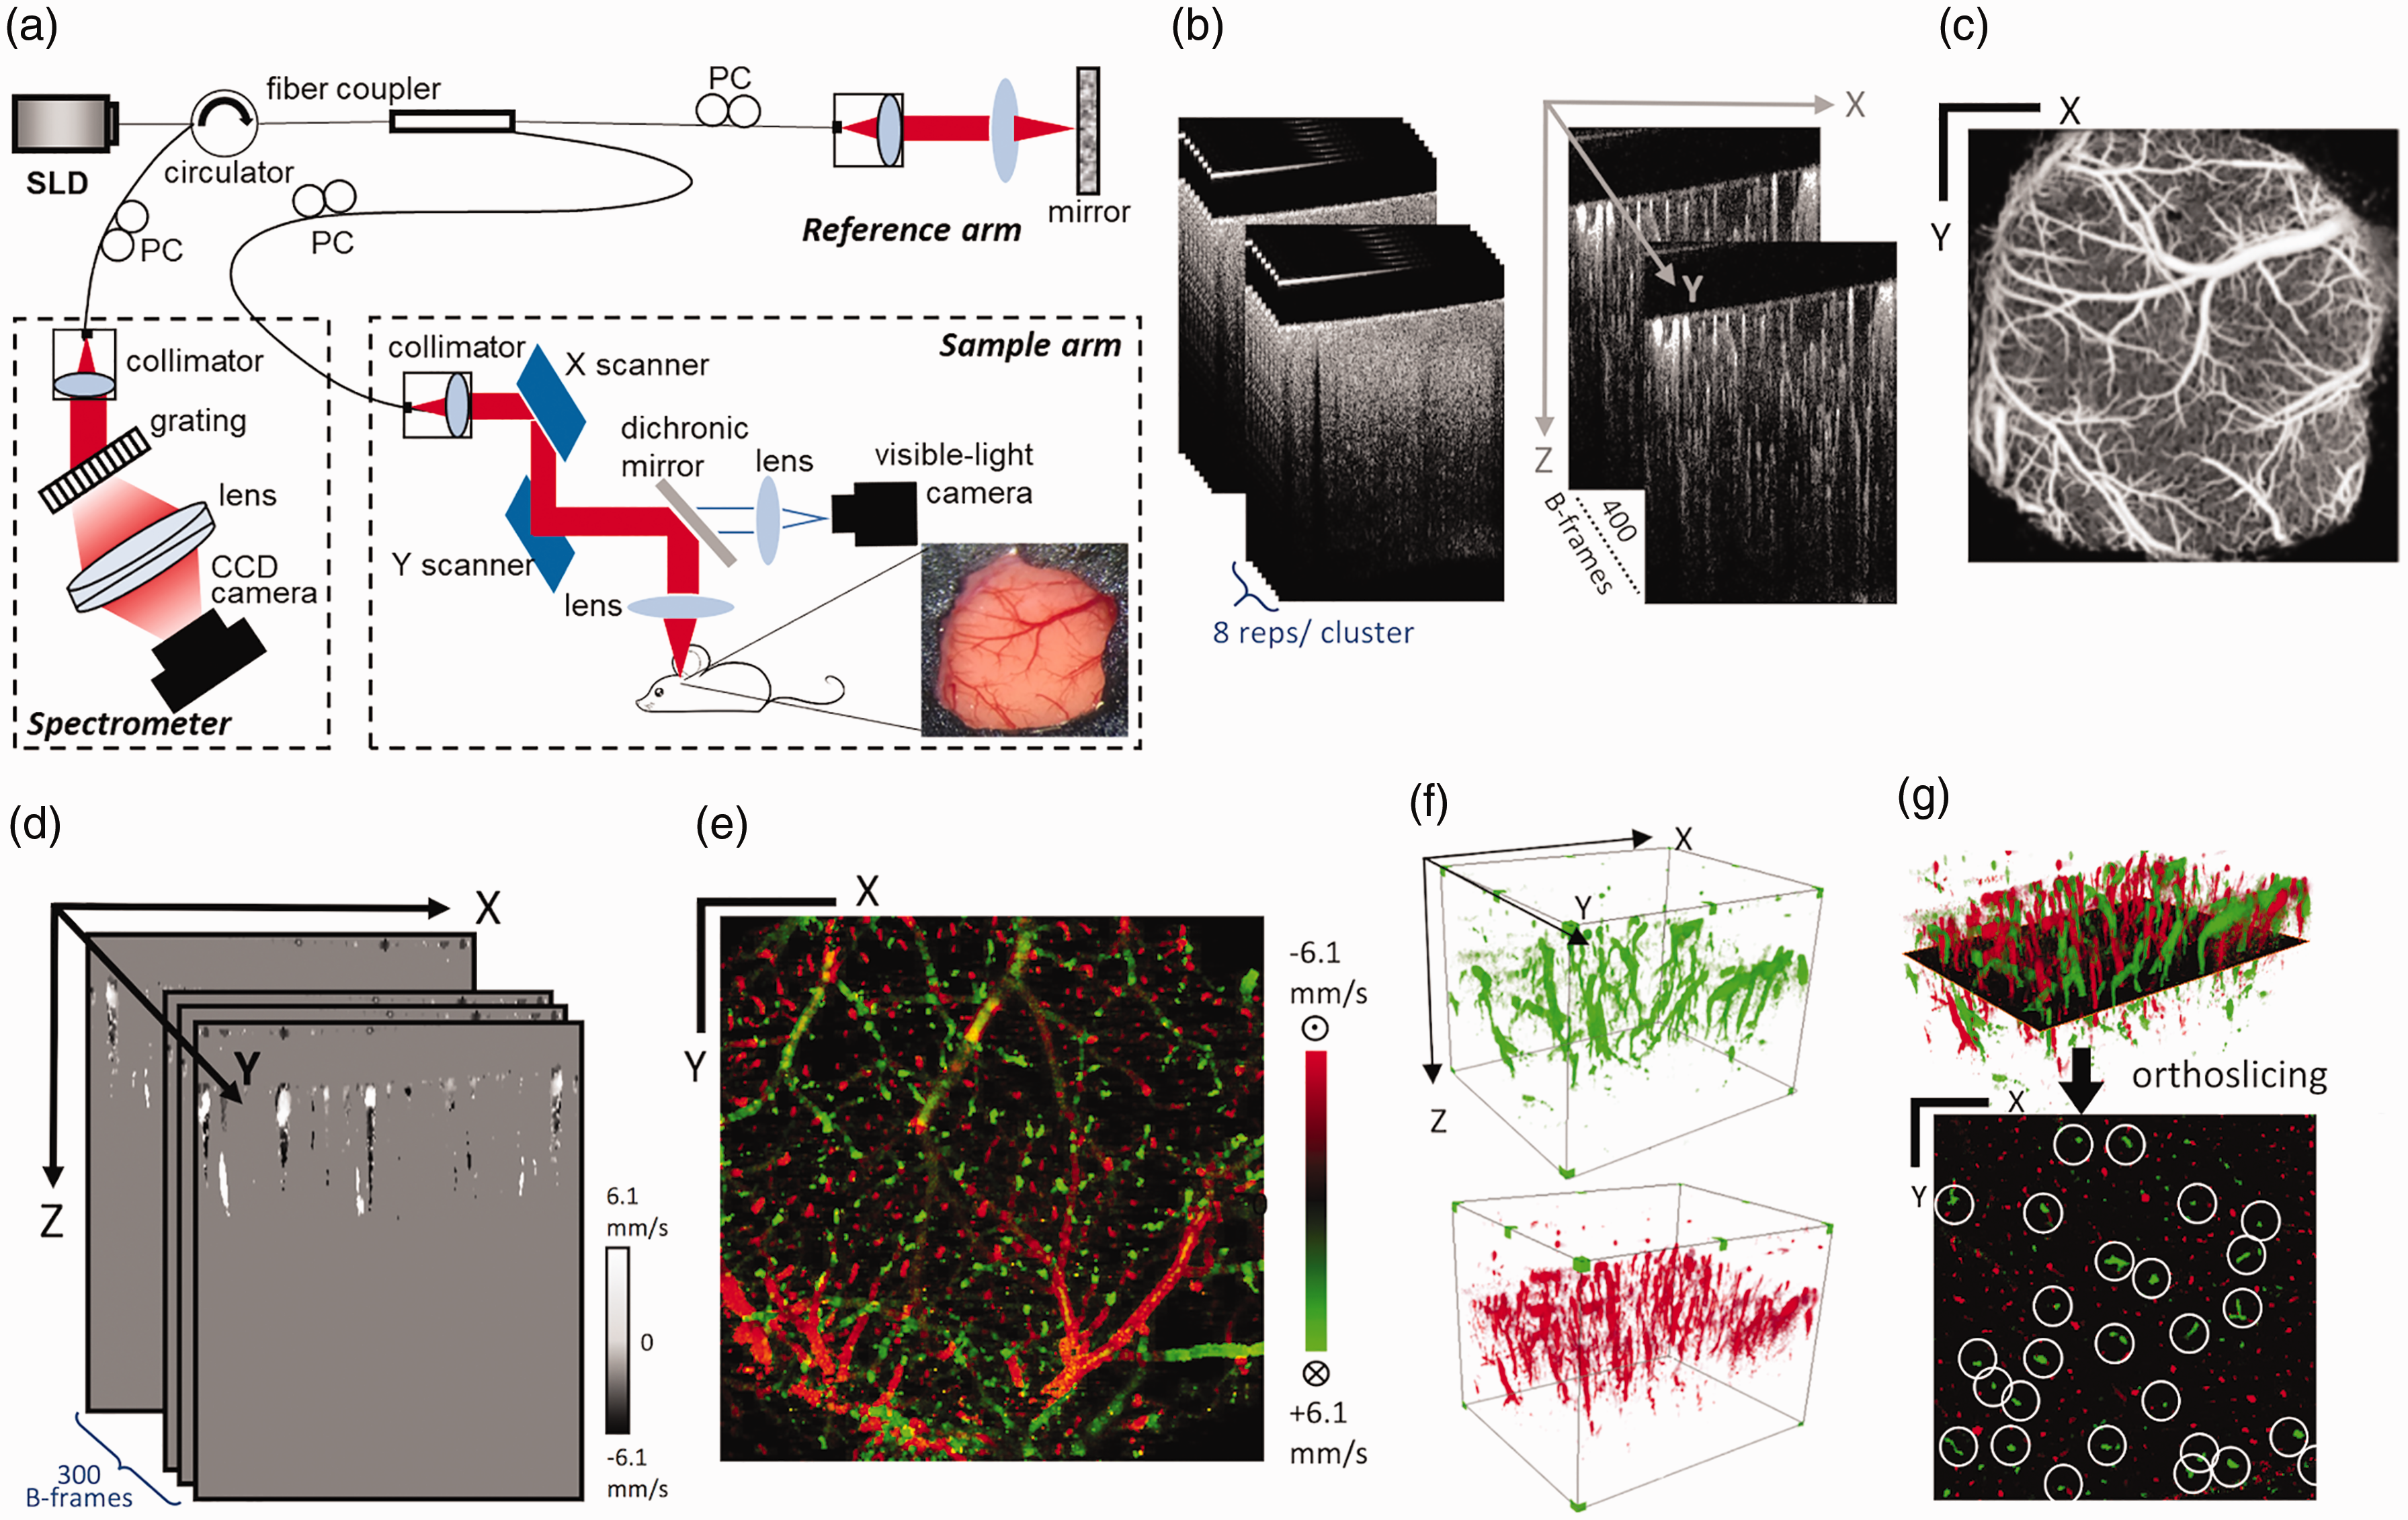
Schematics for the optical coherence tomography (OCT) system and the optical microangiography (OMAG) methods. (a) Schematics of the 1310 nm SD-OCT system setup. SLD: super-luminescent diode; PC: polarizer controller. (b) Optical microangiography (OMAG) scanning scheme. Eight repeated scans were performed in one cluster, where OMAG algorithm was applied to extract blood flow information. A total of 400 clusters of scans (400 frames) was obtained to form one OMAG volume. (c) En face maximum intensity projection (MIP) of the 3-D OMAG volume. Scale bar represents 1 mm in both X and Y direction. (d) Velocity B-frames obtained using the DOMAG algorithm. (e) Bidirectional axial velocity maps generated by en face MIP of 3D DOMAG dataset. Color bar represents red blood cell axial velocity of the flow descending (negative, green) and rising from (positive, red) the brain in a range of ±6.1 mm/s. (f) 3–D visualization of the descending PA flow (top) and the rising venule flow (bottom) in the cortex. (g) Demonstration of X-Y plane orthoslicing from the 3D dataset (top) and the orthoslice showing signals of PA and venule flows through the plane (bottom), with true PA flow encircled manually. (c, e and g) Scale bars represent 1 mm in both X and Y direction.
OCT microangiography
Morphological features of functional cerebral blood flow in the cranial window were scanned by the 10× lens using the OMAG protocol. In this protocol, each B-scan consisted of 400 A-lines in the x axis covering 5 mm. Eight repeated B-scans formed a cluster where blood flow signals were extracted using the OMAG algorithm. A total of 400 clusters were acquired in the y-axis (5 mm) (Figure 1(b)) at the frame rate of 180 frames/s. The final 3D OMAG data had 512 × 400 × 400 voxels. The blood flow maps were shown as the en face (x-y) maximum intensity projection (Figure 1(c)) of the 3D volume. High resolution OCT imaging was performed at five time points: baseline prior to stroke (labeled as Base), 30 min after the occlusion of MCA and ipsilateral CCA (as dMCAO), 1 h after the reversal of CCAO (as 1 h in Figures 4 and 5), one day and seven days after dMCAO. The wide field scan for pial blood flow was performed at four time points without the 1 h post CCA reperfusion time point to minimize scar formation.
Doppler optical microangiography
DOMAG was used to quantitatively evaluate the flow dynamics of the MCA and ACA and the penetrating arterioles (PA) they supply. The scanning protocol consisted of 25 A-lines repeatedly acquired to form an M-scan (z axis). Each B-scan had 380 M-scan steps on the x-axis, and a total of 300 B-frames on the y-axis were obtained to yield a 3D data set of 512 × 380×300 (z-x-y) voxels. The directional blood flow velocity (axial component) was deduced by the positive or negative phase changes calculated between A-line intervals (Figure 1(d)). The velocities were false color-coded with red and green in the final en face image to represent two opposite flow directions (Figure 1(e)). A wide range of flow velocity can be obtained with this algorithm through A-line skipping, and the displayed bidirectional velocity maps in this study had a flow range of ± 6.1 mm/s. This protocol was performed over multiple tiles facilitated by a motorized translational stage to cover the desired field of view. For wide-field DOMAG to assess MCA and ACA branches with regard to anastomoses, six tiles were performed over the intact skull to produce the final flow velocity map of 3 mm × 2 mm. For high-resolution DOMAG to quantify PA flows, nine tiles were performed over the 5 mm × 5 mm cranial window to produce the final velocity map. In the high-resolution DOMAG, signals from the penetrating arterioles (green) and the rising venules (red) can be separately displayed and visualized (Figure 1(f)), and an x-y orthoslice at 50 µm below the surface (Figure 1(g)) shows the cross section of these flow velocity signals. Signals corresponding to the MCA and ACA territories were delineated by the anastomosis line and quantified independently. Here, identification of true PA signals was aided by 3D data visualization in Amira (Zuse Institute Berlin and Thermo Fisher Scientific). The encircled signals carry information of flow cross-sectional area (mm2), flow velocity (mm/s), and flow rate (mm3/s), which can be calculated based on the method previously described. 7
OCTA capillary velocimetry
The capillary flow dynamics at each of the five corresponding time points were assessed using a OCTA capillary velocimetry method developed recently.
16
In this method, A-lines were repeated 50 times to form an M-scan complex (Figure 2(a)). A statistical method of Eigen decomposition (ED) analysis was performed on the M-scan complex, where the eigenvalues that represent static signals and moving particles were separated, and the mean frequency (MF) of moving particles was estimated. The A-line speed was set at 20 kHz with 50 repeats to yield an A-line interval between 50 µs and 2.5 ms, which could potentially capture fast to slow capillary velocity from 5 mm/s to 100 µm/s. A B-frame consisted of 400 M-scans, and there were 400 B-frames in the 3D dataset. The final 3D cube had 512 × 400 × 400 voxels covering a 4 mm × 4 mm region. For capillary velocimetry analysis, a special mask was additionally applied to B-frames to remove vessels with lumen larger than 15 µm to achieve better visualization and quantification of the MF signals from capillaries (Figure 2(b)). A set of en face average intensity projections (AIP) within a 300 µm-thick slab was made to visualize the capillary MF maps within the scanning region (Figure 2(c)), and all MF values within the map were plotted into the histogram distribution to compare different conditions (Figure 2(d)). Then, the MF signals were converted to velocity according to the linear relation derived from the previous phantom experiment.
16
To obtain transit time parameters, the velocity is converted to time by dividing mean capillary path length of 400 µm as previously described
17
(Figure 2(e)). Capillary transit time distribution is expressed in the gamma function as
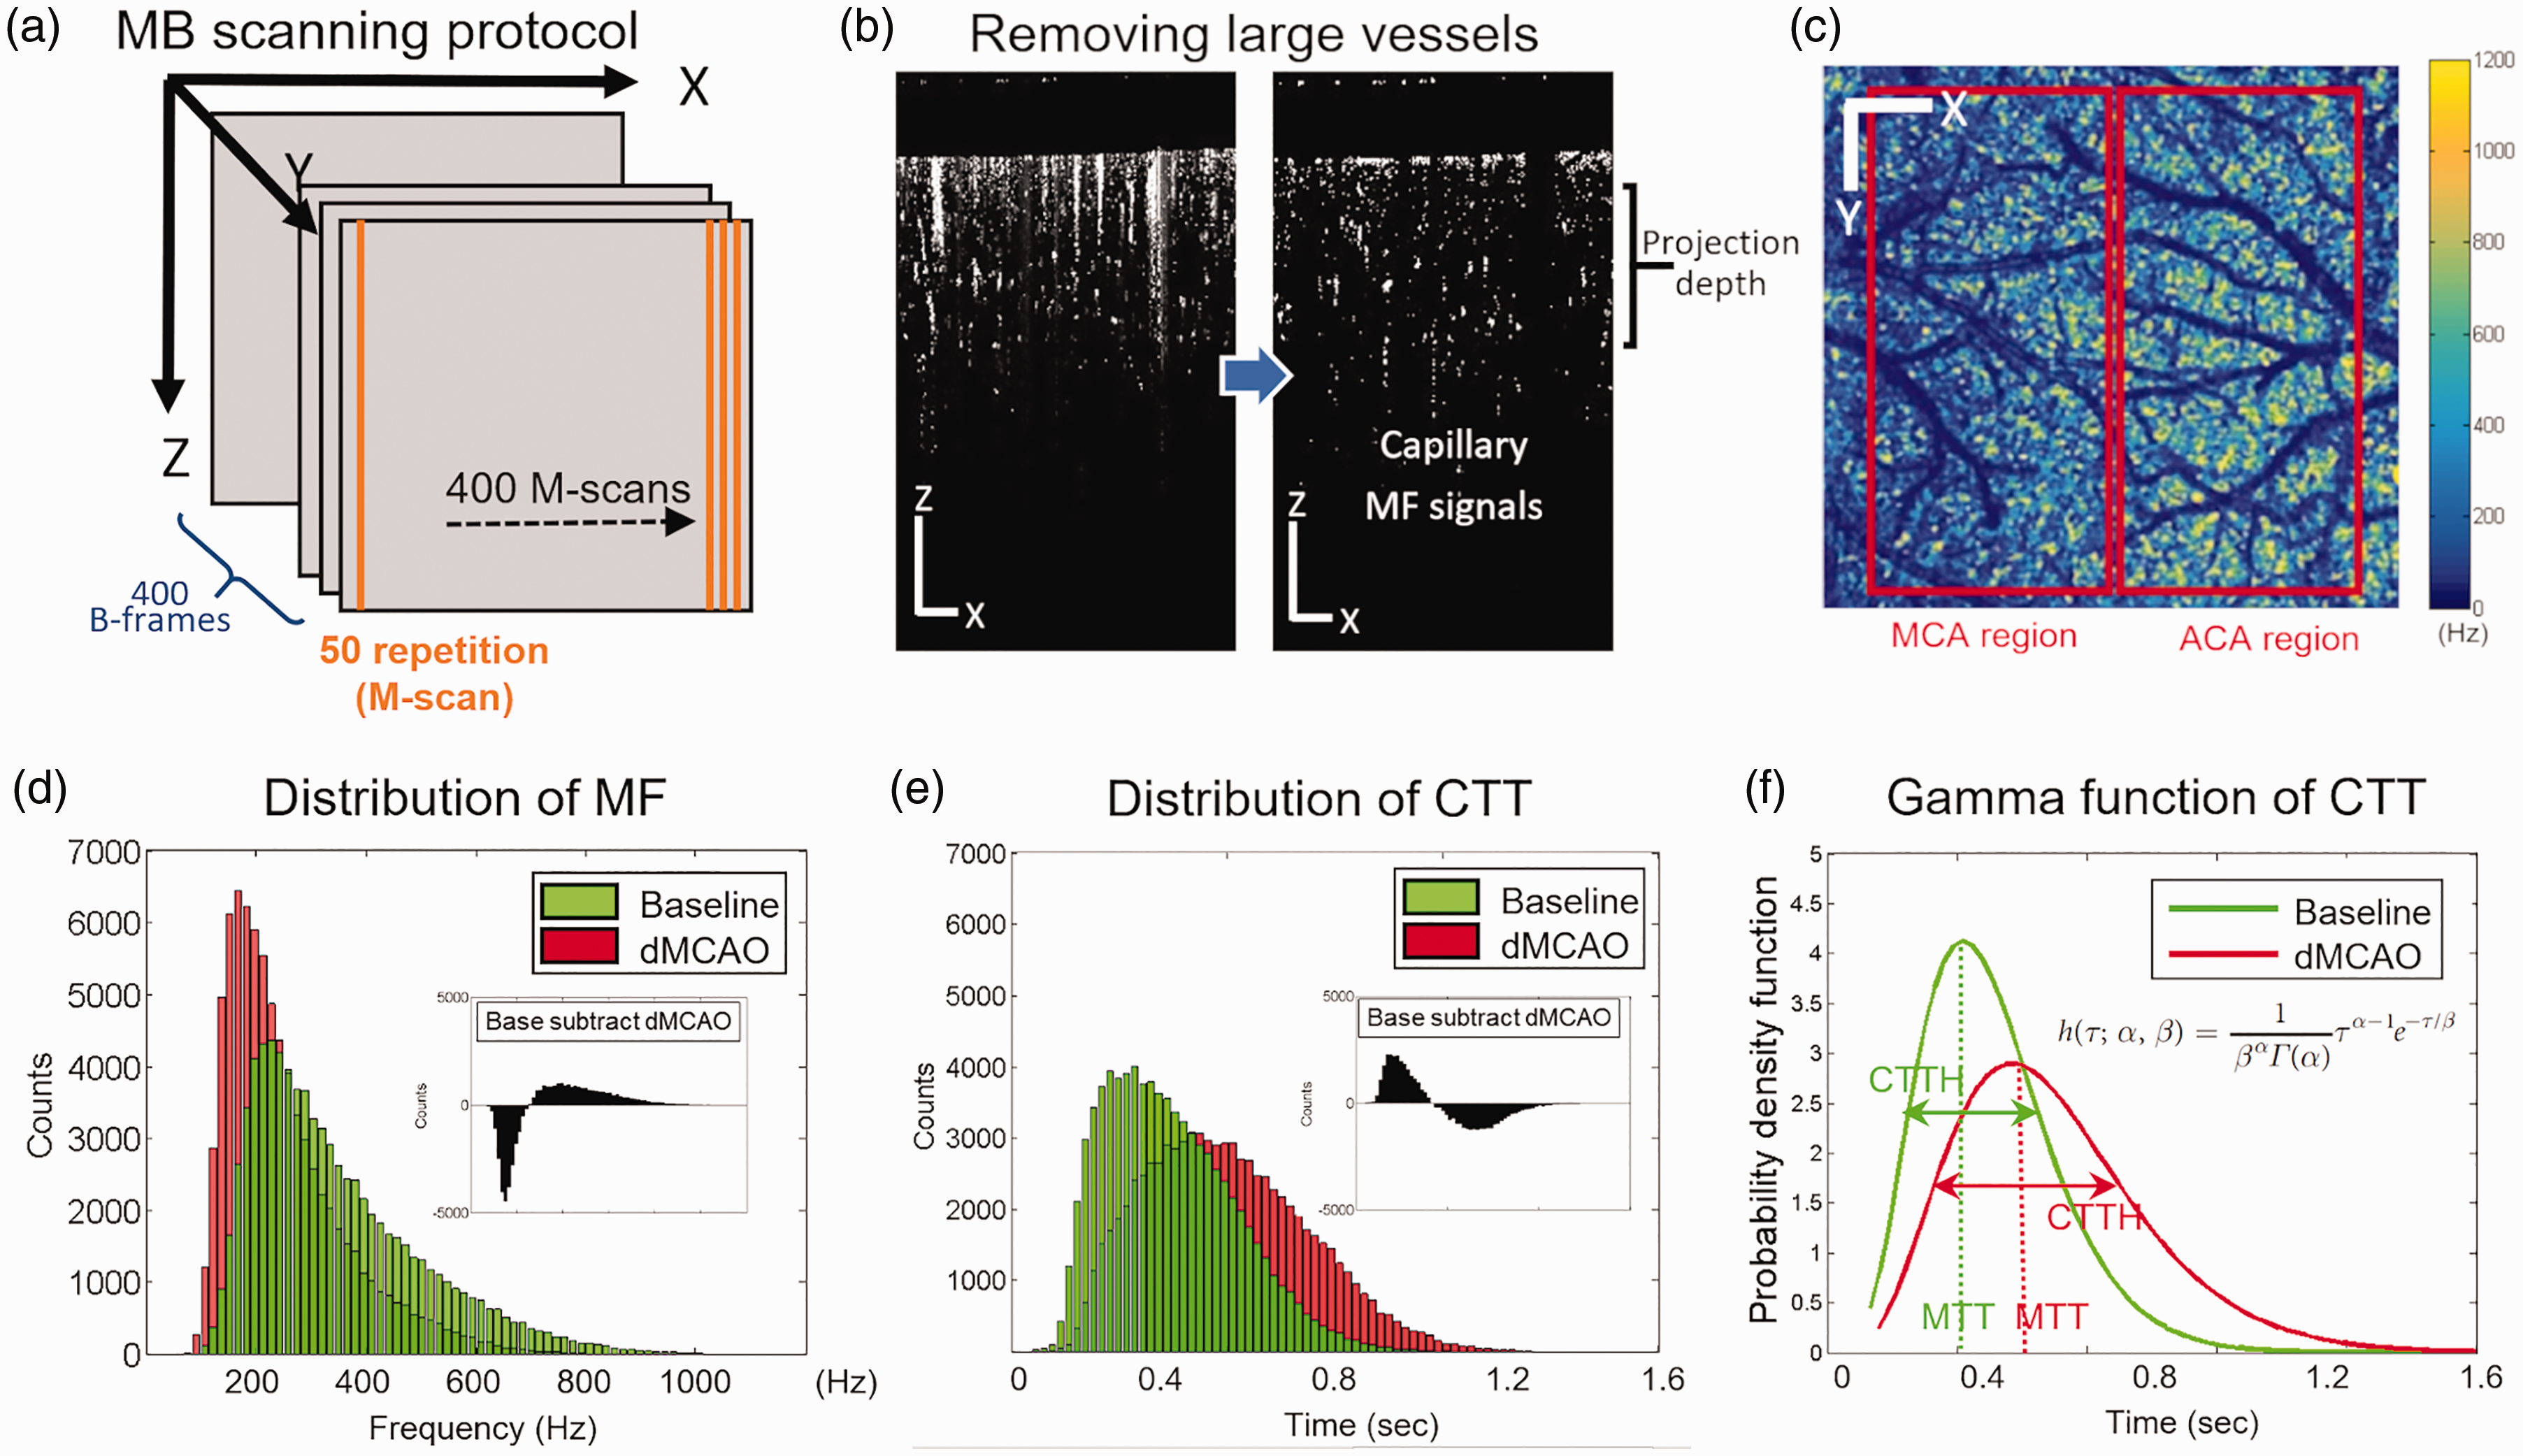
Schematics for OCT capillary velocimetry. (a) Schematics of OCTA velocimetry scanning protocol. (b) Effect of mask application on capillary flow signals. Vessel lumens larger than 15 µm were removed by the mask. (c) capillary mean frequency maps generated by en face projection of 3D frequency signal within a 300 um-thick slab. Scale bar represents 1 mm in both X and Y direction. (d) Distribution of MF and the difference between two conditions: baseline and dMCAO. (e) Distribution of capillary transit time (CTT) and the difference between two conditions. (f) Gamma function of CTT at baseline and dMCAO. Scale bars in (c) represent 1 mm in both X and Y directions.
Laser Doppler flowmetry
To validate the extent of correlation between pial collateral flow as assessed by DOCT and overall cortical regional cerebral blood flow (rCBF), we performed measurement for the latter by conventional laser-Doppler flowmetry (Vasamedics LLC, St Paul, MN, USA) in mice immediately prior to DOCT imaging. A 1 mm diameter probe was placed directly on the intact skull over the occlusion site of MCA (1 mm posterior and 4 mm lateral to bregma). rCBF values after occlusion are expressed as a percentage relative to baseline. 19
Arterial labeling, scoring and diameter measurement
To evaluate anatomical collateralization of both C57BL/6 and Balb/C mice, cerebral arteries were labeled in vivo as described previously with modifications.14,20 In brief, mice were perfused with 0.1 M phosphate buffer, followed by 0.2% carbocyanine fluorescent dye 1,1′-dioctadecyl-3,3,3′3′-tetramethylindocarbocyanine perchlorate (DiI) (Invitrogen, Carlsbad, CA) and finally by 4% PFA at the rate of 2 ml/min for 5 min each solution. A montage image was created by stitching individual images taken at 50× (Axioskop 2, Carl Zeiss, Germany) using the Virtue Tissue 2 D module (StereoInvestigator; MBF Bioscience). The number of connecting collaterals between ACA and MCA, patency of the PcomA and the distance between MCA-ACA anastomoses and midline at three different neuroaxes of the dorsal cerebral hemispheres were quantified. The development of posterior communicating arteries (PcomA) was evaluated using the following criteria: 0, no anastomosis; 1, anastomosis in the capillary phase; 2, small truncal PcomA; and 3, truncal PcomA.
Assessment of stroke outcomes
Functional impairment was determined by the foot fault 21 and corner tests 22 in 3 and 10 consecutive trials at seven days after MCAO, 14 respectively. Infarct volume was quantified as described previously.14,23
Statistical analysis
Data were expressed as Mean ± SD. The Kolmogorov–Smirnov normality test was used to determine whether data were normally distributed. Log-transformation was used to bring back normality among some blood flow data with great differences between baseline and time points after stroke (Figures 3(c), (d), (e) and (f) and 4(b) and (e)). Data were analyzed by two-way repeated measure ANOVA for temporal and strain differences (Figures 3 to 5 and 6(f) and (g)) or by two-sided t-test (Figure 6(b) to (e)) followed by Bonferroni corrections for multiple comparisons using Prism 8 (GraphPad Software Inc., San Diego, CA). Sample size calculations were performed based on our prior studies with this stroke model for histological and behavior tests,14,21 and for OCT angiography. 14 P values less than 0.05 were considered significant.
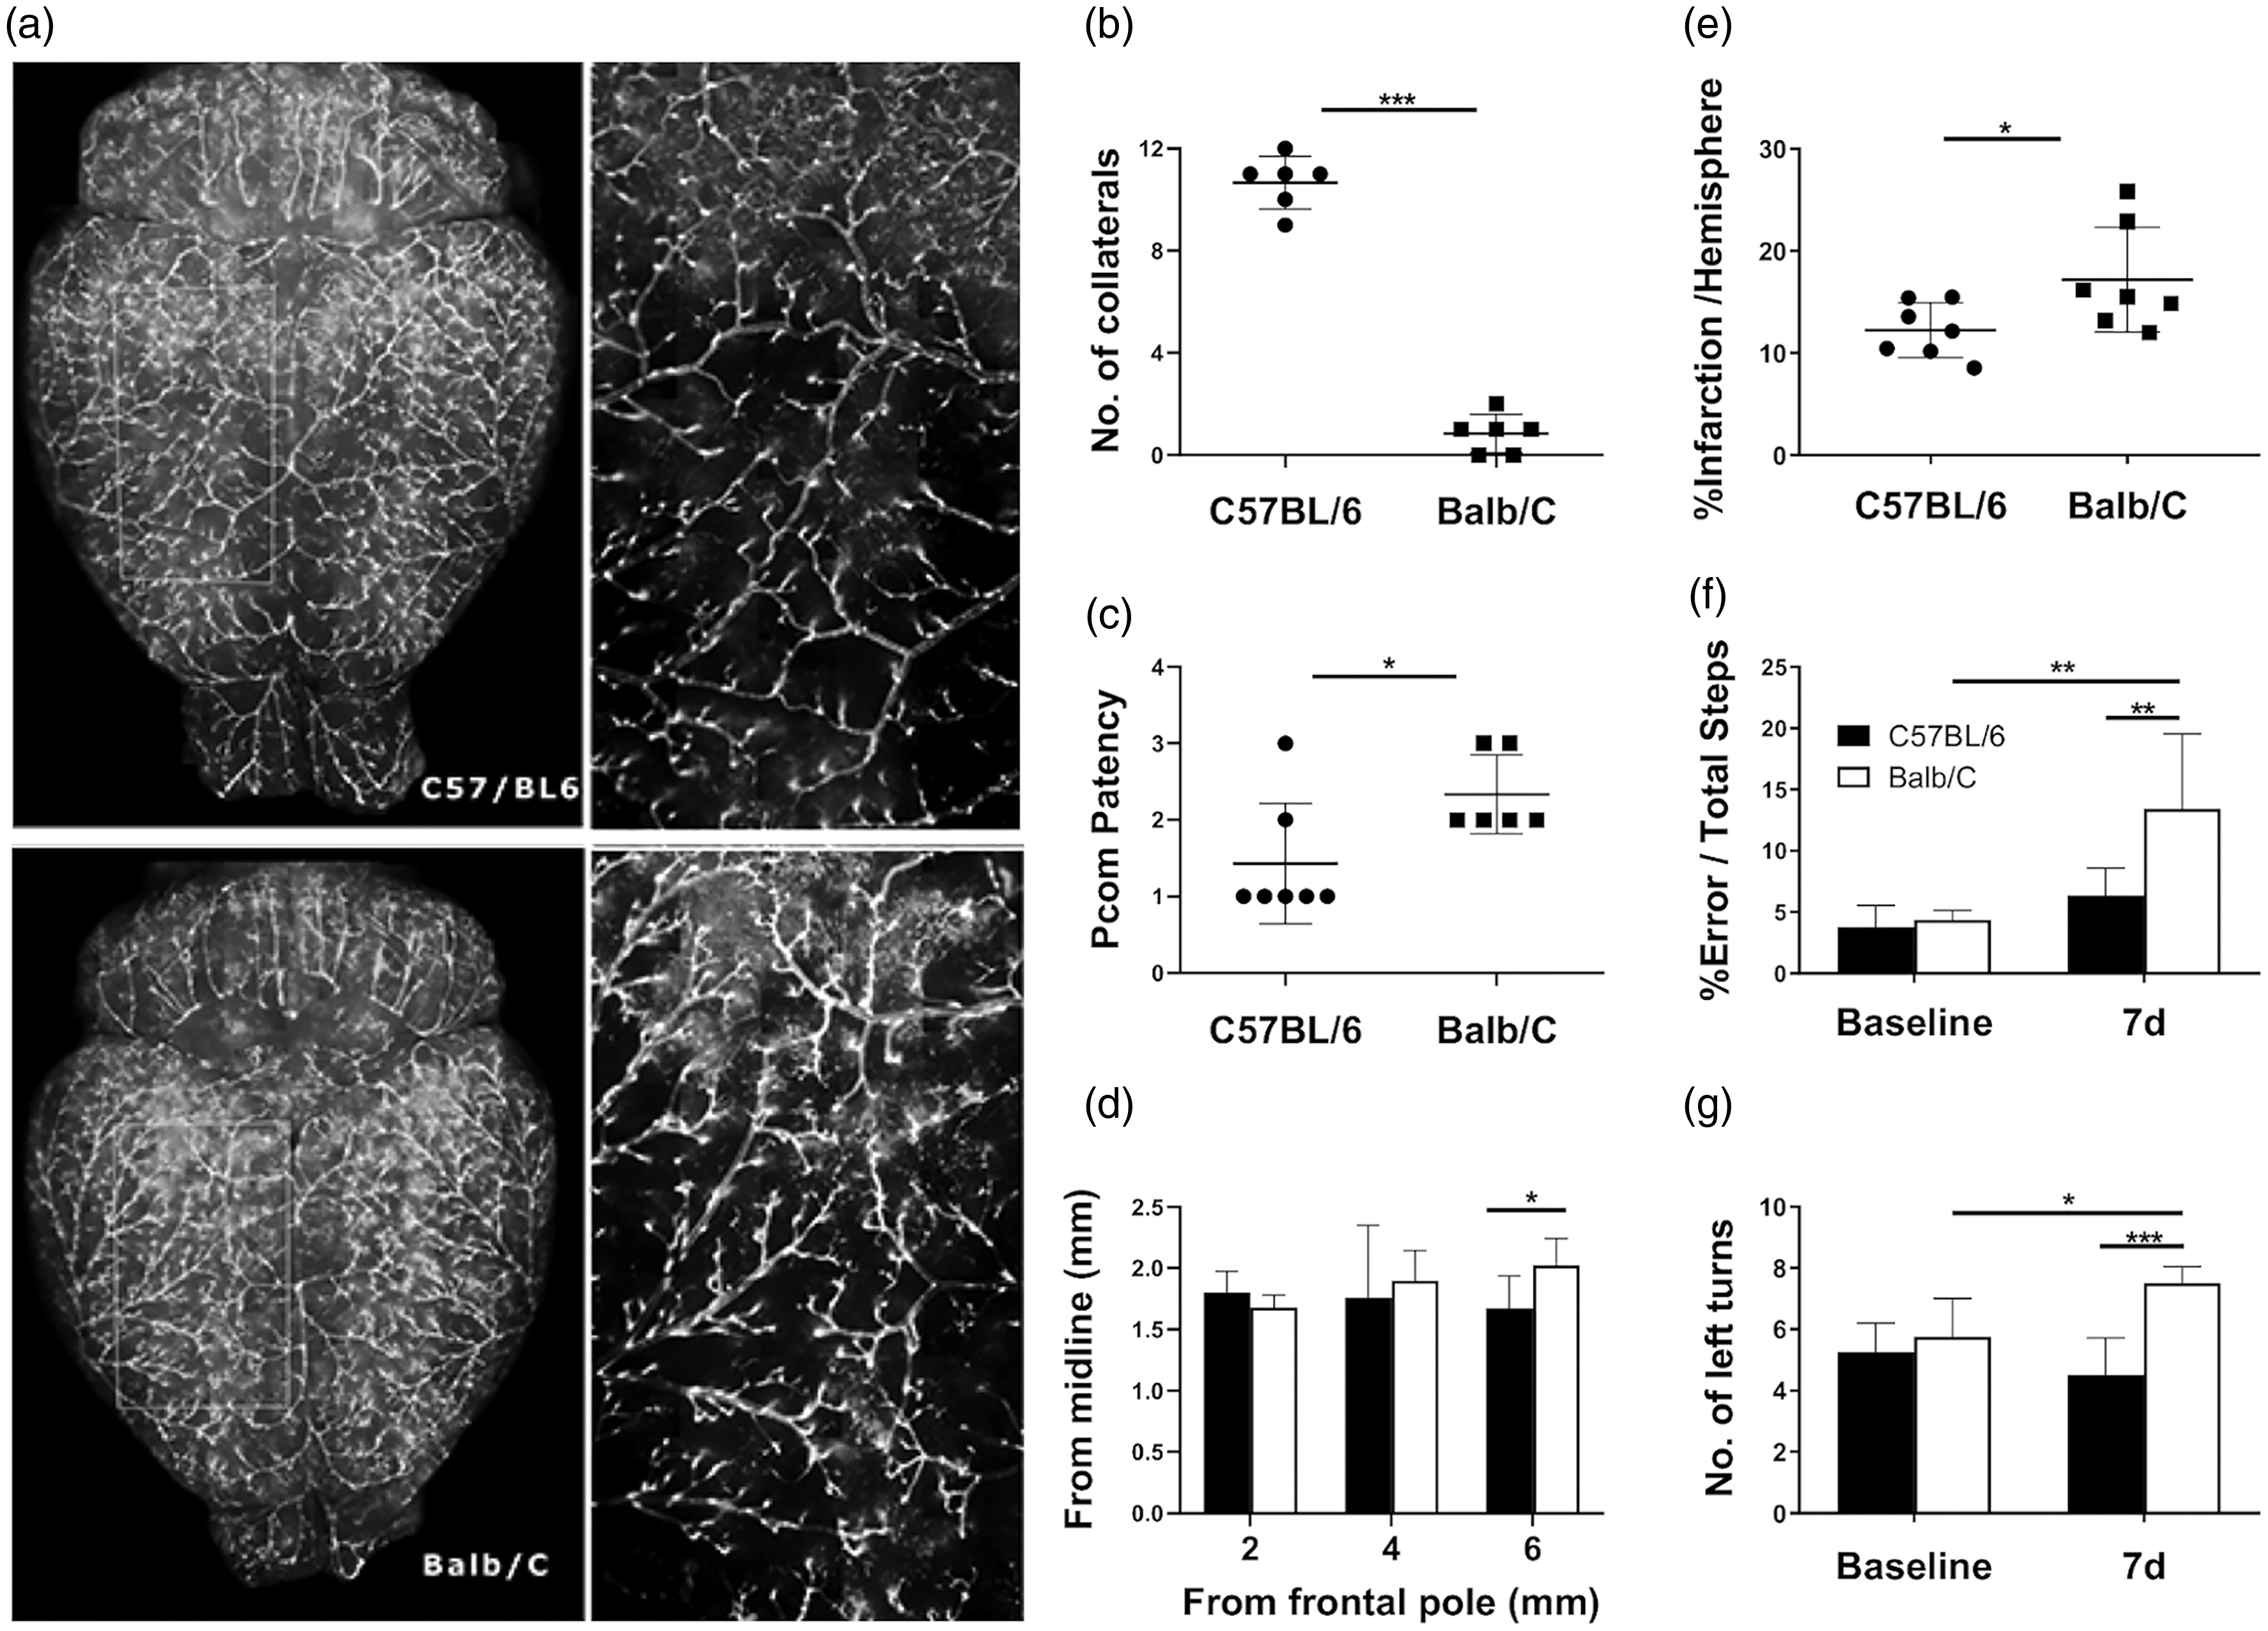
The extent of native leptomeningeal collaterals prior to MCAO predicted stroke outcome in C57BL6 and Balb/C mice. (a) Representative dorsal views of arteriograms of C57BL/6 and Balb/C mice. The enlarged views of the yellow insets revealed many anastomosis points between MCA and ACA vascular networks in the C57BL6 mice but not in the Balb/C mice. (b) Quantification of connecting collaterals between MCA and ACA at baseline. (c) Pcom patency was scored and compared between the two mice strains. (d) Distance between midline and the line of anastomoses between the ACA and MCA were determined at three different neuroaxis levels. Balb/C mice had many fewer connecting LMA collaterals, but with more favorable PcomA patency compared to C57BL/6 mice. However, they shared similar size of MCA territory. (e) Balb/C mice sustained a significantly larger stroke size compared to C57BL/6 mice seven days after stroke. Balb/C mice slipped through the bars more frequently when traversing an elevated horizontal ladder (f) and made significantly more ipsilateral turns in the corner test (g) compared to C57BL/6 mice seven days after stroke, reflecting a more pronounced functional impairment in sensorimotor asymmetry in the former strain. *, **, ***P < 0.05, 0.01, 0.005. N = 6/group for arteriograms; N = 6/group for behavior tests (same animals used for rCBF); N = 7/group for infarct assessment.
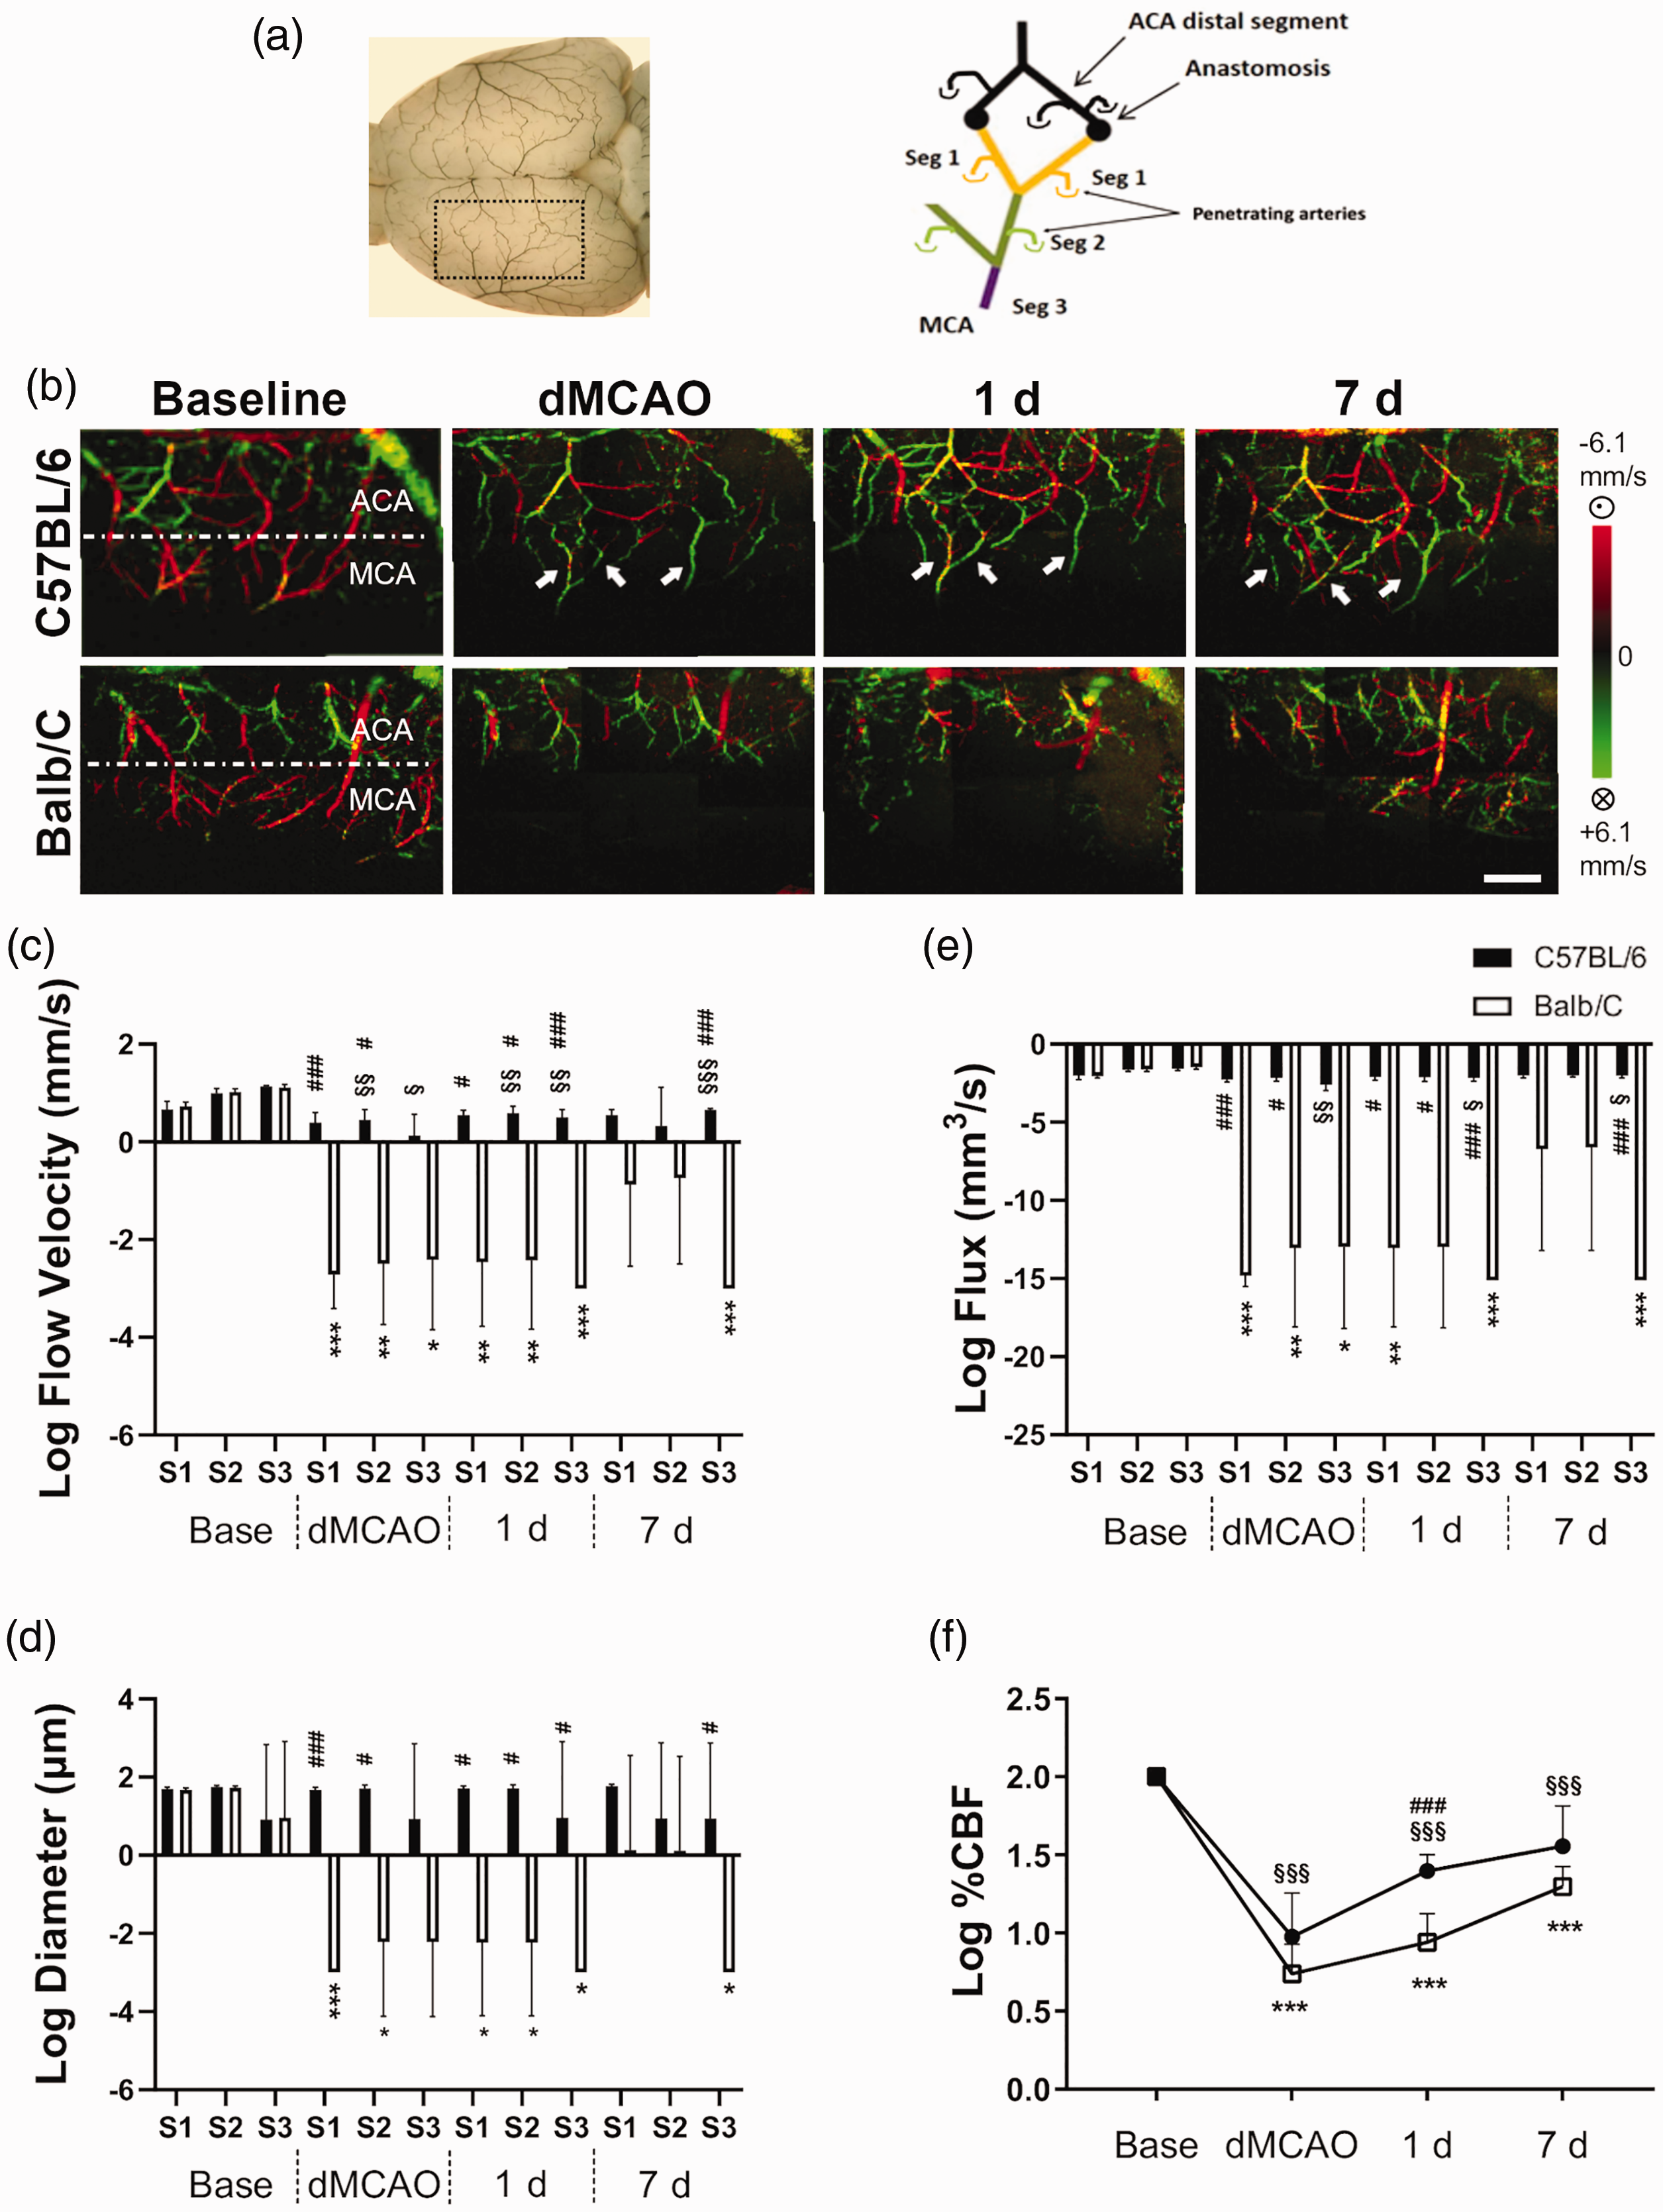
Rapid recruitment of retrograde collateral flow from ACA following distal MCA occlusion in C57BL/6 mice but not Balb/C mice. (a) The area imaged by DOCT corresponds to the image showing the gelatin-Indian ink-impregnated pial vessels on the dorsal surface of the brain. The designation of three distal MCA branches and their relative location to MCA and ACA is illustrated. (b) Representative DOCT images of C57BL/6 and Balb/C mice at baseline (Base), 30 min during MCAO (dMCAO), at 24 h and seven days (7 d) after MCAO. The direction of blood flow is color-coded, with the blood flowing toward the scanning probe beam or toward the ACA territory coded as red, and the retrograde flow toward the proximal MCA as green. White arrows indicate MCA branches that received retrograde flow from the ACA. Column graphs of flow velocity (c), vascular diameter (d) and flux (e) in log scale of C57BL/6 and Balb/C mice at three distal MCA segments of MCA at time points described. At baseline, there was no significant difference in flow velocity, vascular diameter or flux between two strains. However, distal branches of MCA were irrigated by ACA retrograde flow via the tortuous anastomoses in C57BL/6 mice, with a reversal of flow direction from red to green. The axial flow velocity and flux of Seg3, most proximal to MCA main trunk, progressively increased over time following MCAO. In contrast, Balb/C mice showed almost no retrograde flow during and 24 h after MCAO owing to poor LMA collateral networks, leading to a significantly reduced flux in MCA territory at all times compared to C57BL/6 mice. Interestingly, the extent of functional flow was slightly improved seven days after MCAO in Balb/C mice. (f) Regional CBF determined by laser Doppler flowmetry over the occlusion site showed a gradual improvement of blood perfusion over time. Significant strain difference in recovery of rCBF was noted at one day after MCAO. Time point vs. baseline: * , ** , ***P < 0.05, 0.01, 0.005 (Balb/C); §, §§, §§§P < 0.05, 0.01, 0.005 (C57/BL/6). Strain difference: #, ##, ###P < 0.05, 0.01, 0.005. Scale bar, 1 mm. N = 6/group for wide field OCT and N = 6/group for rCBF.
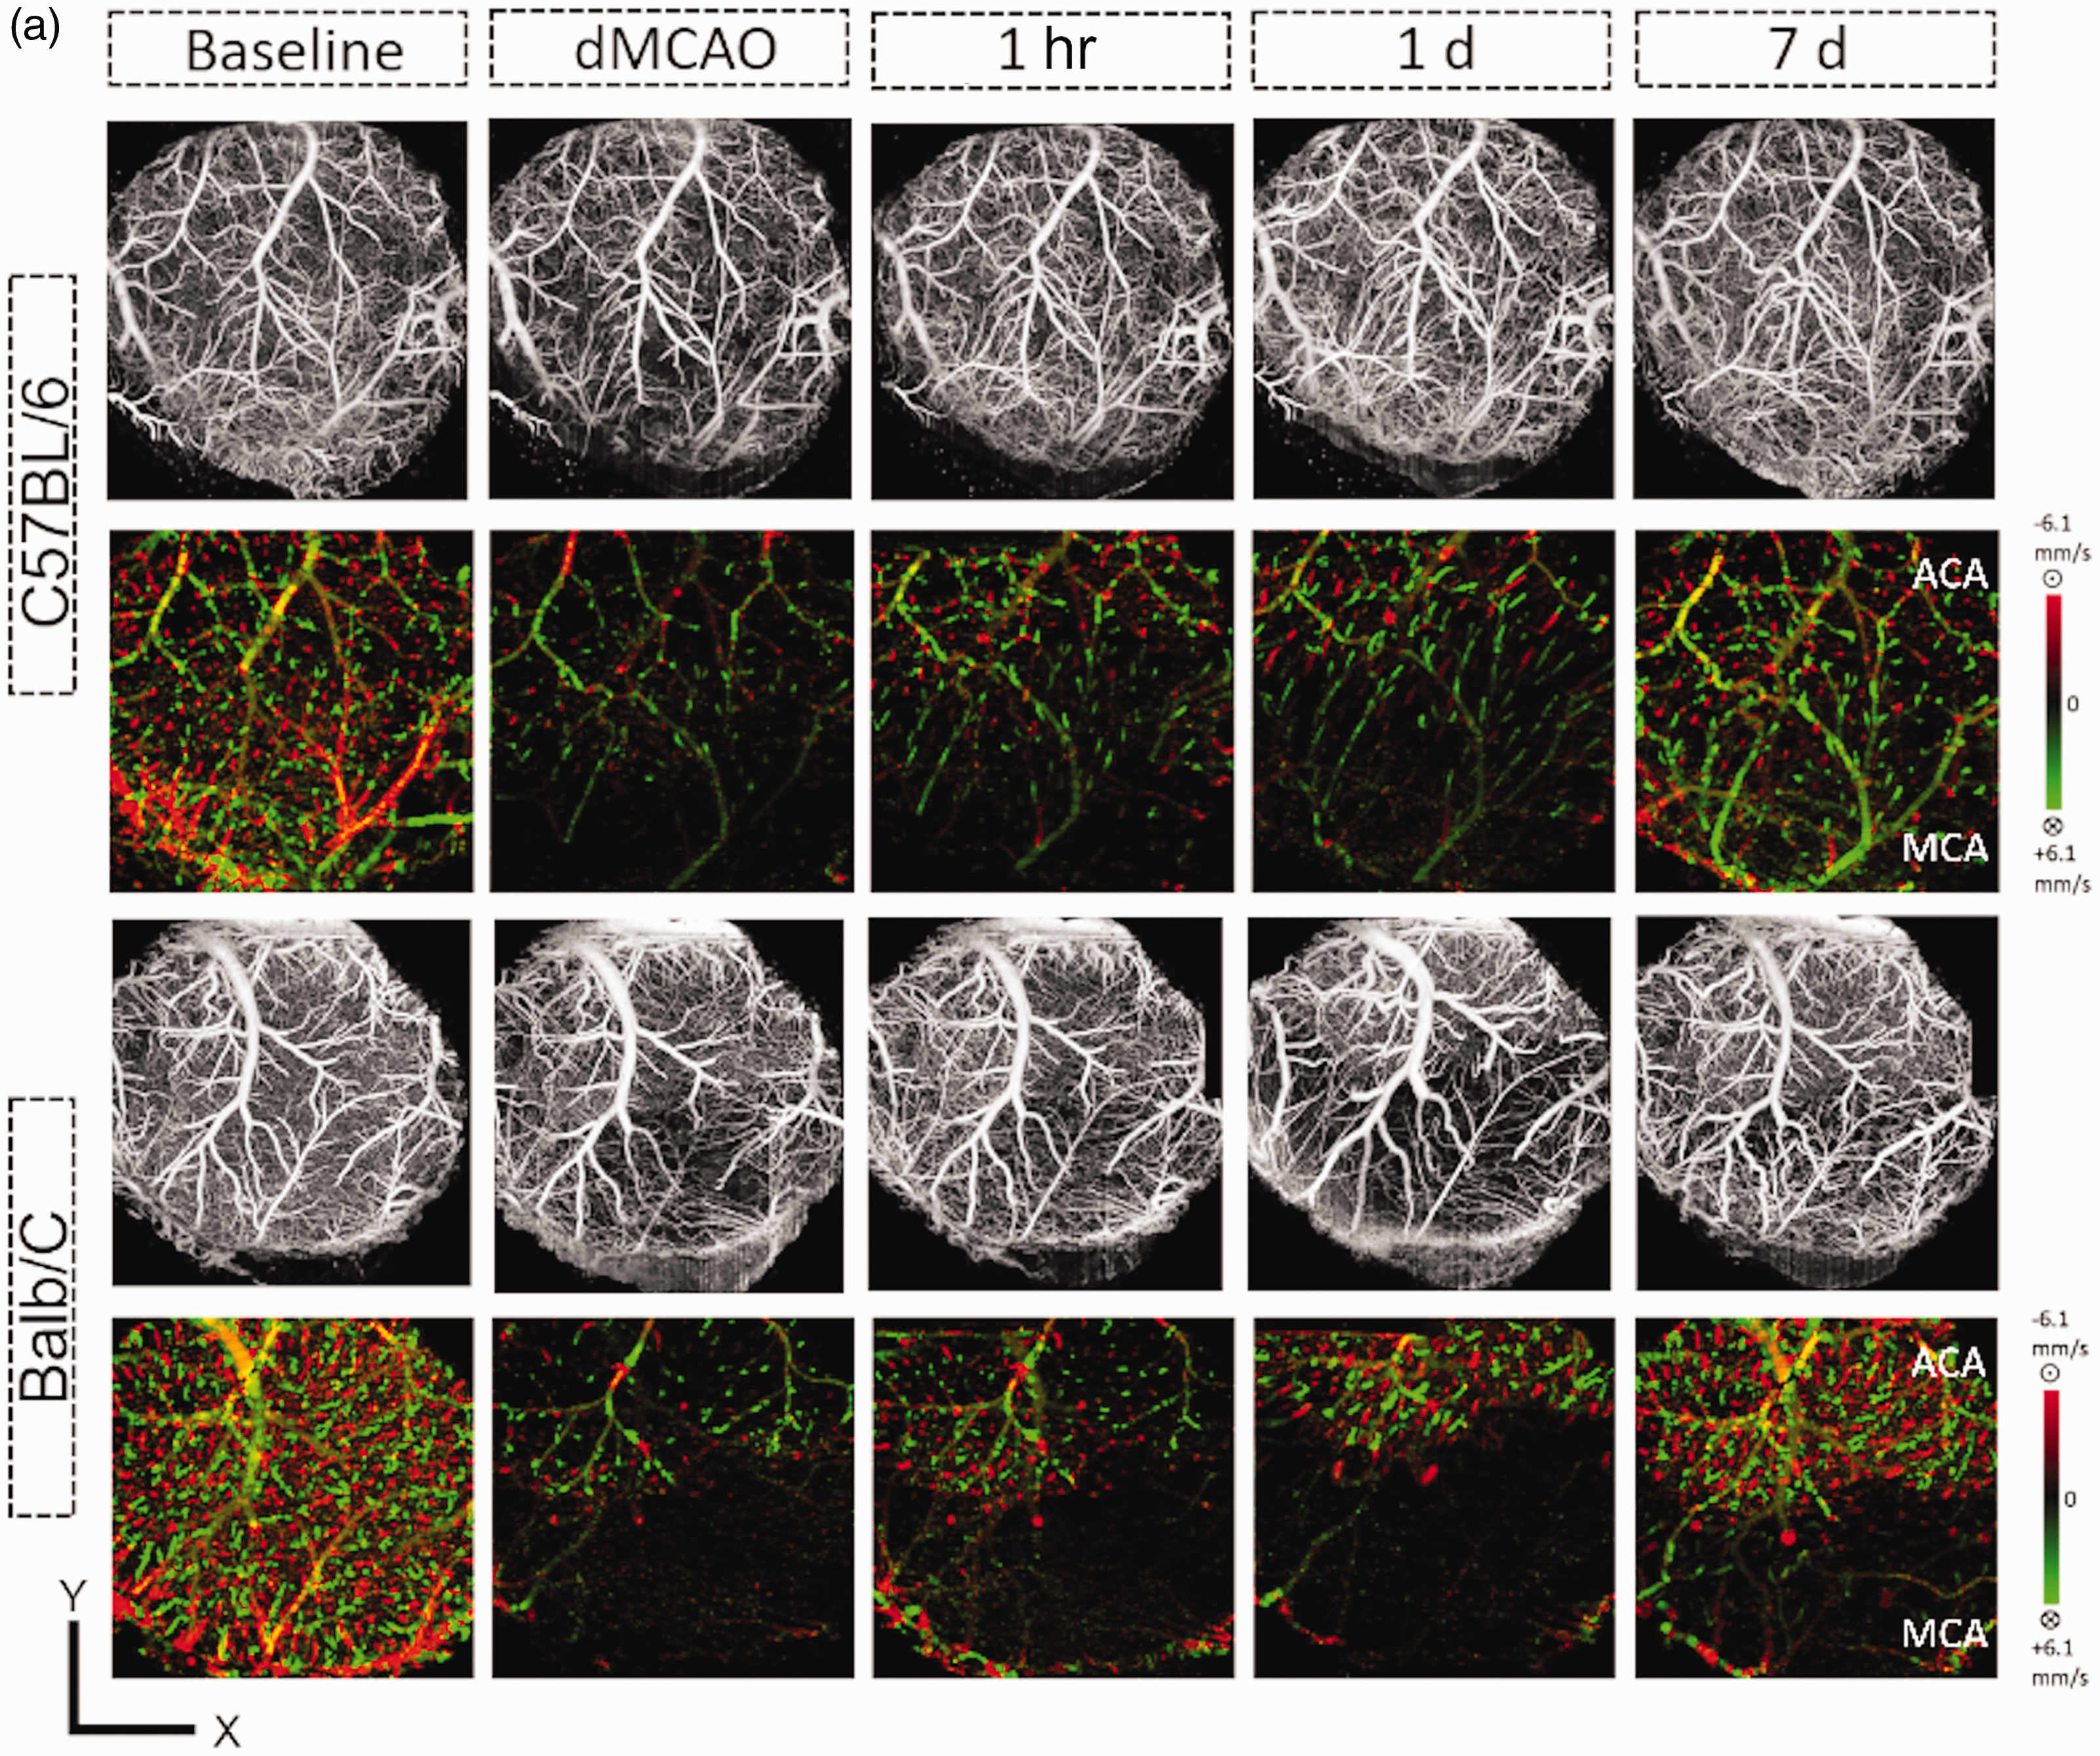
Penetrating arterial (PA) flow was nearly depleted and recovered very little in the MCA territory of Balb/C mice following stroke. Penetrating arterial (PA) flow was determined by OCT in the 5-mm-cranial window in each vessel territory over the time frames indicated. (a) Representative en face maximal intensity projection of OMAG data (upper panel) and en face average intensity projection of 3D bidirectional DOMAG data (lower panel) within the 300-um-thick tissue slab below the cortical surface of C57BL/6 (upper panels) and Balb/C (lower panels) mice. Scale bar: 1 mm for X and Y. Axial velocity range: ±6.1 mm/s. Dynamic change of the total flow, average cross section area and maximal axial flow velocity were determined for each strain and in the MCA (b–d) and ACA (e–g) territories. PA flow was reduced and remained significantly low after stroke in the MCA territory for both strains, although it was significantly recovered in C57BL/6 mice at 7d compared to Balb/C mice (b). In contrast, the reduction of PA flow in the ACA territory was similar between strains and with much more robust recovery (e). Maximal MCA PA velocity was significantly higher in the C57BL/6 mice compared to the Balb/C mice (E), while the maximal ACA PA velocity was higher in the Balb/C mice during the acute stage of stroke (h). Time point vs. baseline: *, **, ***P < 0.05, 0.01, 0.005 (Balb/C); §, §§, §§§P < 0.05, 0.01, 0.005 (C57/BL/6). Strain difference: #, ##, ###P < 0.05, 0.01, 0.005. N = 6/group.
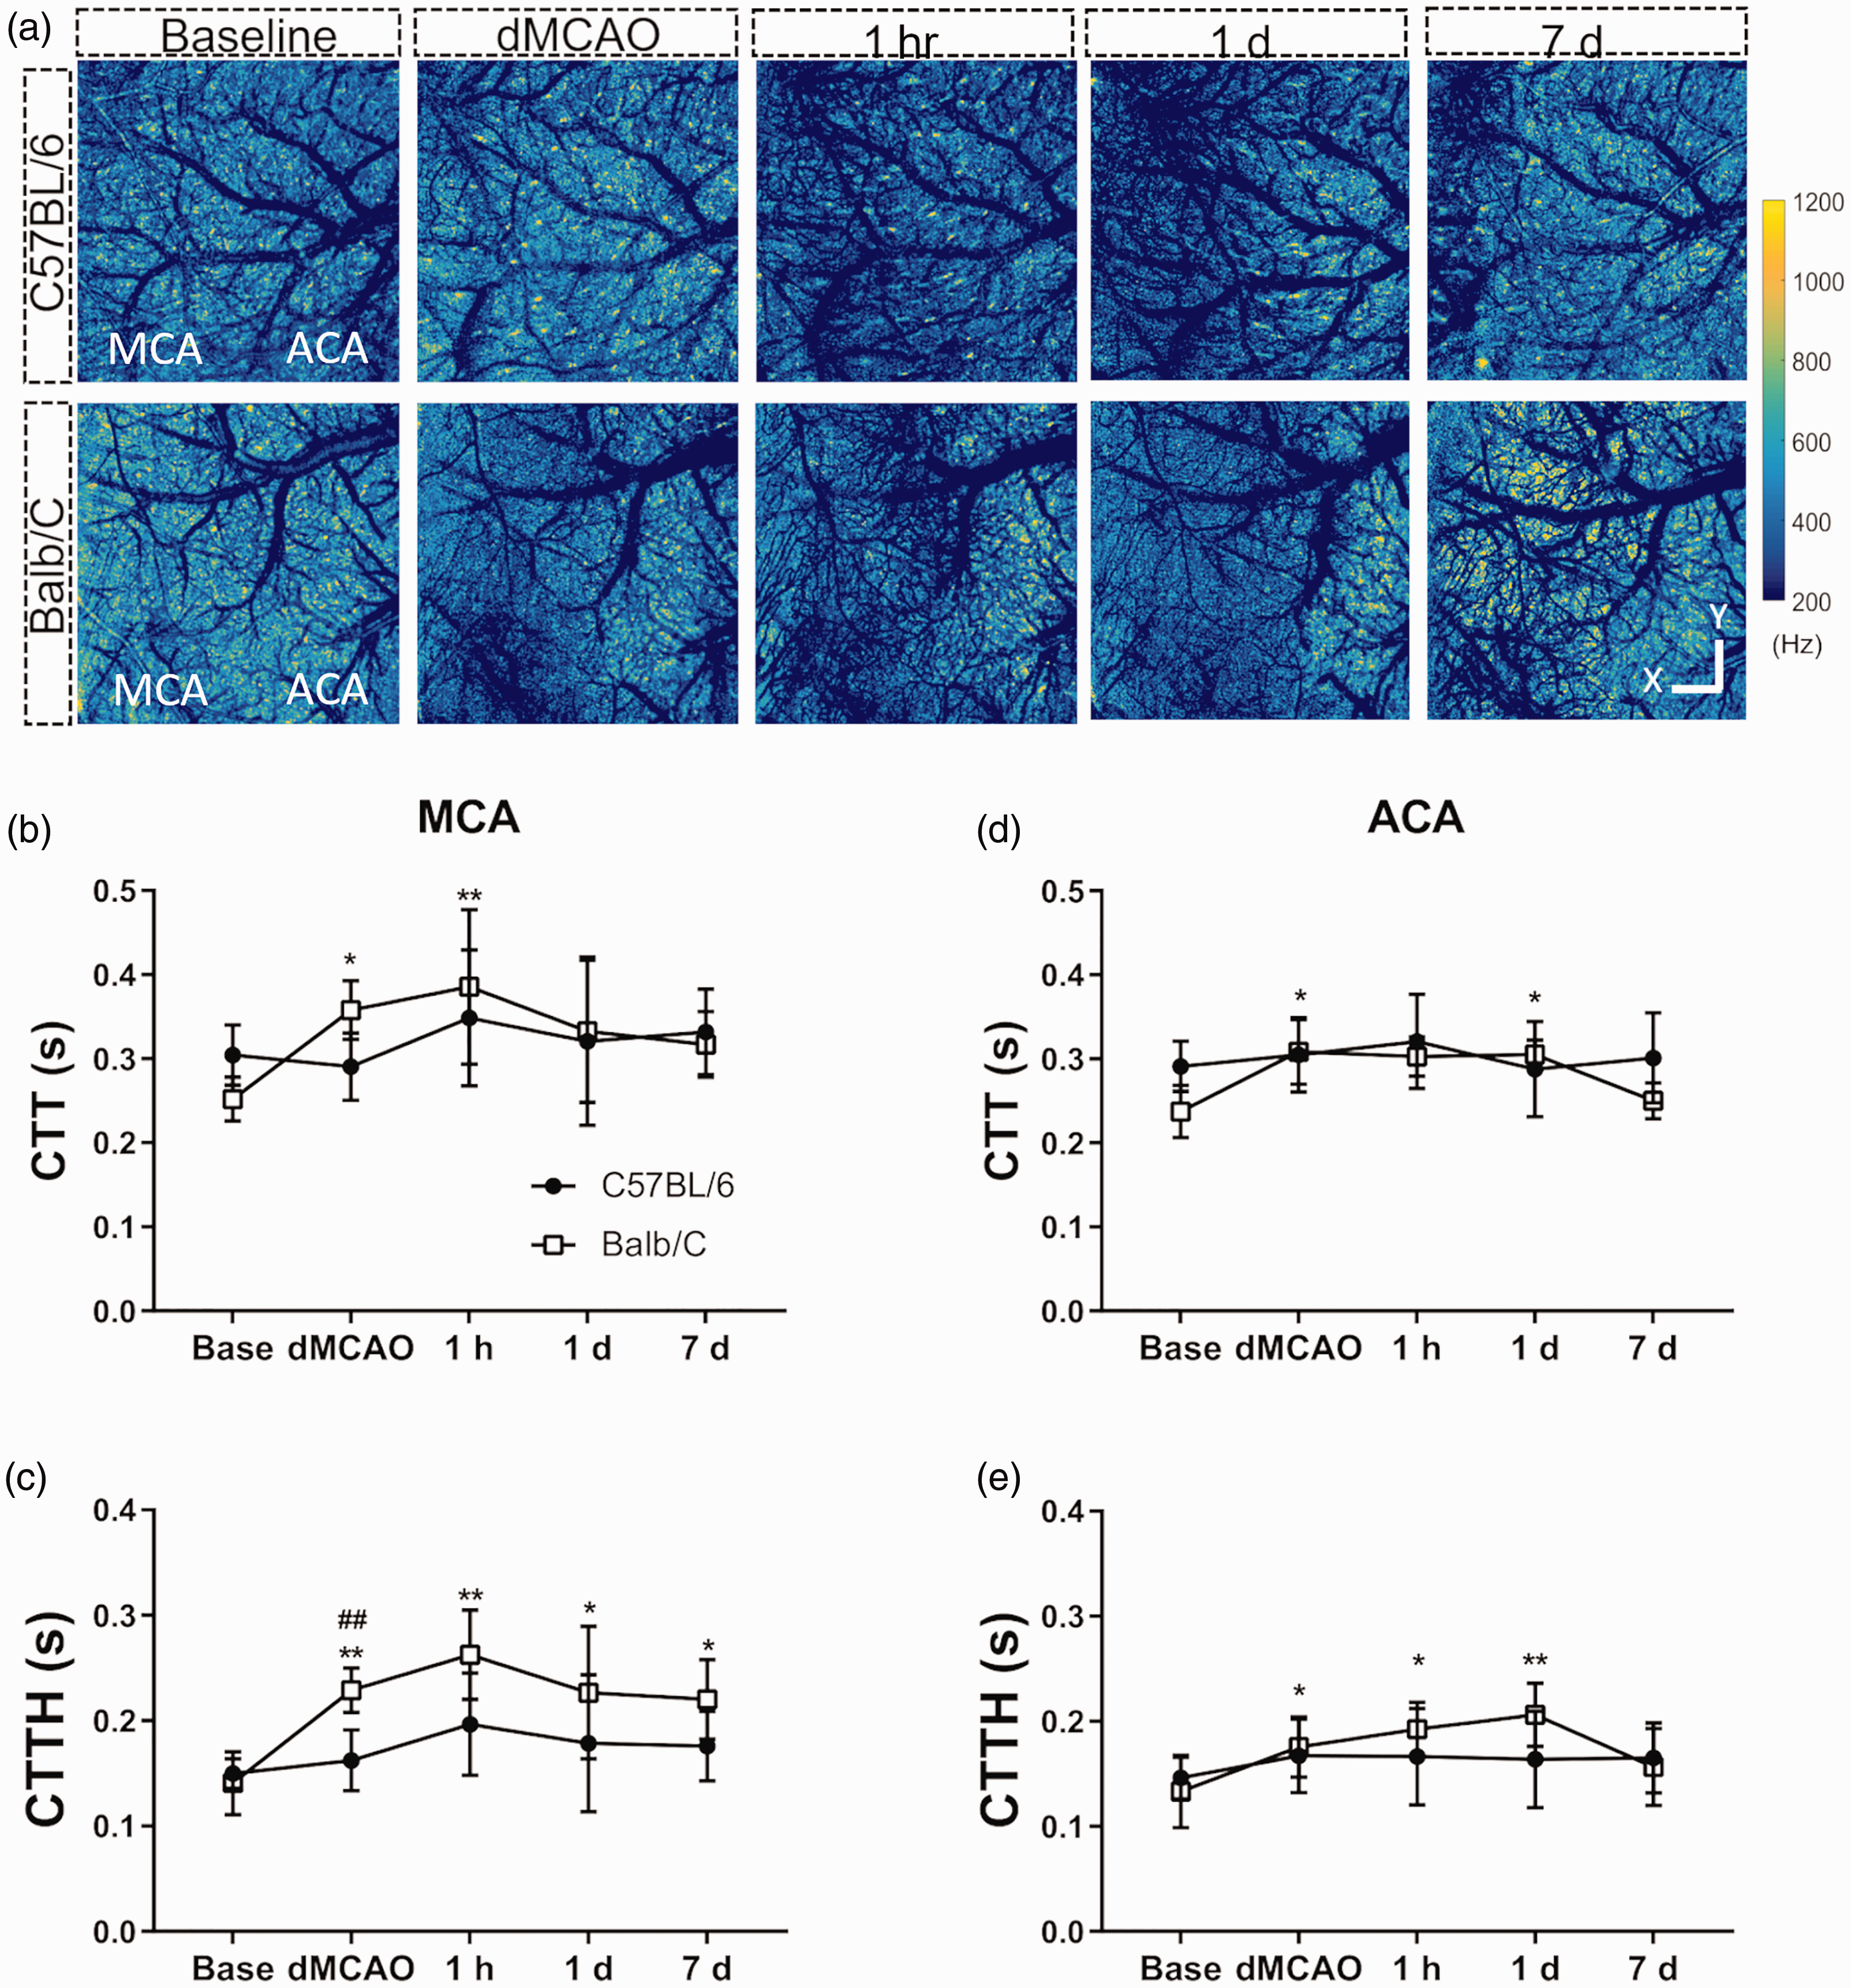
Balb/C mice displayed a greater spatial heterogeneity in capillary transit time following stroke compared to C57BL/6 mice. (a) Representative capillary mean frequency maps generated by en face projection of 3D frequency signal within cortical slabs for each time point as indicated. Scale bar represents 1 mm for X/Y dimensions. A significant increase in mean capillary transit time (CTT) occurred after dMCAO and extended beyond the reversal of CCAO in Balb/C mice in both MCA (b) and ACA (d) territories. Capillary transient time heterogeneity (CTTH) increased after stroke and was elevated at all-time points investigated in the MCA (c) or until 1d after dMCAO in ACA (d) territory in Balb/C mice. CTTH was significantly more increased during dMCAO in the Balb/C compared to C57BL/6 mice. Time point vs. baseline: *, **, ***P < 0.05, 0.01, 0.005 (Balb/C). Strain difference: ##P < 0.01. N = 6/group (same animals used for PA flow imaging).
Results
Native leptomeningeal collateralization accounts for rapid retrograde flow recruitment after stroke
To determine how native collaterals affect retrograde blood flow spatially and temporally, wide field Doppler OCT was employed to image and quantify flow over distal MCAs and ACAs. At baseline, a decreasing gradient in flow velocity was detected from proximal (S3) to distal (S1) MCA branches (Figure 3(a) to (c)), whereas the vessel diameter remained relatively constant in both strains (Figure 3(d)). Thirty minutes after dMCAO, a robust reversal of MCA flow and tortuous collateral anastomoses connecting the distal MCAs and ACAs were observed in C57BL/6 mice, while absent in the Balb/C mice (Figure 3(b)). During dMCAO, the flow velocity of distal MCA arterioles most adjacent to the connecting points between ACA and MCA (S1&S2, defined in Figure 3(a)) significantly slowed down to 56% and 31% of their baseline value in C57BL/6 mice compared to even more dramatic reductions to 0.2% and 1.7% of baseline in Balb/C mice. Thereafter, the flow velocity and flux of the more proximal segment of MCA arterioles (S3) imaged were progressively recovered seven days after dMCAO by 2–3 fold in C57BL/6 mice (Figure 3(b), (c) and (e)). In contrast, the flow velocity, vessel diameter and flux of S1 and S2 did not show significant degree of recovery with visible functional flow until seven days after dMCAO in Balb/C mice (Figure 3(c) to (e)). The strain difference in LMA flow recruitment assessed by DOCT in distal MCA arterioles correlated with the difference in rCBF in the MCA territory assessed by Laser Doppler Flowmetry (LDF) (Figure 3(f)), suggesting that the extent of collateral flow predicts the overall blood perfusion status of the ischemic territory.
Stroke-induced reduction of PA flow in the MCA territory is further exacerbated in Balb/C mice
We then determined how retrograde pial collateral flow affected downstream blood flow in the penetrating arterioles (PA) with high resolution Doppler OCT. Independent scans for OMAG and DOMAG within the 5 mm diameter cranial window covering the distal ACA and MCA areas were obtained and the final representative en face flow velocity maps are shown in Figure 4(a). We found that at 30 min after MCAO, the total PA flow within the MCA territory was greatly reduced in both C57BL/6 and Balb/C mice to approximately 13.7% and 0.03% of baseline level, respectively (Figure 4(a) and (b)). Despite the moderate reduction in LMA flow at the same time point for C57BL/6 mice, our data are clearly in agreement with the previous finding that PAs are the bottleneck of cerebral circulation. 24 PA in the MCA territory of C57BL/6 mice gradually recovered to 49.3% of baseline flow at seven days after dMCAO, in contrast to little recovery to 6.7% in the Balb/C mice during the same time period (Figure 4(b)). Differences in total flow between strains were also reflected in the average cross section diameter of patent PAs during dMCAO (Figure 4(c)). A similar but milder extent of total flow reduction in the ACA territory during dMCAO was detected in both strains of mice owing to temporary unilateral CCAO, and followed by a robust degree of recovery over seven days for C57BL/6 and Balb/C to 72% and 64% of baseline flow, respectively (Figure 4(e)). Maximal velocity of PA flow in MCA territory was significantly greater in the C57BL/6 mice compared to Balb/C mice during- and seven days after dMCAO (Figure 4(d)), while this trend was reversed between the two strains in the ACA territory during dMCAO (Figure 4(g)).
Balb/C mice display greater heterogeneity in capillary transit time after stroke compared to C57BL/6 mice
We next assessed and compared the mean and the spatial distribution of capillary transit time temporally after dMCAO between strains. The capillary mean frequency (MF) maps obtained from OCTA velocimetry were shown after masking vessels with diameter larger than 15 µm (Figure 5(a)). The spatial distribution characteristics of the transit time, including mean capillary transit time (CTT) and capillary transit time heterogeneity (CTTH) were deduced from these MF signals for both the MCA and ACA region as defined within the red squared areas described in the method (Figure 2(c)). Mean CTT increased 30 min after dMCAO in Balb/C mice and persisted 1 h after the reversal of CCAO in the MCA territory, whereas it increased during- and one day after dMCAO in the ACA territory (Figure 5(b) and (d)), although there was no significant strain difference at any given time point. Stroke-induced increase in CTTH was persistent throughout all time points in the Balb/C mice and significantly greater during dMCAO as compared to the C57B6 strain in the MCA territory (Figure 5(c) and (e)), leading to increased microvascular resistance and reduced oxygen extraction after stroke in the former. CTTH of Balb/C mice in the ACA territory also increased after dMCAO but recovered seven days afterwards. There was no significant strain difference in CTTH in the ACA territory (Figure 5(e)).
Genetic variation in the native cerebrovasculature between C57BL/6 and Balb/C mice
To determine whether the extent of native LMA collaterals contributes to retrograde flow compensation after ischemic stroke, we analyzed the arteriograms following DiI labeling. C57BL/6 mice displayed significantly more interconnecting LMA anastomoses between ACA and MCA compared to Balb/C at baseline (Figure 6(a) and (b)), in keeping with previous reports.8,25 In contrast, Balb/C mice had significantly better PcomA patency compared to that of C57BL/6 (Figure 6(c)). The distance from midline to the border between ACA and MCA territories was similar between two strains at three different neuroaxis levels (Figure 6(d)), suggesting that the relative area of MCA in the dorsal cerebral hemispheres was similar between the two strains of mice, consistent with previous findings. 8
Rapid leptomeningeal flow recruitment accounts for smaller infarction volume and neurological impairment
Rapid LMA flow recruitment predicted better stroke outcomes in terms of reduction in infarct size and motor function evaluated by horizontal ladder and corner tests seven days after dMCAO in the C57BL/6 mice compared to Balb/C mice (Figure 6(e) to (g)). Although the flow flux and rCBF in Balb/C mice were improved at seven days after dMCAO, the late flow recruitment did not rescue brain tissue already lost to ischemia, nor did it improve post-stroke functional outcome.
Discussion
Comparing two mouse inbred strains with different collateral extent, we demonstrated that native LMA collateralization strongly influenced rapid collateral flow dynamics that dictated more favorable stroke outcome following distal MCA occlusion. The LMA anastomoses of the C57BL/6 mice rapidly recruited retrograde blood flow from ACA to MCA during dMCAO and provided persistent perfusion afterward, contrary to the poor collateral status of the Balb/C mice. Furthermore, collateral blood flow in the former strain continued to improve over seven days after MCAO, particularly in the segments proximal to the ACA, leading to more superior overall improvement of cortical perfusion that was consistent with the rCBF results determined by laser Doppler. In contrast, Balb/C mice with fewer LMA anastomoses had poor collateral flow recruitment in the acute phase of MCAO compared to C57BL/6 mice, despite similar flow characteristics between the two strains at baseline. Interestingly, Balb/C mice demonstrated increased CBF at seven days after MCAO, likely due to newly developed collateral vessels as described previously. 8 During MCAO, blood flow in the PAs of the MCA territory was reduced greatly in both strains of mice, while it recovered more substantially in the C57BL/6 mice compared to Balb/C mice over the course of one week. Balb/C mice also displayed a significantly increased heterogeneity in capillary transient time compared to C57BL/6 mice during MCAO with persistently increased transit time over the course of one week. In keeping with rapid flow recruitment via LAM anastomoses, C57BL/6 mice sustained smaller stroke size and also fared better in neurological outcome seven days after MCAO compared to Balb/C mice, suggesting that the degree of preexisting native collateralization contributes to rapid LMA flow compensation and improved hemodynamics downstream after stroke onset.
Our wide-field DOMAG data identified different types of mechanisms accounted for rapid versus late flow recruitment in the response of pial vessels to MCAO. There is no known strain difference in physiological response to dMCAO, 26 yet C57BL/6 mice showed rapid flow recruitment via preexisting LMA anastomoses, leading to morphological changes in some of the pre-existing arteriole-to-arteriole collaterals such as increased tortuosity immediately after MCAO. 14 It is conceivable that, with the low-resistance arteriolar collateral pathways, arteries of the preexisting collaterals remodel rapidly following MCAO by becoming tortuous. Although we have not determined the vascular tone or resistance in cerebral vessels during dMCAO or after reversal of CCAO, vascular tone of the intact hind limbs did not differ between Balb/C and C57BL/6 via evaluation of the hyperemic response. Whereas in ischemic limbs, the hyperemic response of Balb/C was significantly higher than C57BL/6, 27 suggesting that Balb/c mice had even lower vascular tone following long ischemic insult. Thus, the observed differences in cerebral blood flow parameters between the two strains could be caused by differences in numbers or diameter of pre-existing collaterals. In particular, the differences in blood flow parameters immediately after dMCAO are most likely due to smaller diameters of preexisting LMA collaterals in BALB/c mice. On the other hand, the delayed improvement in the distal segments of MCA branches of Balb/C mice at seven days after MCAO might be attributed to newly developed collaterals between MCA and ACA territory, which were not seen at least during or one day after MCAO. Indeed, collateral vessel remodeling has been reported in Balb/C mice along with A, AKR and SWR strains after MCAO for significantly increased diameter, albeit in very small numbers in neo-collateral formation. 8 Thus, without favorable pre-existing collateral pathways, the arterioles remodeled over time by forming new connections to carry the re-routed blood in the Balb/C mice.
Despite a more favorable PComA patency, Balb/C mice had significantly larger infarct area after MCA stroke, implicating a greater impact of preexisting LMA collaterals than Willisian collaterals on stroke outcome following distal MCA occlusion. As well described previously, the impact of collateral circulation is influenced by the anatomical sites of steno-occlusion. 28 In the setting of vessel occlusion distal to Willisian collaterals, LMA collaterals play an important role by compensating blood flow of the cortex suffering ischemia from the distal site of steno-occlusion in a retrograde fashion, leading to a more favorable prognosis in the patient with acute ischemic stroke.5,29,30 Although PComA can supply blood flow via the Willisian collaterals following CCAO and may also compensate LMA blood flow in the setting of dMCAO, the contribution of PComA is minimal in mitigating ischemic injury due to very few pre-existing LMA connecting collaterals in the Balb/C mice. Besides the difference in vascular anatomy, strain difference in major proangiogenic factors was also reported in these mice. The expression of VEGF-A isoforms in response to hindlimb ischemia was found attenuated in BALB/C compared to C57BL/6 mice, 31 although Balb/C mice produced more VEGF than C57BL/6 mice in response to sponge disk implanted subcutaneously during wound healing. 32 Balb/C also have higher number of VEGFR1 than C57BL/6 mice in endothelial cells. 33 Higher HIF1α expression was reported in CD1 mice compared to C57BL/6 mice, but it has not been compared between Balb/C and C57BL/6. 34
What makes this study informative is our evaluation of the spatiotemporal dynamics in LMA anastomoses within the same mice over seven days. Because wide-field DOMAG with skull intact is suitable for measuring individual blood flow within the top 150 µm of the brain in relatively larger vessels, it is thus an ideal imaging modality for studying dynamic flow changes in LMA anastomoses. The technique provides a great improvement over previous methodologies for visualizing spatiotemporal blood perfusion in the cortex following stroke. For the first time, our results using DOMAG clearly demonstrated that LMA collateral recruitment stimulated at ictus in laboratory animals depends on the extent of native collateralization, complementing other optical imaging techniques without information on flow direction.35,36 With the high resolution DOMAG, our data further shed light on the hemodynamic changes downstream of the LMA collateral vessels. When LMA flow is restored, downstream flow velocity, such as in PAs and capillaries, is expected to increase. However, PA flow remained low and the capillary flow velocity continued to decline after CCA reperfusion even in the presence of good retrograde flow compensation in the C57BL/6 mice. This may suggest a persistent flow impairment at the capillary level during dMCAO and following the reversal of CCAO, although data from simultaneous measurement of flow velocity and vessel diameter at the LMA, PA and capillary level are necessary to confirm this hypothesis. It is likely that less collateralization in the PAs and capillaries could further exacerbate a stagnant flow condition after dMCAO and increased clot formation among these smaller vessels, in contrast to more favorable flow condition in the LMA arteries owing to better collateralization, although the effect of vasospasm cannot be excluded in the former.
Because the collateral status determined in acute ischemic stroke patients is secondary to the remodeling of collateral vessels over the native form, our current study may not be able to address how much the native collateral formation alone determines stroke outcome in humans. To that end, evidence from animal studies supported that the number and diameter of pial collateral “arterioles” decreased with aging, and aerobic exercise could restore this age-induced collateral rarefaction and reduce stroke severity. 37 This age effect on collateral remodeling could explain why endovascular thrombectomy for acute large vessel occlusion did not show a comparative benefit in younger patients.38,39 In addition, patients with metabolic syndrome were associated with poor LMA collateral status in acute ischemic stroke, 40 further suggesting that the degree of LMA status is dynamic. In line with clinical data, we previously demonstrated that impaired remodeling of LMA vessels resulted in poor stroke outcome in type II diabetic mice following dMCAO compared to non-diabetic mice that shared a similar extent of native collaterals, 14 thereby underscoring a key role of LMA collateral remodeling in determining stroke outcome. Nonetheless, from the perspective of native collateral status, it is potentially feasible to determine the relationship between native collaterals and stroke outcome in humans with the identification of Rabep2 that encodes native LMA collaterals. 41 In addition, indirect information regarding collateral extent might be obtained noninvasively through retinal examination because the arterial branch patterning in the retina and the MCA trees apparently are correlated with genetic background and were able to predict variation in collateral extent and stroke severity in mice. 42 Finally, although these studies provide indisputable relationship between the extent or status of collaterals and ischemic injury, genes modulating infarct volume independently of the extent of collateral circulation have also been identified, 43 implicating the complexity of biological response to ischemic insult. Our results also suggest that angiogenesis alone may not be useful in treating or pre-treating ischemic stroke; the addition of lower patency small vessels would not improve perfusion, and appropriately-sized collateral arterial vessels are needed. This is consistent with a shift in thinking in the field of therapeutic revascularization, in which arteriogenesis (increase in size of arterioles) is now being considered as a superior alternative to angiogenesis.
Footnotes
Author’s note
Yosuke Akamatsu is also affiliated with Department of Neurosurgery, Iwate Medical University, Iwate, Japan.
Acknowledgements
The authors would like to thank Ms. Suwai Wong and Dr. Gratianne Rabiller for assisting the production of figures and statistical analysis, and Dr. Brant Watson for manuscript editing.
Authors’ contributions
Atsushi Kanoke performed the stroke induction, OCT imaging, infarct assessment, overall data analysis, and contributed to manuscript writing.
Yosuke Akamatsu performed the stroke induction, OCT imaging, behavioral tests, arteriogram, infarct assessment, overall data analysis, and contributed to manuscript writing.
Yasuo Nishijima performed the stroke and CCAO induction, OCT imaging, arteriogram, vessel diameter measurement, overall data analysis, and contributed to manuscript writing.
Eric To performed data analysis for PA flow imaging.
Chih Cheng Lee performed data analysis for wide field pial Doppler OCT.
Yuandong Li validated data analysis for PA flow imaging and velocimetry.
Ruikang K. Wang supported the algorithms for all OCT data analysis.
Teiji Tominaga provided overall interpretation and clinical relevance of the study.
Jialing Liu provided the overall idea, design, logistics and writing of the manuscript.
Funding
The author(s) disclosed receipt of the following financial support for the research, authorship, and/or publication of this article: This work was supported by NIH grant R01 NS102886 (JL), VA merit award I01BX003335 (JL), Research Career Scientist award IK6BX004600 (JL).
Declaration of conflicting interests
The author(s) declared no potential conflicts of interest with respect to the research, authorship, and/or publication of this article.