
Abstract
In this study, we applied on-resonance variable delay multiple pulse (onVDMP) MRI to study D-glucose uptake in a mouse model of Alzheimer’s disease (AD) tauopathy and demonstrated its feasibility in discriminating AD mice from wild-type mice. The D-glucose uptake in the cortex of AD mice (1.70 ± 1.33%) was significantly reduced compared to that of wild-type mice (5.42 ± 0.70%, p = 0.0051). Also, a slower D-glucose uptake rate was found in the cerebrospinal fluid (CSF) of AD mice (0.08 ± 0.01 min−1) compared to their wild-type counterpart (0.56 ± 0.1 min−1, p < 0.001), which suggests the presence of an impaired glucose transporter on both blood–brain and blood–CSF barriers of these AD mice. Clearance of D-glucose was observed in the CSF of wild-type mice but not AD mice, which suggests dysfunction of the glymphatic system in the AD mice. The results in this study indicate that onVDMP MRI could be a cost-effective and widely available method for simultaneously evaluating glucose transporter and glymphatic function of AD. This study also suggests that tau protein affects the D-glucose uptake and glymphatic impairment in AD at a time point preceding neurofibrillary tangle pathology.
Keywords
Introduction
Alzheimer’s disease (AD) is one of the most common neurodegenerative diseases and its prevalence increases with age. 1 Early diagnosis of AD is needed for several reasons, especially possible timely pharmacological intervention to slow the rate of disease progression. 2 In addition to its two main pathological hallmarks, i.e. the amyloid-beta (Aβ) plaques and neurofibrillary tangles, a diminished number of glucose transporters at the blood–brain barrier (BBB) is another trait of AD. 3 Reduced glucose uptake in hippocampus and cortical regions have been observed in individuals who are at genetic risk for AD, or have mild or no cognitive impairment but continue developing to AD. 4 The glucose-uptake impairment precedes brain atrophy and neuronal dysfunction, and therefore can provide valuable information for early diagnosis of AD. 5 In addition to the BBB pathway, there is an alternative pathway to circulate glucose in the brain, the glymphatic system (Figure 1(a)). This is a paravascular route that facilitates cerebrospinal fluid (CSF) flow through the brain parenchyma. 6 After entering the CSF through the blood–cerebrospinal fluid barrier (BCSFB), glucose can be recirculated to the interstitial fluid (ISF) in parenchyma through the glymphatic pathway. 7 Therefore, characterization of the glucose uptake in CSF may add a new dimension to evaluate the functions of the BCSFB and the glymphatic system. Currently, the examination of CSF–ISF exchanging processes by MRI has been achieved mainly by intracranial 8 or intrathecal infusion 9 of gadolinium-based contrast agents. Although intrathecal infusion has been applied to human studies, it is still a highly invasive method and might not be ideal for routine and repeated measurements on patients. Also, the safety of gadolinium-based agents is currently a concern as they may be retained in the deep gray matter nuclei for longer periods of time. 10 In the current study, we also aim to explore the possibility of assessing the glymphatic pathway using D-glucose as a natural biodegradable tracer.
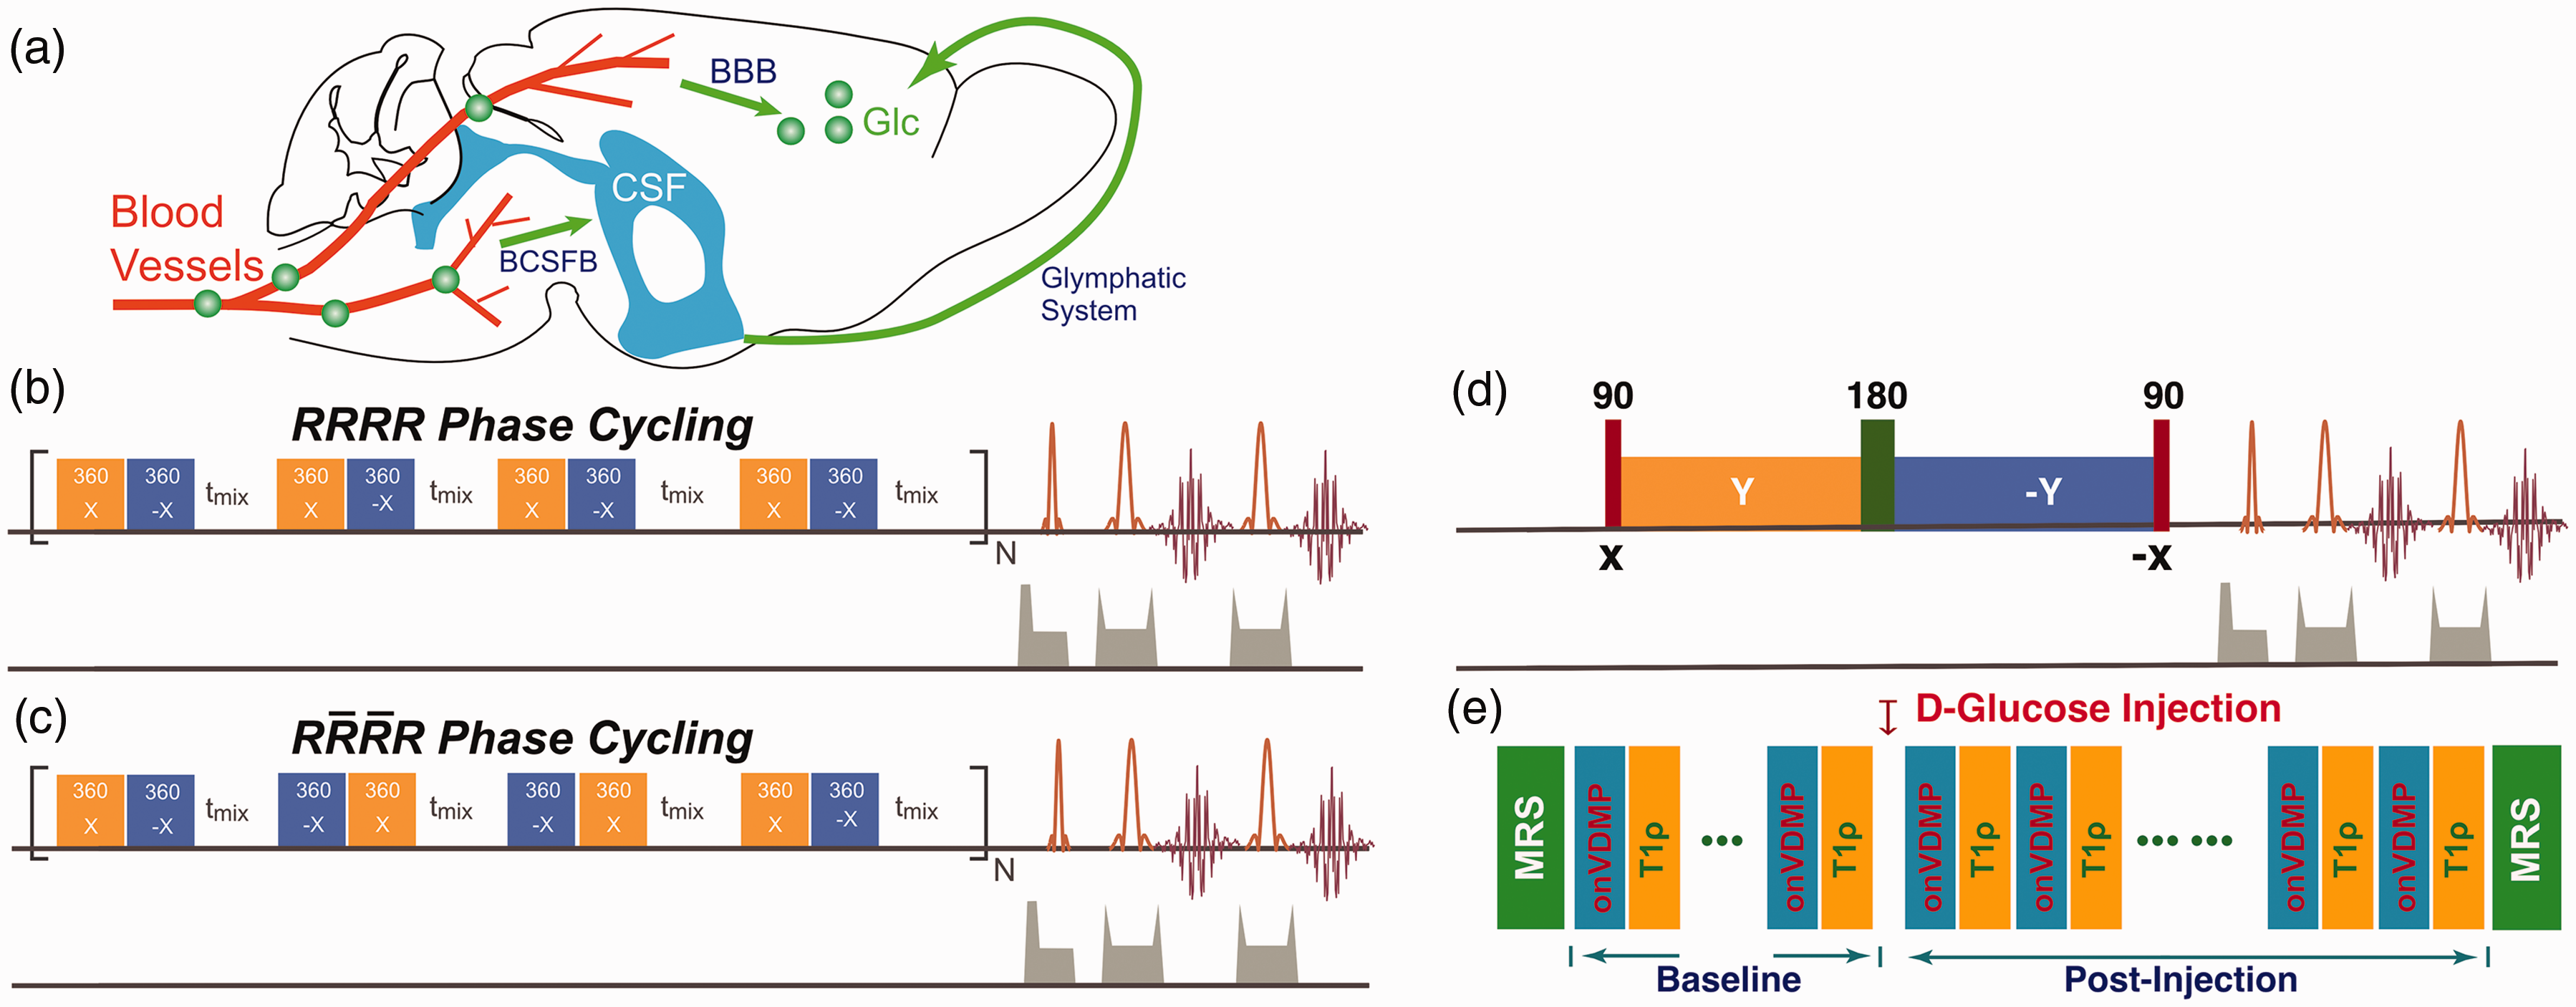
(a) Illustration of the glucose transport pathways in mouse brain after intravenous infusion of glucose. Glucose in blood crosses the BBB’s luminal and abluminal membranes and reaches parenchyma. Part of the glucose rapidly enters the CSF through the BCSFB and recirculates to the parenchyma through the glymphatic system. The onVDMP saturation module with (b)
For several decades, glucose uptake and metabolism in brain have been assessed non-invasively using 2-[ 18 F]fluoro-2-deoxy-D-glucose positron emission tomography (FDG-PET). 11 Despite its great detection sensitivity, the high-cost of FDG-PET hampers its wide clinical application. In addition, the use of a radioactive tracer is not ideal for repeated measurements, especially when combined with CT for anatomical referencing. 12 Alternative ways to measure glucose uptake and utilization are 13C and 1H in vivo magnetic resonance spectroscopy (MRS),13,14 as well as a recent deuterium metabolic imaging method. 15 Although these MRS approaches have shown great success in studying fundamental metabolic processes during glucose infusion, they are difficult to implement in the clinical environment due to the low detection sensitivity and limited availability of 13C and 2H coils and related transmit/receive systems.
Glucose chemical exchange saturation transfer (glucoCEST) MRI is a recently developed technique16,17 that can detect unlabeled glucose at physiologically relevant concentrations using proton-only MRI scanners without the requirement of additional hardware. Among various glucoCEST methods, on-resonance variable delay multiple pulse (onVDMP) MRI is promising due to its excellent labeling efficiency and sensitivity.18–20 In this study, we applied onVDMP MRI to detect cerebral D-glucose uptake and CSF clearance in AD mice and demonstrate its feasibility in discriminating AD from normal mice.
Methods
onVDMP sequence with phase cycling scheme
The conventional onVDMP sequence is composed of a train of binomial pulses followed by an image acquisition module, as shown in Figure 1(b).18–20 As a previous VDMP study suggested,
21
the fast-exchanging signal component decays during the mixing time. Hence, the mixing time between binomial pulses was set to zero in this study of hydroxyl groups in D-glucose under physiological conditions and the offset of the binomial pulses was set to the water resonance. In practice, however, a water resonance shift may be induced by glucose infusion,
22
which may affect the onVDMP MRI signal. Also, pulse imperfections caused by B1 inhomogeneity may cause image artifacts. These issues can be well addressed by phase cycling, a technique that has been commonly used in NMR composited pulses to cancel out the undesirable effects from B0 and/or B1 inhomogeneities.
23
Here, we introduced a new phase cycling scheme to onVDMP sequence to improve its robustness against water resonance shift and B1 inhomogeneity, as indicated in Figure 1(c). The phase cycling scheme is
Animal preparation
All animal experiments were performed under the protocols based on the NIH Guidelines for Care and Use of Laboratory Animals. All experiments were performed in accordance with the Animal Research Reporting In Vivo Experiments guidelines, 24 and approved by the Johns Hopkins University animal care and use committee. Four female Tau4RΔK (Tau) mice 25 with an age of 7–8 months and four female age-matched C57BL/6J mice of comparable bodyweight (24 ± 2 g) were used. Two age-matched BALB/c mice were used for the dynamic monitoring of D-glucose uptake using MRS. Three female age-matched C57BL/6J mice were used for a control experiment with saline infusion. Comparisons between the onVDMP and T1ρ method, together with MRS measurement before and after D-glucose infusion, were carried out on three female age-matched C57BL/6J mice. The Tau mice were bred at Johns Hopkins University and the onset of tau tangles starts at the age of six months. 25 Many studies,26–28 including several failed anti-amyloid agent clinical trials, 29 have suggested that neurofibrillary tangles instead of plaques drive the cognitive decline and atrophy of the brain in AD patients. The new Tau mouse model (Tau4RΔK) expresses a human tau repeat domain that is capable of inducing the pathological conversion of wild-type (WT) mouse tau and exhibits the age and neuritic plaque dependent tau pathology seen in AD patients. 25 This model provides us with a unique opportunity to demonstrate the use of the onVDMP MRI approach for assessing changes in brain glucose uptake and CSF clearance through the glymphatic pathway in early AD.
MRI experiments
All MRI experiments were performed on a horizontal bore 11.7 T Bruker Biospec system (Bruker, Ettlingen, Germany) equipped with actively shielded gradients with a maximum strength of 74 Gauss/cm. A 72 mm quadrature volume resonator was used as a transmitter and a 2 × 2 mouse phased array coil for acquisition. All animals were anesthetized using 2% isoflurane in medical air, followed by 1–1.5% isoflurane for maintenance during the MRI scan. The mouse head was positioned using a bite bar and two ear pins. During the MRI scan, mice were placed on a water-heated animal bed. The tail vein was cannulated with a catheter for D-glucose infusion before MRI scans. Respiratory rate was monitored via a pressure sensor (SAII, Stony Brook, NY, USA) and maintained at 40–60 breaths per minute. The B0 field over the mouse brain was adjusted using field-mapping and second-order shimming.
According to a previous study, 20 the optimal signal-to-noise ratio of onVDMP signal can be achieved by setting the length of saturation module comparable to the T2 value of tissue of interest. To obtain satisfactory onVDMP signal for CSF, the T2 value of CSF was measured by Car–Purcell–Meiboom–Gill preparation module 30 with 10 echo times ranging from 20 ms to 340 ms and rapid acquisition with refocused echoes (RARE) imaging module with an echo time (TE) of 120 ms, TR = 10 s, RARE factor = 23, slice thickness = 1 mm, a matrix size of 196 × 128, and a field-of-view (FOV) of 20 × 10 mm2.
To validate that R1ρ theory can be applied for the analysis of onVDMP data, we compared the dynamic glucose enhanced (DGE) signals obtained by onVDMP MRI and a classical on-resonance spin-lock (T1ρ) method.31–36 In the onVDMP DGE measurements of the brain parenchyma, 12 binomial pulses with 36 ms length were implemented. The duration of each binomial pulse pair was 3 ms. The T1ρ sequence is illustrated in Figure 1(d). Two Gaussian 90° pulses (1 ms width) were used for the preparation and flip-back pulses and one Mao pulse 37 (5 ms width) was applied for the 180° refocusing pulse. The total length of the T1ρ module was set to 36 ms, which was identical to the onVDMP length. The onVDMP and T1ρ DGE curves were collected in an interleaved manner on mouse brain as illustrated in Figure 1(e). Two MRS spectra were collected before and after the DGE experiments to validate the glucose concentration change after D-glucose infusion. The in vivo MRS data were acquired on a voxel of 3 × 3 × 3 mm3 in the thalamus using a STEAM sequence (echo time (TE) = 3 ms, mixing time (TM) = 10 ms, repetition time (TR) = 2.5 s, average number (NA) = 128) with outer volume suppression. First- and second-order shims were adjusted for each VOI using a field-mapping method. The water signal was suppressed by the variable power radiofrequency pulses and optimized relaxation delays (VAPOR) method. 38 The image slice was selected to also enable us to observe the superior sagittal sinus (SSS), voxels in which were used to extract the D-glucose concentration in the blood vessels. Prior to the experiments, one Time-Of-Flight MRA experiment covering the whole mouse brain was collected to locate the SSS. Other imaging parameters were: TR/TE = 2.5 s/5 ms, RARE factor = 23, slice thickness = 1 mm, a matrix size of 196 × 128 within a FOV of 20 × 10 mm2. The scan time for each onVDMP experiment was fixed to 7.5 s and DGE images were acquired continuously for 35 min. A bolus of 0.15 mL 50% w/w D-glucose (0.5 g/mL, clinical-grade dextrose, Hospira, Lake Forest, IL) was given at 10th min of the dynamic experiment through the tail vein using a syringe pump (Harvard Apparatus, Holliston, MA, USA). The first five minutes pre-scan were used as dummy scans to make sure the mouse was stabilized in the scanner.
The length of the saturation module of an onVDMP sequence is proportional to the number of binomial pulses. For the current study, two onVDMP preparations (12 and 100 pulses), i.e. of different saturation-module lengths (i.e. 36 ms and 300 ms), were repeated in an interleaved fashion. A 10 min pre-scan was performed before glucose infusion and the first five minutes pre-scans were discarded. DGE images were acquired continuously through 27.5 min post-infusion. The MRI readout and glucose infusion protocol were identical to the one used in the above experiments. Osmolarity control experiments were performed on three C57BL/6J mice by injecting 3% saline solution (0.15 mL in one minute). Since the osmolarity of 3% saline is about 2.5 times lower compared to the 50% glucose, we evaluate the response in proportion. The experiments revealed the stability of the onVDMP MRI signal, as well as the potential non-glucose contributions to the DGE signal, e.g. due to osmolarity differences between blood and the infusate.
Dynamic D-glucose uptake detected by MRS
Dynamic in vivo MRS spectroscopy was performed to validate the change of D-glucose concentration in brain tissue after D-glucose infusion. An infusion protocol identical to that used in the DGE MRI experiments was adopted. The MRS experiments were identical to the one used in the onVDMP and T1ρ DGE comparison experiment except for NA = 64, which leads to a scan time of 2.6 min for each MRS.
Data analysis
The onVDMP and on-resonance spin-lock MRI approaches closely resemble each other and it has been shown that CEST approaches such as onVDMP MRI can be also described using


To correct for motion between DGE images, image registration was done using Medical Imaging Registration Toolbox. 43 The regions of interest (ROIs) were selected by hand with the reference of mouse brain atlas (https://mouse.brain-map.org).
The total creatine (tCr) concentration was measured using LCModel
44
from the in vivo MRS and used as a concentration reference for D-glucose. The glucose uptake (

The glucose uptake curves measured by 1H MRS and DGE MRI were fitted using exponential functions to allow quantitative comparison


Sensitivity and specificity determination
The sensitivity and specificity in distinguishing AD mice from healthy mice was calculated using Receiver Operating Characteristic (ROC) plots on the extracted glucose uptake amplitudes (
Results
Measurement of T2 value for CSF
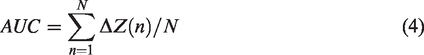
Representative images of mouse brain as a function of echo time are shown in Figure 2(a). From the images, the signal of brain parenchyma attenuates much faster compared to that of CSF. This can also be observed from the signal intensities of cortex and CSF as a function of echo time, as shown in Figure 2(b). With an echo time of 120 ms, the cortical signal intensity is only 8.4% with respect to its maximum value (at TE = 0 ms), while CSF signal intensity still maintains 74.4%. By fitting the signal intensities, the T2 values of cortex and CSF were determined to be 44 ± 5 ms and 380 ± 25 ms, respectively. According to our previous report, the optimal signal-to-noise for the onVDMP method is obtained when the length of the saturation module is comparable to the T2 value of interested region. 20 Therefore, onVDMP sequences with 12 binomial pulse pairs (36 ms) and 100 binomial pulse pairs (300 ms) were used to detect the glucose uptake in tissue and CSF, respectively.
The T2 values of cortex and CSF were measured using a CPMG preparation module followed by a RARE imaging module. (a) Representative sagittal images of mouse brain recorded with different echo times. (b) The signal decay as a function of echo time for tissue and CSF, respectively.
Comparison of DGE signal obtained by onVDMP and T1ρ
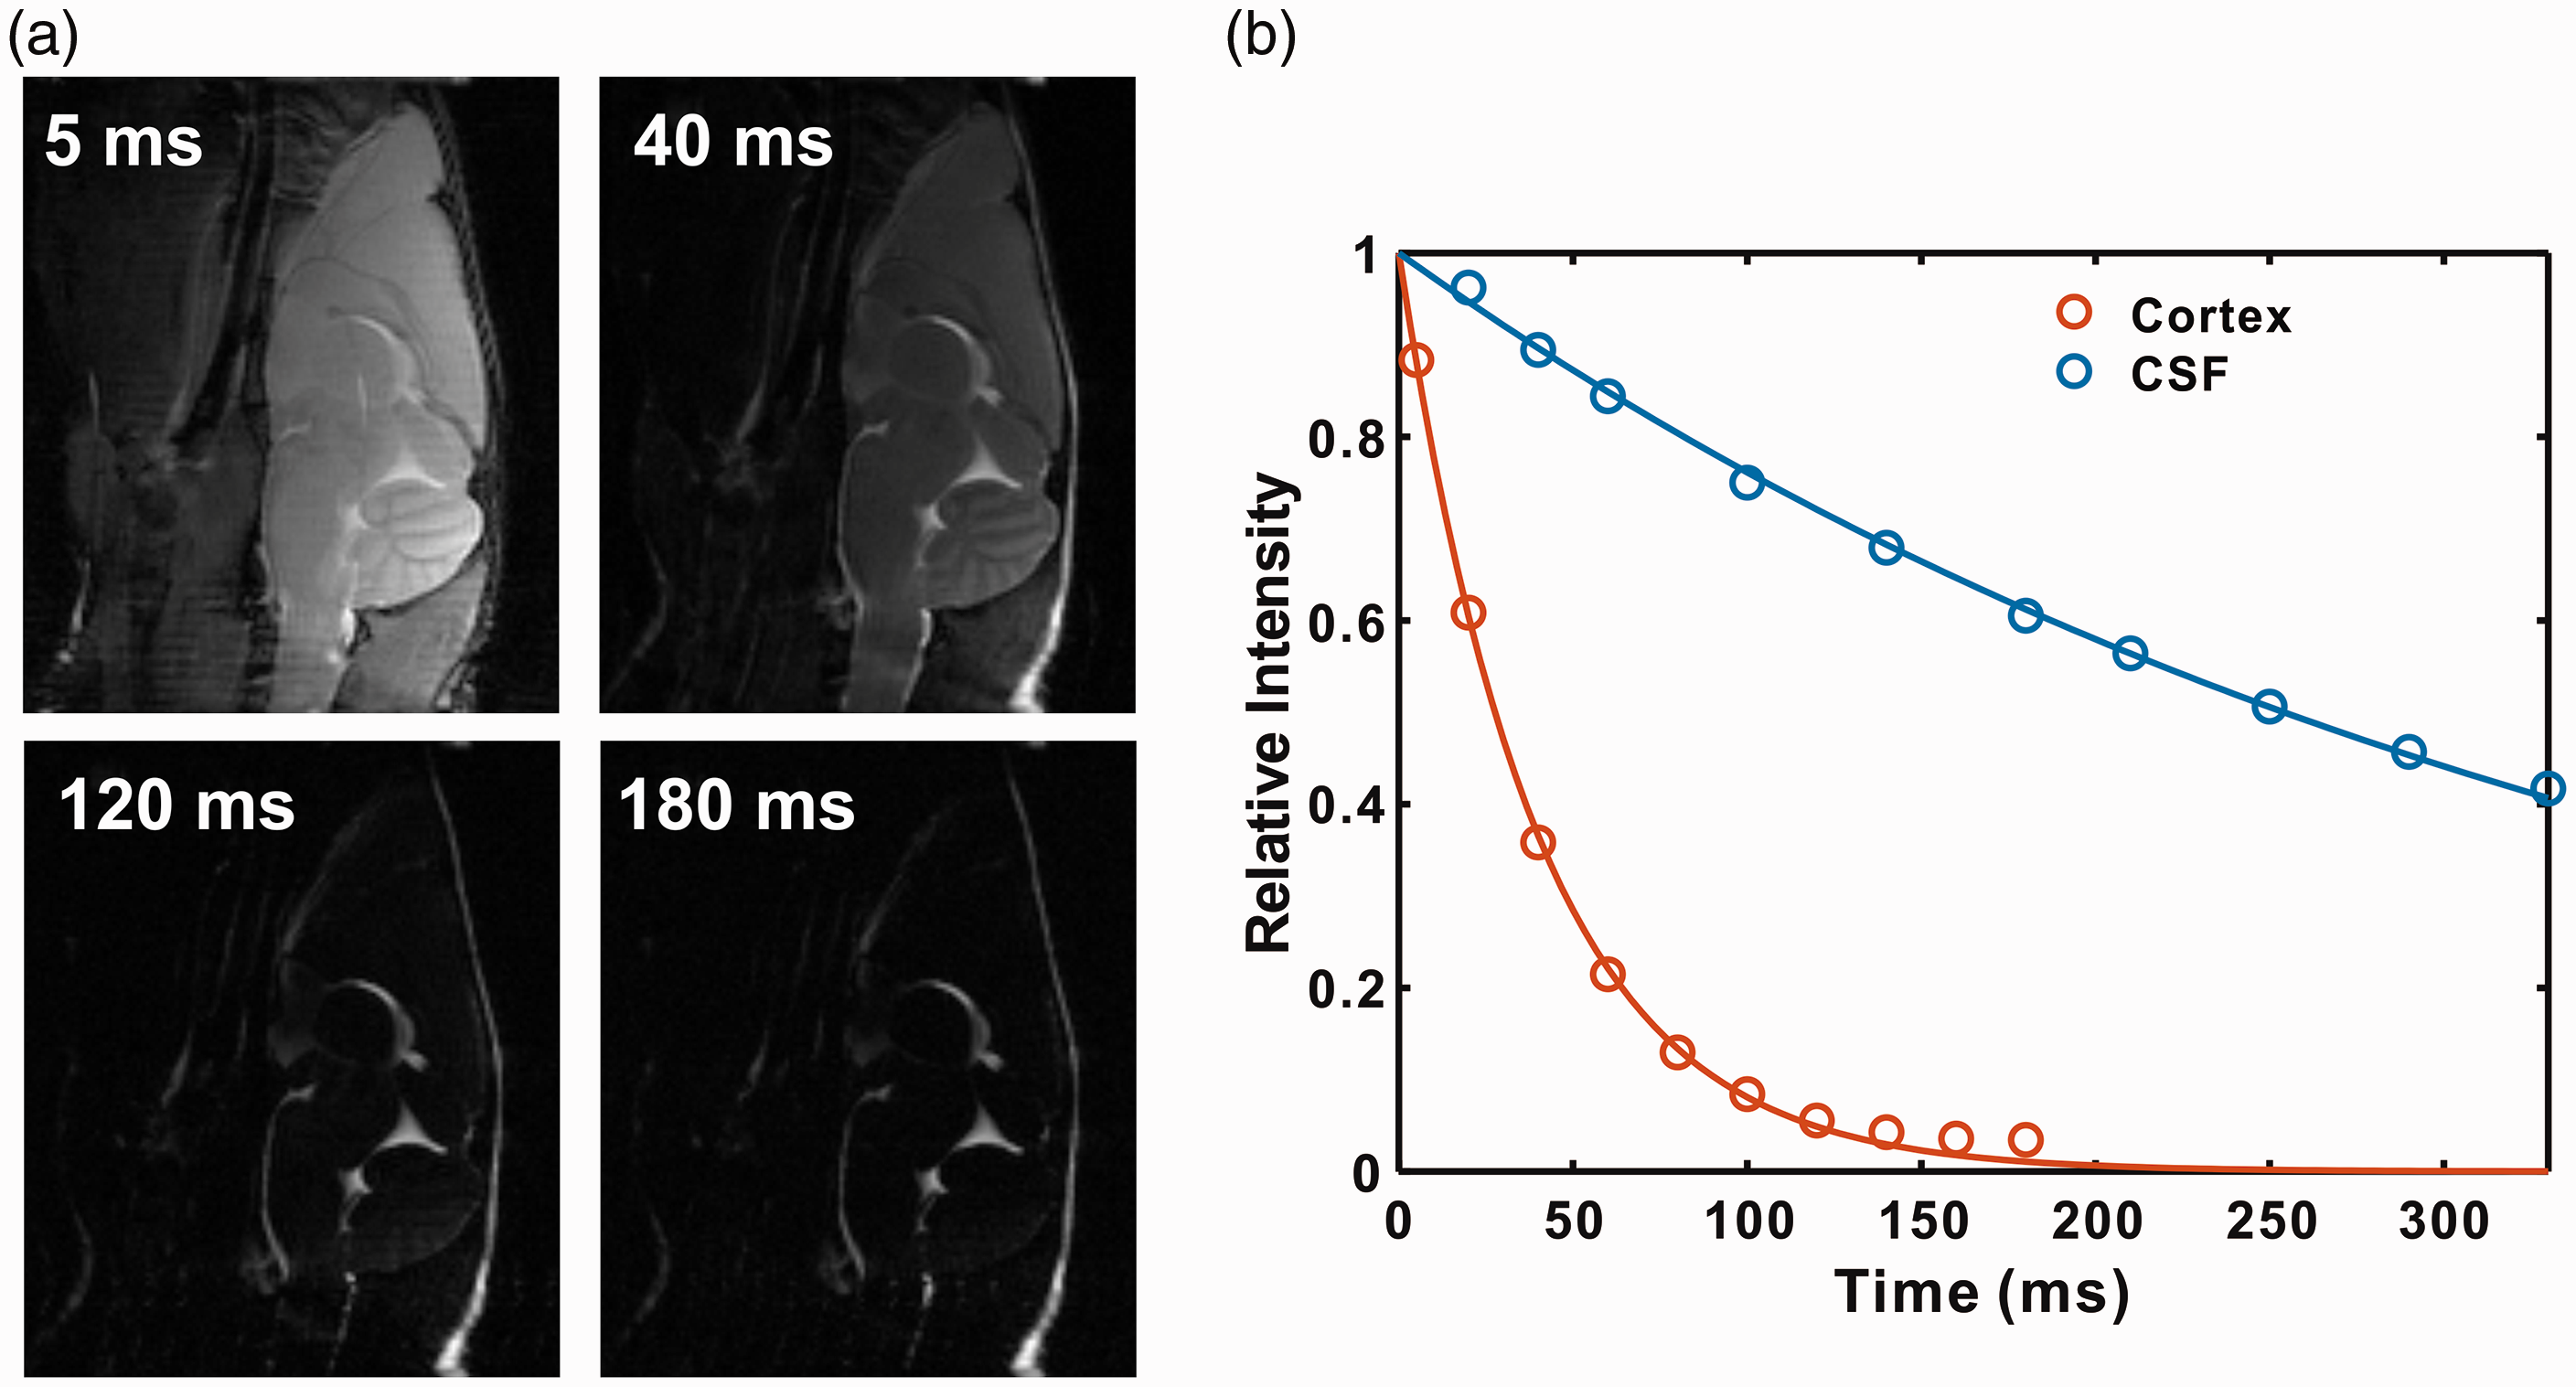
Typical onVDMP and T1ρ images are plotted in Figure 3(a) and (b), respectively, and show similar contrasts. The DGE curves for the parenchyma of WT mice measured by onVDMP and T1ρ MRI are presented in Figure 3(c). The two methods show similar curves with comparable
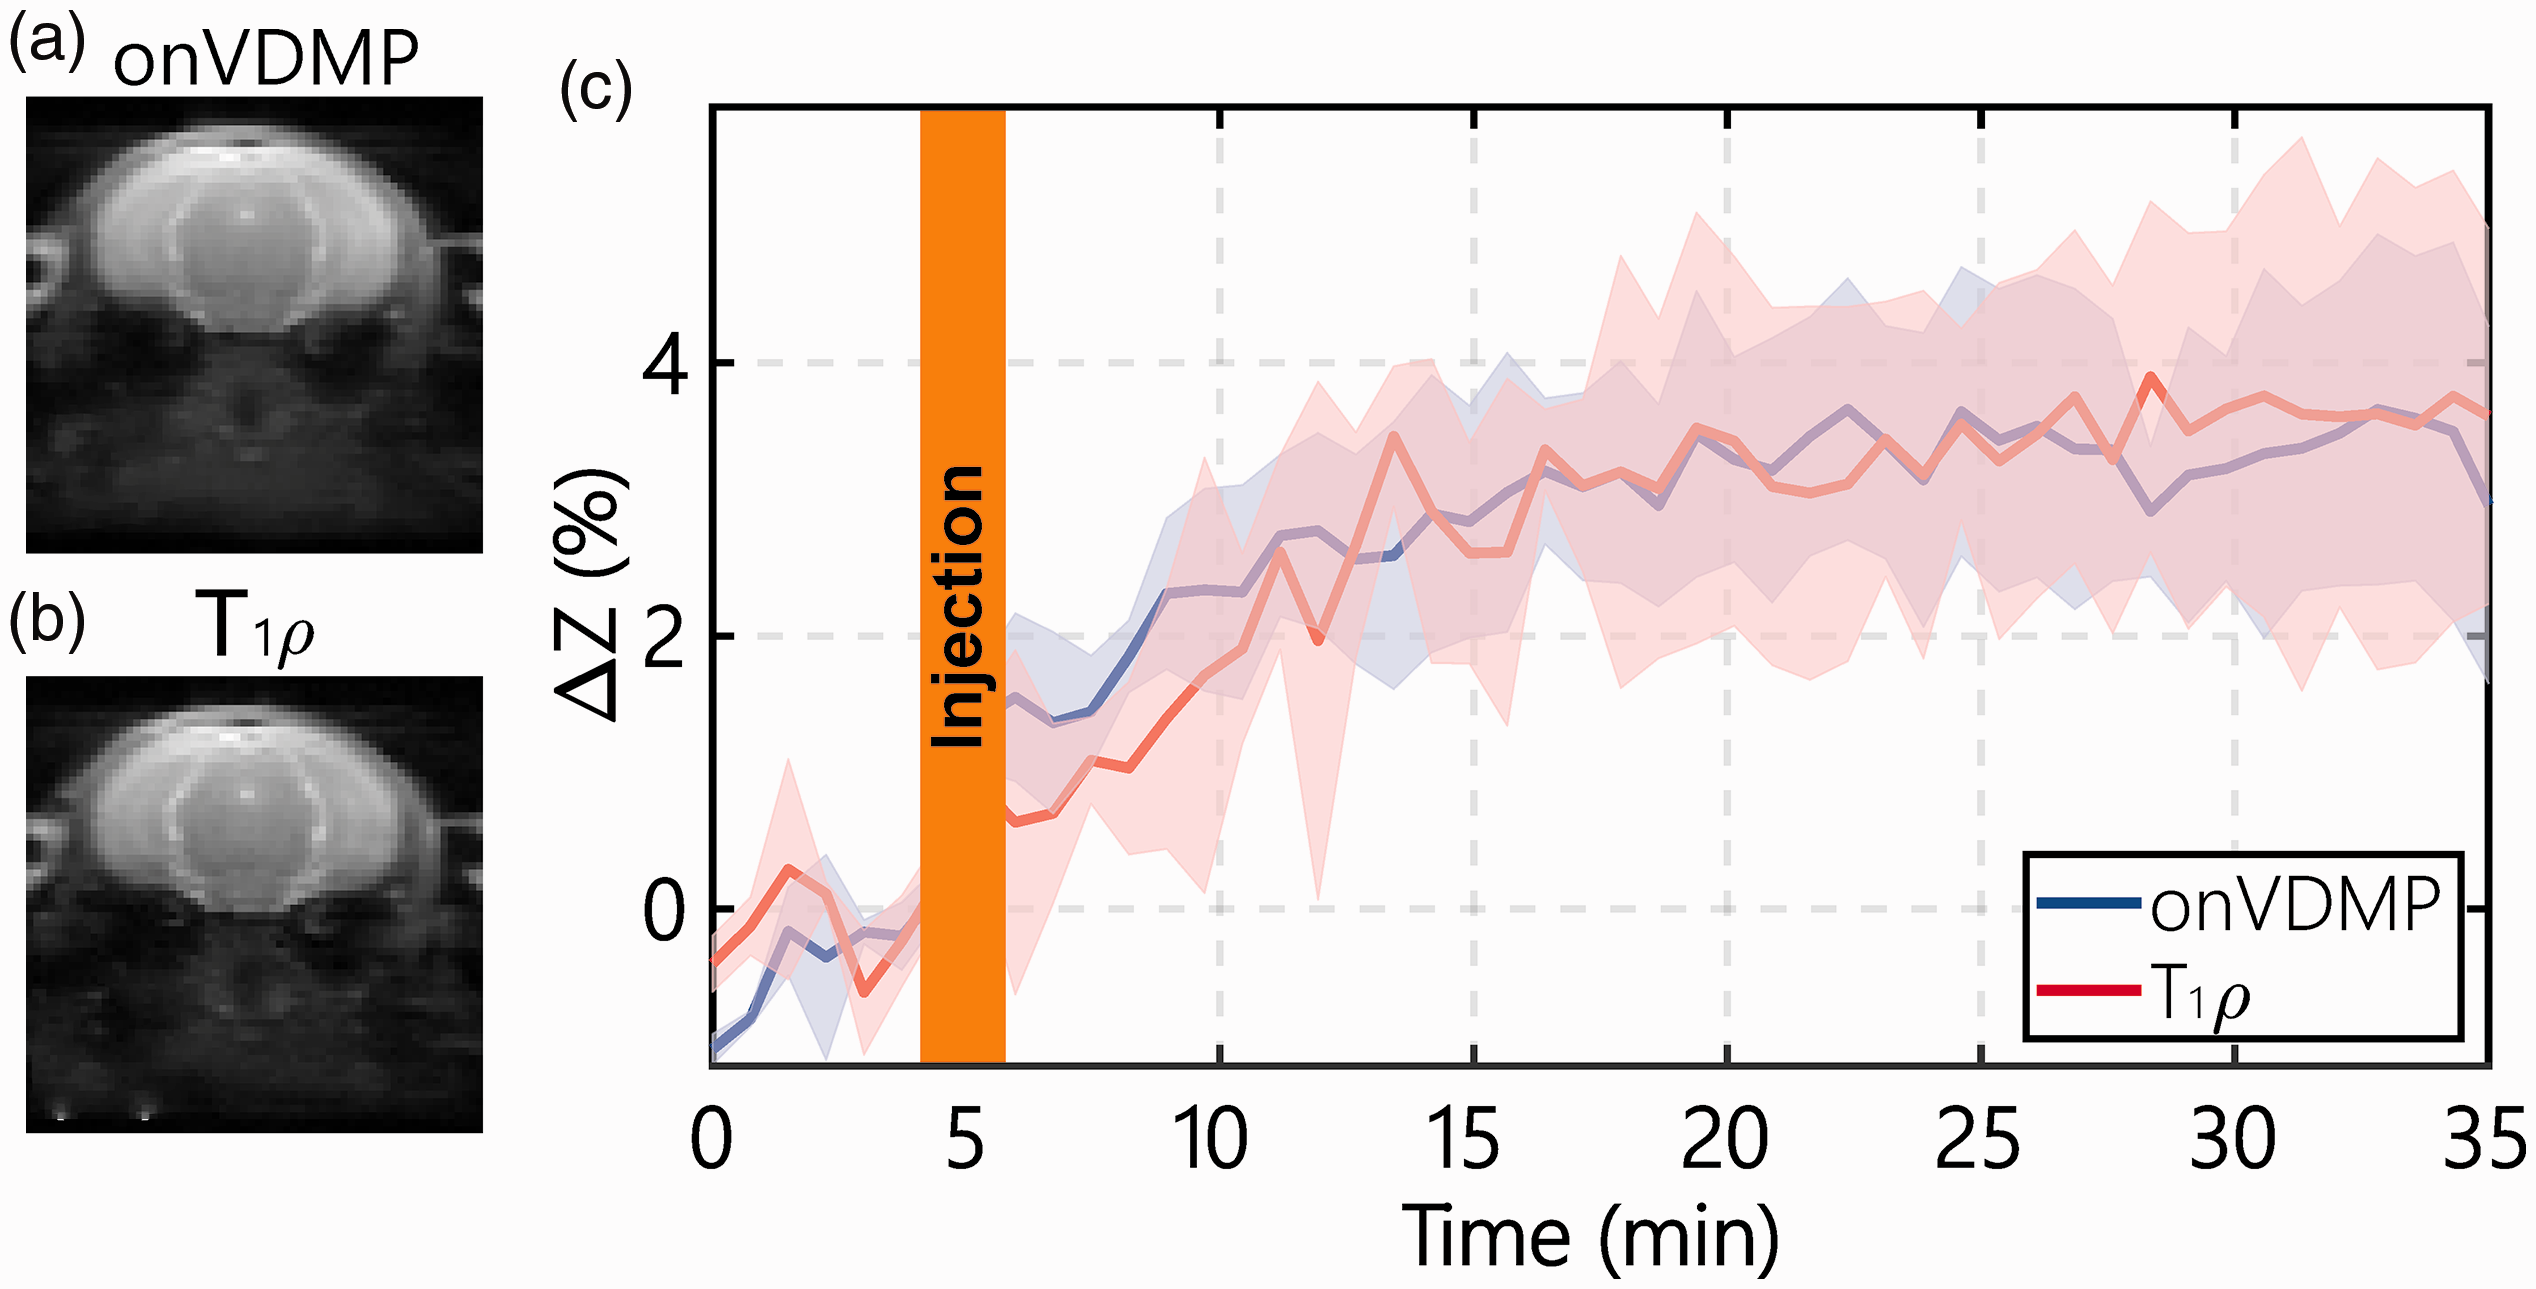
Comparison of the DGE curves during D-glucose infusion obtained with onVDMP and T1ρ sequences: typical onVDMP (a) and T1ρ (b) images are plotted to show the location of the slice and the image quality. (c) DGE curves of mouse parenchyma acquired by onVDMP MRI (blue) with 12 binomial pulse pairs (36 ms) and T1ρ imaging (red) with a saturation time of 36 ms on WT mice (n = 3; standard deviation indicated in light blue and red). The unit of ΔZ is %.
Detection of blood DGE signal
The dynamic blood DGE signal in blood was assessed from the SSS onVDMP signal (Figure 4(a) and (b)). The blood DGE signal after D-glucose infusion (n = 3) is plotted in Figure 4(c). From the result, the blood DGE signal increased rapidly during the one minute D-glucose infusion to around 6% of the water signal and stayed at the same concentration during the whole 30 min of experimental time. This result is consistent with our recent study, in which the time dependence of the blood glucose concentration was confirmed outside the scanner. 48
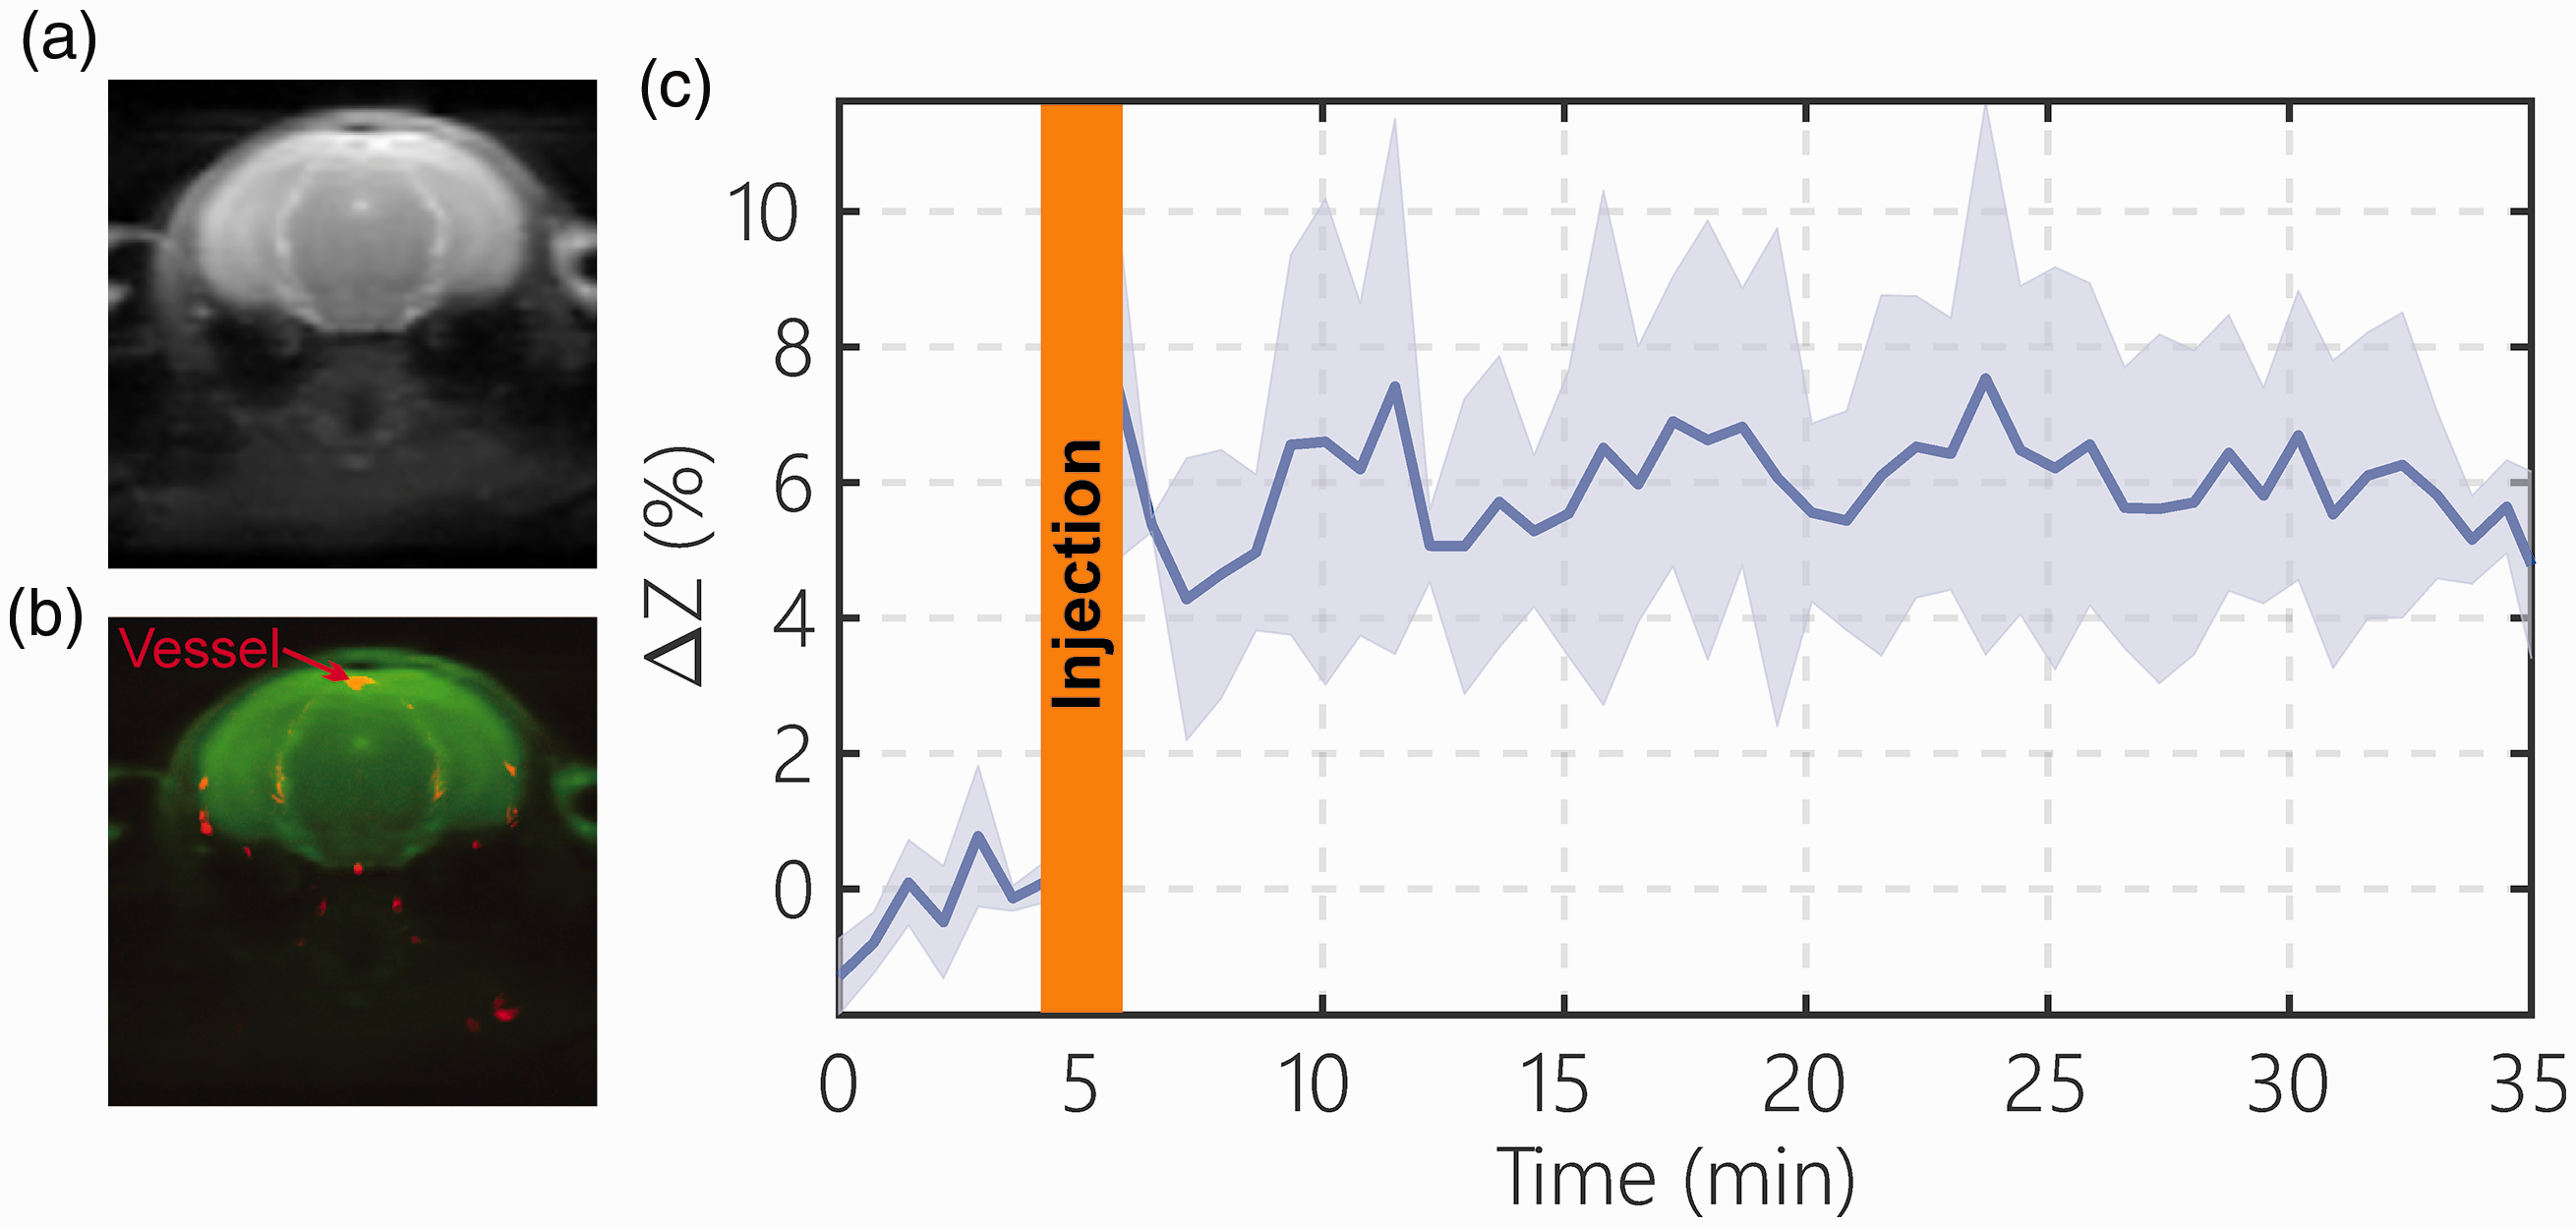
The blood D-glucose level after D-glucose infusion (one minute, 150 µL, 50% dextrose) determined by the onVDMP method. A typical onVDMP image (a) and overlayed blood vessel map (red) (b) determined by TOF MRI show the location of the superior sagittal sinus (SSS), which is used for measuring the blood D-glucose signal changes. (c) DGE curve from the SSS acquired using an onVDMP sequence with 12 binomial pulse pairs (36 ms) (n = 3; standard deviation indicated in light blue). The unit of ΔZ is %.
D-Glucose uptake and clearance in the tauopathy AD mice
When studying the onVDMP images with 12 binomial pulse pairs (Figure 5(a) and (c)), the Tau mice showed an obvious reduction in brain volume compared to WT mice. This was further validated with a brain volume measurement. The volume was calculated by delineating the whole brain boundary slice-by-slice on high-resolution multi-slice T2-weighted images with the reference of mouse brain atlas (https://atlas.brain-map.org/). The number of voxels inside the brain was multiplied with the voxel volume to yield the total brain volume in mL. The brain volumes were 0.53 ± 0.01 mL for WT mice and 0.45 ± 0.02 mL for Tau mice, which is significantly different (p = 0.003, n = 4). The CSF volume of Tau AD mice (11.8 ± 1.8 µl) trended to be slightly higher than that of WT mice, but this difference was not significant (9.2 ± 1.4 µl; p = 0.11, n = 4). We also measured the body weight of WT (24.33 ± 0.47 g, n = 4) and AD (23.75 ± 2.38 g, n = 4) mice, and no significant difference was observed (p = 0.739). Dynamic AUC maps were utilized to monitor the D-glucose uptake in mouse brain and CSF for both Tau and WT mice (Figure 5(a) to (d)). Each dynamic AUC map was calculated by averaging 10 successive DGE images, which corresponds to a time-interval of 150 s. The averaged DGE curves of both WT (n = 4) and Tau (n = 4) mice for the cortex are plotted in Figure 5(e) and (f), respectively. The dynamic maps and curves show that the D-glucose uptake is slow in the parenchymal ROI (cortex) of both WT and Tau mice, reaching a plateau after about 20 min. The fitted ADGE of WT parenchyma (5.42 ± 0.70%) was significantly larger than that of Tau parenchyma (1.70 ± 1.33%, p = 0.005). Both sensitivity and specificity were 100% for the ADGE as seen from its ROC curve (online Supplementary section S4). The D-glucose uptake rate (
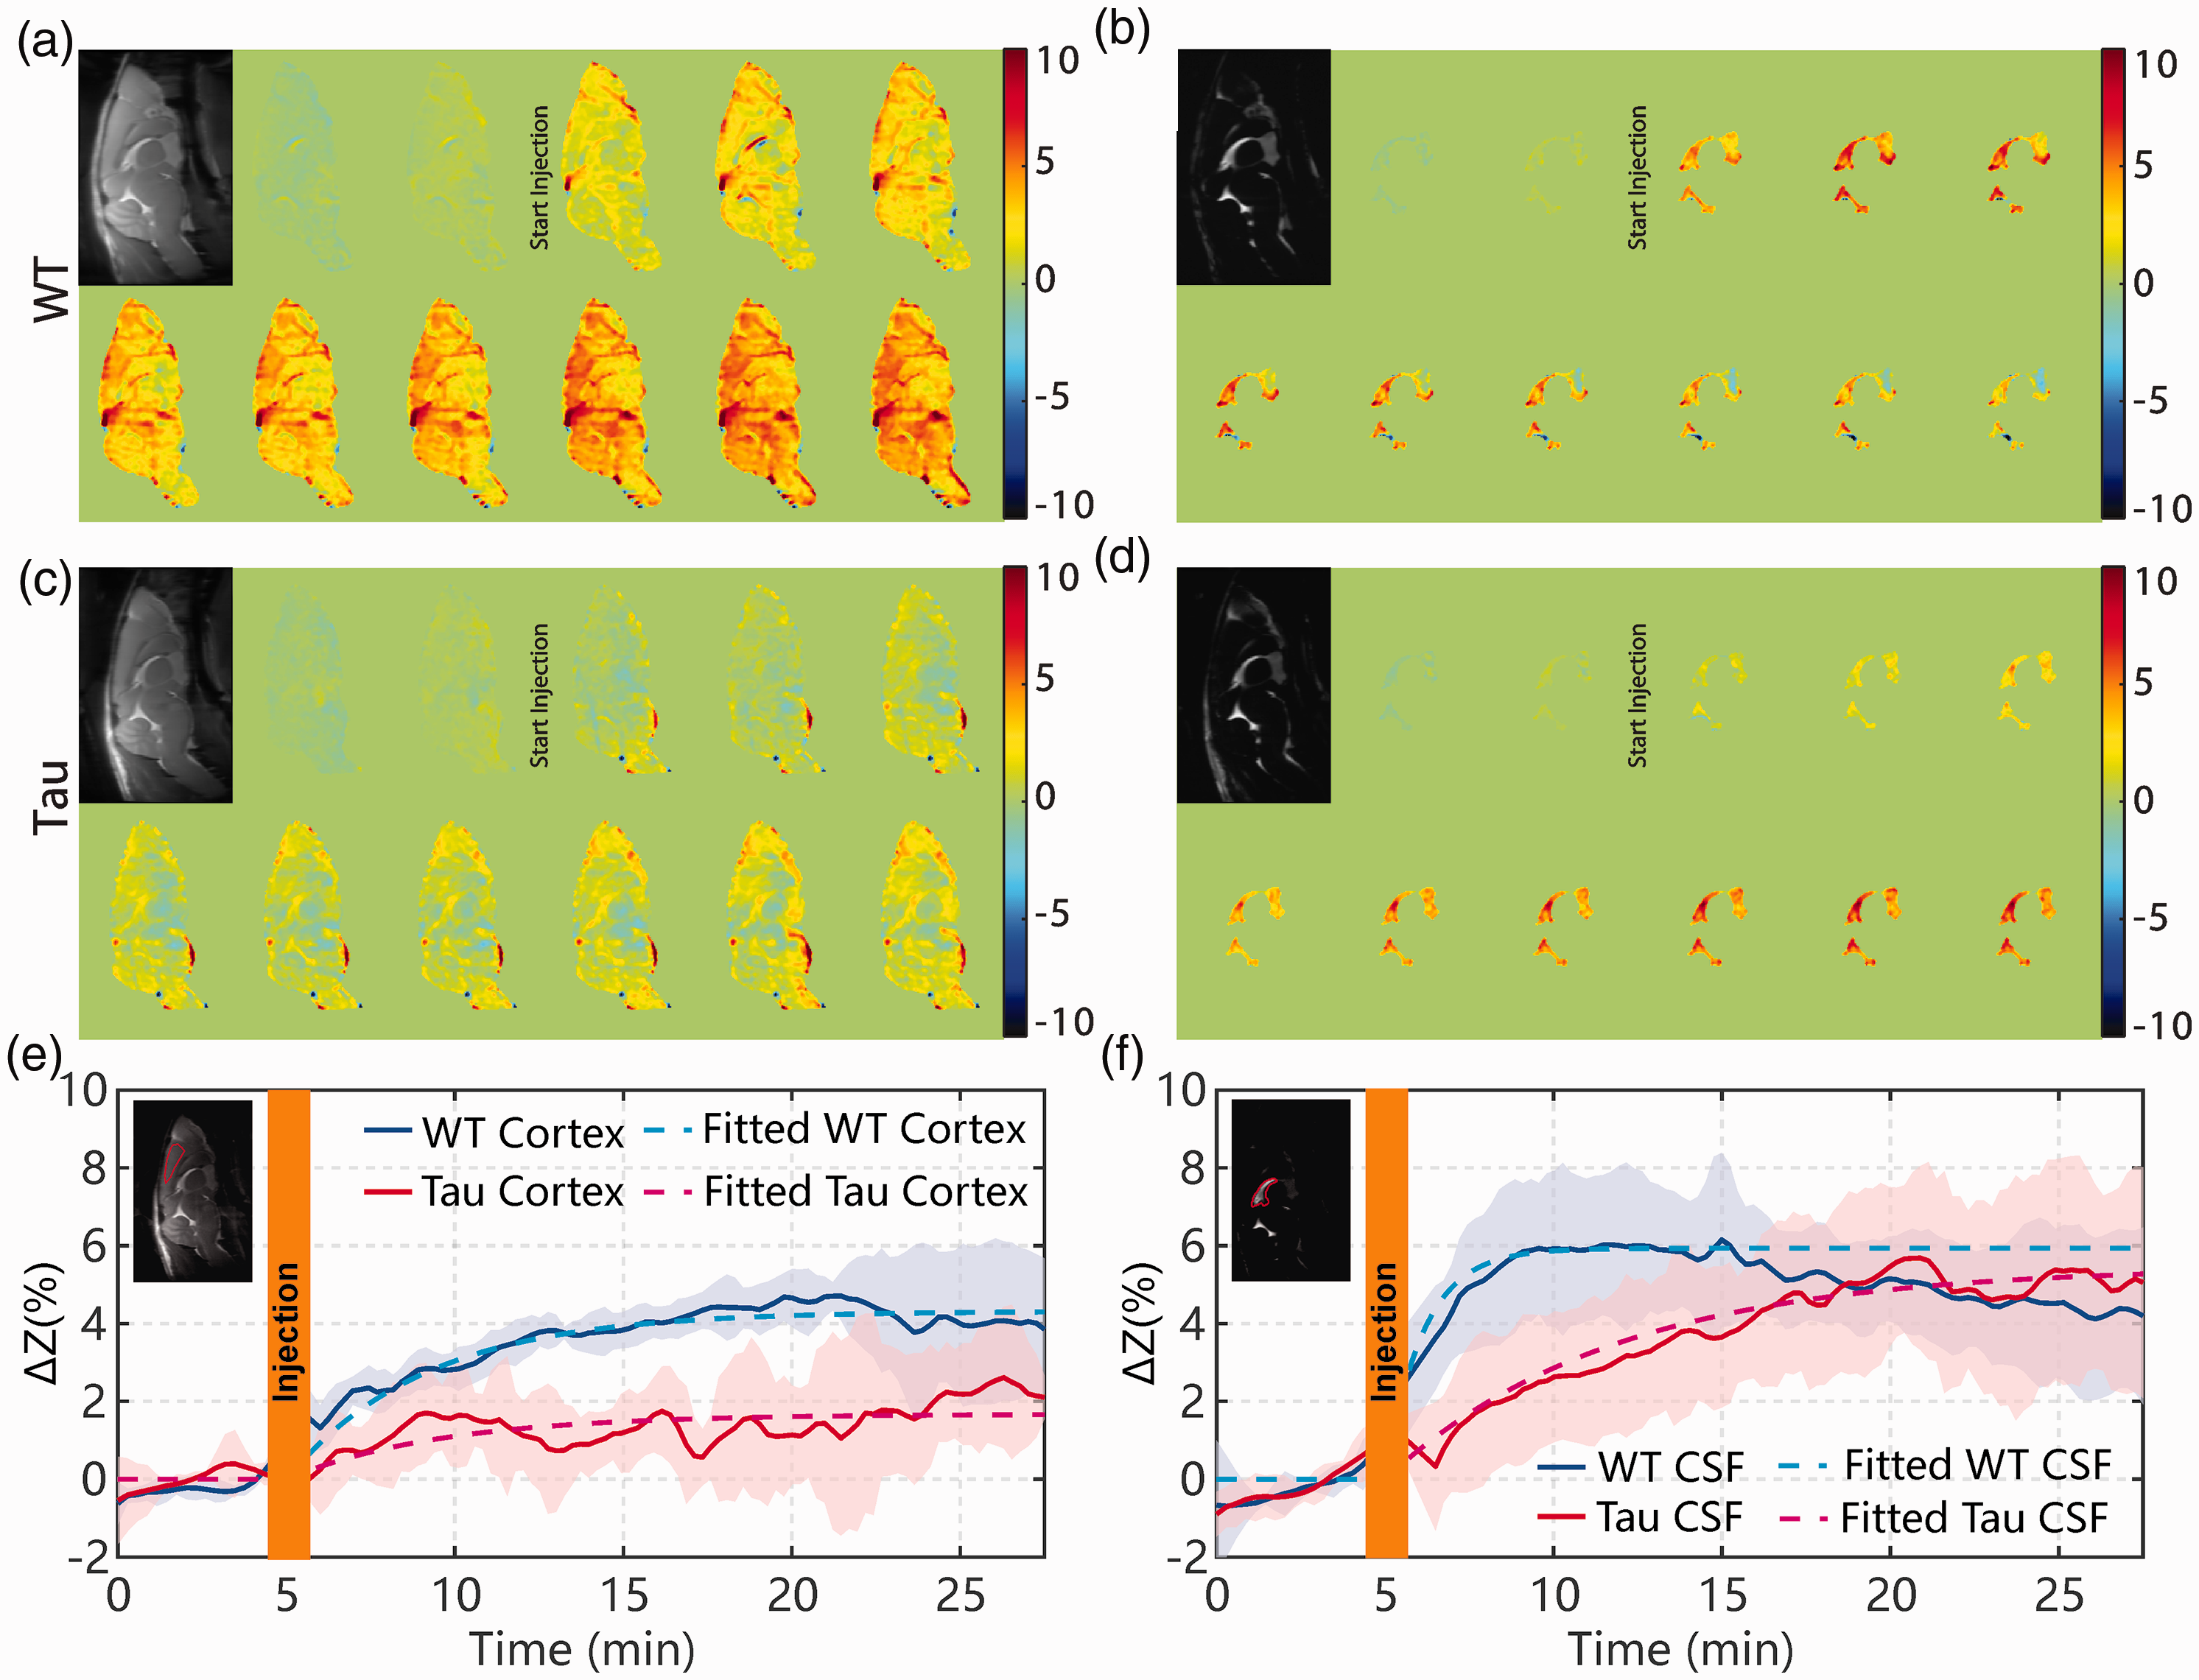
Dynamic AUC maps for WT ((a) and (b) and Tau ((c) and (d)) mice over the 27.5 min DGE experiment. The brain tissue maps were recorded using the onVDMP sequence with 12 binomial pulse pairs ((a) and (c)), while the CSF maps were obtained with 100 binomial pulse pairs ((b) and (d)). Each dynamic AUC map was calculated by averaging 10 successive DGE images, which lead to a time window of 150 s. The averaged time-resolved DGE curves for the (e) cortex and (f) CSF of WT and Tau mice. The ROIs used for determining the DGE curves are indicated in the inserted images with red lines. Shaded regions in the graphs represent the standard deviation of the curves (n = 4). The averaged DGE curves (solid lines) and the corresponding curves from fitting with equation (6) (dotted lines) are shown. The unit of ΔZ is %.
Saline infusion
The dynamic AUC maps, as well as the onVDMP curves from both brain parenchyma and CSF following the infusion of 3% saline water, are plotted in Figure 6. After saline infusion, small onVDMP signal changes were observed in brain parenchyma, about 0.9 ± 1.1% (Figure 6(c)). Note that the osmolarity of 3% is about 2.5 times lower compared to that of 50% glucose, which means the osmolarity effect of glucose will most likely be higher than 0.9 ± 1.1% to the parenchyma onVDMP signal. Different from the DGE signal introduced by D-glucose infusion where the DGE signal built up slowly, the onVDMP signal due to saline infusion was close to constant during the period post-infusion. On the contrary, the onVDMP signal change due to saline infusion, while spiking during infusion, was negligible during the post-infusion period in the CSF.
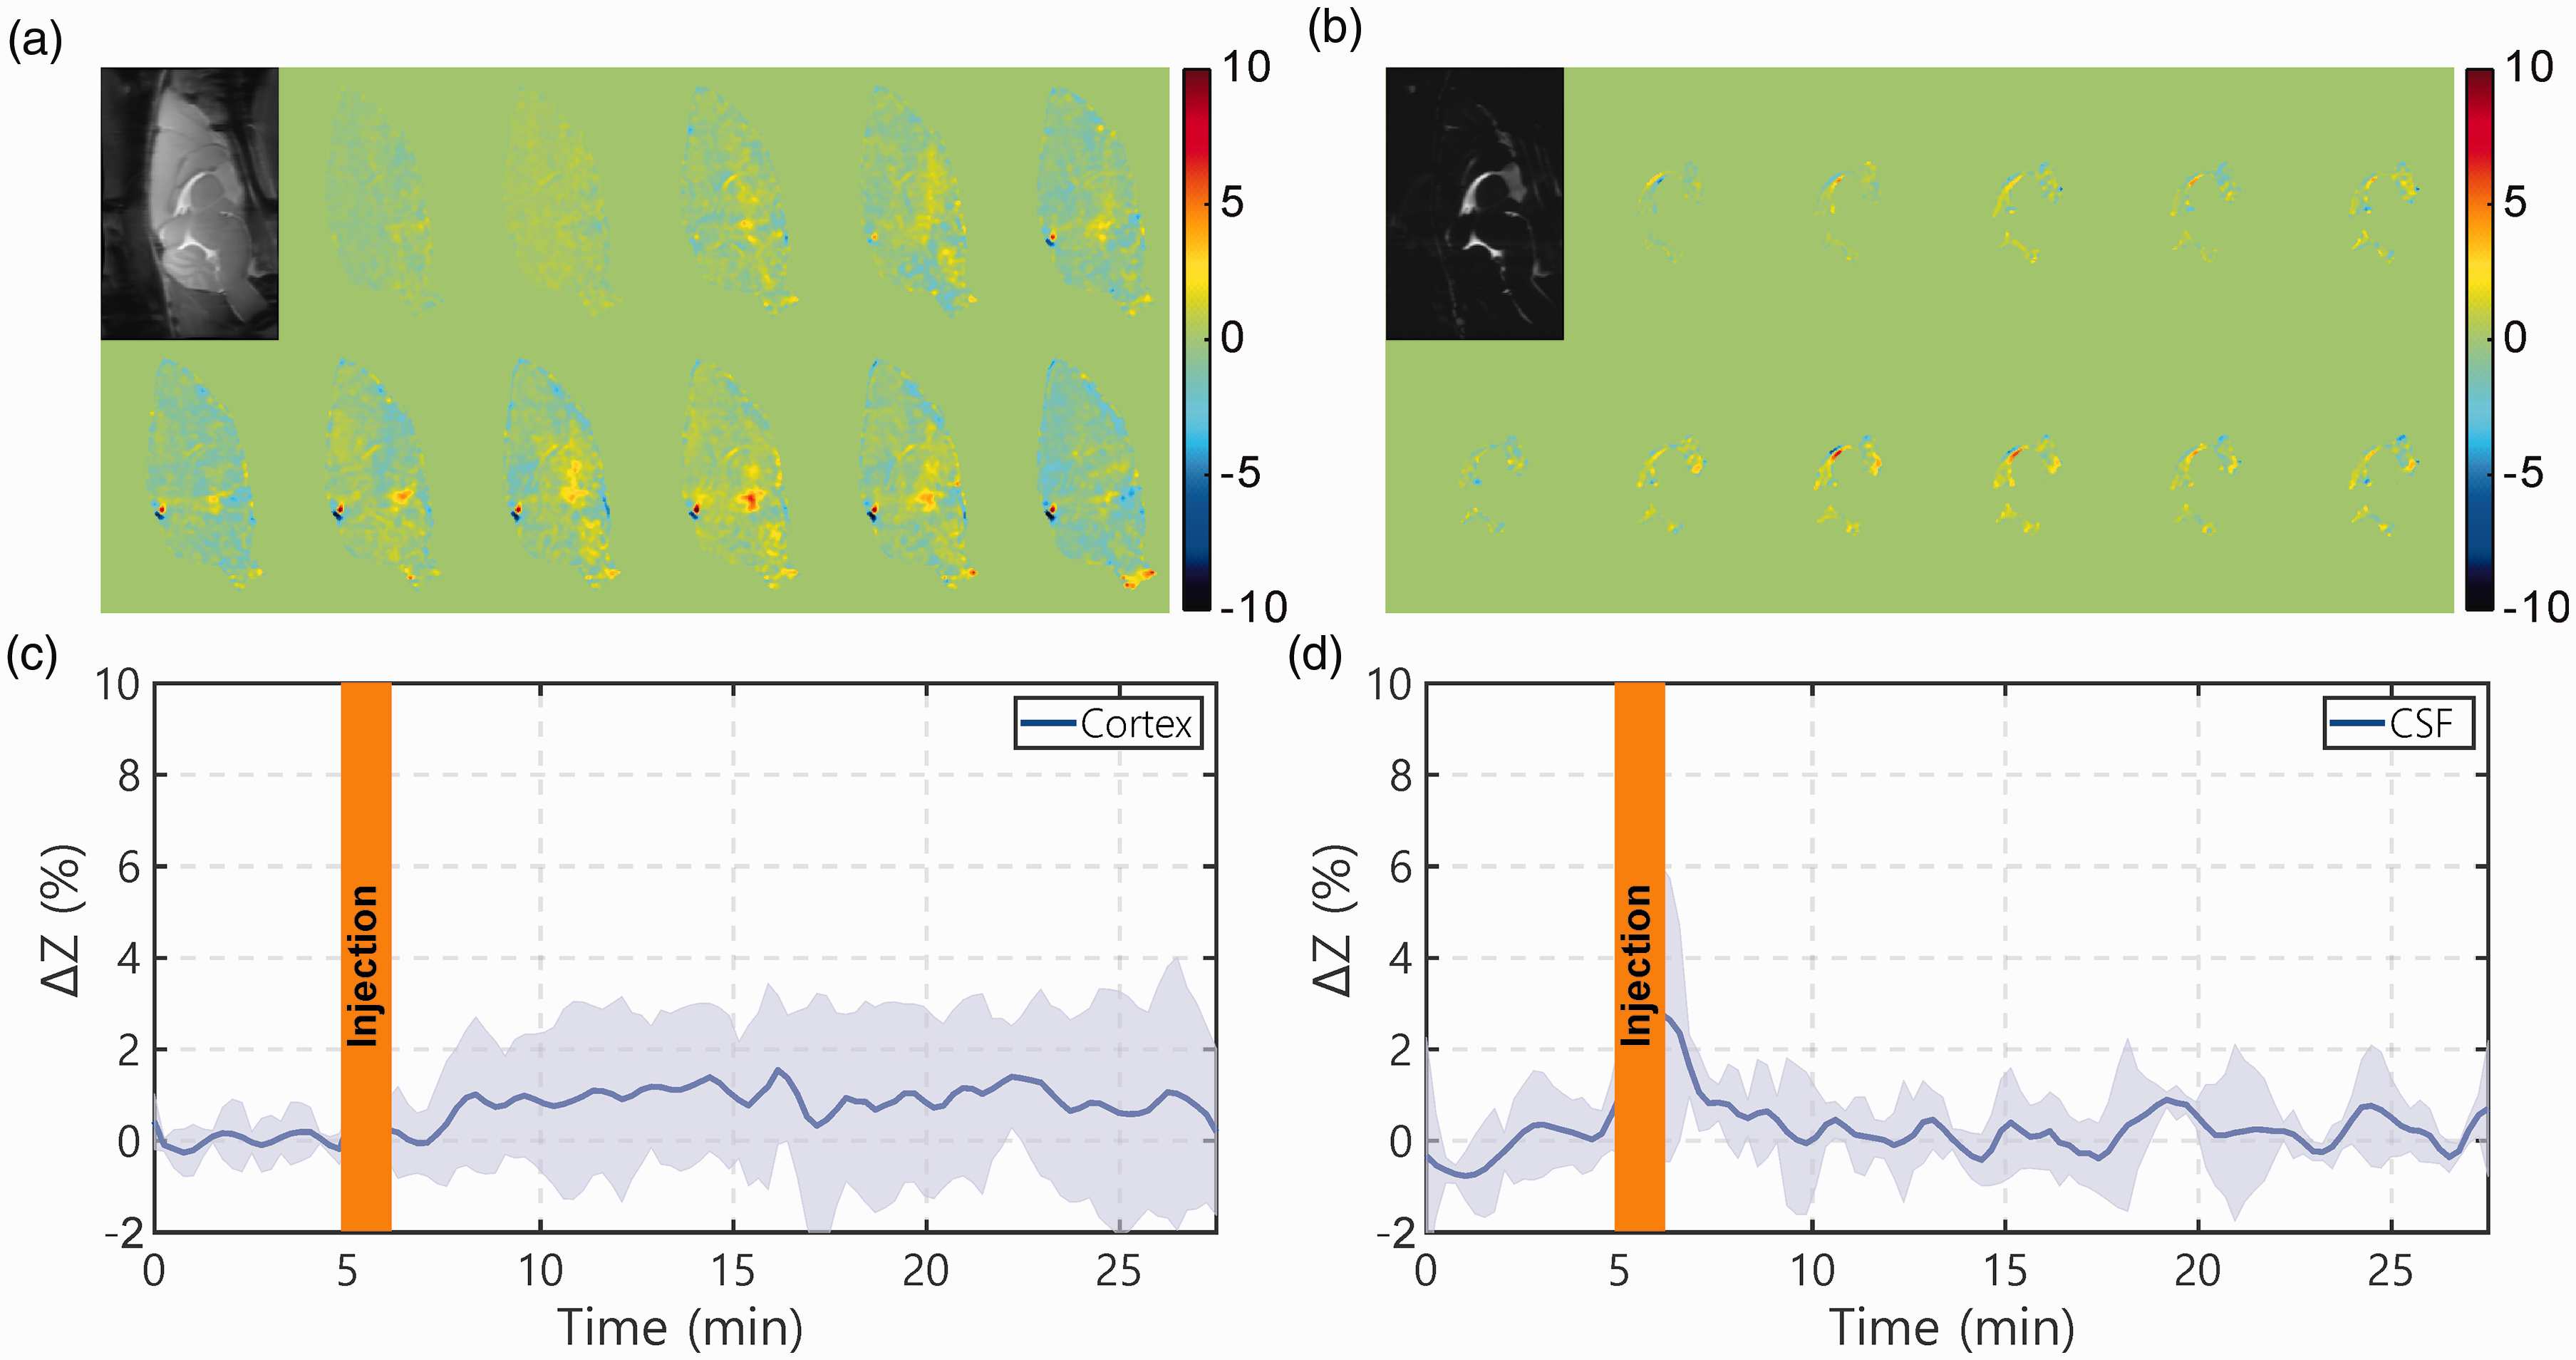
Dynamic AUC maps and DGE curves for WT mice infused with 3% saline (1 min, 150 µL). The brain tissue AUC maps were recorded using the onVDMP sequence with 12 binomial pulse pairs (a), while the CSF AUC maps were obtained with 100 binomial pulse pairs (b). The infusion protocol and MRI experimental parameters were identical to those applied in Figure 4. ((c) and (d)) The averaged time-resolved DGE curves for (c) tissue and (d) CSF for WT mice (n = 3; standard deviation indicated in light blue). The unit of ΔZ is %.
MRS-based validation
Typical MRS spectra of the mouse brain before and after (30 min) D-glucose infusion, as well as the difference spectra for three typical time points (0 min, 5 min, and 30 min), are plotted in Figure 7(a). The two broad aliphatic D-glucose resonance peaks, around 3.4 ppm and 3.7 ppm, are increased substantially after D-glucose infusion as shown in the difference spectra. The signal-to-noise ratio (SNR) for the Cr peak in MRS was 34 ± 1.5, while the Cramer-Rao lower bound (CRLB) for the fitted Cr peak at 30 min was 0.9 ± 0.2%. The SNR for the D-glucose peaks in the difference spectra at 30 min was 2.0 ± 0.3 and CRLB for the fitted D-glucose peaks was 20 ± 5%. The dynamic change of D-glucose concentration in Figure 6(b) showed a rapid buildup curve in the first 10 min. From the exponential fitting of the glucose uptake curves,
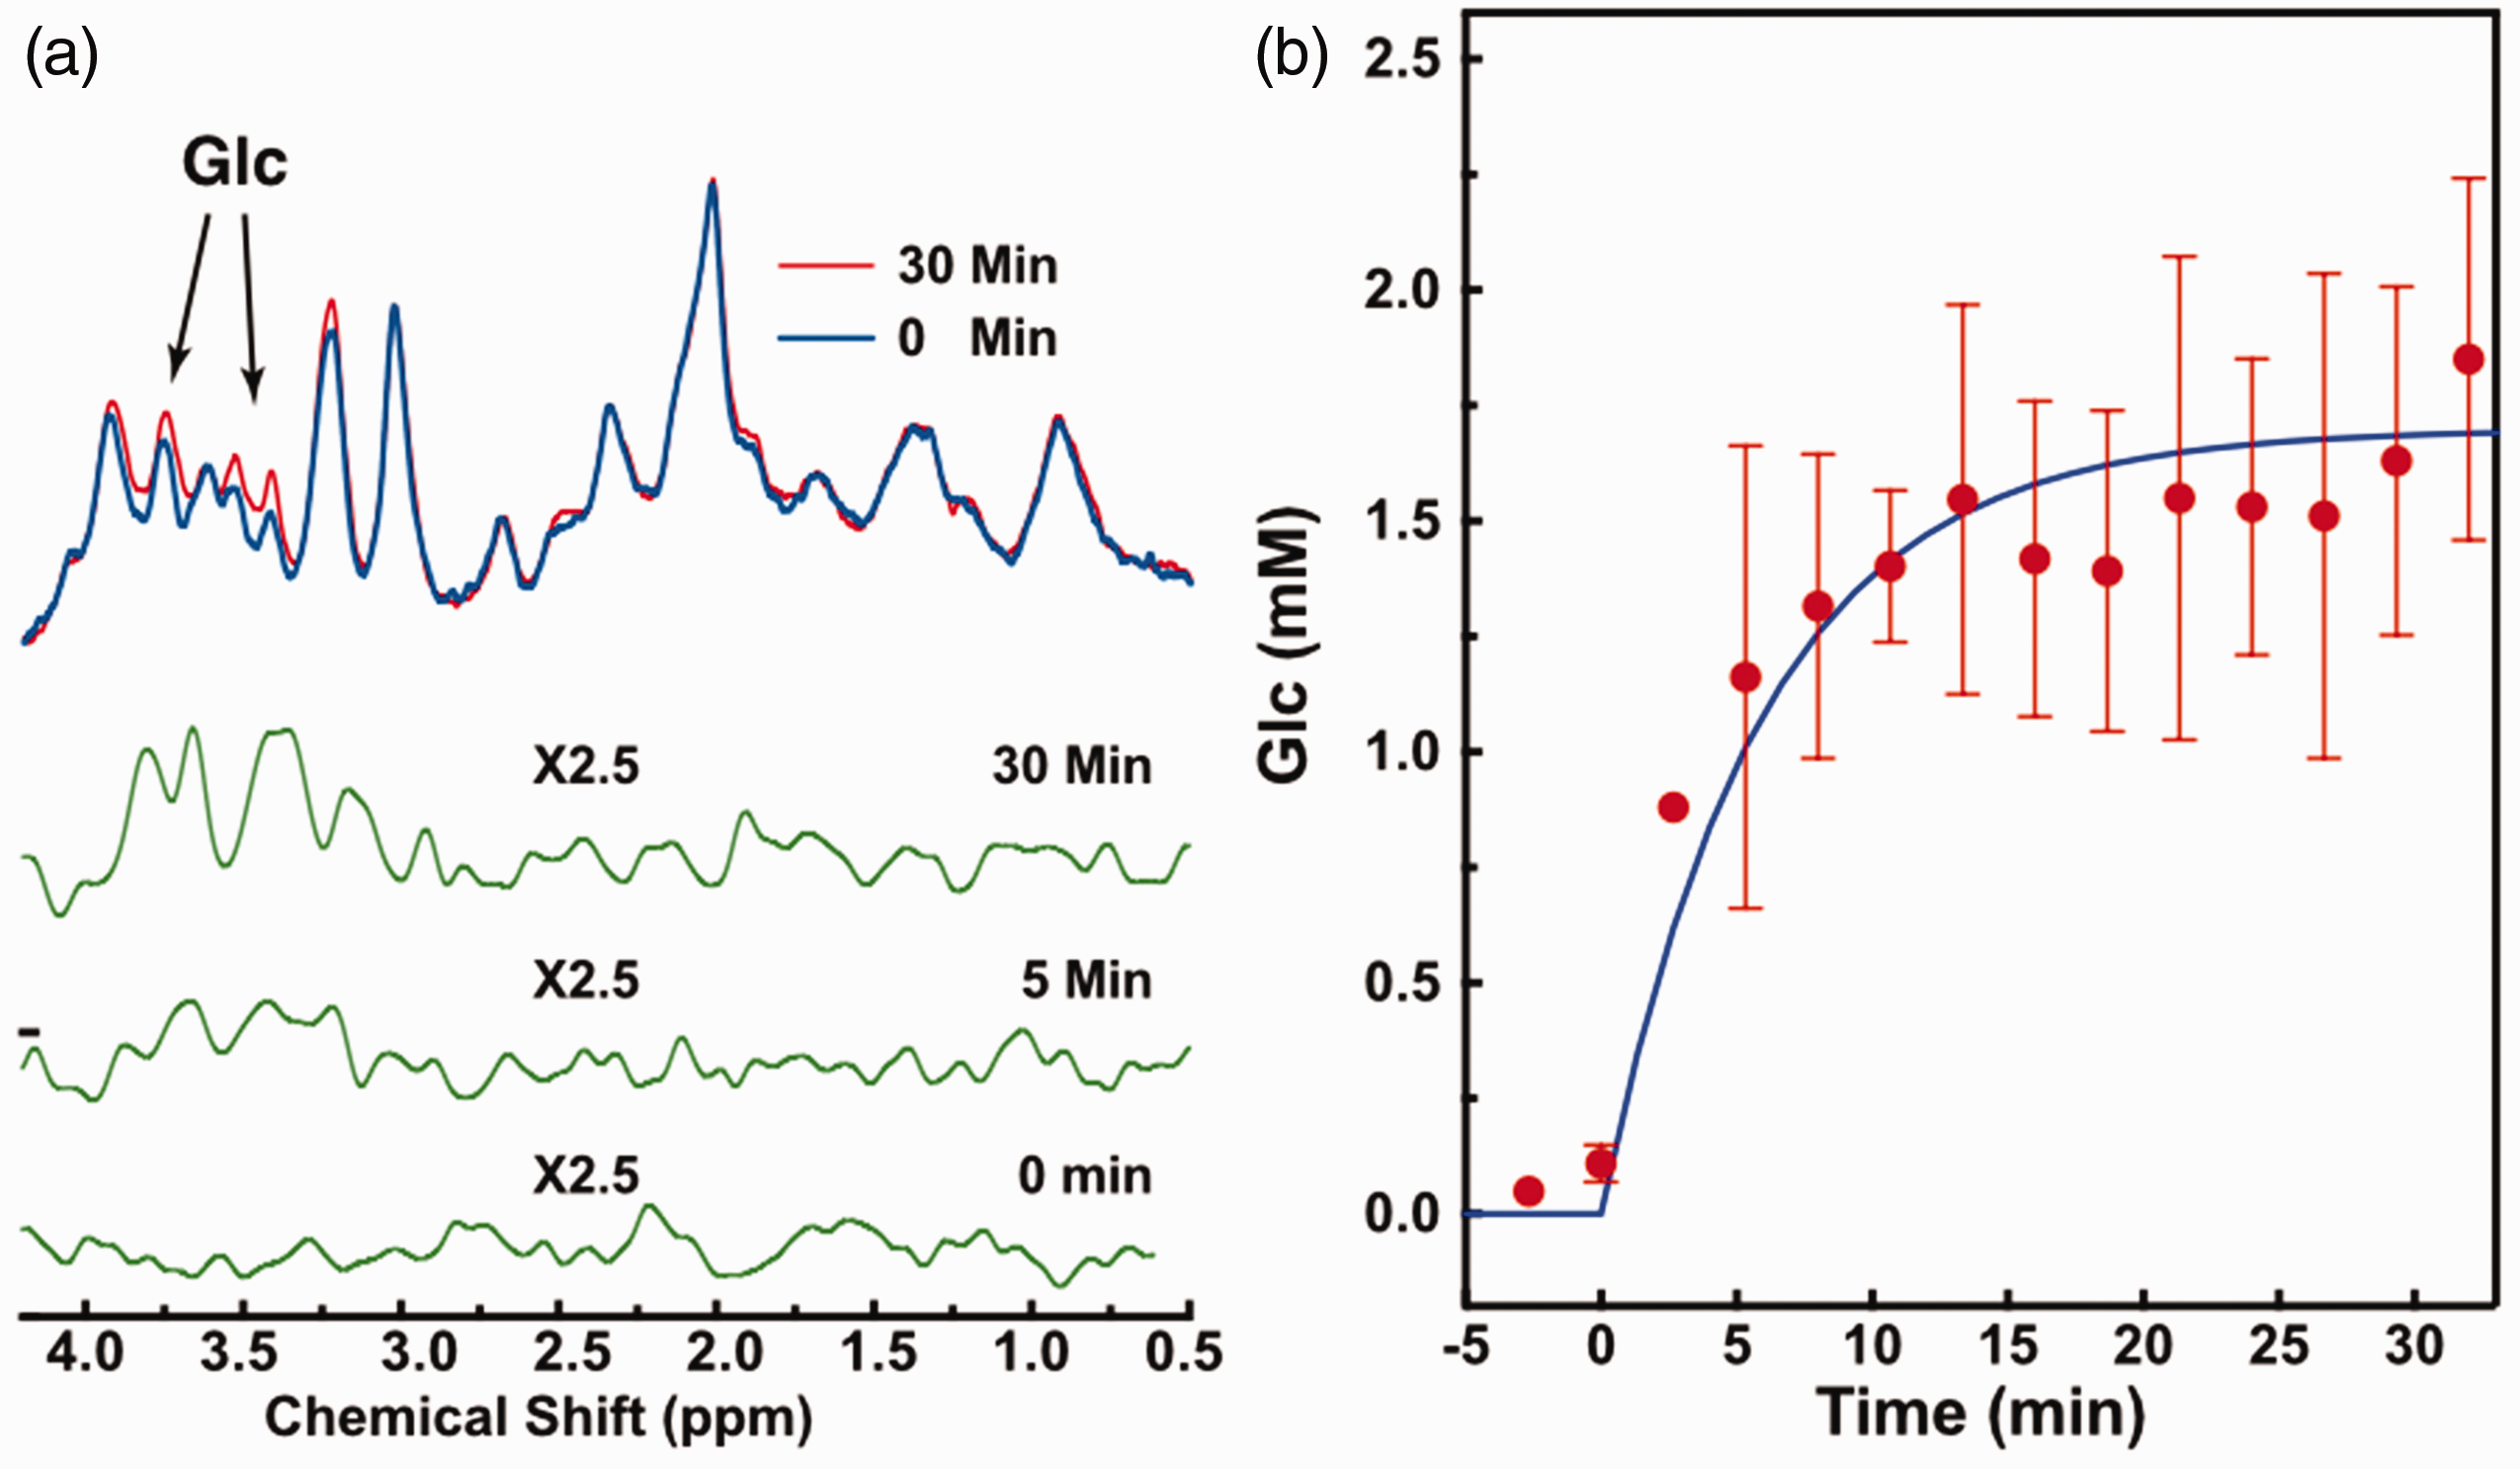
(a) In vivo MRS spectra for a typical mouse brain over a voxel in the thalamus before (blue) and after (red, 30 min) D-glucose infusion. Difference spectra at three time points (green) are also shown with two glucose peaks (3.4 ppm and 3.7 ppm) are indicated. (b) Dynamic MRS signal changes as a function of time relative to the start of D-glucose infusion (n = 2). The D-glucose to total creatine (tCr) ratios were calculated by integrating signal over the chemical shift range from 3.0 to 4.2 ppm in the difference spectrum and divided by the area of the tCr methyl group centered at 3 ppm. The solid line is the curve fitted with a single exponential function (equation (7)).
Discussion
In this study, we used phase-cycled onVDMP MRI to detect D-glucose uptake in mouse brain through the chemical exchange of protons between hydroxyl groups and water. The DGE curves obtained by onVDMP MRI on WT mice showed a similar pattern to those acquired on both human and animal brain using the T1ρ method,32,36 i.e. the DGE curves build up in the first 10–15 min after D-glucose infusion and then plateau or decay slowly. This was further confirmed by a comparison study between onVDMP and T1ρ methods on WT mice (Figure 3). The rate of D-glucose uptake obtained by the onVDMP method (0.15 ± 0.03 min−1) was consistent with that measured by MRS (0.16 ± 0.02 min−1) and previous 13C MRS measurements (0.136 ± 0.011 min−1), 49 which suggests that the change of onVDMP signal is correlated with the change in D-glucose concentration in brain. Besides onVDMP, there is an alternative CEST method, i.e. continuous-wave CEST (CW-CEST), to monitor D-glucose uptake in brain. However, due to a scale-down effect induced by magnetization transfer contrast from macromolecules,50,51 the signal sensitivity of CW-CEST is inferior to that obtained by onVDMP. 20 The DGE curve measured by CW-glucoCEST on healthy mouse brain showed a bolus effect at the first three minutes and then dropped to small values, 52 which is different from the DGE pattern determined by the onVDMP, T1ρ and MRS methods. Notice that glucose can also induce a R2 relaxation change due to the chemical exchange between glucose hydroxyl protons and water,41,42 and this R2 relaxation change also contributes to the change of onVDMP signal as indicated in equations (2) and (3), which is similar to the T1ρ-based methods. When detecting D-glucose in CSF, the scaling effect from MTC will be minimized. Furthermore, the R2 of CSF is also much smaller than in parenchyma, which enabled us to detect D-glucose in CSF with much higher detection sensitivity at longer preparation times.
When assuming that the DGE signal arises solely from the R1ρ value variation introduced by D-glucose, a D-glucose concentration of 4.47 mM increment in CSF for WT mice can be estimated from a D-glucose phantom calibration (online Supplementary section S5). However, a much higher D-glucose concentration is estimated (26.5 mM) in brain parenchyma with 4% DGE signal (online Supplementary section S5). This value is far higher than the D-glucose concentrations measured by MRS method (1.5–1.7 mM) (Figure 7 and online Supplementary Figure S3). This indicates that the calibration from phantoms applies only to CSF, which makes sense as CSF more closely resembles a sugar solution phantom. The in vivo onVDMP signal in parenchyma detects all fast exchanging protons, and other metabolites (e.g. products of D-glucose metabolism) may also contribute to the change in the onVDMP signal. In addition, the background signal interference is more complicated, even though that should in principle not affect a rate determination. From the saline injection results, it is expected that the osmolarity effect of glucose also contributes to the parenchymal onVDMP signal. Although the exact contributions of the DGE signal in parenchyma are still not fully understood, the above studies suggest that the DGE signal is correlated with D-glucose concentration and can be used for monitoring the D-glucose uptake and clearance processes.
The D-glucose uptake in the brain is related to D-glucose delivery, transport, and metabolism. From the results shown in Figure 5, the D-glucose uptake in the cortex of Tau mice is significantly reduced compared to that of WT mice (signal intensities of 1.6 ± 1.3% vs 4.3 ± 1.3%, p = 0.016). This is consistent with the observation that the D-glucose uptake is impaired in AD brain due to the reductions of both GLUT1 and GLUT3 expression at the BBB. 3 Few studies have been performed to measure glucose uptake in brain CSF. In the current study, we employed an onVDMP sequence with a long saturation module to suppress the parenchymal signal, enhancing the detection sensitivity of CSF. Notice that such an approach would not work for MRS, as the T2 of the D-glucose protons is short, but here we are studying the water signal in CSF. The buildup process of the DGE curve in CSF reflects the D-glucose delivery and transport at the BCSFB. From the dynamic AUC maps and curves in Figure 5, Tau CSF has much slower D-glucose uptake compared to the WT CSF, which, assuming similar delivery, suggests that the D-glucose transporter at the BCSFB is impaired in AD brain. From previous studies, D-glucose can alternatively be redistributed to brain parenchyma through a CSF and ISF exchanging process, i.e. the glymphatic pathway, 8 and the glymphatic pathway of AD brain has been reported to be dysfunctional. 6 This may explain the observation that the DGE signal of WT CSF began to decay after reaching a maximum of around 15 min, while the DGE signal of Tau CSF kept increasing. As demonstrated in Figure 4, the blood DGE signal remained at a constant level after D-glucose infusion, which supports the standpoint that the glymphatic pathway plays a role in glucose transport into brain. 53 The evidence shown in this study suggests that D-glucose as a natural biodegradable contrast agent has the potential to be a non-invasive method to detect CSF–ISF exchange and reveal the function of glymphatic system. However, further validation is required.
Glucose uptake in amyloid precursor protein (APP) AD mouse models has been intensively studied with FDG-PET or ex vivo brain autoradiography methods 54 as well as our recent study using DGE MRI. 48 It was found that the glucose uptake in APP mouse brain is close to or even higher than the age-matched WT mice at the age of 5–10 months for several transgenic APP mouse models, such as 5XFAD, 55 Tg2576, 56 and APP/PS1. 54 However, the impact of tau protein alone on the glucose uptake in AD has not been well investigated. The current study provides one some initial evidence that the toxic tau protein instead of Aβ protein drives the glucose uptake impairment commonly seen in AD, which is consistent with the observation that glucose transporter decreases or hypometabolism are correlated to the density of neurofibrillary tangles but not Aβ in human brains. 57 Previous pathology studies on this animal model showed that the burden of tau tangles occurs by around 12 months, while the tangles begin to appear at the age of 6–9 months. 25 Thus, the glucose-uptake impairment appears to precede the AD tau tangle pathology.
The onVDMP technique can detect unlabeled sugars, which could offer considerable financial savings, and simplify the imaging procedure by removing the requirement for the production and delivery of [ 18 F] FDG. Further improvements of the onVDMP experiment are still possible. In this study, we set the baseline scan time to 10 min, and the first 5 min was regarded as environmental stabilization in the scanner. This was needed to avoid drift in the baseline in some animals, as shown in Figure 5(f). Longer baseline scan time is recommended in future studies to remove this drift. Despite animal constraints, motions during the experiment may also affect the DGE signal, especially during the glucose infusion. In this study, image registration was adopted to minimize the undesirable effects induced by motions, and this issue can be further relieved by using a more motion insensitive acquisition module, such as ultrashort echo time (UTE)-CEST. 58 The clinical translation of onVDMP is of great importance but may face some challenges, such as B0 drift, specific absorption rate (SAR) issue, and limited D-glucose dose for human study. The B0 issue is being addressed, for instance in Herz et al., by adopting an additional B0 correction module specified. 59 The SAR for the onVDMP sequence can be tuned by increasing the mixing time during the binomial pulse and we currently already have a first version on the human scanner. Actually, it has been shown that with the use of dual transmit body coils, SAR can be kept sufficiently low even during CW-CEST. 60 The limited D-glucose dose for human study (25 g normal D-glucose in a 50-mL sterile water solution) 61 may challenge the sensitivity and specificity of onVDMP MRI, and further validation is required.
Conclusions
An onVDMP MRI sequence with a long saturation module was applied to study D-glucose uptake in mouse brain parenchyma and CSF. The feasibility of discriminating AD and WT mice was demonstrated. The results indicate that the AD mice with tau pathology have smaller D-glucose uptake in the parenchyma and slower D-glucose uptake in CSF compared to their WT counterpart, which was tentatively attributed to reduced glucose transporter density or impaired transporter functioning at BBB and BCSFB of AD mice. The results also suggest that the DGE curve of CSF has the potential to be a non-invasive tool for assessing the glymphatic function in brain.
Supplemental Material
sj-pdf-1-jcb-10.1177_0271678X20941264 - Supplemental material for D-Glucose uptake and clearance in the tauopathy Alzheimer’s disease mouse brain detected by on-resonance variable delay multiple pulse MRI
Supplemental material, sj-pdf-1-jcb-10.1177_0271678X20941264 for D-Glucose uptake and clearance in the tauopathy Alzheimer’s disease mouse brain detected by on-resonance variable delay multiple pulse MRI by Lin Chen, Zhiliang Wei, Kannie WY Chan, Yuguo Li, Kapil Suchal, Sheng Bi, Jianpan Huang, Xiang Xu, Philip C Wong, Hanzhang Lu, Peter CM van Zijl, Tong Li and Jiadi Xu in Journal of Cerebral Blood Flow & Metabolism
Footnotes
Funding
The author(s) disclosed receipt of the following financial support for the research, authorship, and/or publication of this article: This work was supported by NIH R01EB019934, R03NS109664, R21AG065794, P50AG05146, DK104867 and DOD W81XWH-18-1-0797.
Declaration of conflicting interests
The author(s) declared no potential conflicts of interest with respect to the research, authorship, and/or publication of this article.
Authors’ contributions
LC and JX designed and performed experiments, processed data, and wrote the manuscript; PCMvZ helped with designing the study, interpreting the data, and manuscript editing; ZW performed experiments, measured mouse brain volumes, and body weight; KWYC, YL, KS, SB, JH, XX, and HL interpreted the data; and PCW and TL provided AD mouse model and interpreted the data. All authors discussed the results and commented on the manuscript.
Supplemental material
Supplemental material for this article is available online.
References
Supplementary Material
Please find the following supplemental material available below.
For Open Access articles published under a Creative Commons License, all supplemental material carries the same license as the article it is associated with.
For non-Open Access articles published, all supplemental material carries a non-exclusive license, and permission requests for re-use of supplemental material or any part of supplemental material shall be sent directly to the copyright owner as specified in the copyright notice associated with the article.