
Abstract
Diabetes is associated with extensive microvascular pathology and decreased expression of the glucose transporter (GLUT-1) in retina, but not brain. To explore the basis of these differences, the authors simultaneously measured glucose influx (μmol · g−1 · min−1) and blood flow (mL · g−1 · min−1) in retina and brain cortex of nondiabetic control rats (normoglycemic and acute-hyperglycemic) and in rats with streptozotocin-induced diabetes (with or without aminoguanidine (AMG) treatment) using a single-pass, dual-label indicator method. In addition, tissue glucose and adenosine triphosphate (nmol/mg dry weight) levels were measured. Glucose influx in retina exceeded that of cortex by about threefold for both the nondiabetic and diabetic groups. In contrast, blood flow in retina was significantly lower than in cortex by about threefold for each group. Retinal and cortical glucose influx in the diabetic rats was lower than in the nondiabetic acute-hyperglycemic group, but not in the normoglycemic group. Blood flow in these tissues remained relatively unchanged with glycemic conditions. The glucose levels in the diabetic retina (aminoguanidine untreated and aminoguanidine treated) were fourfold to sixfold greater than the nondiabetic retina. The cortical glucose levels remained unchanged in all groups. These data suggest that the accumulation of glucose in the diabetic retina cannot be explained by increased endothelial-glucose uptake or increased vascular membrane permeability.
Retina and brain are neural tissues with high metabolic rates that require a constant and abundant supply of oxygen and glucose from the circulation to meet their metabolic demands. The initial step in the delivery of glucose to the retina and brain is its transport across the blood—retinal barrier (BRB) or the blood—brain barrier (BBB) by the major glucose transporter, GLUT-1, which is characterized by Michaelis-Menten kinetics (Dick and Harik, 1986;Dick et al., 1984;Kalaria and Harik, 1989; for reviews see Kumagai, 1999;Mann et al., 2003;Pelligrino et al., 1992). In addition, retina may obtain glucose from surrounding tissue by GLUT-1 mediated transport at the retinal pigment epithelium (RPE) (Harik et al., 1990). In normal retina and brain, the BRB and BBB are believed to provide a stable milieu in the constant face of the systemic variables, such as changing plasma glucose concentrations. Under normal conditions, the transport of glucose in brain is maintained in excess of tissue demand (LaManna and Lust, 1997; Sokolofff et al., 1977). However, under conditions of low glucose or high demand, the influx is limited by the transporter density by a process which is selective, stereospecific and saturable (LaManna and Harik, 1985;LaManna et al. 1993;Mann et al., 2003). Paradoxically, the high capacity of glucose influx can add to the vulnerability of tissues when plasma glucose is pathologically high, such as in uncontrolled diabetes.
Tissue glucose concentrations and the expression of GLUT-1 have been reported to differ in retina and brain of diabetic rats (Tang et al., 2001). GLUT-1 was significantly decreased in neural retina of rats with streptozotocin-induced diabetes, whereas brain and RPE were unaffected. The effects of diabetes on GLUT-1 expression in neural retina could not be explained by decreased vascular density. Despite less expression of glucose transporter in diabetics, previous studies have found that retinal glucose tissue concentrations increased by greater than threefold compared with nondiabetics (Badr et al., 2000; Tang et al., 2001). It was concluded in these studies that although brain and retina are embryologically similar, the effect of diabetes on GLUT-1 expression in retina differs from cerebral cortex and that the glucose transport may also be regulated differently. The investigators further concluded that the expression of GLUT-1 in the microvasculature does not account for the glucose accumulation in retina in diabetes. Whether other transporters were induced in the diabetics was not determined in these studies.
The increase in retinal glucose levels observed in diabetic rats could be explained by (1) increased transporter activity, (2) increased BRB permeability due to vascular-membrane leakiness, (3) alterations in blood flow and glucose metabolism, or (4) tissue-specific vascular characteristics, such as increased capillary density. The objective of this study was to determine if the increase in retinal tissue glucose levels in diabetic rats was a result of increased glucose influx at the BRB either from alterations in blood flow or from changes in vascular-membrane permeability. Cortical blood flow and glucose uptake have been previously studied in hyperglycemic rats using a unidirectional tracer method (Harik and LaManna, 1988;LaManna and Harik, 1985). Thus, we conducted a comparative study in retina and cortex of diabetic rats using a model of unidirectional tracer influx from the blood at the endothelial cell boundary during capillary transit to simultaneously measure glucose influx and blood flow. We measured glucose influx, tissue glucose concentrations, and blood flow in retina and cortex of nondiabetic, diabetic, and diabetic rats treated with oral aminoguanidine, a known inhibitor of diabetic retinopathy in rats and other species (Kern and Engerman, 1996, 2001). The RPE should also be considered as a source for glucose transport into the neural retina because it possesses more GLUT-1 than retina or its microvessels. However, because the RPE is essentially non-vascular and receives its glucose from the surrounding choroid plexus, the contribution of glucose influx from the RPE into retina is not discernible using a unidirectional tracer influx method.
METHODS AND MATERIALS
All procedures were performed in strict accordance with the National Institutes of Health's Guide for the Care and Use of Laboratory Animals and were approved by the Institutional Animal Care and Use Committee of Case Western Reserve University.
Animal preparation, care, and feeding conditions
Male Wistar rats weighing 200 to 225 g were initially assigned randomly to two groups: diabetic (3 months of diabetes) or nondiabetic (controls). Diabetes was induced in overnight-fasted rats by an injection of freshly prepared solution of streptozotocin in citrate buffer (pH 4.5) at 60 mg/kg of body weight in the tail vein and confirmed by increased serum glucose, glycated hemoglobin, and low blood-insulin levels (Badr et al., 2000). Both nondiabetic (control) and diabetic rats were fed Teklad #7004 diets (Harlan Teklad, Madison WI: U.S.A.) ad libitum. To prevent a severe catabolic response in the rats that were insulin deficient, insulin was given as needed to achieve slow weight gain without preventing hyperglycemia and glucosuria (0–2 U NPH-N insulin subcutaneously, up to three times per week for 12 weeks). Once diabetes was confirmed, a subgroup of diabetic animals (aminoguanidine treated) was fed aminoguanidine (2.5 g/kg rat diet) daily, as previously described (Du et al., 2002). To distinguish whether acute hyperglycemia affects blood flow and metabolism in retina and brain, the nondiabetic control group was further subdivided into normoglycemic (10.0–14.0-mmol/L plasma glucose) and acute-hyperglycemic (≥14.0–40-mmol/L plasma glucose) nondiabetic groups. Acute hyperglycemia was induced by administering 50% dextrose (1–3 mL in 5 mL normal saline by intraperitoneal injection) 30 minutes before the experiment. In addition, to acutely lower the blood glucose level, acute hypoglycemia (<5.0-mmol/L plasma glucose) was achieved by administering regular insulin (5–10 U/kg, intraperitoneal) 30 minutes before the experiment.
Surgical procedures
On the day of the experiment, nonfasted rats were anesthetized with an intraperitoneal injection of chloral hydrate (10 mL/kg – 4% chloral hydrate solution in normal saline; Fisher Scientific; Fair Lawn, NJ, U.S.A.) for the surgical placement of intraatrial and femoral catheters and for the duration of the experiment, as previously described (LaManna et al., 1993). Briefly, the surgical procedure involved the placement of a right atrial silastic catheter (0.025-in inner diameter, 0.047-in outer diameter) into the external jugular vein and inserted into the right atrium. A second catheter (polyethylene tubing; PE-50, 0.023-in inner diameter, 0.038-in outer diameter) was placed in the femoral artery for the purpose of monitoring arterial blood pressure, obtaining blood samples, and collecting radioisotope tracers. Rectal temperature was monitored and kept near 37°C by a feedback-controlled infrared lamp. Just before the blood flow experiment, mean arterial blood pressure was recorded and arterial blood samples were collected for blood gas analysis (pH, PaCO2, PaO2), hematocrit, plasma glucose level, and plasma lactate level.
Blood flow and glucose influx measurements
The dual-label isotope indicator-fractionation method was used to simultaneously measure substrate influx and blood flow in retina and brain cortex (LaManna et al., 1993). This method uses an optimal time between injection of tracer and decapitation (10–13 seconds), such that most of the tracer should pass through the tissue at the time of sampling (LaManna and Harik, 1985). The femoral artery cannula was connected to a syringe pump calibrated to withdraw at a rate of 1.60 mL/min and started 3 seconds before giving the tracers. A bolus containing the radioisotopes of n-[14C]butanol (1.0 Ci/mol; American Radiolabeled Chemicals, St. Louis, MO, U.S.A.) and D-[3H] or L-[3H]glucose (1.0 Ci/mol; New England Nuclear, Boston MA, U.S.A.) tracers was given through a jugular-vein catheter 13 seconds before decapitation. The withdrawn blood was collected quantitatively into weighed vials and the aliquots measured for their radioisotope content. Samples of venous blood oozing from the foramen magnum were collected in heparinized tubes, and aliquots of the venous plasma were counted to estimate the residual vascular radioactive content at decapitation (LaManna et al., 1993). The retina and brain were rapidly removed and bilateral retinal and cortical samples were weighed and solubilized in tightly closed scintillation vials and the radioisotope content determined by β-scintillation spectroscopy (1600 TR Packard; Packard Instruments, Downers Grove, IL, U.S.A.).
To determine how much of the measured glucose influx was due to passive diffusion, a tracer bolus of L-[14C]glucose (substrate that is not carrier mediated by GLUT-1) instead of D-[14C]glucose was given to a separate group of animals. As with the D-[14C]glucose, the L-[14C]glucose was measured as a function of increasing blood glucose concentration. The amount of glucose crossing the BRB or BBB by passive diffusion is then determined from the calculated diffusional constant for L-glucose and linear regression analysis (LaManna and Harik, 1985;LaManna et al., 1993).
Regional blood-to-retina and blood-to-brain glucose influx and blood flow calculations
Blood flow (BF; mL · g−1 · min−1) and glucose influx (J; (mol · g−1 · min−1) was determined from the measured radioisotope contents in each of the tissue and blood samples by the following calculations (LaManna et al., 1993): BF = Fs × [14C]tissue/ [14C]s × tissue weight; J = Fpl × ln(1 − E) × [glucosepl]; where E is the extraction fraction (ratio of tracers in the tissue vs ratio of tracers in the blood: E = [(3H/14C)tissue/(3H/14C)art; where Fpl is plasma flow = (BF × [1 − hematocrit]), and [glucosepl] is the plasma glucose concentrations (mmol/L). Disintegrate ns per minute (DPMs) in cortex samples are corrected for intravascular compartment volumes (Vpl) by the following formula: DPMcorrect = dpmtissue − (dpmpl / μL × Vpl × tissue weight), as previously described (LaManna and Harik, 1986). However, because the retinal intravascular compartment-measured inulin space has been reported to be comparable to that of the cortex (Ennis et al., 1982), we assumed the retinal Vpl was the same as cortical Vpl.
Adenosine triphosphate and glucose tissue concentrations
In a separate set of rats (nondiabetic normoglycemic, diabetic aminoguanidine untreated, and diabetic aminoguanidine treated), adenosine triphosphate (ATP) and glucose tissue concentrations were measured in retina and cortex. Retinal and cortical samples were dissected from frozen in situ tissue using a funnel freezing procedure (Ponten et al., 1973) and lyophilized. To avoid fixation artifact, the funnel-freezing technique was slightly modified to adjust for the position of the eyes. A cup used to the hold liquid nitrogen was positioned over the eyes and brain. ATP and glucose tissue concentrations were analyzed enzymatically (Lowry and Passonneau, 1972) and reported as nanomoles per milligram dry tissue weight.
Statistical analysis
Data were calculated as the mean ± SD and analyzed by one-way analysis of variance with Tukey's correction method and multivariate linear model for multiple comparisons (SPSS 9.0; SPSS Inc., Chicago, IL, U.S.A.) and as well the unpaired t-test, where a probability level of P < 0.05 was considered statistically significant. In addition, the blood flow data were analyzed using two-tailed (5%) significance levels of the correlation coefficient r. The cortical blood flow and glucose influx measurements were the averages of the bilateral frontal and parietal cortical regions, as there were no significant differences between these regions.
RESULTS
Physiologic variables
On the day of the experiment, pH, PaCO2, PaO2, hematocrit, plasma lactate level, mean arterial blood pressure, and weights were also measured in each of the animals (Table 1). The plasma glucose levels ranged from 3 to 32 mmol/L in the nondiabetic group (hypoglycemic, 3.0 mmol/L; normoglycemic, 10.0–14.0 mmol/L; acute hyperglycemic, 14.0–32.0 mmol/L), 13 to 32 mmol/L in the diabetic aminoguanidine-untreated group, and 17 to 39 mmol/L in the diabetic aminoguanidine-treated group. The arterial pH values were slightly acidic in the diabetic groups (aminoguanidine untreated and aminoguanidine treated) compared with the nondiabetic groups, as previously reported (Harik and LaManna, 1988). There were no significant differences in pH between the nondiabetic normoglycemic and hyperglycemic groups. PaCO2, PaO2, hematocrit, plasma lactate level, and mean arterial blood pressure were similar in all groups. The mean body weights were significantly lower in the diabetic groups compared with the nondiabetic groups by about 1.6-fold.
Physiological values in experimental groups∗
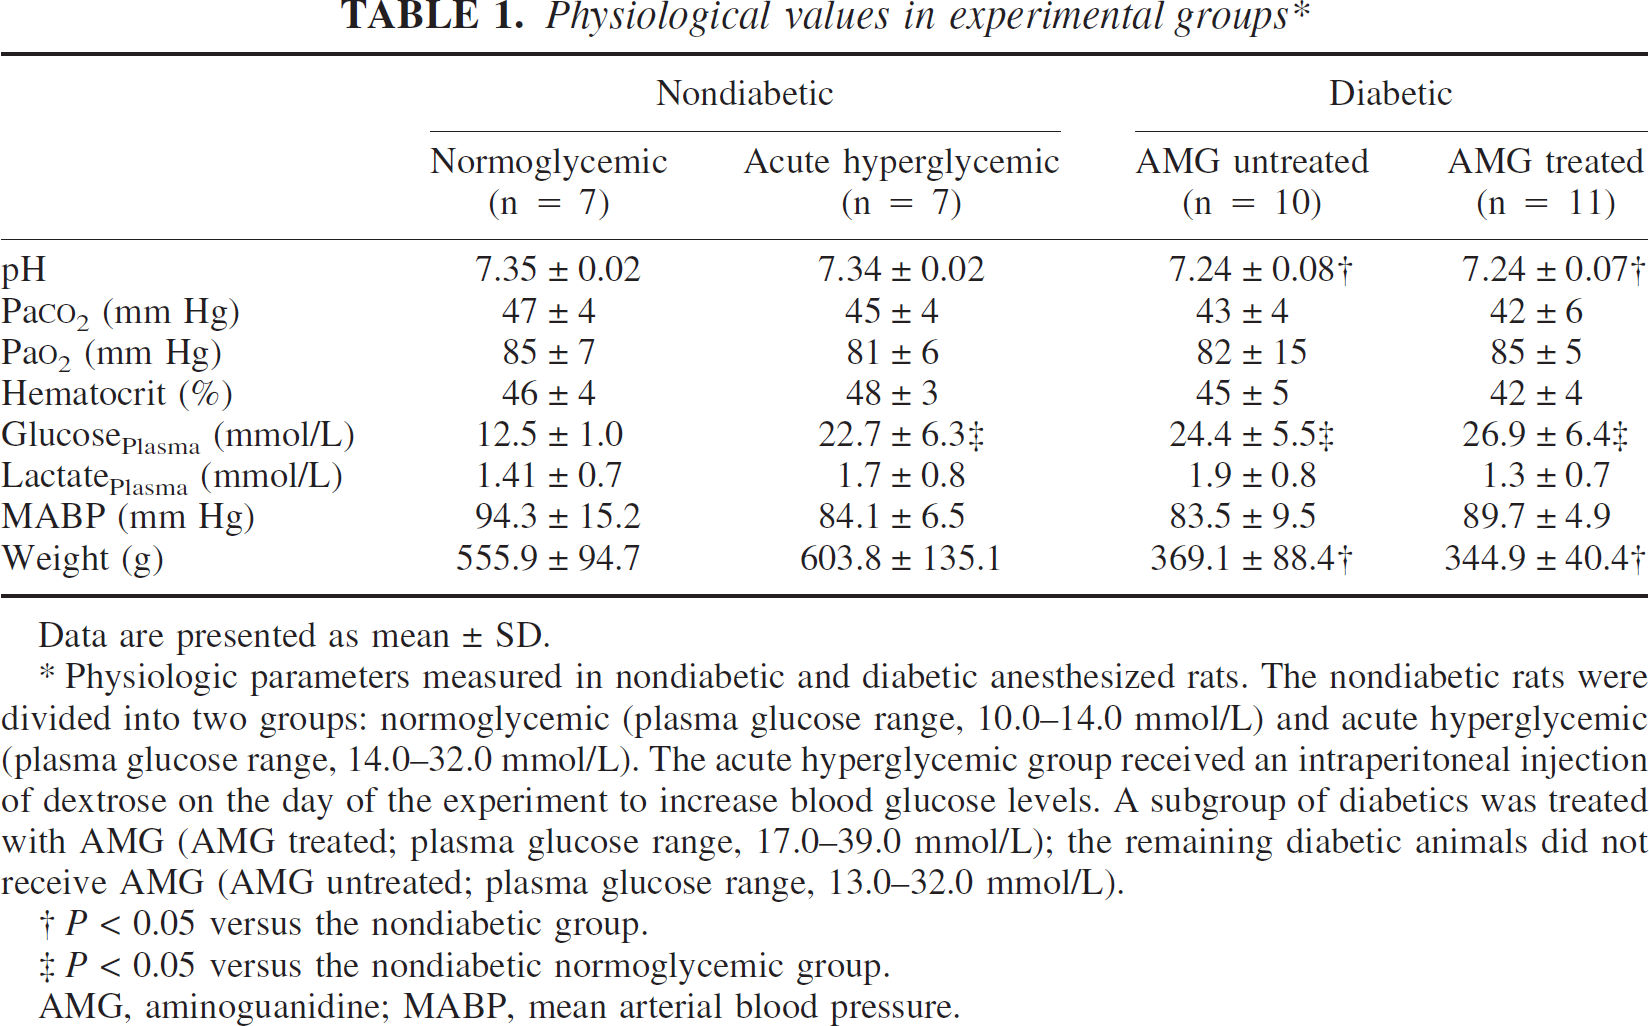
Data are presented as mean ± SD.
AMG, aminoguanidine; MABP, mean arterial blood pressure.
Physiologic parameters measured in nondiabetic and diabetic anesthesized rats. The nondiabetic rats were divided into two groups: normoglycemic (plasma glucose range, 10.0–14.0 mmol/L) and acute hyperglycemic (plasma glucose range, 14.0–32.0 mmol/L). The acute hyperglycemic group received an intraperitoneal injection of dextrose on the day of the experiment to increase blood glucose levels. A subgroup of diabetics was treated with AMG (AMG treated; plasma glucose range, 17.0–39.0 mmol/L); the remaining diabetic animals did not receive AMG (AMG untreated; plasma glucose range, 13.0–32.0 mmol/L).
P < 0.05 versus the nondiabetic group.
P < 0.05 versus the nondiabetic normoglycemic group.
Measurements of tissue adenosine triphosphate and glucose concentrations
Retinal and cortical ATP and glucose levels (nmol/mg dry weight) were measured in nondiabetic, diabetic aminoguanidine-untreated, and diabetic aminoguanidine-treated rats (Table 2). Retina and brain ATP levels were similar in all the groups, whereas the retinal glucose levels were significantly elevated by fourfold to sixfold in both diabetic groups compared with the nondiabetic rats (Fig. 1 and Table 2). The cortical glucose levels remained relatively unchanged among groups.
Tissue glucose and ATP concentrations in retina and brain∗
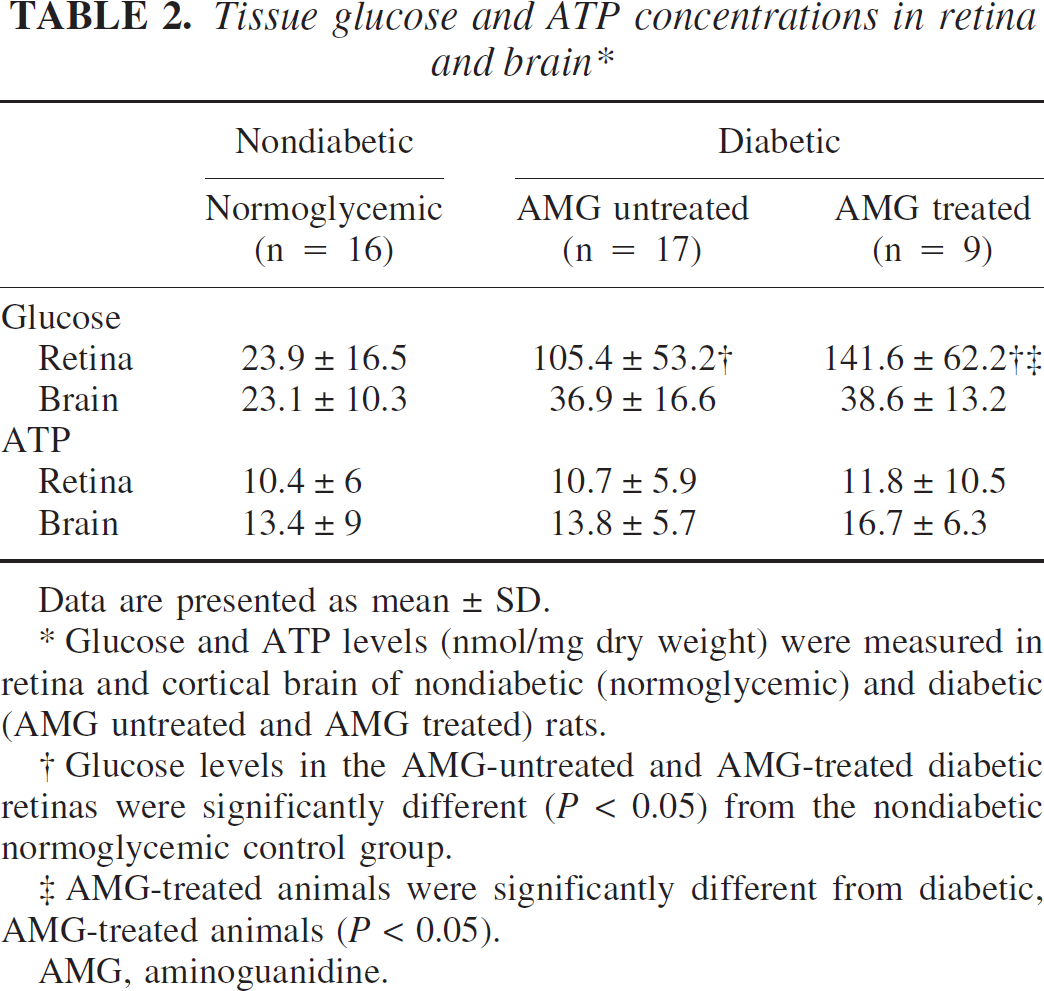
Data are presented as mean ± SD.
Glucose and ATP levels (nmol/mg dry weight) were measured in retina and cortical brain of nondiabetic (normoglycemic) and diabetic (AMG untreated and AMG treated) rats.
Glucose levels in the AMG-untreated and AMG-treated diabetic retinas were significantly different (P < 0.05) from the nondiabetic normoglycemic control group.
AMG-treated animals were significantly different from diabetic, AMG-treated animals (P < 0.05).
AMG, aminoguanidine.
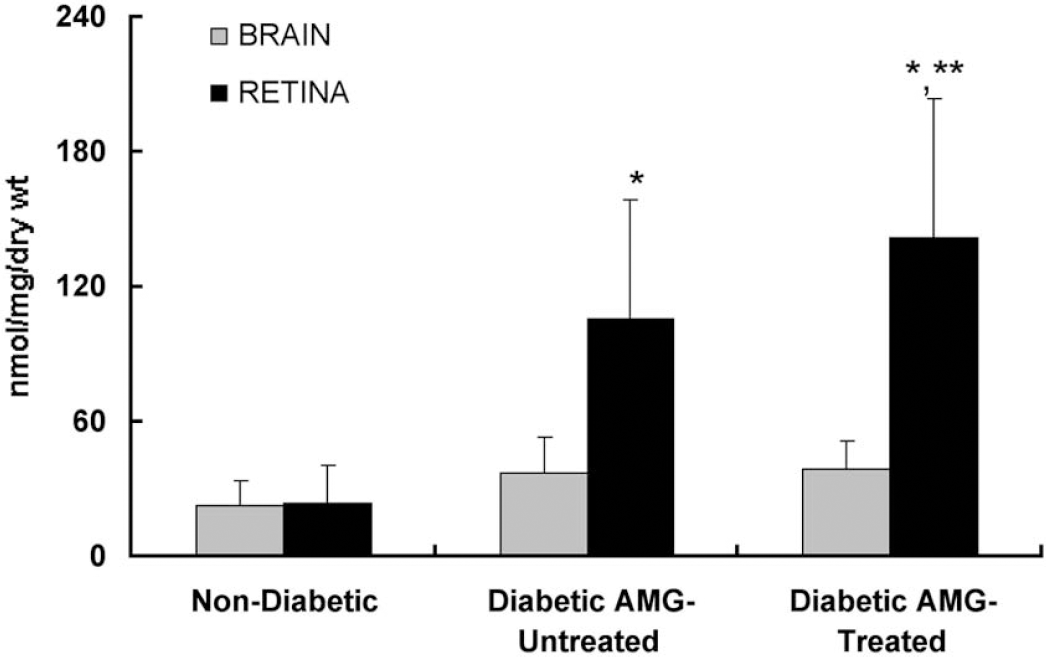
Glucose concentrations (nmol/mg dry weight) measured in retina and cortex of nondiabetic (normoglycemic) and diabetic (aminoguanidine-untreated and aminoguanidine treated) rats. The retinal glucose concentrations in both diabetic groups, aminoguanidine-untreated and aminoguanidine-treated, were considerably greater than in the nondiabetic retina. The glucose levels in the retina of the diabetic aminoguanidine-treated group were also significantly different from those found in the diabetic aminoguanidine-untreated group. Cortical glucose concentrations were similar among all groups. *P < 0.05 versus nondiabetic rats; **P < 0.05 versus diabetic aminoguanidine-untreated rats. AMG, aminoguanidine.
Retinal and cortical blood flow
Fig. 2 is a comparison of the retinal and cortical blood flows (mL · g−1 · min−1) in the nondiabetic group. The retinal and cortical blood flows showed a nonstatistically significant downward trend (r = 0.506, 0.468; n = 14) with increasing plasma glucose concentration. This trend was also found for the diabetic and diabetic aminoguanidine-treated groups (individual data not shown; see also Table 3). Similarly, there were no significant differences in retinal or cortical blood flow among the nondiabetic, diabetic aminoguanidine-untreated, and diabetic aminoguanidine-treated groups. However, in each of the groups there was a significant difference when comparing retinal with cortical blood flow (Table 3). Notably, the retinal blood flow was twofold to threefold lower than cortex in each of the groups.
Retinal and cortical blood flow and D-glucose influx∗
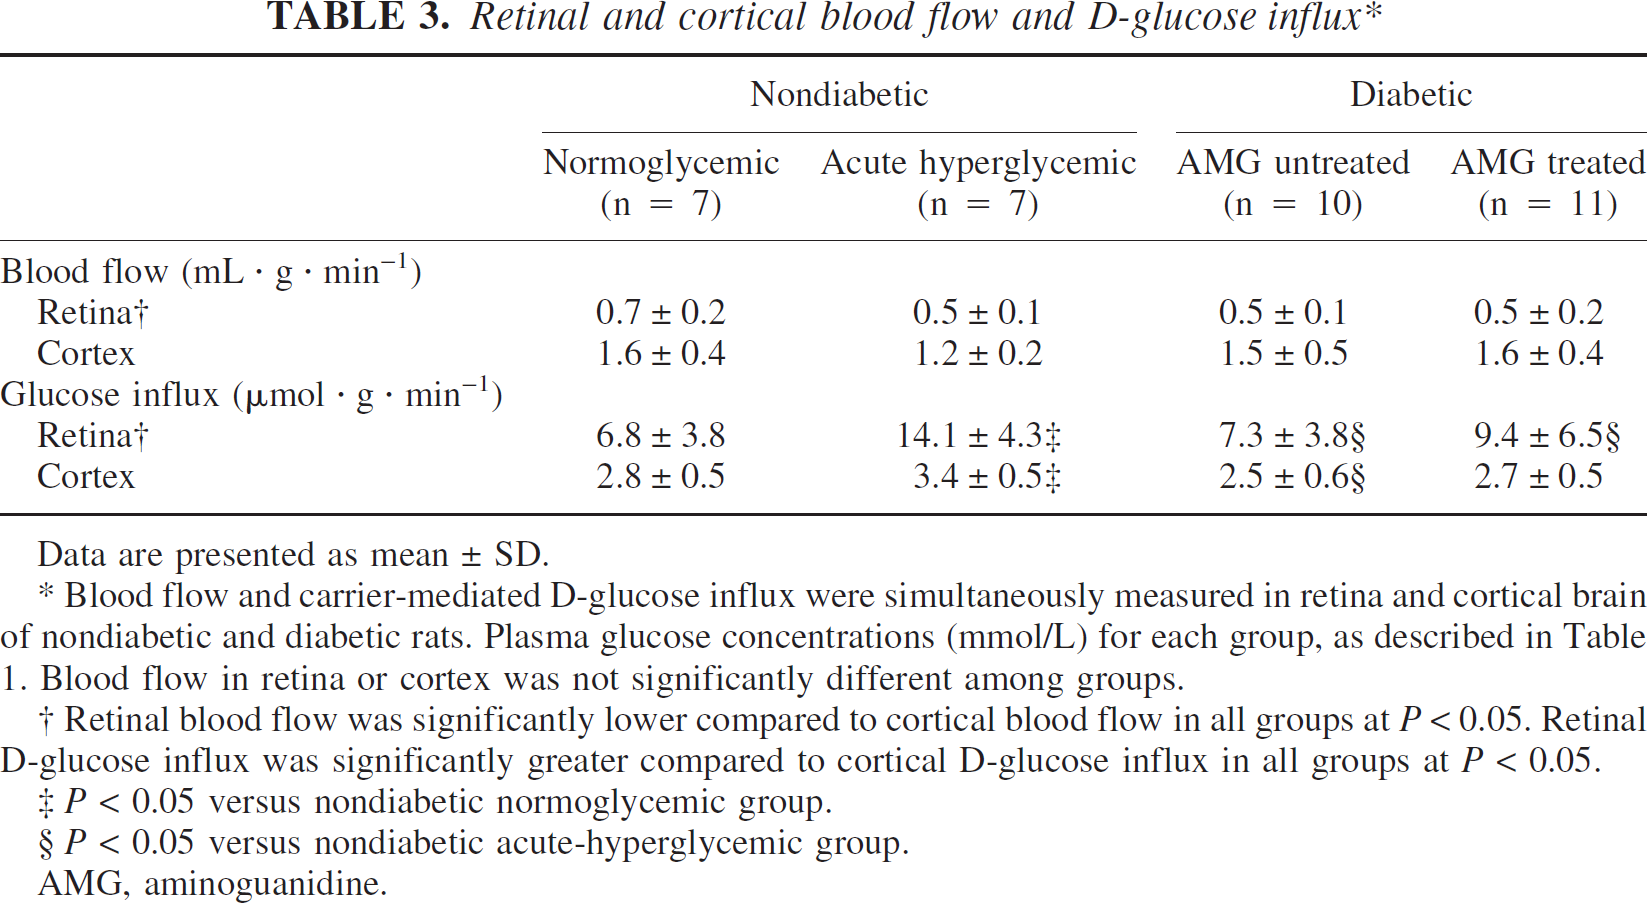
Data are presented as mean ± SD.
Blood flow and carrier-mediated D-glucose influx were simultaneously measured in retina and cortical brain of nondiabetic and diabetic rats. Plasma glucose concentrations (mmol/L) for each group, as described in Table 1. Blood flow in retina or cortex was not significantly different among groups.
Retinal blood flow was significantly lower compared to cortical blood flow in all groups at P< 0.05. Retinal D-glucose influx was significantly greater compared to cortical D-glucose influx in all groups at P < 0.05.
P < 0.05 versus nondiabetic normoglycemic group.
P < 0.05 versus nondiabetic acute-hyperglycemic group.
AMG, aminoguanidine.
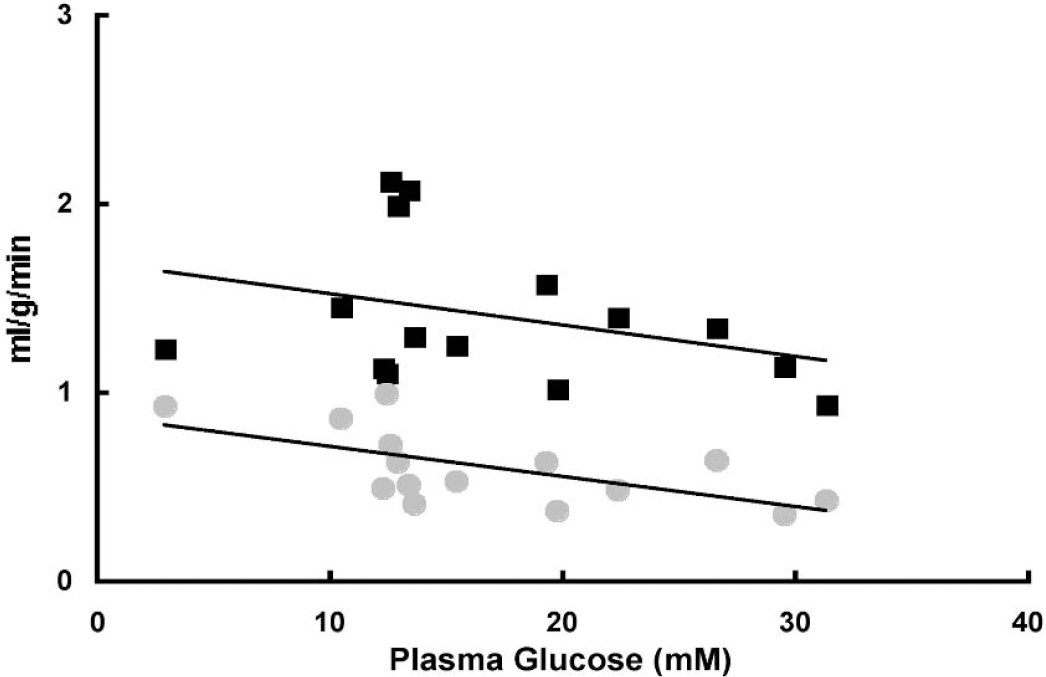
Retinal and cortical blood flows (mL · g−1 · min−1: individual data points as a function of plasma glucose (mmol/L) for nondiabetic rats. Both the retinal (circles) and cortical (squares) blood flows show a downward trend with hyperglycemia. Retinal blood flow was significantly lower than cortical blood flow (Table 3) Retinal and cortical blood flows were not statistically significant with increasing plasma glucose concentration (r = 0.506, 0.468; n = 14, respectively; hypoglycemic data point was not included).
Retinal and cortical glucose influx
Among the groups, the glucose influx was significantly greater in retina than in cortex by about threefold (Table 3). Fig. 3 is a graph of the glucose influx (μmol · g−1 · min−1) in both the retinal and cortical tissues with increasing glucose plasma concentrations (mmol/L). The influx measurements were corrected for the glucose portion crossing the BRB and BBB by passive diffusion (see below). Retinal (Fig. 3A) and cortical (Fig. 3B) glucose influx increased with increasing plasma glucose in the nondiabetic and diabetic untreated rats. The dashed line in Fig. 3A represents a simple linear fit of the retinal glucose influx to the trends between the two groups (nondiabetic and aminoguanidine-untreated diabetic). Though more variable than the nondiabetic and diabetic aminoguanidine-untreated rats, this trend was also observed in the retinal and cortical tissues of the diabetic aminoguanidine-treated rats (individual points not shown).
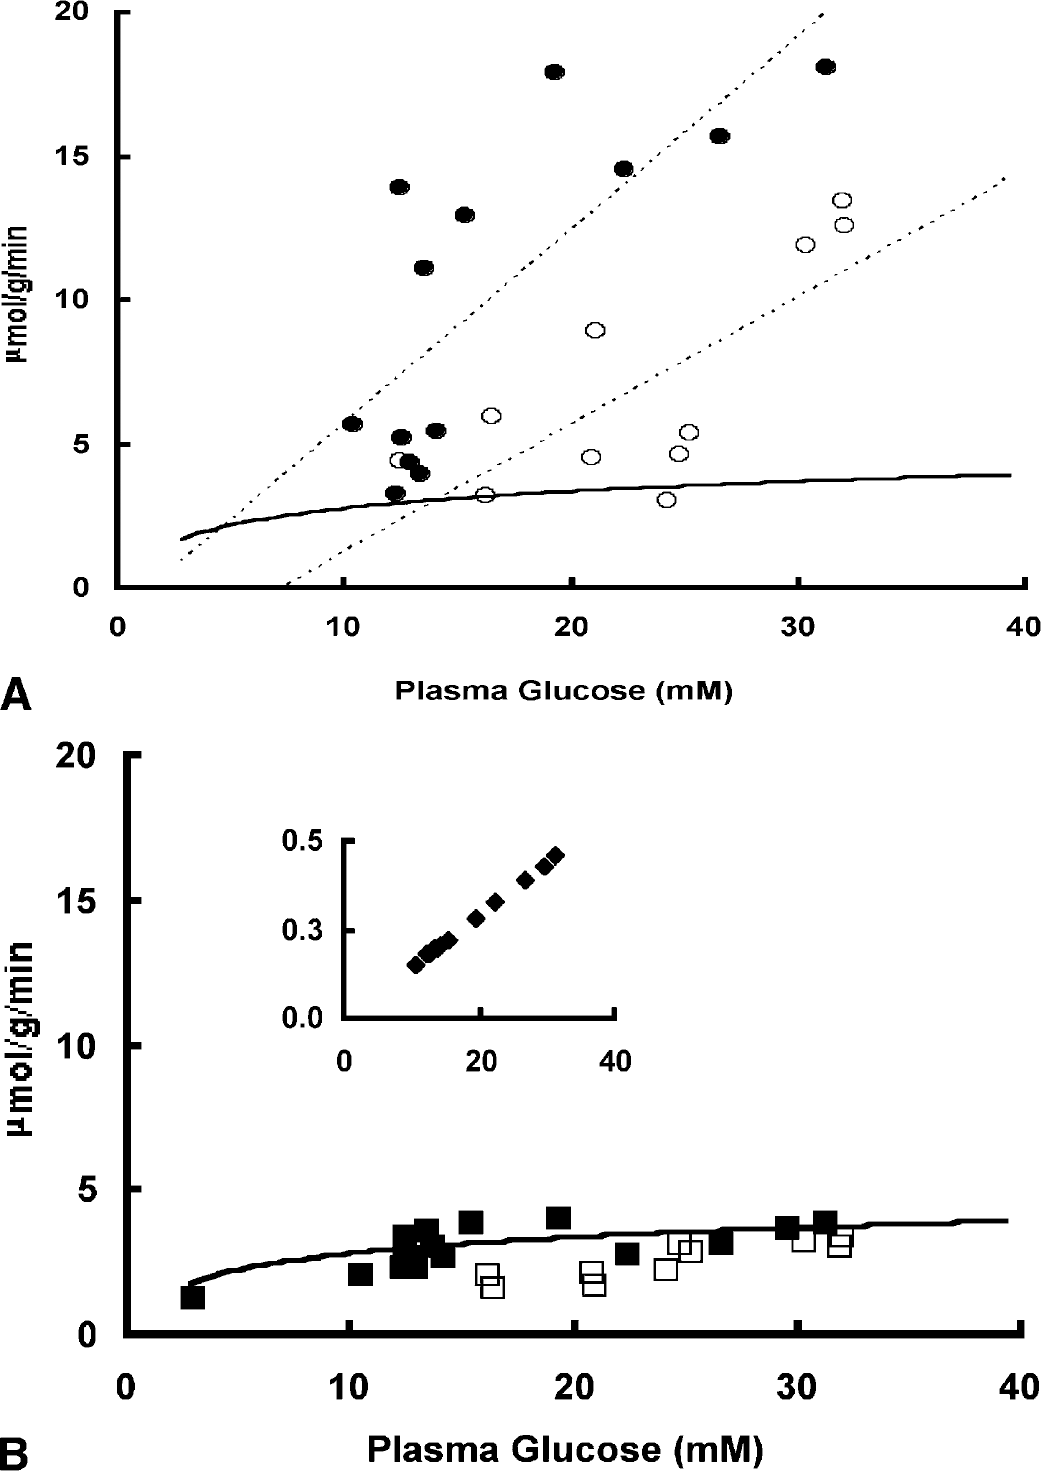
Retinal and cortical glucose influx (J; (μmol · g−1 · min−1): individual data points as a function of plasma glucose (G; mmol/L) for nondiabetic and diabetic aminoguanidine-untreated rats. (
In another set of animals, the diffusional component to glucose influx for each of the experimental groups was determined by the diffusional constant for L-glucose and linear regression analysis (LaManna and Harik, 1985;LaManna et al., 1993). The mean cortical L-glucose influx (μmol · g−1 · min−1), measured as a function plasma glucose concentration, in the nondiabetic control rats (0.41 ± 0.24, n = 7) was not significantly different from the diabetic aminoguanidine-untreated group (0.53 ± 0.23, n = 7) and similar to the retinal L-glucose influx (nondiabetic rats, 0.35 ± 0.21; diabetic aminoguanidine-untreated rats, 0.67 ± 0.40). From this the diffusional constant for L-glucose was determined. Thus, the amount of glucose entering the cortex by passive diffusion was about 10% of the total glucose crossing the BBB for the nondiabetic (7%, normoglycemic; 11%, acute hyperglycemic) and diabetic aminoguanidine-untreated rats (11%) and much less for retina (3%, 2%, and 4%, respectively). The inset in Fig. 3B exhibits a linear relationship between the cortical glucose influx crossing the BBB by passive diffusion (nondiabetic and aminoguanidine-untreated diabetic combined) and increasing plasma glucose (note scale difference). Similarly, the retinal glucose crossing the BRB by passive diffusion was also linear and not significantly different between nondiabetic and diabetic aminoguanidine-untreated groups (individual points not shown). Because the L-glucose influx was not measured in the diabetic aminoguanidine-treated group, the diffusional component to glucose influx was not determined.
The cortical glucose influx data obtained from the nondiabetic group was plotted to a standard Michaelis-Menten equation,

as shown by a solid line in Figs. 3A and 3B. The retinal glucose influx did not fit Michaelis-Menten kinetics as shown in Fig. 3A (the cortical Michaelis-Menten fit was drawn for reference). An assumed Kt of 5 mmol/L was used because the extreme low and high plasma glucose levels were not achieved in this study. This value (Kt) was previously reported from a similar study using the current blood flow methods (LaManna and Harik, 1985). The fitted plot was generated by rearranging the Michaelis-Menten equation and solving for Tmax · Tmax (4.1 μmol · g−1 · min−1) was then calculated using the measured cortical glucose influx values (J; corrected for the diffusional component), plasma glucose concentrations (G), and a Kt value of 5.0 mmol/L. From this, the measured values (J, G) for each of the groups and tissues (retina and brain) were plotted against the Michaelis-Menten equation. In contrast to the cortex, the retinal glucose influx did not fit to the Michaelis-Menten equation even when comparing the glucose influx over similar plasma glucose range as cortex (Fig. 3A).
Direct comparison of glucose influx in the nondiabetic normoglycemic retina and diabetic retina reveals no significant differences (Table 3). However, comparison of glucose influx of diabetic retina and cortex to that of the acute-hyperglycemic nondiabetic rats shows significant differences between these two groups. The retinal glucose influx in the diabetic aminoguanidine-untreated group was significantly lower than in the nondiabetic hyperglycemic group, suggesting a downregulation of glucose transporter in the diabetic animals (Tang et al., 2001). The cortical influx in the diabetic aminoguanidine-untreated group, but not the diabetic aminoguanidine-treated group, also was significantly lower compared with the influx in the nondiabetic hyperglycemic group. In addition, the retinal and cortical glucose influx was significantly greater in the nondiabetic acute-hyperglycemic group than in the nondiabetic normoglycemic group (Table 3).
DISCUSSION
This study was instituted on the basis that the observed increases in retinal glucose concentrations of diabetic rats could be due to altered BRB integrity or blood flow. We showed that glucose influx in diabetic retina was less than what would be expected from acute hyperglycemic transport studies. These findings do not support the idea that increased tissue glucose concentrations in diabetic retina are due to increased uptake. This conclusion is consistent with the findings of decreased glucose transport (by GLUT-1) and insignificant changes in blood flow in retina in diabetes. The results of this study show that brain glucose concentrations are a function of plasma glucose that obeys the Michaelis-Menten kinetics, but not retina. In addition, the retinal glucose concentrations are significantly increased than brain with increasing hyperglycemia. The ATP levels in all groups remained relatively unchanged, suggesting ATP metabolism is maintained (Lust et al., 1973).
Hyperglycemia, per se, may be sufficient to initiate diabetic retinopathy through pathologically high tissue glucose levels (Engerman and Kern, 1995). Nevertheless, the association among hyperglycemia, diabetes, and retinopathy remains to be mechanistically defined (Addison et al., 1970;Harik and LaManna, 1988;Kern and Engerman, 1996;Mann et al., 2003). The primary mechanisms implicated in the pathogenesis of diabetic retinopathy are thought to be biochemical and hemodynamic, all of which are dependent on excessive transport (GLUT-1) or accumulation of glucose (Kumagai, 1999;Lorenzi et al., 1986) within the retina or its microvasculature (Kador et al., 1988;Kern and Engerman, 1986;Mizutani et al., 1996). The results of this study reveal that the increased retinal glucose levels in the group of diabetic rats are not a consequence of increased glucose crossing the BRB. Moreover, the diffusional component to retinal glucose influx was less than 5% of the total glucose influx in both the diabetic and nondiabetic groups, indicative of a preserved BRB integrity. Diffusion could not account for the fourfold to sixfold differences in tissue glucose levels in the diabetic groups (aminoguanidine untreated and aminoguanidine treated) compared with the nondiabetic group.
Despite decreased expression of the GLUT-1 in neural retina and isolated retinal capillaries (but not RPE), diabetes results in increased retinal glucose concentrations with little or no change in brain glucose levels (Badr et al., 2000). The results presented here indicate a significant decrease in glucose influx in retina and cortex of diabetic rats compared with the acute-hyperglycemic control group (Table 3). This finding is consistent with a downregulation of GLUT-1 protein with chronic hyperglycemia (Badr et al., 2000;Taarnhoj and Alm, 1991) and suggests that the effects of hyperglycemia are due to high systemic glucose levels and presumably not to the upregulation of the transporters. Nevertheless, this finding does not explain the high concentrations of glucose measured in retina of these diabetic animals.
Like brain, the retina is highly metabolic and depends on transport of glucose and other substrates that require carrier-mediated transport at the retinal blood barrier (Alm et al., 1981;Ennis et al., 1982;Harik et al., 1990;Yudilevich and De Rose, 1971). In contrast to the brain, the retina receives substrates from two distinct vascular beds, the inner capillary bed (at the BRB) and highly vascularized choroid that lie next to the outer RPE (Mann et al., 2003). GLUT-1 is localized to the vasculature of the retina and RPE, with the density being greater at the RPE. This suggests that the majority of glucose transport into the neural retina most likely occurs at the RPE—choroid interface. One possible explanation for the specific increase in retinal glucose levels in diabetes compared with cortex could be from increased entry into retina at the RPE—choroid interface.
Glucose influx into retina is about threefold greater than cortex. These findings may be indicative of the glucose predominately entering retina from two sites (retina vasculature and RPE) opposed to only one in brain (BBB) or from a second transporter in retina having different glucose transport kinetics not found in brain. Half maximal transport (Kt) of glucose occurs at different glucose concentrations for BRB and BBB. Normal brain has been reported to be between 2.0 and 11.0 mmol/L (Cremer et al., 1979;LaManna and Harik, 1985;Mann et al., 2003). The retina has been reported to have both high and low affinity systems ranging from 0.24 to 7.8 mmol/L (Ennis et al., 1982), as well as different affinities for neural retina and RPE transporters (Vilchis and Salceda, 1996). In addition, Vmax has been shown to change by 2.5 fold in the presence of 22.0 mmol/L glucose in primary cultures of human retinal endothelial cells without changes in GLUT-1 mRNA or protein levels (Busik et al., 2002). Such differences in transport properties might explain the nonsaturable nature in the retina as compared with the saturable kinetics of cortical glucose influx (Fig. 3), and might contribute to the observed differences in glucose tissue concentrations in the diabetic and nondiabetic groups.
Similarly, others have reported retinal glucose influx of methyl-D-glucose as being two to three times higher than in brain (Alm and Tornquist, 1981) using the uptake index method (Oldendorf, 1970). The uptake index can be related to the extraction fraction measured by the single-pass, dual-label technique used in this study. However, because the RUI (retinal uptake index) and BUI (brain uptake index) methods use 3HOH, a normalizing factor must be considered when another indicator tracer is used, such as n-[14C]butanol. For example, the percent difference between ethanol and HOH in brain has been reported to be 1.17%, but the factor in retina was 0.69% (Alm and Tornquist, 1981). When the data presented in this study are corrected for the differential between labeled indicator tracers (HOH and n-butanol), assuming n-butanol has an uptake index similar to that of ethanol, the data are in agreement with others (Alm and Tornquist,1981;Ennis et al., 1982).
Although blood flow in retina followed the same downward trend with increasing plasma glucose concentration as cortex (Duckrow and Bryan, 1987;Kikano et al., 1989), blood flow in the retina was significantly lower compared with cortex (diabetic and nondiabetic groups), by about threefold. Unlike brain, this may be an underestimate because of the potential loss of the indicator tracer at the vitreous body (Alm and Tornquist, 1981). When comparing our data with previously reported data and accounting for the percent differences between indicator tracers using the factors described in this study (see Materials and Methods for blood flow calculation), blood flow in retina is about twofold lower than brain (31%, nondiabetic group; 47%, diabetic groups). There were no significant differences in retinal blood flow between diabetic and nondiabetic rats, suggesting that blood flow does not contribute to the high glucose concentrations observed in the diabetic retina. Some studies have shown increased retinal blood flow in rats with streptozotocin-induced diabetes by using microsphere (Sutera et al., 1992) and hydrogen clearance (Cringle et al., 1993) techniques, whereas others have using video-based fluorescein angiography report that blood flow is decreased in retina of diabetic rats (Clermont et al., 1994;Kunisaki et al., 1995). The severity of diabetes and the technical differences among the various methods used to measure blood flow could account for these discrepancies.
Interestingly, the retinas in diabetic aminoguanidine-treated rats have the highest glucose levels than either the nondiabetic or diabetic aminoguanidine-untreated rats, whereas the glucose influx was not markedly changed between groups with the exception of the acute hyperglycemic group. Aminoguanidine is known to prevent diabetic retinopathy and apparently does so without changing glucose uptake in diabetes. These data suggest that aminoguanidine does not inhibit diabetic retinopathy by decreasing glucose influx in retina or increasing glucose disposal, but the effect of aminoguanidine on glucose metabolism has yet to be determined in retina.
CONCLUSION
Glucose influx into retina in diabetes was less than what would be expected from acute-hyperglycemic transport studies with little changes in blood flow. Whereas brain glucose uptake becomes saturated as plasma glucose concentration increases, retinal uptake does not. This observation seems to explain the differences in tissue glucose concentrations between hyperglycemic retina and brain. The high concentrations of glucose in diabetic retina were not necessarily related to excessive glucose transport or breakdown in BRB integrity. We conclude that the retina, embryologically similar to brain, appears to be more vulnerable to hyperglycemia than brain even though both tissues are exposed the similar blood glucose concentrations. Our findings do not support the idea that increased retinal glucose concentrations are as a result of increased glucose influx. The differences between retina and brain could be related to metabolic alterations in glucose metabolism, such as decreases in glucose utilization or glucose efflux (Mans et al., 1988). The activity or function of GLUT-1 on glucose efflux and the contribution of glucose entering from the RPE remains to be determined.
Footnotes
Acknowledgments
The authors thank Dr. Sami I. Harik, Department of Neurology, University of Arkansas Medical School, for his assistance, suggestions, and critical review of this manuscript, and Sue Foss for her administrative assistance.