
Abstract
Local changes in cerebral blood flow are thought to match changes in neuronal activity, a phenomenon termed neurovascular coupling. Hypoxia increases global resting cerebral blood flow, but regional cerebral blood flow (rCBF) changes are non-uniform. Hypoxia decreases baseline rCBF to the default mode network (DMN), which could reflect either decreased neuronal activity or altered neurovascular coupling. To distinguish between these hypotheses, we characterized the effects of hypoxia on baseline rCBF, task performance, and the hemodynamic (BOLD) response to task activity. During hypoxia, baseline CBF increased across most of the brain, but decreased in DMN regions. Performance on memory recall and motion detection tasks was not diminished, suggesting task-relevant neuronal activity was unaffected. Hypoxia reversed both positive and negative task-evoked BOLD responses in the DMN, suggesting hypoxia reverses neurovascular coupling in the DMN of healthy adults. The reversal of the BOLD response was specific to the DMN. Hypoxia produced modest increases in activations in the visual attention network (VAN) during the motion detection task, and had no effect on activations in the visual cortex during visual stimulation. This regional specificity may be particularly pertinent to clinical populations characterized by hypoxemia and may enhance understanding of regional specificity in neurodegenerative disease pathology.
Introduction
The blood supply to the brain is under an exquisite level of control and widely assumed to be closely matched to neuronal activity. During hypoxia, when oxygen supply diminishes, global cerebral blood flow (CBF) increases. 1 However, hypoxia-induced changes in CBF are not uniform across the brain.2,3 For example, basal ganglia experience larger CBF increases than cerebral cortex, 4 and Noth et al. 3 reported both increases and decreases in CBF during a short period of hypoxia (<1 h); however, Noth et al. observed substantial heterogeneity across subjects and did not report any regionally specific effect. Recently, we reported increased CBF in most cortical regions following 2 h of exposure to hypoxia, except in the posterior cingulate cortex (PCC), angular gyri (AG), and other regions of the default mode network (DMN), where consistent reductions in CBF across all participants were observed instead. 2 This novel finding could have resulted from either decreased baseline neuronal activity; uncoupling or reversal of neurovascular coupling, or a purely vascular phenomenon. These regionally-specific decreases in CBF within the DMN may reflect in some way the peculiar metabolic status of this network within the brain. This unique response may also underpin why these regions are more sensitive to insult and neurodegeneration; if the normal signaling mechanisms to supply oxygen and glucose to support neuronal activity are uncoupled or reversed, this would greatly impact the sustainability of neuronal activity within these regions under environmental or age-related stressors.
Earlier positron emission tomography (PET) 5 and functional Magnetic Resonance Imaging (fMRI) 6 studies observed the preservation of neurovascular coupling and the blood oxygen level dependent (BOLD) response in the visual cortex of young healthy participants during hypoxia. A recent study further supported maintained neurovascular coupling in the visual cortex, although a slight reduction in the BOLD response was reported. 7 However, there is limited evidence regarding the effect of hypoxia on hemodynamic responses outside the visual cortex in humans.
Under the assumptions of preserved neurovascular coupling in hypoxia, the reduction in CBF previously reported by Lawley et al. 2 may reflect diminished local neuronal activity in the DMN. This would be akin to the reductions in rCBF seen in the DMN during certain goal-directed tasks. 8 However, studies directly investigating the metabolic effects of hypoxia show either no change in global cerebral metabolic rate of oxygen (CMRO2) 9 or a slight increase.10,11 Alternatively, the normal coupling of the vascular response to neuronal activity may be disrupted by hypoxia. Indeed, modulation of neurovascular coupling has been observed in the sensorimotor cortex of anesthetized rats during forepaw stimulation.12,13 Changes in neurovascular coupling and BOLD responses have also been reported in the ischemic territory of a subgroup of patients with large vessel stenosis, whose vascular reactivity was limited due to maximal dilation, 14 and in response to cortical spreading depression in patients with traumatic brain injury who showed evidence of impaired autoregulation. 15 These modulations of the neurovascular response have generally been associated with a reduced vascular reactivity. It is important to note that in the Lawley 2 study, vascular reactivity was maintained in the regions of the DMN that showed reduced CBF in hypoxia. This finding suggests that the reductions in CBF do not just reflect a reduction in the ability of the vasculature to react in hypoxia. In addition, the regionally-specific nature of the reductions reported by Lawley, 2 make a reduction in PaCO2 due to hypoxia-induced ventilatory increases, less likely to be a driving factor, although some regionally-specific vascular signal cannot be ruled out. In summary, past research has shown that hypoxia-induced CBF reductions are present, are likely regionally specific, and while some regionally-specific vascular signal is not ruled out, these reductions do not reflect a response to a global signal like PaCO2.
The present study therefore aimed to settle two issues. First, we wanted to replicate, and more comprehensively characterize, the regional CBF (rCBF) changes at rest during hypoxia, using arterial spin labelled (ASL) MRI. Second, we aimed to probe whether hypoxia-induced rCBF reductions in the DMN at rest reflect either decreased neuronal activity, or the more intriguing possibility of an uncoupling or reversal of neurovascular coupling in hypoxia. To distinguish between these mechanisms, we assessed the effect of hypoxia on BOLD responses evoked by two tasks: (1) an associative memory task, and (2) a motion detection task. These tasks were chosen as they were expected to evoke opposing BOLD responses in regions of the DMN and visual attentional network (VAN) in normoxia. 16 Specifically, in normoxia, the memory task evokes a positive BOLD response in the DMN, while the visual detection task evokes a negative BOLD response in the DMN. In contrast, in normoxia, the memory task evokes a negative BOLD response in the VAN, while the visual detection task evokes a positive BOLD response 16 in the VAN. For both tasks, the magnitude of activation in these regions is related to performance on the tasks. If reduced baseline neuronal activity is responsible for reductions in rCBF within the DMN, then one would predict either diminished performance in the memory task due to reduced neural efficiency coupled with a reduced positive BOLD response, or normal performance, with an increase in the relative BOLD response during the memory task in hypoxia. This is based on the finding that the relative BOLD response to a task is dependent on the baseline BOLD before task onset. 17 However, if a reversal of neurovascular coupling is responsible for the reduced rCBF at rest in hypoxia, one might predict no change in performance on the memory task, with a reversal of the task-evoked BOLD response, leading to a negative BOLD response in DMN for the memory task, but a positive response to the visual detection task. If this was a global phenomenon, one might also expect a reversal of the BOLD responses to each task within the VAN. If no such reversal is seen in the VAN, this would suggest evidence for a regionally-specific reversal of neurovascular coupling, confined to the DMN, highlighting the peculiar metabolic and neurovascular characteristics of this network.
Methods
Participants
Twenty-four healthy adults (17 males) were recruited into the study (mean (SD); age, 23 (2) years; height, 177 (9) cm; body mass, 75.4 (13.3) kg; education, 18 (2) years). Participants had not traveled to altitude (≥ 1500 m) in the preceding six months and had no medical contraindications. Female participants were studied during the early follicular phase of their cycle, or the placebo phase of oral contraceptives. All participants provided written informed consent. Ethical approval was granted by the Ethics Committee of the School of Sport, Health, and Exercise Sciences at Bangor University (Ethics ID: P19-16/17) and the study was performed in accordance with the guidelines of the WMA Declaration of Helsinki (2013).
Study design
The study followed a double-blind, repeated-measures, counterbalanced cross-over design. Experimental sessions were separated by at least five days. Participants completed an encoding and familiarization session for the cognitive tasks the day before each experimental session (see Figure S1). Experimental sessions consisted of 3 h 30 min exposure to normoxia (fraction of inspired oxygen; FIO2 = 0.209) or hypoxia (FIO2 = 0.120). After 2 h, imaging using arterial spin labelling (ASL) to measure resting rCBF and fMRI to measure task-evoked BOLD responses during a paired associate memory task and a motion detection task, was performed. All procedures were performed within 50 m of sea level.
Procedures
Experimental protocol
A schematic representation of the experimental session procedures is depicted in Figure S1. Participants completed the first 2 h of each session in a temperature and humidity-controlled environmental chamber (Hypoxico Inc.; NY), and the final 1 h 30 min of each session in a 3 T MRI scanner. Throughout transportation to the MRI suite and the MRI scanning procedure, participants wore a leak-free face mask connected to a two-way Hans Rudolph valve with an inspiratory port connected via Falconia tubing to a 1000 L Douglas bag (containing FIO2 = 0.209 or FIO2 = 0.120, dependent on session condition).
Physiological monitoring
Physiological monitoring was conducted throughout the experiment. Specifically, expired carbon dioxide (CO2) was sampled from the face mask for 5 min, during the resting ASL scan within the MRI scanner, and analyzed by a calibrated fast responding gas analyzer (GC-0017 (0–20%) SprintIR CO2 Sensor; GSS, Cumbernauld, UK), and recorded using CO2 logging software (GasLab; CO2Meter, Inc.; Florida, USA). End-tidal CO2 (PETCO2) was calculated from recorded CO2 trace using peak detection software. 18 Heart rate and oxygen saturation (SpO2) were measured at 30 min intervals for the first 2 h. Heart rate was measured using a 3-lead electrocardiogram (ECG) (Acuson X300, Siemens Healthcare GmbH; Erlangen: Germany), and SpO2 was measured using pulse oximetry (9550 OnyxII; Nonin Medical Inc., Minnesota).
Cognitive tasks
All cognitive task paradigms were written in Octave, using PsychToolbox 3.19,20
The day before each experimental session, participants completed an encoding session, where they were presented with two lists of images each containing 50 associate pairs of items taken from the Rossion and Pourtois 21 pictorial set, and were asked to commit the pairs to memory. Each list consisted of 25 semantically-related pairs, and 25 semantically-unrelated pairs. Images were presented for 1.5 s each, separated by 0.5 s. To ensure task engagement, participants were asked to provide a rating of the relatedness of the items in each pair on a four-item scale, ranging from “extremely unrelated” to “extremely related”. Items were repeated across the two lists within each session, but were not repeated across the two encoding sessions (one for each experimental session). To enhance learning, participants completed a two-alternative forced choice (2AFC) recall task immediately after studying each list.
During the experimental session, participants were presented with a cue image (for 1.5 s) immediately followed by a second image (for 1.5 s) that was either the associate pair (target) or not (foil). The participant was asked to determine whether the cue and the second image were paired associates. Participants were encouraged to prioritize accuracy over speed. They provided a yes/no judgement as well as rated their confidence (high/low). In each experimental session, participants completed a total of 100 trials, split over 4 runs of 25 trials each, with jittered inter-trial intervals (ITIs) of 4, 6 or 8 s.
During the encoding session, the participants also practiced the motion detection task until they achieved a minimum of 80% detection accuracy. Each trial began with the presentation of an arrow cue indicating which two of four quadrants to direct attention to, followed by motion stimuli consisting of four random dot kinematograms (RDK) 8 s long. In each RDK, 72 white dots with a diameter of 0.062° (visual angle) were presented on a black background, randomly positioned within a 3.41° circular aperture. Dynamic noise was produced by randomly replotting the dots every 12 frames. In 27% of trials, one of the circular patches contained a brief (500 ms) interval of coherent expanding motion, occurring either early (0.77 s after stimulus onset), middle (3.77 s), or late (6.77 s) in the trial. Coherent divergent motion was produced by radially translating 100% of the dots each frame (speed = 0.0002° per frame) during the expansion phase. Participants maintained fixation on a central crosshair throughout the trial and pressed a response button using their left thumb when they detected coherent motion (target). In each experimental session, participants completed a total of 114 trials, split over 3 runs of 38 trials each, with jittered ITIs that were either 4, 6 or 8 s.
Anatomical MRI
All MRI sequences were conducted on a 3 Tesla MRI scanner (Achieva; Philips Medical) using a 32-channel head coil. T1-weighted anatomical image scans were acquired in the middle of the cognitive test battery in normoxia and hypoxia experimental sessions. High resolution T1-weighted images were acquired as a five echo MP-RAGE sequence (TE = 3.5, 10.5, 20.5, 30.5, 40.5 ms; TR = 45 ms, TI = 1150 ms; 3D acquisition; field-of-view = 225 mm × 225 mm × 175 mm; voxel dimensions = 1 × 1 × 1 mm3, SENSE = 2). The five echoes were then averaged to produce a single image used for registration of the CBF and fMRI scans.
Baseline regional cerebral blood flow
To measure baseline rCBF, ASL images were acquired between the two arms of the cognitive test battery (memory and detection) in normoxia and hypoxia in 22 of the participants. ASL images were acquired using the standard single-phase pulsed ASL package provided with the scanner. Labeling of inflowing blood was achieved through a parallel slab applied 20 mm below the acquisition slices (slab thickness 100 mm, post label delay 1600 ms, SENSE 2) without background suppression or use of a QUIPSS II modification to temporally define the bolus duration. Each scan consisted of 12 slices at 2 × 2 mm2 in-plane resolution with 256 mm × 256 mm field-of-view and 6 mm slice thickness aligned perpendicular to the Z-axis of the scanner. Slices were acquired as tagged and control pairs with a TR of 3 s, TE of 15 ms, and 40 averages, giving a scan time of ∼4 min. Image analysis was performed using the FMRIB Software Library (FSL) v6.0.1. T1 weighted images were brain extracted using BET 22 then segmented using FAST. 23 ASL data were analyzed using BASIL, 24 assuming a blood T1 of 1.66 s in normoxia 25 with a change to 1.61 s in hypoxia25,26 due to the reduced O2 saturation, and the automatic estimation of bolus duration option was applied. The CBF maps produced by BASIL were registered to the T1-weighted anatomical images, masked with the grey matter image from the T1 segmentation, and registered to the “Montreal Neurological Institute (MNI) 2 mm” T1-weighted average image. 27
Task-evoked BOLD responses
To measure the task-evoked activations and deactivations, BOLD contrast functional images were acquired using an echo-planar sequence (TR = 2000 ms; TE = 30 ms; flip angle = 90°; 3 mm axial slices; 3 × 3 mm2 in-plane resolution, with a 256 mm × 256 mm FOV, 36 slices, SENSE = 2) in all 24 participants. BOLD images were motion-corrected within and between runs, corrected for across-slice timing differences, resampled into 2 mm3 isotropic voxels, and registered to the high-resolution anatomical image before being warped into a standardized atlas space (MNI). 27
Statistical analysis
CBF comparisons between conditions
A paired samples T-Test for CBF changes between normoxia and hypoxia was performed in RANDOMISE 28 (cluster mass FWE correction at p < 0.05). The mean rCBF was also extracted from each seed Regions of Interest (ROIs) used in the task-based analysis below (see Table 1). Five of 44 scans were excluded from the ASL analysis due to poor image quality. One was removed due to movement issues during the normoxia scans, two due to failures of the ASL analysis pipeline for the normoxia data (registration on one, calibration failure on the other), and two due to artefacts in the hypoxia data. Although only 5 of 44 scans have been removed, due to the paired nature of the data, this led to removal of 5 participants from the final data set. Note the distribution of removed scans across both normoxia and hypoxia conditions reduces the risk of a bias in the results.
Region of interest (ROI) seed coordinates.
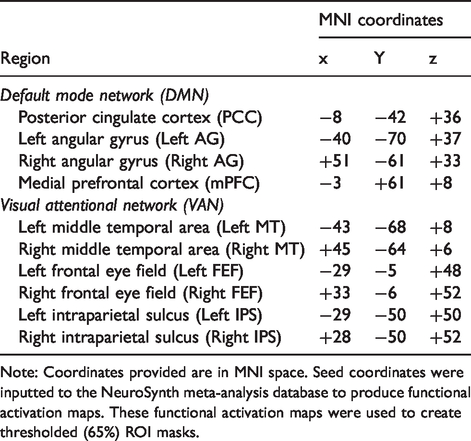
Note: Coordinates provided are in MNI space. Seed coordinates were inputted to the NeuroSynth meta-analysis database to produce functional activation maps. These functional activation maps were used to create thresholded (65%) ROI masks.
BOLD general linear model
Memory search was assumed to start after the presentation of the second image, and finish when the participant responded. A GLM that used an assumed hemodynamic response function provided separate voxel-wise maps of the BOLD activity associated with each cognitive process within the two tasks. Cognitive processes included in the memory task GLM were: memory search (hit), memory search (miss), memory search (correct rejection), memory search (false alarm), stimulus 1 presentation, stimulus 2 presentation, and button press. Cognitive processes included in the motion detection task GLM were: visual search (hit), visual search (miss), visual search (correct rejection), visual search (false alarm), visual stimulation, target presentation (hit), target presentation (miss), and cue presentation.
Results presented for the memory task represent the memory search-evoked activations, determined during the memory task by modelling regressors for the time between stimulus presentation and the response on hit trials. Results presented for the detection task represent visual search activations, determined by modelling regressors from stimulus onset to target detection on hit trials. Visual stimulation-evoked activations were determined during the motion detection task with a regressor associated with those periods when participants were watching the dots move throughout the entire visual stimulus, rather than isolated until the detection response. In this manner, memory, detection, and visual stimulation were modeled against the other task processes, which were included as regressors of no interest.
First-level GLM analyses of individual runs were run using the FSL FMRI Expert Analysis Tool (FEAT), 29 followed by a second-level analysis using FSL’s fixed effects (FE) model with one contrast per participant to analyze the within-subject repeated measure. Finally, we conducted third-level analyses on the individual participant contrast of parameter estimates (COPEs) using FMRIB’s Local Analysis of Mixed Effects (FLAME) model to determine group-level activations and deactivations during normoxia and hypoxia conditions separately, and the differences between the conditions. 30
Peak difference locations between normoxia and hypoxia were identified based on a FWE-corrected voxel-wise analyses (p < 0.01) on group-level difference maps, using the approach outlined by Maumet and Nichols. 31 Minimum distance between peaks was set at 12 mm. The cluster analyses were thresholded at Z = 2.5 with only peaks of Z > 3.0 reported.
Region of interest analyses
Peak activations from normoxia maps of the memory and motion detection tasks were used to identify seed coordinates for key regions of the DMN and VAN, respectively. The MNI coordinates from these key regions were inputted to the NeuroSynth database (www.neurosynth.org)32–34 to create a functional connectivity map for each seed coordinate. ROI masks were created by implementing a threshold of 65% on the functional connectivity maps. DMN ROI’s included the posterior cingulate cortex (PCC); left and right angular gyri (left and right AG); and the medial prefrontal cortex (mPFC). VAN ROI’s included left and right middle temporal areas (left and right MT); left and right frontal eye fields (left and right FEF); and the left and right intraparietal sulci (left and right IPS). MNI coordinates for each ROI can be found in Table 1.
Regional CBF in the PCC ROI was calculated as the mean rCBF from the PCC ROI mask. BOLD fMRI responses in each ROI were calculated as the signal change in the functional maps for the ROI masks.
Results
Exposure to 12% O2 induced hypoxemia, hypocapnia, and increased heart rate
Twenty-four healthy adults (17 males) were exposed to a total of 3 h 30 min normoxia (fraction of inspired oxygen; FIO2 = 0.209), and 3 h 30 min of hypoxia (FIO2 = 0.120), with MRI acquisition conducted in the final 90 min (2 h 0 min–3 h 30 min; Figure S1). Participants completed the normoxia and hypoxia exposures in a randomized, counterbalanced order, with a minimum five-day washout between exposures. Normobaric hypoxia decreased oxygen saturations (SpO2) compared to normoxia by 18% (95% CI: [−20, −16]; p < 0.001), increased heart rate by 13 bpm (95% CI: [7, 18]; p < 0.001), and decreased end-tidal carbon dioxide (PETCO2) by 4 mmHg (95%CI [−5, −2]; p < 0.001).
Hypoxia decreased baseline rCBF within the DMN
ASL-based measures of baseline rCBF in normobaric hypoxia show that while rCBF increased in most cortical regions (Figure 1, red/yellow; cluster-based corrections: p < 0.05), it decreased rCBF in the precuneus (PCUN), the left and right AG, and the PCC (Figure 1, blue/light blue; p < 0.05). The first main finding of this study therefore suggests that posterior nodes of the DMN deviated from changes in rCBF observed in the rest of the cortical mantle.
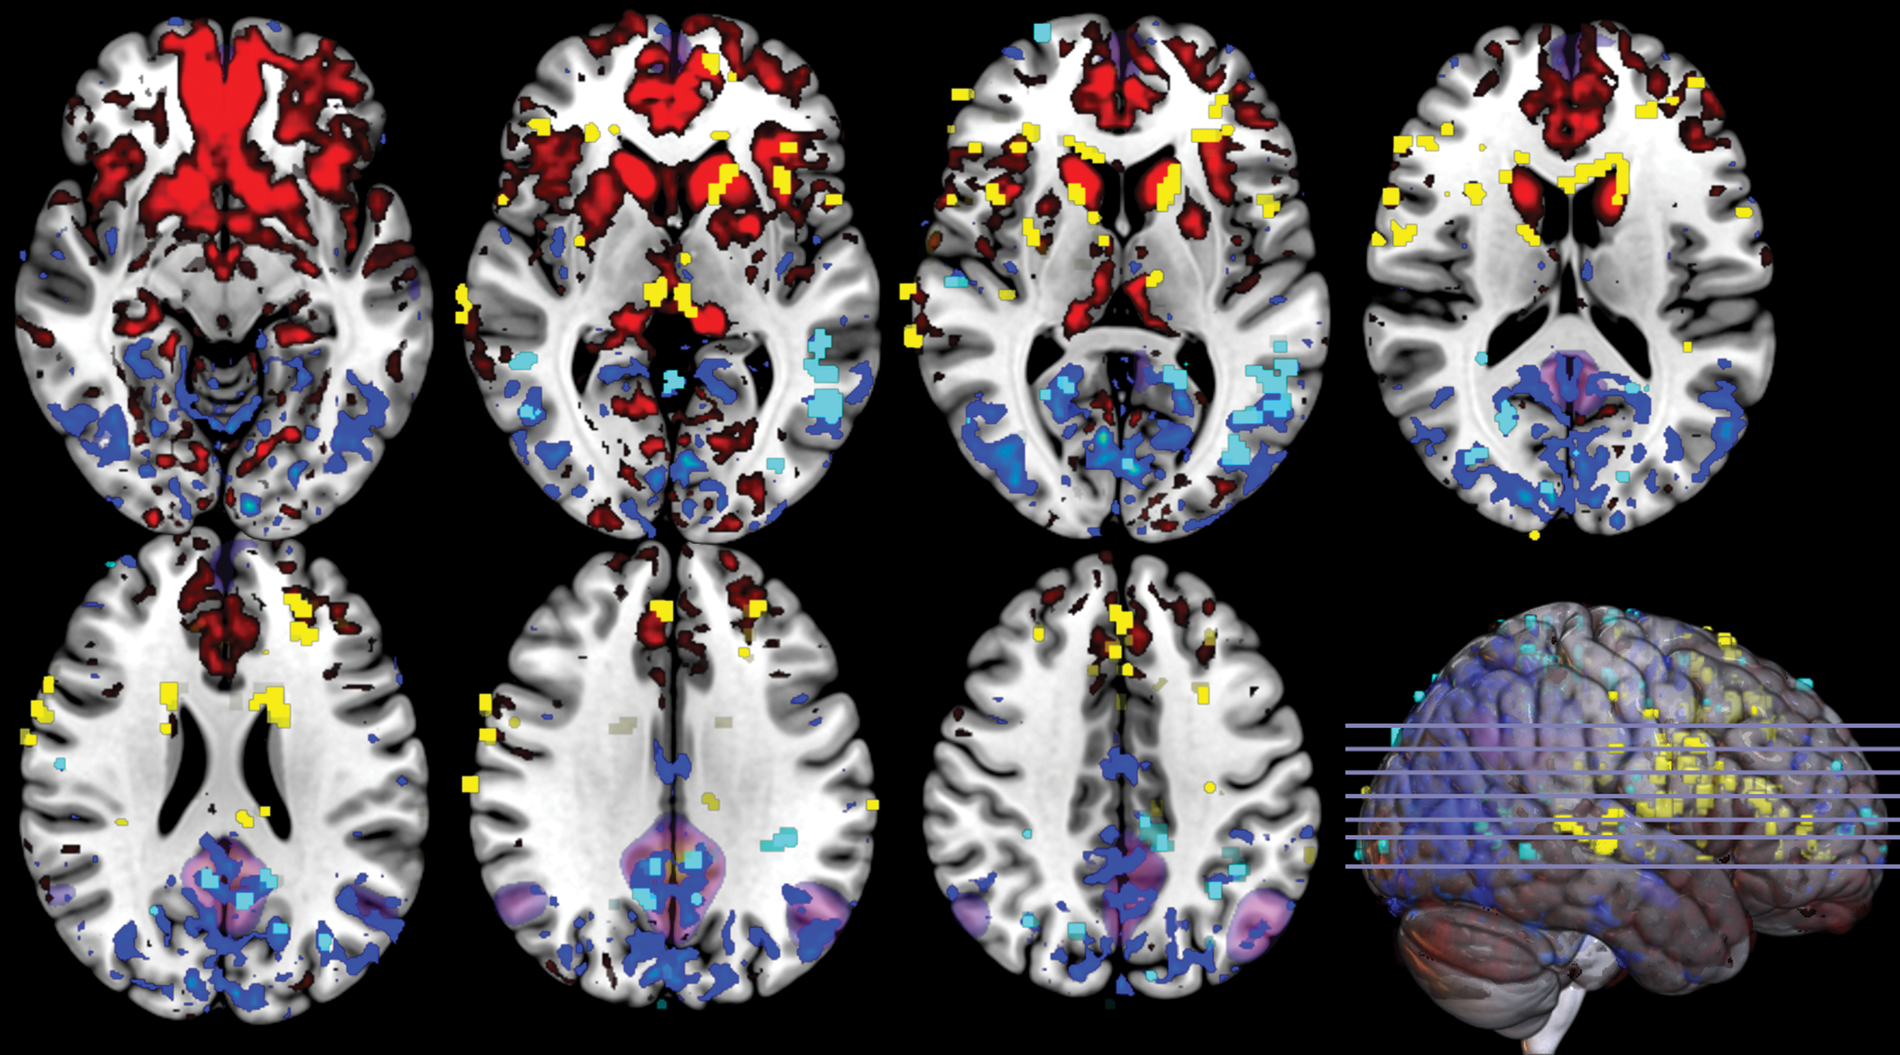
Hypoxia decreases baseline rCBF within the DMN. Significant clusters of decreases (light blue) and increases (yellow) in baseline regional cerebral blood flow (rCBF) in hypoxia, compared to normoxia determined using the RANDOMISE tool in FSL (setting cluster-based FWE corrections at p < 0.05). Significant clusters are overlaid on mean CBF changes (decreases in blue, increases in red), reflecting absolute rCBF differences between normoxia and hypoxia. The DMN is highlighted in purple.
As differences in arterial blood gases are known to affect rCBF, we examined the relationships of hypocapnia and hypoxemia with local changes in rCBF in the PCC across participants (Figure 2). Individual differences in PETCO2 did not correlate with the magnitude of rCBF reductions (r = −0.19; p = 0.5; Figure 2(a)). In contrast, individual differences in SPO2 tended to correlate (at the p < 0.1 level) with the magnitude of rCBF reductions (r = 0.47; p = 0.057; Figure 2(b)). Combined, this implicates hypoxemia as the more likely driver of the rCBF reductions, not hyperventilation-induced hypocapnia. The magnitude of rCBF changes in the VAN did not correlate with either PETCO2 (r = −0.29; p = 0.3; Figure 2(c)), or SPO2 (r = 0.36; p = 0.2; Figure 2(d)).
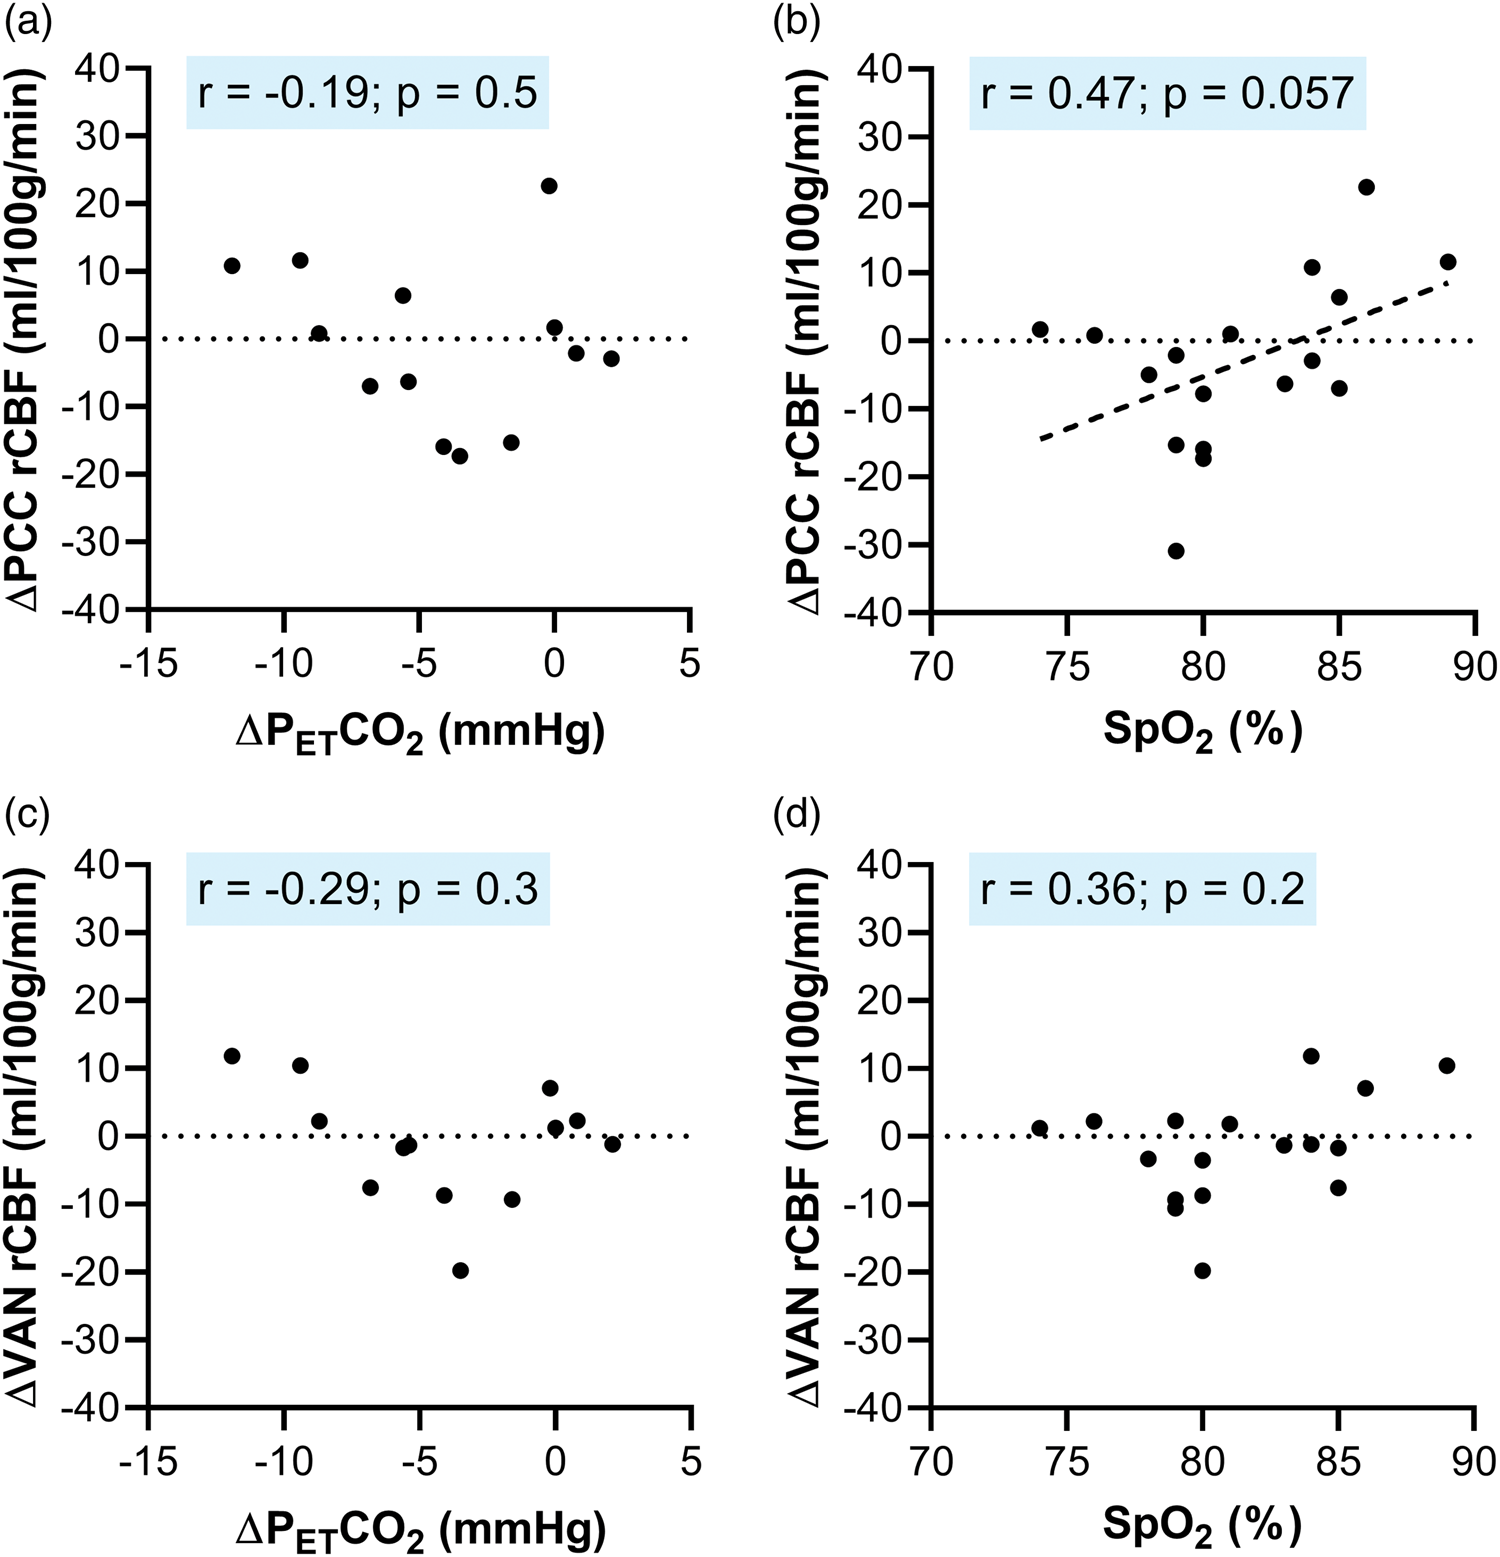
Hypoxemia (not hypocapnia) may drive reductions in rCBF during hypoxia. Panel A displays the relationship between end-tidal carbon dioxide (PETCO2) and regional cerebral blood flow (rCBF) in the PCC. Panel B displays the relationship between oxygen saturations (SpO2) and rCBF in the PCC. Panel C displays the relationship between PETCO2 and rCBF in the visual attentional network (VAN). Panel D displays the relationship between SpO2 and rCBF in the VAN. Each data point is a participant; four participants were excluded from the PETCO2 analysis due to recorded CO2 traces without identifiable peaks.
Task performances were not different between normoxia and hypoxia
Participants completed two tasks in the scanner; a paired associate memory task and a motion detection task. Hypoxia had no appreciable effect on performance in either task (Table 2). Performance was neither at ceiling nor floor in either environmental condition.
Hypoxia does not alter cognitive task performance.
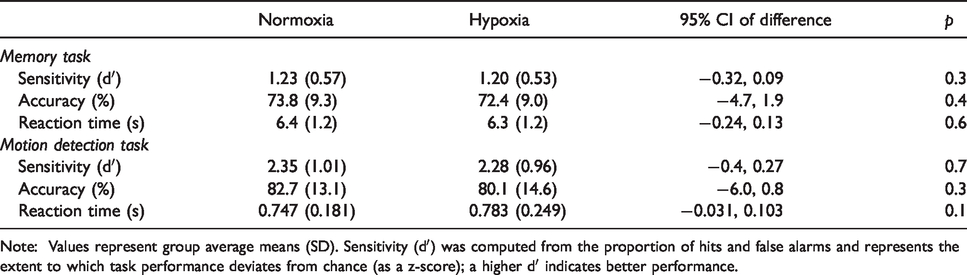
Note: Values represent group average means (SD). Sensitivity (dʹ) was computed from the proportion of hits and false alarms and represents the extent to which task performance deviates from chance (as a z-score); a higher dʹ indicates better performance.
In normoxia the tasks evoked opposing BOLD responses in the DMN and VAN
To gain insight into the mechanism underlying baseline rCBF reductions observed in the DMN, we measured task-evoked BOLD signals in normoxia and hypoxia during two differing tasks. The first, a paired associate memory task, is known to evoke positive BOLD responses in the DMN. The second, a motion detection task, is known to evoke negative BOLD responses in the DMN. These tasks also evoke the diametrically opposite BOLD responses within the VAN (outside the DMN), whereby the memory task evokes a negative BOLD response, and the detection task evokes a positive BOLD response.16,35
As expected, in normoxia, both the positive and negative BOLD responses evoked by the memory and detection task localized to regions previously reported to be recruited during similar tasks.16,35,36 Specifically, during the memory task, positive BOLD responses were observed in posterior regions of the DMN, including the PCC and left AG (Figures 3(a), and 4(b)), while negative BOLD responses were seen in the VAN (Figures 3(a) and 5(b)). In contrast, BOLD responses were reversed during the detection task, with positive BOLD responses observed in the VAN, including the left and right middle temporal areas (MT), left and right frontal eye fields (FEF), and left and right intraparietal sulci (IPS; Figures 3(b) and 5(d)), while negative BOLD responses were seen in the DMN including the PCC and left and right AG (Figure 3(b) and 4(d)). Other regions of activations and deactivations found were comparable to those reported in previous studies16,35 (all activations and deactivations are presented in Figure 3).
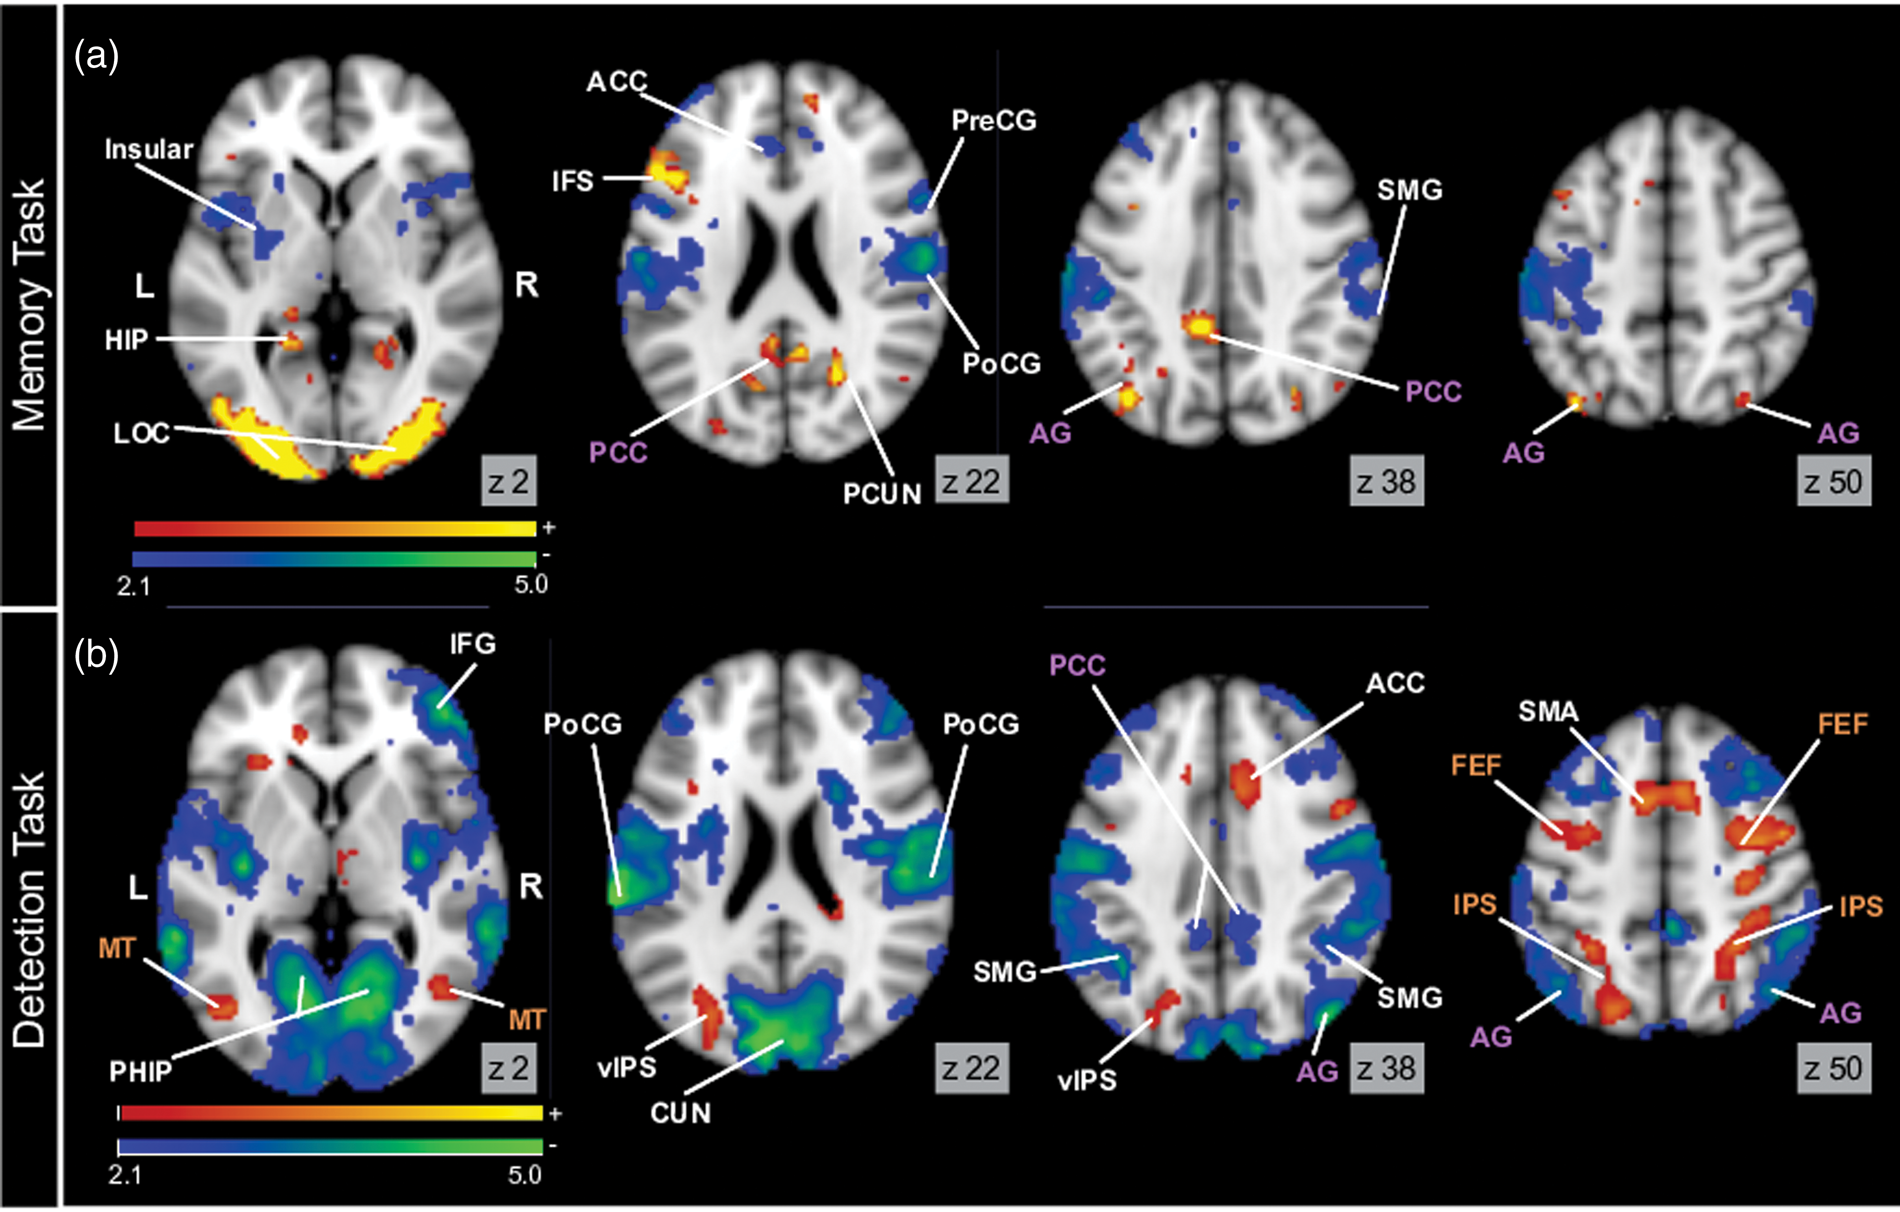
In normoxia, opposite hemodynamic responses are found in the default mode network (DMN) and visual attentional network (VAN) during the memory and detection tasks. Panel A displays memory-evoked activations (warm colors) and deactivations (cold colors). Panel B displays detection-evoked activations (warm colors) and deactivations (cold colors). Purple labels indicate regions of the DMN, brown labels indicate regions of the VAN. All activation maps are corrected for multiple comparisons and display significant voxels at p < 0.05.
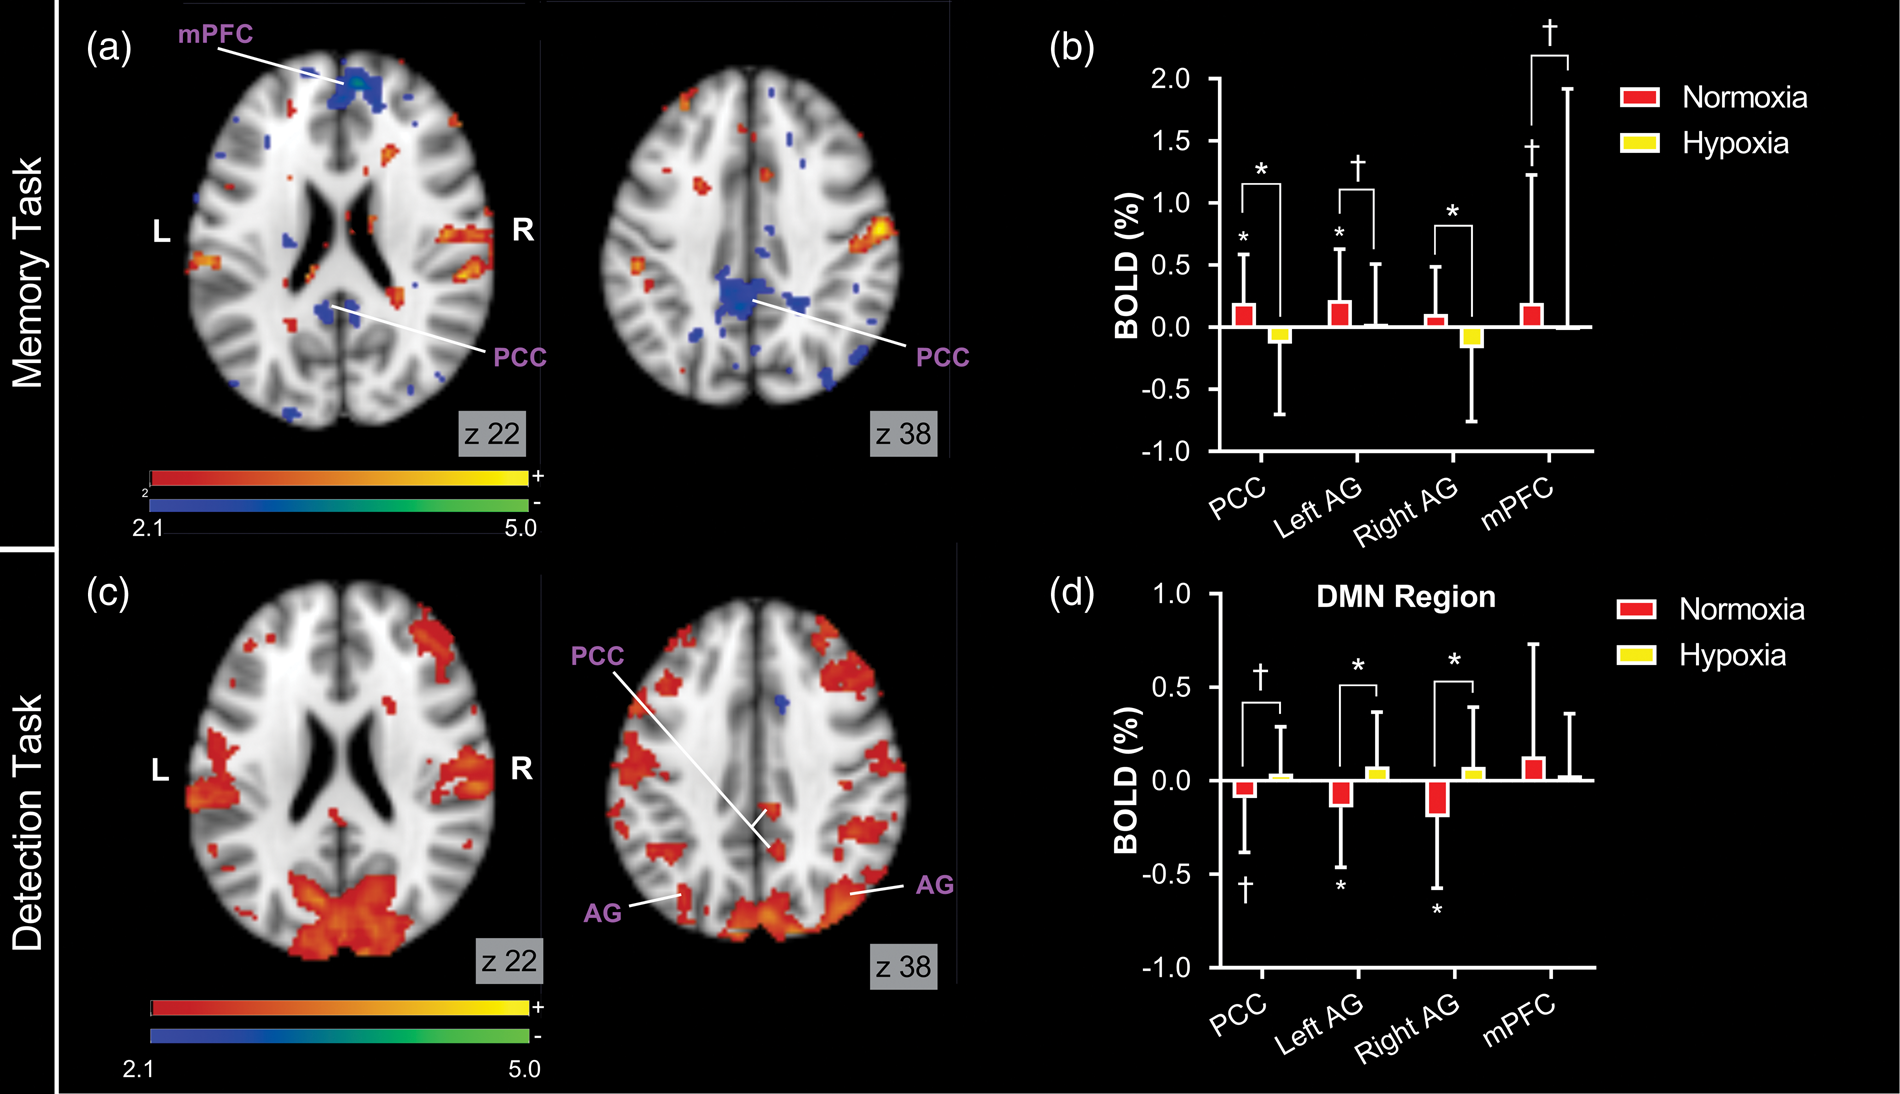
Hypoxia reverses hemodynamic responses in the default mode network (DMN). Panel A displays the contrast map for the difference between memory-evoked activations in normoxia and hypoxia and Panel B displays memory-evoked BOLD responses in DMN regions of interest (ROIs). Panel C displays the contrast map for the difference between detection-evoked activations and Panel D displays detection-evoked BOLD responses in the DMN ROIs. For contrast maps, warm colored areas indicate regions with significantly increased activations in hypoxia, cold colored areas indicate regions with significantly decreased activations in hypoxia. All activation maps are corrected for multiple comparisons and display significant voxels at p < 0.05.
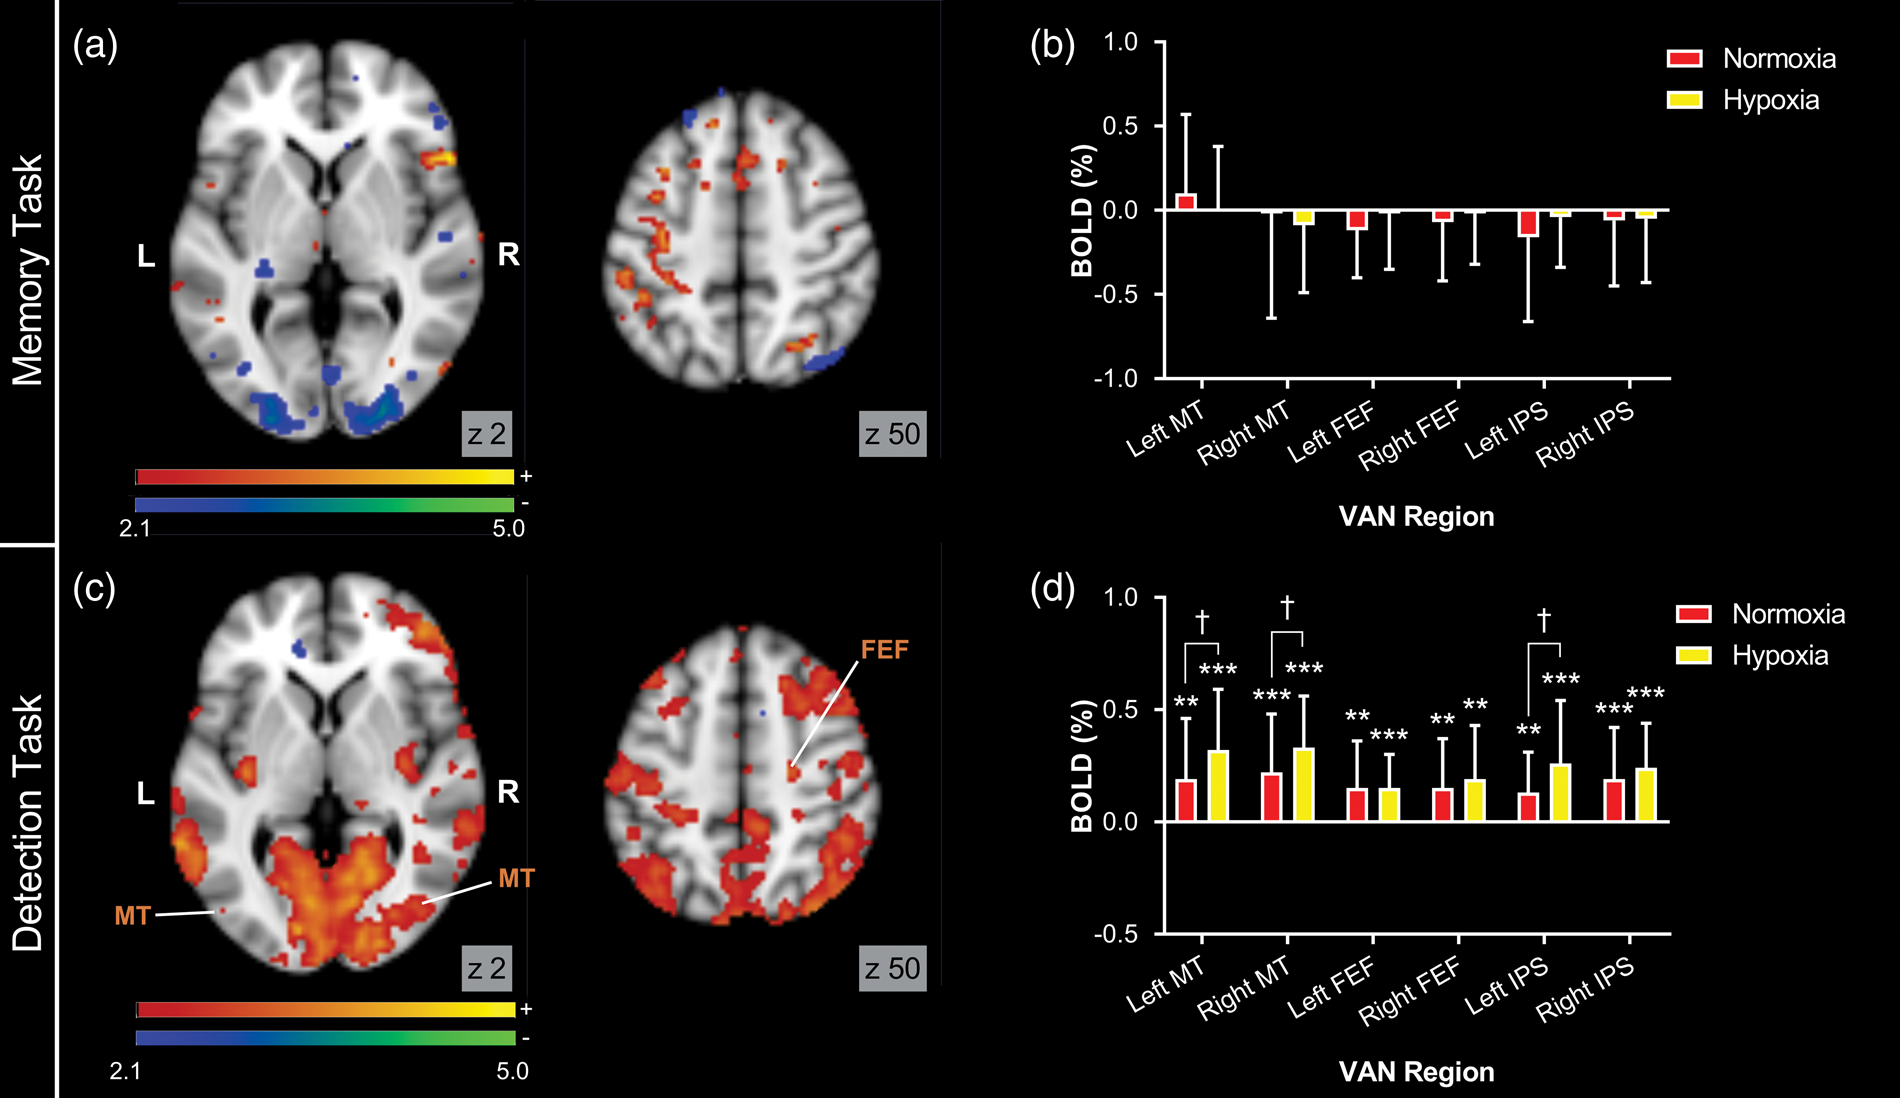
Hypoxia increases the positive hemodynamic response in the visual attentional network (VAN). Panel A displays the contrast map for the difference between memory-evoked activations in normoxia and hypoxia and Panel B displays memory-evoked BOLD responses in VAN regions of interest (ROIs). Panel C displays the contrast map for the difference between detection-evoked activations and Panel D displays detection-evoked BOLD responses in the VAN ROIs. For contrast maps, warm colored areas indicate regions with significantly increased activations in hypoxia, cold colored areas indicate regions with significantly decreased activations in hypoxia. All activation maps are corrected for multiple comparisons and display significant voxels at p < 0.05.
Hypoxia reversed BOLD responses in the DMN
Hypoxia had a significant effect on task-evoked BOLD in specific brain regions (see Tables S1 and S2 for peak coordinates). During hypoxia, negative BOLD responses were observed during the memory task in posterior regions of the DMN (Figure 4(a)). In these same regions, positive BOLD responses were observed during the detection task (Figure 4(c)). These patterns of BOLD responses are opposite to those observed in normoxia (Figure 3). This finding of a negative instead of a positive BOLD response for the memory task, and a positive instead of a negative BOLD response for the visual detection task within the DMN therefore supports a reversal of neurovascular coupling within this network during hypoxia.
Peak activations from normoxia maps of the memory task were used to identify seed coordinates for ROI masks for key regions of the DMN (see Methods; Statistical analysis). ROI-based analyses for the memory task further demonstrate reversed BOLD responses during hypoxia (Figure 4(b)), with negative BOLD seen in the PCC (normoxia = 0.20 ± 0.09; hypoxia = −0.13 ± 0.13; p = 0.02) and right AG (normoxia = 0.11 ± 0.09; hypoxia = −0.17 ± 0.13; p = 0.04). Negative BOLD responses were also seen in the left AG (normoxia = 0.22 ± 0.09; hypoxia = 0.03 ± 0.11; p = 0.09) and mPFC (normoxia = 0.20 ± 0.20; hypoxia = 0.01 ± 0.17; p = 0.07) at a trend level (p < 0.1).
Similarly, ROI analyses for the detection task further confirm a reversal of the BOLD response in the DMN during hypoxia (Figure 4(d)). Specifically, significantly increased BOLD responses were found in both the left (normoxia = −0.14 ± 0.07; hypoxia = 0.08 ± 0.07; p = 0.02) and right AG (normoxia = −0.19 ± 0.09; hypoxia = 0.07 ± 0.07; p = 0.01). A similar trend was found in the PCC (normoxia = −0.09 ± 0.07; hypoxia = 0.04 ± 0.06; p = 0.07). Interestingly, the only DMN region that did not show this trend was the mPFC, which was also the only region where hypoxia did not significantly decrease baseline rCBF (see Figure 1), although the coverage of this area was limited in our ASL analysis, so the mPFC finding should be considered with caution.
Hypoxia increased positive BOLD responses in the VAN
While hypoxia did not affect the amplitude of memory-evoked negative BOLD responses in the VAN (Figure 5(a)), it did increase the amplitude of detection-evoked positive BOLD responses in the VAN, specifically in the MT and FEF regions (Figure 5(c)).
Peak activations from normoxia maps of the detection task were used to identify seed coordinates for ROI masks for key regions of the VAN (see Methods; Statistical analysis). ROI-based analyses of BOLD responses to the memory task revealed no differences between normoxia and hypoxia in regions of the VAN, including MT, FEF, and IPS (Figure 5(b)). This suggests that reversal of neurovascular coupling does not extend to the VAN.
ROI-based analyses confirmed that hypoxia tended to increase detection-evoked positive activations in the left MT (normoxia = 0.19 ± 0.06; hypoxia = 0.32 ± 0.06; p = 0.08), right MT (normoxia = 0.22 ± 0.06; hypoxia = 0.33 ± 0.05; p = 0.08), and left IPS (normoxia = 0.13 ± 0.04; hypoxia = 0.26 ± 0.07; p = 0.06) regions of the VAN (Figure 5(d)). However, hypoxia had no effect on detection-evoked activations in the left FEF (normoxia = 0.15 ± 0.05; hypoxia = 0.15 ± 0.03; p = 0.5), right FEF (normoxia = 0.15 ± 0.05; hypoxia = 0.19 ± 0.05; p = 0.3), or right IPS (normoxia = 0.19 ± 0.05; hypoxia = 0.24 ± .04; p = 0.3).
BOLD responses to visual stimuli in the visual cortex were not different between normoxia and hypoxia
Visual stimulation evoked highly overlapping activations within the visual cortex during normoxia and hypoxia. Figure S2 shows the regions of significant visually evoked BOLD responses during normoxia (Figure S2(a)) and hypoxia (Figure S2(b)), and the tight overlap between the two activation maps (Figure S2(c)). ROI-based analyses within the region of overlap confirmed hypoxia had no effect on the magnitude of the visually-evoked activation (normoxia = 0.63 ± 0.33%; hypoxia = 0.55 ± 0.31%; p = 0.4; Figure S2(d)).
Discussion
This rigorous study is the first to show a reversal of neurovascular coupling in the healthy human brain. The principle findings of this study were that: (1) hypoxia induced a reduction in baseline rCBF in posterior regions of the DMN (Figure 1); (2) hypoxia did not affect task performance (Table 2); (3) hypoxia lead to a reversal of both positive and negative task-evoked BOLD responses in posterior regions of the DMN (Figure 4); and (4) hemodynamic responses outside the DMN were not reversed by hypoxia (Figures 5 and S2).
This is the first study to capture the specific regional effects of hypoxia on rCBF across the entirety of the cerebral cortex (Figure 1). The finding that the DMN regions show decreased rCBF during hypoxia, in contrast to widespread increases in rCBF to most of the rest of the brain, re-enforces the heterogeneity of rCBF response to hypoxia. Interestingly, this response correlated more strongly with oxygen saturation than hypocapnia. One potential implication of this finding is hypoxia-induced vasoconstriction in the DMN reflects the presence of oxygen-sensitive factors in the vascular endothelium of these regions, akin to well-established mechanisms of hypoxic pulmonary vasoconstriction.37–39 This would imply the hypoxia-induced reduction in rCBF is a purely vascular effect and is not related to a change in neuronal activity. An alternative hypothesis is that this reduced rCBF reflects a decrease in neuronal activity in the DMN regions during hypoxia. This would be similar to commonly observed deactivations seen in the DMN during processing of environmental stimuli. 40 A third, more intriguing, possibility is that this reduction in rCBF reflects a change in the mechanism of neurovascular coupling, without any change in neuronal activity, as commented upon by Hayes and Huxtable. 41
We did not observe any appreciable difference in memory or detection performance between normoxia and hypoxia (Table 2). Since previous studies have clearly demonstrated a direct relationship between positive BOLD responses in these regions and performance on memory tasks, and negative BOLD responses in these regions and performance on detection tasks,16,35 this maintenance of performance on both tasks provides a strong indication that the tasks evoked comparable neural activities under both environmental conditions. However, task-evoked BOLD responses were affected by hypoxia. In particular, the posterior regions of the DMN that showed positive BOLD responses during memory search in normoxia showed negative BOLD responses in hypoxia (Figure 4). Importantly, those same regions showed negative BOLD responses during the detection task in normoxia, but positive BOLD responses during the motion detection task in hypoxia. The reversal of the BOLD response in DMN regions in hypoxia, without a decrement in task performance, is hard to account for unless neurovascular coupling is affected by hypoxia. If neurovascular coupling was unaffected, then decreased BOLD responses should reflect decreased neuronal activity.42,43 However, if task-evoked neuronal activity is decreased during hypoxia in regions associated with task performance,16,35 then we should have observed a decrement in task performance, which is contrary to our findings. We cannot rule out that a change in behavioral strategies underpins preserved task performance in hypoxia; however, this would imply reorganization of the networks involved in these two tasks, and compensatory increases in activity in other cerebral networks. During the paired associate memory task, we did not observe increased BOLD signals anywhere in the brain, making the suggestion of a large-scale reorganization of task-related neuronal activity unlikely.
Negative BOLD responses by themselves do not necessarily reflect a reduction in neuronal activity. For example, the work of Hoge et al. 44 and Zappe et al. 45 shows that when the vasculature is dilated at baseline (during hypercapnia), increases in neuronal activity no longer augment local CBF (because of mechanical limitations to additional vasodilation), leading to reductions in the BOLD signal because of increased CMRO2. Similarly, Siero et al. 46 experimentally dilated the vasculature of patients with vertebrobasilar steno-occlusive disease using acetazolamide, and observed reduced or negative BOLD despite maintained hyperemia, showing that vasculature compliance influences the BOLD response. However, all of these accounts would predict the exact opposite of what we observed. Namely, reduced or negative task-evoked BOLD responses should be observed in regions that experience increases in rCBF at rest during hypoxia. In contrast, we observed negative task-evoked BOLD responses in regions with decreased rCBF at rest, with slightly increased task-evoked BOLD responses generated in the regions that did not experience decreased rCBF at rest. Further, vascular reactivity is maintained in the PCC during hypoxia2. Therefore, this suggested vascular compliance limitation is not a driver of the reversal of the BOLD response we see.
This leads us to the conclusion that hypoxia causes a reversal of neurovascular coupling within the DMN. This interpretation is supported by the observation that during early stages of brain development, stimulus-evoked increases in neuronal activity can lead to negative BOLD responses in neonatal rats 47 and human infants.48,49 It has been postulated that the negative BOLD observed in human infants is caused by a greater increase in CMRO2 rather than a decrease in rCBF. 49 This would seem an initially plausible interpretation of our findings, particularly if the decrease in resting rCBF in the DMN reflected a decrease in resting activity. However, this interpretation is unable to explain the positive BOLD response in the DMN during visual search. Additionally, neonates have been shown to exhibit a reversal of the hemodynamic response 48 caused by post-stimulus vasoconstriction of the pial arteries, 47 supporting the interpretation of our data as a decrease in rCBF and a reversal of neurovascular coupling. The physiological mechanism by which the developing brain is able to sustain energy demands without functioning neurovascular coupling is unknown, 50 but it is possible that the DMN is utilising these same mechanisms in hypoxic adults. One possible mechanism is a switch to anaerobic metabolism, but without data directly investigating whether metabolism is predominantly occurring through oxidative or anaerobic pathways, any suggestions would merely be supposition. Future studies using functional proton MRS, with increases in lactate during hypoxia potentially representing an increase in anaerobic metabolism, 51 are required to confirm or refute this hypothesis.
Since the negative BOLD response is an increase in the ratio of deoxyhaemoglobin, it represents a localised hypoxia. Several authors have suggested that localised hypoxia accompanying neuronal activity in the young human brain (from eight months) is a functional process to facilitate location-specific angiogenesis to match the topology of high neuronal activity, through the actions of hypoxia-inducible factors (HIFs).50,52 HIF-1α is increased in glia and neurons after 1-h exposure to hypoxia and continues to increase over subsequent hours. 53 It plays an essential role in the carotid body adaptations to hypoxia, 54 ventilatory acclimatisation, 55 and muscular angiogenesis 56 with chronic hypoxic exposure. The localised hypoxia in the DMN at rest and during a DMN-dependent task may therefore provide an adaptive mechanism to stimulate angiogenesis in this region. The timing of our observation in this study (after 2-3.5 h exposure) is important, and so the changes seen may result from the initiation of some long-term adaptive responses previously uncaptured in the acute hypoxia episodes ( < 1 h) typically investigated by other authors.3,4 Further characterisation of CBF and neurovascular coupling responses during chronic exposure to altitude (days and weeks), and any impacts on vascularisation in these regions is warranted.
The reversal of the BOLD response we observed was specific to the DMN. In fact, hypoxia produced modest increases in activations in the VAN during the detection task (Figure 5), and had no effect on activations in the visual cortex during visual stimulation. This anatomical specificity is particularly important since the DMN is known to have a unique metabolic signature.40,57 For example, the DMN demonstrates unusually high levels of aerobic glycolysis, 57 that is, glucose metabolism in excess of oxidative phosphorylation despite sufficient availability of oxygen. Therefore, the findings of the present study add to the existing evidence that the DMN behaves differently from other cortical regions. 40 In addition to its previously studied unique characteristics, the DMN may be more sensitive to factors that affect CBF responses, such as arterial oxygen saturation. Of particular relevance, these regions are also those most susceptible to neurovascular dysfunction in neurodegenerative diseases. 58 Indeed, CBF decrements of the PCC and PCUN regions precede cognitive impairment in the progression of dementia.59–62 Similarly, while no functional impairment was seen in this study, it is known from studies at altitude, that despite systemic physiological acclimatization, cognitive function progressively declines with chronic exposure in non-high altitude natives.63–65 Further, impaired DMN functional connectivity is reciprocally related to REM sleep duration in mild cognitive impairment and dementia,66,67 suggesting hypoxia-induced impairment in DMN function may also contribute to the pathophysiology of poor REM sleep at altitude. 68 Ultimately, the current study adds to a growing body of evidence that the DMN is mechanistically distinct from other brain networks, with important implications for health and disease in the human brain. The reason for this anatomical specificity however is still unknown and so warrants further investigation. However, the unique neurovascular signaling we observed in the DMN may provide a link between its unique metabolic signature in healthy individuals and the blood flow and metabolic changes that accompany neurodegeneration, making these findings not just interesting, but also clinically relevant.
Conclusions
In conclusion, hypoxia alters rCBF and task-evoked BOLD responses in a region-dependent manner. The regional heterogeneity of CBF and BOLD responses may reflect shared mechanisms, most likely changes in neurovascular coupling or homeostatic regulation. The reduction in rCBF and BOLD responses in the hypoxic condition may be most parsimoniously explained by the suggestion that neurovascular coupling is reversed in hypoxia, and is an extremely novel and unexpected result. This may be particularly pertinent to functional imaging studies in clinical populations characterized by hypoxemia and may enhance understanding of regional specificity in neurodegenerative disease pathology.
Supplemental Material
sj-pdf-1-jcb-10.1177_0271678X20930827 - Supplemental material for Reversal of neurovascular coupling in the default mode network: Evidence from hypoxia
Supplemental material, sj-pdf-1-jcb-10.1177_0271678X20930827 for Reversal of neurovascular coupling in the default mode network: Evidence from hypoxia by Gabriella MK Rossetti, Giovanni d’Avossa, Matthew Rogan, Jamie H Macdonald, Samuel J Oliver and Paul G Mullins in Journal of Cerebral Blood Flow & Metabolism
Footnotes
Funding
The author(s) received no financial support for the research, authorship, and/or publication of this article.
Declaration of conflicting interests
The author(s) declared no potential conflicts of interest with respect to the research, authorship, and/or publication of this article.
Authors’ contributions
Designed Research, GMKR, GD, JHM, SJO, and PGM.
Performed Research, GMKR, MR, and PGM.
Analyzed Data, GMKR, MR, and PGM.
Writing - Original Draft, GMKR.
Writing - Review and Edit, GMKR, GD, MR, JHM, SJO, and PGM.
Supplemental material
Supplemental material for this article is available online.
References
Supplementary Material
Please find the following supplemental material available below.
For Open Access articles published under a Creative Commons License, all supplemental material carries the same license as the article it is associated with.
For non-Open Access articles published, all supplemental material carries a non-exclusive license, and permission requests for re-use of supplemental material or any part of supplemental material shall be sent directly to the copyright owner as specified in the copyright notice associated with the article.